Embed Size (px)
Citation preview

Mindray Medical International LimitedCorporate PresentationCorporate PresentationNovember 2011

DisclaimerThis material contains "forward‐looking statements" within the meaning of the safe harbor provisions of the U. S. Private Securities Litigation Reform Act of 1995. Statements contained herein and in our third quarter 2011 earnings press release that are not historical facts, including without limitation, statements about Mindray's anticipated net revenues, non‐GAAP net income and capital expenditure for 2011, our assumption of a corporate income tax rate of 15% applicable to the Shenzhen subsidiary, our favorable hospital and government spending assumption of a corporate income tax rate of 15% applicable to the Shenzhen subsidiary, our favorable hospital and government spending trends in areas where we have major presence, that we will continue to work hard to aggressively increase our market penetrationworldwide, Mindray’s long‐term growth prospects, our commitment to increasing value for our shareholders, that we continue to actively seek opportunities that could bring complementary technologies and/or products to our company, our confidence that Mindray is well‐positioned for future growth and expansion in the global market, the fast growing China market, our long‐term focus on growth, profitabilitypositioned for future growth and expansion in the global market, the fast growing China market, our long term focus on growth, profitability and cash generation, 2011 new products pipeline for our patient monitoring and life support, in‐vitro diagnostics and medical imaging systems product lines, our company priorities for 2011, the investment highlights and proven product development capabilities for the year 2011 and onward, and the macro environment and growth catalysts in China, are forward‐looking statements. Forward‐looking statements represent only the company's beliefs and predictions regarding future events many of which by their nature are inherently uncertain andrepresent only the company s beliefs and predictions regarding future events, many of which, by their nature, are inherently uncertain and outside of the company's control. Our actual results and financial condition and other circumstances may differ materially from the anticipated results and financial condition indicated in these forward‐looking statements due to a variety of risk, uncertainties and factors. For a discussion of some of the important risks, uncertainties and factors that could adversely affect our business, financial condition, results of operations and prospects see "Risk Factors" beginning on page 4 of our annual report on Form 20‐F for the fiscal year ended December 31operations and prospects, see Risk Factors beginning on page 4 of our annual report on Form 20‐F for the fiscal year ended December 31, 2010.
The financial information contained in these materials should be read in conjunction with the consolidated financial statements and notes thereto included in our public filings with the Securities and Exchange Commission. Our past results of operations are not necessarily p g g p p yindicative of our operating results for any future periods. Any projections in this release are based only on limited information currently available to us, which is subject to change.
Although such projections and the factors influencing them will likely change, we will not necessarily update the information. Such information speaks only as of the date of this release and presentation. Mindray disclaims any intention or obligation to update or revise any forward‐looking statements, whether as a result of new information, future events or otherwise, except as required by law.
1

Who We Are
Mindray is a leading developer manufacturer and marketer of medicalMindray is a leading developer, manufacturer and marketer of medical
devices worldwide, creating value and driving growth through:
Meeting the needs of hospitals and health systems in various geographies around the worldgeographies around the world
Constant innovation driven by a yvertically integrated business model and a world class R&D operation
A global player, with established l d hi iti i th f t ileadership position in the fast growing China market
2

A Global Pla er in Medical TechnologiesA Global Player in Medical Technologies
Revenue Growth and Breakdown by Region
2003 T t l R
Oth
2003 Total Revenues: US$ 59mm
2010 Total Revenues: US$ 704mm
Others1%
EmergingMarket
Others5%Emerging
M k t 12% Market32%
China42%
Market 12%
DevelopedMarket
China 42%8%China75%
Developed Market25%
3

Investment Highlights: Proven Product Development Capabilities
Patient Monitoring & Life Support Products
In‐Vitro Diagnostic Products Medical Imaging Systems
g g p p
ppSupport Products
us$)
us$)
us$)
Other life support products
Infusion Pump
Urine Analysis: 1B
Immunoassay & reagent: 10.5B
5‐Part Hematology & reagent: 1.1B
Digital Radiography: 1.1B
Defibrillator & Surgical Beds and Lights:1.5B
e Market Size (u
e Market Size (u
e Market Size (Infusion Pump
& Syringe Pump: 1B Magnetic Resonance Imaging : 3B
3‐part Hematology
1998 2001 2006 2011
3‐Part Hematology & reagent: 1.5B
Biochemistry & reagent: 5.7B
B/W Ultrasound: 1.2B
Color Ultrasound: 3.3B
Patient Monitoring Devices: 2.7B
Anesthesia Machines: 0.8B
1992 2006 2009 2011
Add
ressab
le
Add
ressab
le
Add
ressab
le
1998 2001 2006 2011
Launch Time
2000 2006 2008 2010
Launch Time
1992 2006 2009 2011
Launch Time
40+ models currently
T t l dd bl k t i
20+ models currently
35+ hematology reagents and 70+ 20+ models currently
T t l dd bl k t iTotal addressable market size worldwide : ~ 6B
biochemistry reagents
Total addressable market size worldwide: ~19.8B
Total addressable market size worldwide: > 8.6B
4

Investment Highlights
• A world‐class organization rooted in the world’s fastest growing market• China’s first domestic brand in three product areas today backed by
g g
China s first domestic brand in three product areas, today backed by international research centers in U.S. and Europe
• China’s most comprehensive sales and service infrastructure, covering all major cities from local sales offices with distributors covering vast rural and remotecities from local sales offices with distributors covering vast rural and remote areas
• High growth track record in international markets• High growth track record in emerging marketsHigh growth track record in emerging markets
• A high quality, value brand appealing to value‐seeking customers• Highest sales and marketing investment rate within the groupL t f th fit bilit d h ti• Long‐term focus on growth, profitability and cash generation
US$ mm
634
704700
800Revenue Net income* Cash and cash equivalents and short-term/restricted investments
* non-GAAP figures which exclude share-based ti d i d i t ibl294
548
634
373434
400
500
600
700
compensation expense and acquired intangible assets amortization expense, in-progress research and development expenses, realignment costs -post acquisition, as well as income from early termination of contract, all net of related tax impact .
59 84132
190
294
13 23 35 5389
133 147 171
16 2256
216245 253
0
100
200
300
5
0
2003 2004 2005 2006 2007 2008 2009 2010

3Q11 HighlightsNet revenues were $218.4 million, an increase of 29.8% year over year
Robust China sales growth of 35.4% year‐over‐year, primarily driven by regular salesg y y , p y y g
Strong international sales of $124.9 million, a year‐over‐year increase of 25.9%.
Emerging markets continued to achieve significant growthg g g g
Non‐GAAP net income increased 7.4% over the third quarter of 2010 to $42.5 million
Generated $29 9 million net operating cash during the quarter an annual growth of 7 3%Generated $29.9 million net operating cash during the quarter, an annual growth of 7.3%
Introduced the latest series of patient monitoring systems including the iMEC series, the
new iPM series and the A3 anaesthesia machine Launched the DP10 DP20 and DP30 blacknew iPM series and the A3 anaesthesia machine. Launched the DP10, DP20 and DP30 black
and white ultrasound systems
Reagent revenues growth accelerated contributing 31 3% to the in‐vitro diagnostic businessReagent revenues growth accelerated, contributing 31.3% to the in‐vitro diagnostic business
this quarter
On November 7 2011 the Board of Directors approved a share repurchase program of up toOn November 7, 2011, the Board of Directors approved a share repurchase program of up to
$100 millionNote:
Non‐GAAP figures which excludes share‐based compensation expense acquired intangible assets amortization expense realignment costs ‐ post acquisition as well as
6
Non‐GAAP figures which excludes share‐based compensation expense, acquired intangible assets amortization expense, realignment costs ‐ post acquisition, as well as income from early termination of contract, all net of related tax impact.

Financials – 3Q11 Results HighlightsUSD (in millions)except EPS, A/R, A/P, Inventory days
3Q11 3Q10 2Q11 YoY
N R 218 4 168 3 217 3 29 8%Net Revenues 218.4 168.3 217.3 29.8%
Operating IncomeNon‐GAAP OI
38.743.9
38.742.4
47.452.5
‐0.2%3.5%Non GAAP OI
EBITDA
43.9
48.4
42.4
45.8
52.5
56.9
3.5%
5.7%
Net Income Non‐GAAP NI
37.342.5
35.939.5
44.849.8
3.8%7.4%
Diluted EPS Non‐GAAP Diluted EPS
0.310.36
0.300.34
0.370.42
2.3%5.9%
Accounts Receivable Days 71 68 64
Inventory Days 100 116 94y y
Accounts Payable Days 58 66 57
Note:
Non‐GAAP figures which excludes share‐based compensation expense, acquired intangible assets amortization expense, realignment costs ‐ post acquisition, as well as
7
Non GAAP figures which excludes share based compensation expense, acquired intangible assets amortization expense, realignment costs post acquisition, as well as income from early termination of contract, all net of related tax impact.

3Q11 Domestic Market Highlights
3Q11 China sales continued its strong growth and grew 35 4% year‐over‐year3Q11 China sales continued its strong growth and grew 35.4% year over year,
primarily driven by regular sales
h h f l h lThe enhancement of our domestic sales team structure to achieve real‐
time and comprehensive monitoring of hospital demand
Increased patient traffic, as well as hospital and government spending in
county level hospitals
8

3Q11 Emerging Market Highlights
Emerging markets had solid performance achieving more than 30% year‐Emerging markets had solid performance, achieving more than 30% year
over‐year
E E h CIS i d A i P ifi d li d hEastern Europe, the CIS region and Asia Pacific delivered more than
30% year‐over‐year growth
The Middle East and Africa exceeded our expectations and grew over
40% during the period, thanks to the big orders in Turkey and our
continuous sales efforts in South Africa and Eastern Africa
Increase localization efforts and investment in sales and marketing initiativesIncrease localization efforts and investment in sales and marketing initiatives,
further build a solid and reliable service platform
9

3Q11 Developed Market Highlights
Developed markets demonstrated double digit growth year‐over‐year,Developed markets demonstrated double digit growth year over year,
including both North America and Western Europe
N th A i d li d d bl di it th fi t iNorth America delivered double digit growth five quarters in a row
Western Europe did well as a result of our direct sales effort, , as well
as the improved brand recognition of our product quality
10

Patient Monitoring and Life Support
USD (in millions) 3Q11 3Q10 2Q11 YoY%
$ 96.1 $ 72.6 $ 93.0 32.4%The patient monitoring and life support segment contributed 44.0% to total net revenues in 3Q11revenues in 3Q11
Mid‐to‐low end patient monitors, surgical equipments, anesthesia machines and defibrillators achieved strong growth in international marketsand defibrillators achieved strong growth in international markets
The V series achieved robust order trends and the A5 has received excellent feedback from the marketfeedback from the market
New Products in 2011
11
BeneHeart D3 defibrillator A5/A3 anesthesia machineNew iPM Patient monitors iMEC Patient monitors
In‐Vitro Diagnostics
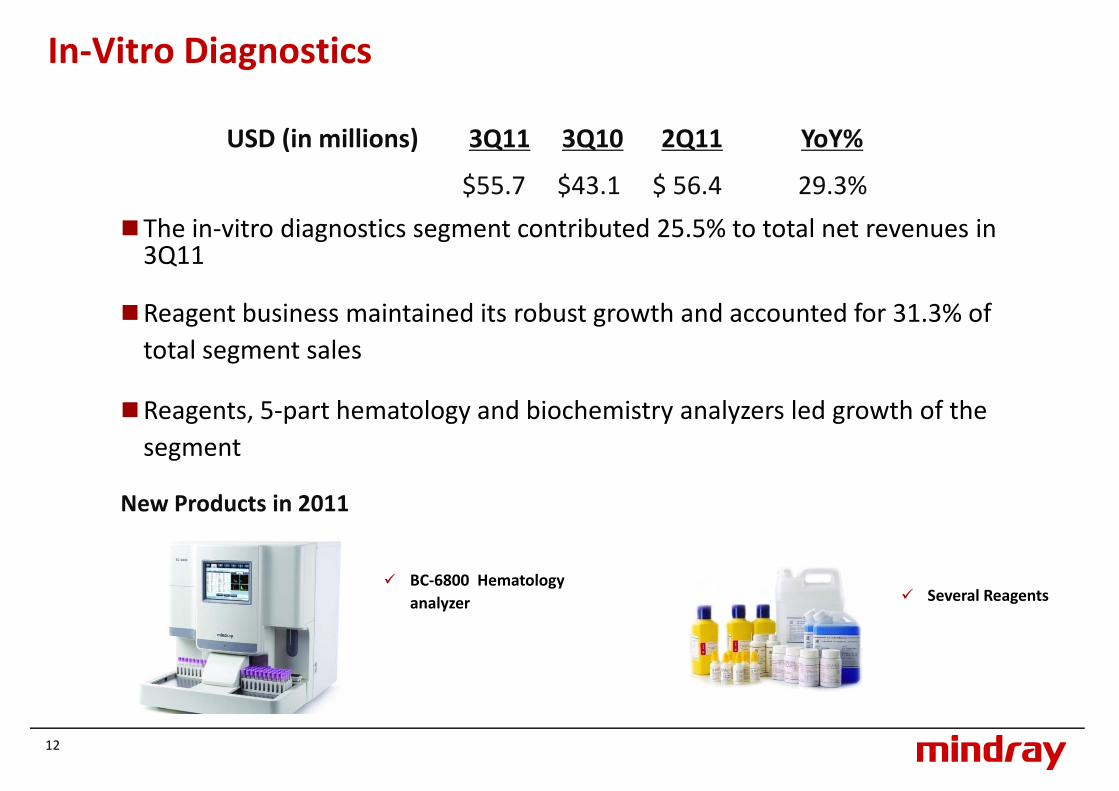
USD (in millions) 3Q11 3Q10 2Q11 YoY%
$ $ $$55.7 $43.1 $ 56.4 29.3%
The in‐vitro diagnostics segment contributed 25.5% to total net revenues in 3Q113Q11
Reagent business maintained its robust growth and accounted for 31.3% of total segment salestotal segment sales
Reagents, 5‐part hematology and biochemistry analyzers led growth of the segment
New Products in 2011
Several ReagentsBC‐6800 Hematology analyzer
12

Medical Imaging Systems
USD (in millions) 3Q11 3Q10 2Q11 YoY%
$53.2 $42.7 $ 55.7 24.5%
The medical imaging systems segment contributed 24.4% to total net revenues in 3Q11
Color ultrasound demonstrated robust growth
The M7 and DC‐7 color ultrasound systems performed well in the North America marketAmerica market
New Products in 2011
DP‐50 black and white ultrasound
• Color ultrasound DP10/20/30 black and white ultrasoundwhite ultrasound
13

2011‐ New Products Pipeline
Patient Monitoring In‐Vitro Diagnostic Products Medical Imaging Systemspp& Life Support Products
In‐Vitro Diagnostic Products Medical Imaging Systems
Several reagents DP 50 black andNew iPM Patient monitor Several reagents DP‐50 black and white ultrasound
New iPM Patient monitor
BC‐6800 Hematology analyzeriMEC Patient monitors
B H D3 d fib ill
• Color ultrasound
BeneHeart D3 defibrillator
DP10/20/30 black and white ultrasound
A5/A3 anesthesia machine
white ultrasound
14

Company Priorities for 2011
To capture growth opportunities in our domestic market, Mindray plans to:
Continue its domestic sales reinforcement program
Capitalize on the government’s focus on upgrading county‐level hospitals and increasing
average healthcare insurance coverage
To enhance our presence in international markets, Mindray intends to:
Increase investment into our marketing and sales initiatives in key international markets
Continue localization efforts of our on‐site operations
Increase direct sales effort
Prioritize R&D investment to meet new product launch targetPrioritize R&D investment to meet new product launch target
Focus on organic product development as well as actively explore external opportunities for
technologies and productstechnologies and products
Remain focused on overall operation’s profitability and maintaining control of working capital
15

Financials ‐‐ 2011 Guidance1
Net revenue >20% YoY
Non‐GAAP Net income2 >10% YoY
Capital expenditure $70 – $80 million
1 Forecast financials as publicly provided on November 7 20111 Forecast financials as publicly provided on November 7, 2011 2 This guidance excludes the tax benefits related to the key software enterprise status ($8.6 million and $7.6 million
recognized in the first quarter of 2010 and 2011 respectively) and assumes a corporate income tax rate of 15% applicable to the Shenzhen subsidiary.
Note:
Non‐GAAP figures which excludes share‐based compensation expense, acquired intangible assets amortization expense, realignment costs ‐ post acquisition, as well as
16
income from early termination of contract, all net of related tax impact.

A diAppendix
17

Mission and Vision
MISSION VISION
Improve health care by optimizing and
We will make better
optimizing and sharing medical t h l i
healthcare solutions more accessible totechnologies
with the worldaccessible to humanityAccessible
18

Growth Catalysts in China‐‐‐Macro Environment
Government spending on healthcare (2000 to 2011)Total national spending on healthcare (2000 to 2010)
2500 536600
RMB bn RMB bn
1454
1754 1960
2000399
474536
400
50015% CAGR (2000‐10)24% CAGR (2000‐11)
515 568 658 759 866
1097 1129
1454
1000
1500
132
199
276
200
300
476 515 568
0
50049 57 64 78 85 104
132
0
100
2000 2001 2002 2003 2004 2005 2006 2007 2008 20092010E 2000 2001 2002 2003 2004 2005 2006 2007 2008 2009 20102011E
Source: Morgan Stanley Research; MOH
19

Market Presence in China
Patient Monitoring Devices & Anesthesia Machine Biochemistry Analyzers
Foreignbrands50%
Mindray31%
Mindray18%
Foreignbrands58%
Oth D i
Otherdomestic
58%
Hematology Analyzers Ultrasound Systems
Other Domesticbrands 19%
domesticbrands 24%
Foreignbrands44% Mindray
Foreign
Mindray34%
Mindray14%
brands77%
Other domestic
brands 9%Other domesticbrands 22%
20
Source: Frost & Sullivan research, market data as of 2009