Embed Size (px)
Citation preview

Mind the gap – a distributed framework for enablingenergy optimisation on modern smart-phones in thepresence of noise, drift, and statistical insignificance
Mahmoud A. Bokhari1 Optimisation and Logistics
University of Adelaide, Australia2 Computer Science Department
Taibah UniversityKingdom of Saudi Arabia
Lujun Weng, Markus Wagner, Bradley AlexanderOptimisation and Logistics
University of Adelaide, [email protected]
[email protected]@adelaide.edu.au
Abstract—Smartphones are becoming essential to people’s ev-eryday lives. Due to the limited battery capacity of smartphones,researchers and developers are increasingly interested in theenergy efficiency of these devices and the software applicationsthat run on them. In the most basic setting, a developer mightbe interested in knowing which of two program variants mightconsume more energy, whether this is for use in regression testingor for use in full-scale evolutionary optimisation. To performsuch comparisons (tournaments) reliably, we need a model ofthe number of trials needed to discern between two variants to adesired level of statistical significance. To enable this, we presenta conceptual framework based on tournaments which we use tocompare a range of test workloads on different combinations ofphones and operating systems. Our results quantify the numberof trials required to resolve different variants to different levelsof fidelity on a range of platforms.
Index Terms—Smart phones, energy consumption, non-functional properties, tournaments.
I. INTRODUCTION
Smartphones are becoming an essential part of their userseveryday lives. A limiting factor in smartphone capabilitiesis battery lifetime, and a key determinant of battery lifetimeis the energy consumption of software running on the phone.Consequently, there is increasing interest from researchers anddevelopers in the optimisation of energy consumption. In orderto optimise software energy consumption, the optimiser needsenergy measurements. The gold standard for obtaining energymeasurements is external meters. These directly and accuratelymeasure the electrical current drawn by the smartphone. Thebest meters can sample at up to 125kHz with only 0.7%estimation error [1]. Such meters have been successfullyapplied to energy optimisation on mobile devices [2]–[4].However, as meter accuracy increases, the price of the meteralso increases. Moreover, setting up an external meter involvesa complicated process, requiring specialised technical skillssince practitioners need to open the device to attach the meterto its battery [5]. This factor makes it infeasible for mostsoftware developers to use high-standard external meters.
Another measurement solution is the use of energy models.There are several techniques under this umbrella. Models can
estimate the energy use by utilising the hardware (HW) andsoftware components’ counters [6], [7]. Other works extendthis methodology to include the different states induced byHW components and system calls [8], [9]. The last categoryutilises the executed line of codes (LOC) for energy estimation[10], [11]. Energy models are less accurate compared tothe hardware meter but more convenient and accessible topractitioners.
However, the dilemma here is which model to use? Energymodels based on HW utilisation models do not capture allfactors that contribute to the energy consumption. For in-stance, these models do not consider the states of networkinterface controllers (NICs) during data transmission. Stateand system call models cannot be easily applied when HWmanufactures do not publish the relevant information abouttheir products [8]. LOC based models, while conceptuallysimple, are difficult to maintain. There are thousands of APIsin the AndroidJava SDKs, and they evolve rapidly at rateof 115 API updates per month [12]. Moreover, the energyuse profile of software is very platform dependent and canvary in complex, state-dependent and even individual-device-dependent ways that are very challenging to model [4], [5],[13].
A solution that alleviates these issues is to utilise the internalmeter of smart-devices and compare the energy consumptionof software variants in-vivo. In contrast to external meters,internal meters do not require advanced electrical engineeringskills and are accessible to software practitioners. Internalmeters are less accurate compared to external meters, however,they can be precise [14], [15] and can be an adequate substituteto obtain real measurements if the measurement periods aresufficiently long. Battery readings from the internal meter areeasy to access through the battery APIs, such as BatteryMan-ager in the Android SDK [16]. In addition, internal meters donot suffer from the inherent inaccuracy of models – they showwhat software variants actually use at a particular moment.
However, like all measurements of real systems, measure-ments of energy consumption using the internal meter are

600
700
800
900
1000
1100
0 100 200 300 400 500 600 700 800 900
mic
ro A
h
samples
Power Use of Rebound Library on Nexus 6 Running Nougat
Fig. 1: Power use of repeated runs (“samples”) of the originalRebound library on Nexus 6 running Android 7. Setup: Rebound wasrun 900 times (blue), then the device was recharged, then Reboundwas run again 900 time.
subject to noise. As an example of this noise Fig. 1 showsrepeated measures of energy consumption, as measured bythe internal meter, for the same variant of a physics libraryrunning on a Nexus 6 using Android 7 – in particular, the onlydifference between the two repetitions (one orange one blue)was that the battery was recharged between the two repetitions.As can be seen, the measurements exhibit significant randomand systematic noise. Such noise can be created by a variety offactors including, battery state, system state, and temperature,among others. This noise has the potential to impact on theaccuracy of fitness evaluations performed during comparisonsof program variants which, in-turn, can affect any optimisationprocess informed by these comparisons.
A common approach to coping with noise in fitness evalua-tions is re-sampling [17]–[28]. When an optimisation processuses re-sampling, variants are run multiple times with thenumber of runs (samples) determined by some function ofan estimation of system noise. In work to date, re-samplingstrategies have assumed that noise can be characterised by anunderlying normal distribution.
In this work we explore the problem of running a tour-nament to compare the energy use of two variants of asoftware application on a mobile platform by using thatplatform’s internal meter. We explore the distributions ofmeasured energy produced by known workloads on differentplatforms in different battery states. We demonstrate that thesedistributions are often complex and, none so far, conform tonormal distributions. From these observed distributions wethen infer the number of consecutive samples required to ranktwo variants to a given degree of confidence at a given batterystate. We show that the number of samples required not onlydepends on the difference between the running times of eachvariant, but also on the battery state, and, very importantly,the HW/OS combination on the platform. We use this infor-mation to propose a number of re-samples for each platformand battery state. Finally, we run a simple, proof-of-conceptoptimisation experiment on a simple benchmark to compareour re-sampling strategy to two other published strategies.These early experiments produce promising indications of thepotential effectiveness of our approach.
II. RELATED WORK ON RE-SAMPLING
Optimisation processes for real systems have to be robustto noise in fitness evaluations of individuals. There are threebasic approaches to coping with noise in evolutionary optimi-sation. The first approach is implicit-averaging [29]. Under thisapproach we simply rely on a large population of individualvariants to contain similar individuals. When very similarindividuals are evaluated we are approximating a re-sampling[28], [30]. One drawback of this approach is the requirementfor large populations which are not easily supported whenfitness evaluations are expensive.
A second, more direct, approach is simply to re-sample afixed number of times according to some characterisation ofnoise [30]. A drawback of this approach is that it is not ableto adapt the re-sampling rate according to circumstances as anoptimisation run progresses. For example, changes in systemstate during optimisation may induce more or less noise [31].
The third strategy, dynamic sampling (DS) addresses thisproblem by allowing the re-sampling strategy to adapt duringoptimisation. A simple DS technique is time-based sampling(TBS) [17], [18]. Under TBS the re-sampling rate increases asoptimisation progresses based on the observation that individ-uals in a population approach similar levels of fitness in latergenerations. Confidence-based DS [22] determines the currentre-sampling rate based on a Welch confidence interval test[32]. Under this scheme individuals are re-sampled a minimumnumber of times to calculate a value for mean and standarddeviation of an assumed underlying normal distribution. AWelch test is then applied to these parameters and if a signifi-cant difference (to a user-specified level) is not found then theindividuals are re-sampled. This re-sampling is repeated untila significant difference is detected or a predefined maximumnumber of samples is reached. Cantu-Pazcite [25] used a one-sided t-test to decide between two candidate solutions in atournament. After the initial sampling, the solution with thehighest variance is re-sampled one more time and the t-testis run to check for a significant statistical difference. Aswith Confidence-based DS this sampling is repeated until thedesired p-value is reached or the maximum sample numberis reached. Other work [23], [24], determines the number ofre-samples using the difference between the solutions’ fitnessvalue δ, the environmental noise σ and known properties ofGaussian distributions. In Gaussian distributions, 95.4% ofsamples fall in an interval whose width is 4σ. In case thedistance between the two solutions is greater than 2σ, it islikely that the fitter solution is truly the best performing inthe tournament. On the other hand, having a small δ meansthe two distributions overlap and therefore more samples arerequired. This is done by calculating the normalised measureof the overlap v and the critical value of Gaussian distributionwith a confidence level of 0.95.
Di Pietro et al. [26], [27] used the Standard Error (SE)to decide between solutions by re-sampling until SE estimatesconverged. These estimates are then used to characterise noisewhich is then used, to determine the re-sampling rate.More
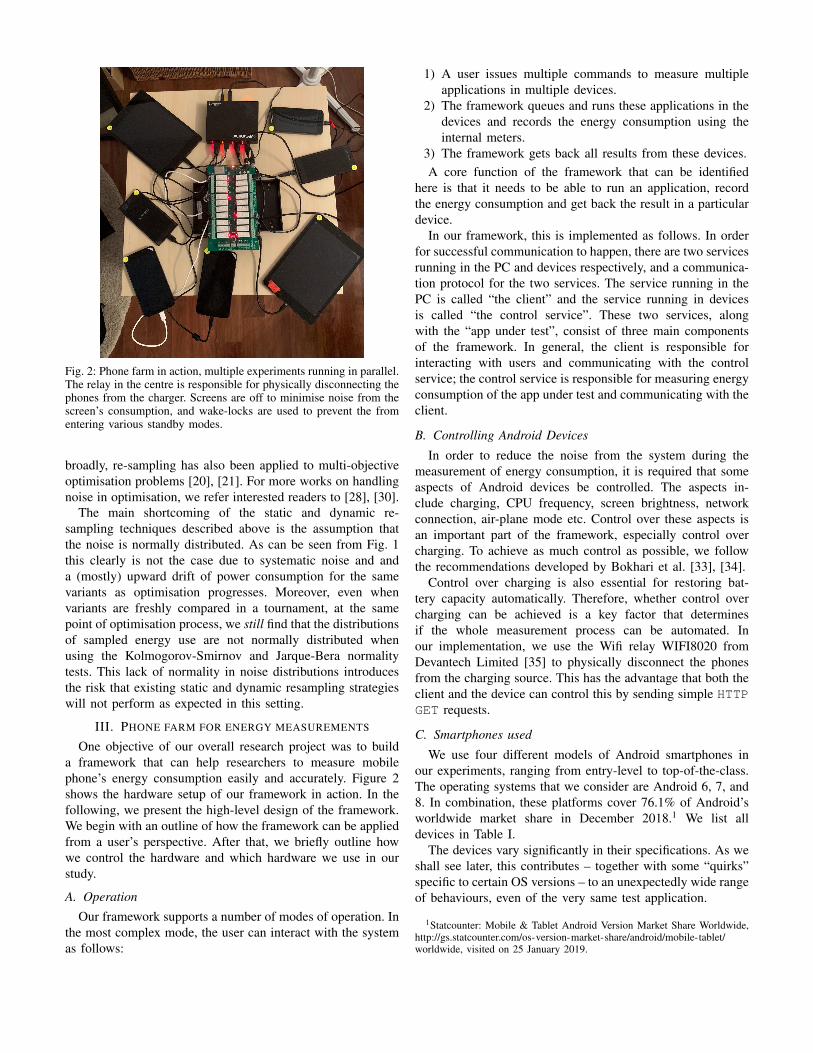
Fig. 2: Phone farm in action, multiple experiments running in parallel.The relay in the centre is responsible for physically disconnecting thephones from the charger. Screens are off to minimise noise from thescreen’s consumption, and wake-locks are used to prevent the fromentering various standby modes.
broadly, re-sampling has also been applied to multi-objectiveoptimisation problems [20], [21]. For more works on handlingnoise in optimisation, we refer interested readers to [28], [30].
The main shortcoming of the static and dynamic re-sampling techniques described above is the assumption thatthe noise is normally distributed. As can be seen from Fig. 1this clearly is not the case due to systematic noise and anda (mostly) upward drift of power consumption for the samevariants as optimisation progresses. Moreover, even whenvariants are freshly compared in a tournament, at the samepoint of optimisation process, we still find that the distributionsof sampled energy use are not normally distributed whenusing the Kolmogorov-Smirnov and Jarque-Bera normalitytests. This lack of normality in noise distributions introducesthe risk that existing static and dynamic resampling strategieswill not perform as expected in this setting.
III. PHONE FARM FOR ENERGY MEASUREMENTS
One objective of our overall research project was to builda framework that can help researchers to measure mobilephone’s energy consumption easily and accurately. Figure 2shows the hardware setup of our framework in action. In thefollowing, we present the high-level design of the framework.We begin with an outline of how the framework can be appliedfrom a user’s perspective. After that, we briefly outline howwe control the hardware and which hardware we use in ourstudy.
A. Operation
Our framework supports a number of modes of operation. Inthe most complex mode, the user can interact with the systemas follows:
1) A user issues multiple commands to measure multipleapplications in multiple devices.
2) The framework queues and runs these applications in thedevices and records the energy consumption using theinternal meters.
3) The framework gets back all results from these devices.A core function of the framework that can be identified
here is that it needs to be able to run an application, recordthe energy consumption and get back the result in a particulardevice.
In our framework, this is implemented as follows. In orderfor successful communication to happen, there are two servicesrunning in the PC and devices respectively, and a communica-tion protocol for the two services. The service running in thePC is called “the client” and the service running in devicesis called “the control service”. These two services, alongwith the “app under test”, consist of three main componentsof the framework. In general, the client is responsible forinteracting with users and communicating with the controlservice; the control service is responsible for measuring energyconsumption of the app under test and communicating with theclient.
B. Controlling Android Devices
In order to reduce the noise from the system during themeasurement of energy consumption, it is required that someaspects of Android devices be controlled. The aspects in-clude charging, CPU frequency, screen brightness, networkconnection, air-plane mode etc. Control over these aspects isan important part of the framework, especially control overcharging. To achieve as much control as possible, we followthe recommendations developed by Bokhari et al. [33], [34].
Control over charging is also essential for restoring bat-tery capacity automatically. Therefore, whether control overcharging can be achieved is a key factor that determinesif the whole measurement process can be automated. Inour implementation, we use the Wifi relay WIFI8020 fromDevantech Limited [35] to physically disconnect the phonesfrom the charging source. This has the advantage that both theclient and the device can control this by sending simple HTTPGET requests.
C. Smartphones used
We use four different models of Android smartphones inour experiments, ranging from entry-level to top-of-the-class.The operating systems that we consider are Android 6, 7, and8. In combination, these platforms cover 76.1% of Android’sworldwide market share in December 2018.1 We list alldevices in Table I.
The devices vary significantly in their specifications. As weshall see later, this contributes – together with some “quirks”specific to certain OS versions – to an unexpectedly wide rangeof behaviours, even of the very same test application.
1Statcounter: Mobile & Tablet Android Version Market Share Worldwide,http://gs.statcounter.com/os-version-market-share/android/mobile-tablet/worldwide, visited on 25 January 2019.
Parameter name Android version SoC CPU MemorySony Xperia ZX 7 & 8 Qualcomm MSM8996 Snapdragon 820 Quad-core (2x2.15 GHz Kryo & 2x1.6 GHz Kryo) 3 GB
Nexus 6 6 & 7 Qualcomm APQ8084 Snapdragon 805 Quad-core 2.7 GHz Krait 450 3 GBMoto G4 Play 6 & 7 Qualcomm MSM8916 Snapdragon 410 Quad-core 1.2 GHz Cortex-A53 2 GB
Nexus 9 6 & 7 Nvidia Tegra K1 Dual-core 2.3 GHz Denver 2 GB
TABLE I: The list of the used devices and their specifications.
To facilitate readability, we will from now on refer to phone-OS combinations just as “phones” or “devices”, unless wewant to explicitly highlight a particular combination.
IV. CASE STUDYS
In our case study, we first characterise our devices for theuse in tournaments for which we seek statistical significance.Then, we extract recommendations from our measurementswhich are then used in a proof-of-concept of on-device op-timisation and in comparison with other methods for noisyenvironments.
A. Characterisation of Phones
The goal of this first part of the case study is to characterisean understandable base case in order to establish which phone-OS combinations we might be able to use later for optimisationpurposes.
The experimental design is influenced by the internal metersin the Nexus 6 and Nexus 9, which have a temporal resolutionof 4Hz. Our goal is to investigate first whether it is possibleto distinguish between processes that are identical in naturebut slightly different in duration.
For this, we use a simple dummy load that we call Busy-Loop app, as it just runs a busy loop for a pre-defined duration.The durations chosen are 10 seconds as the base case, 10.25seconds and 10.50 seconds (being equivalent to the base caseplus 1 or 2 samples of the 4Hz-energy meter), and 12 seconds.For each data collection, we start with a full battery (denotedas 100%) and repeatedly run BusyLoop until the battery hasonly 10% charge left.
We have to highlight one important detail of the implemen-tation before we can continue. As shown in the motivatingexample in Section 1, the system can exhibit different energyconsumption behaviours even when the only change in systemstate is a battery recharge. Our approach to mitigate thisis as follows. To average out the effect of different statesbetween different recharges and of varying rates of drift, weinterleave the execution of different BusyLoop variants. Thismeans, instead of running (10s, 10s, 10s, 10s, ...) in the firstrun (from 100% battery down to 10%), then running (10.25,10.25s, 10.25s, ...) and so on, we rotate through the fourconfigurations: first run (10s, 10.25s, 10.5s, 12s, 10s, 10.25s,...), second run (10.25s, 10.5s, 12s, 10s, 10.25s, ...), third run(10.5s, 12s, 10s, 10.25s, ...) and so on. Then, by pulling apartand reassembling the actual measurements, we have exposedthe measurement of each of the four configurations to theeffects of different states as well as to varying drift speeds.
Based on these measurements, we perform two analyses.First, we simulate tournaments of varying length in which we
Android 6
10s
vs.1
0.25
s10
svs
.10.
50s
10s
vs.1
2.00
s
Android 7
10s
vs.1
0.25
s10
svs
.10.
50s
10s
vs.1
2.00
s
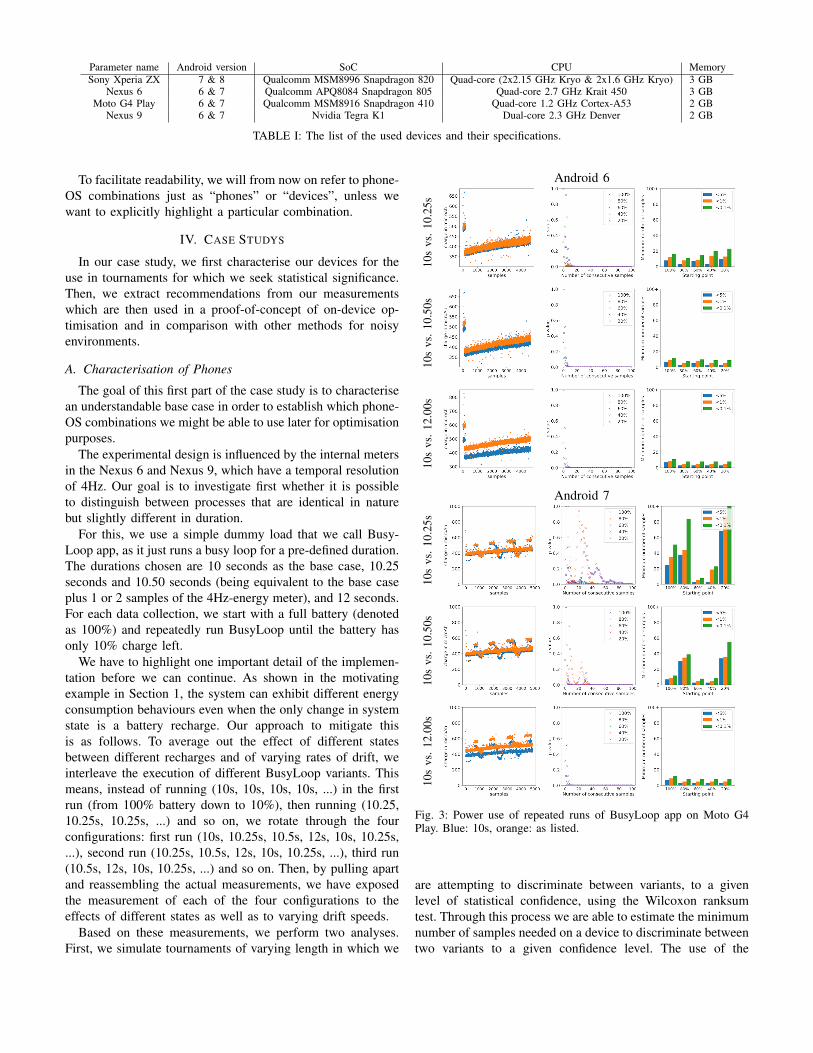
Fig. 3: Power use of repeated runs of BusyLoop app on Moto G4Play. Blue: 10s, orange: as listed.
are attempting to discriminate between variants, to a givenlevel of statistical confidence, using the Wilcoxon ranksumtest. Through this process we are able to estimate the minimumnumber of samples needed on a device to discriminate betweentwo variants to a given confidence level. The use of the
Wilcoxon ranksum test is important – this test does not assumenormality in the underlying distribution.
As an example, we demonstrate the above process hereusing the Moto G4 Play. The raw results of running the fourconfiguration are shown in the left column of Figure 3. It isinteresting that the upgrade to Android 7 removed the initialphase of high energy consumption. However, additional higherand lower levels of energy consumption were introduced.
The middle column of Figure 3 shows, as scatter-plots, theresults of the Wilcoxon ranksum tests, simulated at differentpoints in time2, and for various numbers of consecutivesamples (from 1 to 100). As expected, the outcomes becomestatistically more and more significant (p-values decreases) asthe number of samples increases. Similarly, we can see thatwe need more samples to determine a significant difference ifthe difference in duration is small (i.e., in the case of 10s vs.10.25s).
Lastly, the rightmost column of Figure 3 attempts to extractan initial recommendation from the results of the statisticaltests. These bar charts show, for each level of battery charge,and for each significance level the least number of samplesneeded from which on no test has returned a higher p-value.This conservative estimate can be used to inform experimentalsettings, for example, in regression testing of software and alsowhen running tournaments in a evolutionary process.
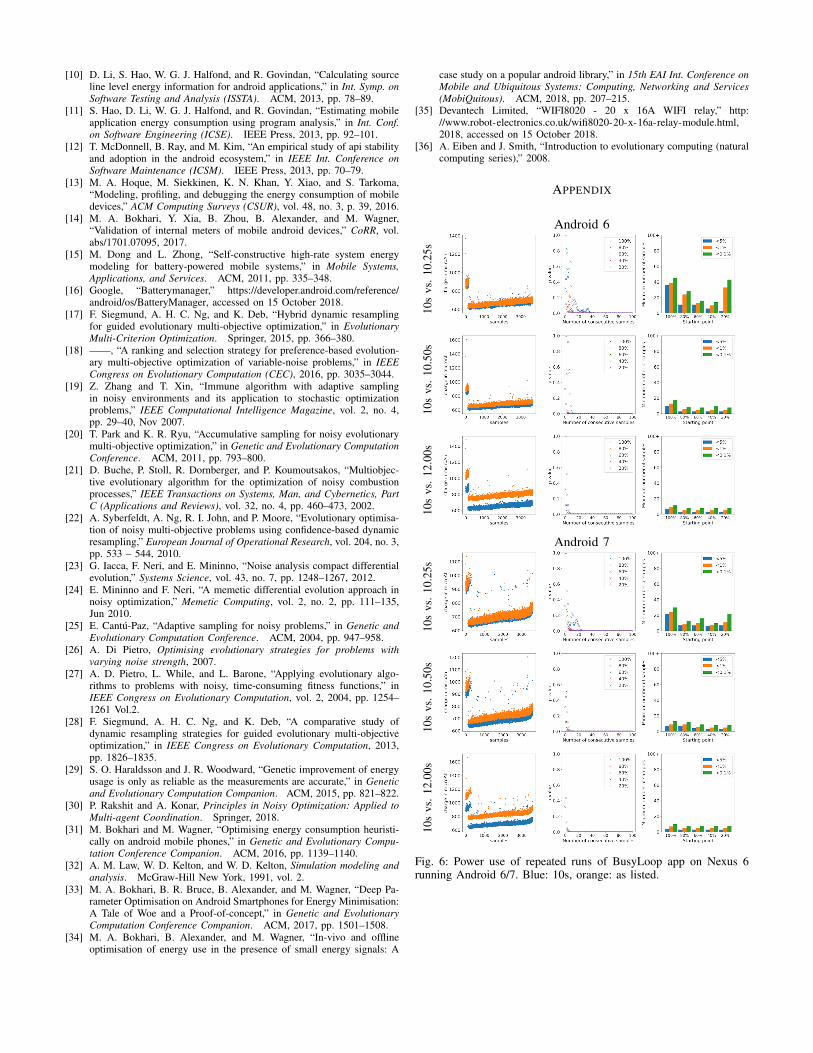
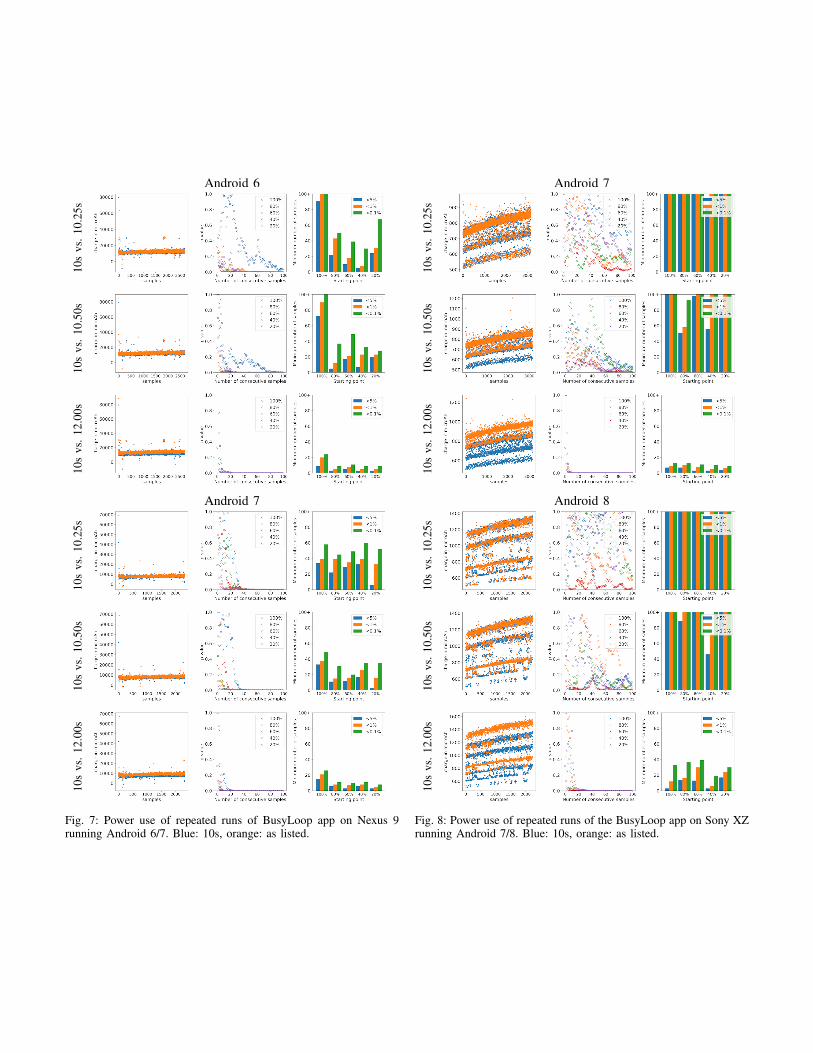
For the other three devices, the observations are as follows.The Nexus 6 and the Nexus 9 (Appendix: Figures 6 and 7)largely follow the trends observed for the Moto G4 Play, butthey are missing the additional states that were introducedwith Android 7. For the Nexus 6, we can see short burn-inphases with the energy consumption being roughly twice ashigh, and we observed this independent of the experiment andof the operating system version. For the Nexus 9, these burn-in phases are just a few samples long, but result in energyconsumption observation that are a factor of seven larger thansubsequent ones.
The Sony XZ (Appendix: Figure 8), behaves quite differ-ently. Although we employed the very same steps to attemptto control the system, we can observe at least six differentlevels of energy consumption of the system – despite ourtest application being just a simple busy loop. Essentially, wecannot make statements about statistical significance when theruntime difference is less than 5%, even when repeating a 10second experiment 100 times.
B. Extracting Recommendations
Table II shows the results of running the BusyLoop variantson a Moto G4 Play running Android 7 with a full battery(i.e., starting at 100%) and significance level 5%. For eachcombination of the four variants, the table lists the minimumnumber of samples needed to distinguish two variants at thedesired confidence level. This shows that the smaller thedifference between variants the more samples are required.
2expressed by the percentage of battery charge used: 100% (full battery),80%, 60%, 40%, 20% (nearly depleted battery)
BusyLoop duration10s 10.25s 10.50s 12s
10s 25 7 710.25s 25 8 710.50s 7 8 312s 7 7 3
TABLE II: Comparing the four BusyLoop variants in pairs withstarting point 100% (fully charged) and significance level 5.0%.
In this study, for each significance level of 5%, 1% and 0.1%and each battery level range, a 4-by-4 table is generated foreach device-OS combination.
Having large numbers of re-samples such as 25 is ex-pensive in real-world applications and can slow down thesearch process. Therefore, we minimise the number of samplesfurther by taken the median of required samples taken fromthe variants at each battery level range for each significancelevel. The choice of the median is based on the assumptionthat the variants sampled at a given battery level are in somesense representative of the population that will be seen duringoptimisation. If the sampled variants are representative thenthe re-sampling estimate will be high enough approximately50% of the time. Ultimately, the relative rank of the variantchosen to determine the re-sampling will need to be tested andcalibrated empirically in optimisation experiments. Table IIIshows the median of the minimum number of samples neededfor the desired significance level at every battery range. Eachelement in the table represents the median of samples foundin the 4-by-4 corresponding table. For example, when runninga tournament between two variants in battery range 100% to80% and confidence level of 5% is required, it is recommendedto sample each solution 7 times. As can be seen, 7 is themedian of the element in Table II.
Android 7starting point
100% 80% 60% 40% 20%
significancelevel
5% 4.0 3.0 3.5 3.0 3.01% 9.0 5.0 5.5 5.0 5.00.1% 12.5 8.5 8.5 8.0 8.0
TABLE III: Recommended number of samples based on the Busy-Loop case study. Set up is the Moto G4 running Android 7. Entries arethe recommended minimum number of samples for different batterycharge levels points and the desired significance level.
V. OPTIMISATION EXPERIMENT
In this section we report on an optimisation experimentthat serves as a proof-of-concept. We use an adaptive 1+1Evolutionary Strategy (ES) algorithm, the mutation operator isuncorrelated mutation with one step size described in [36]. Forcomparison, we run optimisation with our recommendation-table based dynamic sampling (table-based DS) and compareto the re-sampling techniques described in [22] (confidence-based DS) and [23] (2-sigma DS) described in Section II). Forour table-based DS, we accept the newly created solution if thestatistical test either favours it or if no significant difference tothe parent can be determined (based on the number of samplesgiven in the lookup table).
10000
15000
20000
25000
30000
35000
40000
45000
50000
0 10 20 30 40 50 60 70
du
rati
on
in m
s
solutions
BusyLoop Duration on Nexus 6 Running Android 7
lookup table
2-sigma
confidence interval
Fig. 4: Solutions’ duration of busy loop optimisation experiment,shown are tournament winners. The duration equals the value of thedecision variable.
We used our framework described in Section III to run theoptimisation experiments on a Nexus 6 running Android 7.We generated the table prescribing re-sampling rates using theprocess described in Section IV-B. The experimental runs tookapproximately 4 hours and were started with a full batteryand we stopped when reaching a battery level of 10%. Thetarget for optimisation was the busy-loop app – a very simplebenchmark where the current best loop iteration count ismutated according to a normal distribution with σ = 0.25seconds. The duration of the starting variant was 45 seconds.It is important to note that this experiment is designed toexplore the feasibility of different re-sampling approachesin this optimisation environment, rather than to definitivelycompare re-sampling techniques (which would require a largerstudy).
Figures 4 and 5 illustrate the results of applying each re-sampling technique to optimisation of the busy-loop bench-mark for equivalent four-hour runs. As can be seen, the table-based DS technique generated considerably more variantsthan 2-sigma DS and confidence-based DS techniques. The2-sigma DS re-sampled solutions 18 times on average whichconsiderably slowed its progress. In fact, since the distributionof the generated solutions were not normal and stronglyoverlapped, 2-sigma DS unrealistically requested up-to 4639samples per solution in one of the tournaments. However, theupper limit is set to 30 samples per solution [23]. This showsthat demanding the difference between two solutions to beat least 2σ to tell them apart is costly in this environment.For confidence-based DS, solutions were sampled 5 times onaverage which is the upper limit of the algorithm [22]. Again,confidence-based DS assumes that samples are taken from anormal distribution, a condition not met in this setting.
In contrast, the number of samples were relatively smallin table-based DS technique at most 4 samples per solutionacross the entire optimisation, which, in turn, gave the searchprocess enough time to evaluate more solutions. In addition,the use of more conservative statistical test (i.e. Wilcoxonranksum) helped distinguishing between solutions. It shouldbe noted that, especially, toward the end of the optimisationprocess, table-based DS produced some large outliers in bothexecution time and energy consumption. The presence of theseoutliers, being over-estimates, did not impact on optimisation.However, more experiments in different settings would be
1000
2000
3000
4000
5000
6000
7000
0 10 20 30 40 50 60 70
mic
ro A
h
solutions
BusyLoop Power Use on Nexus 6 Running Android 7
lookup table
2-sigma
confidence interval
Fig. 5: Solution fitness values of busy loop optimisation experiment.The measurements are the ones returned by the internal meter for thesolutions shown in Figure 4 and thus exhibit a slight upwards trenddue to sensor drift.
needed to verify if other optimisations are similarly robustto such outliers.
VI. CONCLUSIONS AND FUTURE WORK
In this paper we have examined re-sampling in tournamentsin the context of in-vivo optimisation of energy use on mobileplatforms. We have derived distributions of the number ofsamples required in two-way tournaments on a variety ofmobile platforms. We have developed a process for generatingpreliminary recommendations for re-sampling strategies foreach platform and we have applied these recommendationsin a proof-of-concept experiment with promising results.
Future work will focus on carefully measuring the relation-ship between re-sampling recommendations and optimisationsettings across a variety of devices. We also propose to exam-ine how changes in platform state impact on the effectivenessof re-sampling recommendations.
REFERENCES
[1] R. Saborido, V. V. Arnaoudova, G. Beltrame, F. Khomh, and G. An-toniol, “On the impact of sampling frequency on software energymeasurements,” PeerJ PrePrints, Tech. Rep., 2015.
[2] R. Morales, R. Saborido, F. Khomh, F. Chicano, and G. Antoniol,“Earmo: An energy-aware refactoring approach for mobile apps,” IEEETransactions on Software Engineering, Dec 2018.
[3] L. Zhong and N. K. Jha, “Graphical user interface energy characteriza-tion for handheld computers,” in Int. Conf. on Compilers, architectureand synthesis for embedded systems. ACM, 2003, pp. 232–242.
[4] B. R. Bruce, J. Petke, M. Harman, and E. T. Barr, “Approximate oraclesand synergy in software energy search spaces,” IEEE Transactions onSoftware Engineering, pp. 1–1, 2018, accepted.
[5] A. Hindle, “Green software engineering: The curse of methodology,”in IEEE 23rd Int. Conference on Software Analysis, Evolution, andReengineering (SANER), vol. 5, March 2016, pp. 46–55.
[6] W. Jung, C. Kang, C. Yoon, D. Kim, and H. Cha, “Devscope: Anonintrusive and online power analysis tool for smartphone hardwarecomponents,” in Eighth Int. Conference on Hardware/Software Codesignand System Synthesis. ACM, 2012.
[7] L. Zhang, B. Tiwana, Z. Qian, Z. Wang, R. P. Dick, Z. M. Mao,and L. Yang, “Accurate online power estimation and automatic batterybehavior based power model generation for smartphones,” in Hard-ware/Software Codesign and System Synthesis. ACM, 2010, pp. 105–114.
[8] A. Pathak, Y. C. Hu, M. Zhang, P. Bahl, and Y.-M. Wang, “Fine-grainedpower modeling for smartphones using system call tracing,” in EuropeanConference on Computer Systems. ACM, 2011.
[9] C. Yoon, D. Kim, W. Jung, C. Kang, and H. Cha, “Appscope: Ap-plication energy metering framework for android smartphones usingkernel activity monitoring,” in USENIX Conference on Annual TechnicalConference. USENIX Association, 2012.
[10] D. Li, S. Hao, W. G. J. Halfond, and R. Govindan, “Calculating sourceline level energy information for android applications,” in Int. Symp. onSoftware Testing and Analysis (ISSTA). ACM, 2013, pp. 78–89.
[11] S. Hao, D. Li, W. G. J. Halfond, and R. Govindan, “Estimating mobileapplication energy consumption using program analysis,” in Int. Conf.on Software Engineering (ICSE). IEEE Press, 2013, pp. 92–101.
[12] T. McDonnell, B. Ray, and M. Kim, “An empirical study of api stabilityand adoption in the android ecosystem,” in IEEE Int. Conference onSoftware Maintenance (ICSM). IEEE Press, 2013, pp. 70–79.
[13] M. A. Hoque, M. Siekkinen, K. N. Khan, Y. Xiao, and S. Tarkoma,“Modeling, profiling, and debugging the energy consumption of mobiledevices,” ACM Computing Surveys (CSUR), vol. 48, no. 3, p. 39, 2016.
[14] M. A. Bokhari, Y. Xia, B. Zhou, B. Alexander, and M. Wagner,“Validation of internal meters of mobile android devices,” CoRR, vol.abs/1701.07095, 2017.
[15] M. Dong and L. Zhong, “Self-constructive high-rate system energymodeling for battery-powered mobile systems,” in Mobile Systems,Applications, and Services. ACM, 2011, pp. 335–348.
[16] Google, “Batterymanager,” https://developer.android.com/reference/android/os/BatteryManager, accessed on 15 October 2018.
[17] F. Siegmund, A. H. C. Ng, and K. Deb, “Hybrid dynamic resamplingfor guided evolutionary multi-objective optimization,” in EvolutionaryMulti-Criterion Optimization. Springer, 2015, pp. 366–380.
[18] ——, “A ranking and selection strategy for preference-based evolution-ary multi-objective optimization of variable-noise problems,” in IEEECongress on Evolutionary Computation (CEC), 2016, pp. 3035–3044.
[19] Z. Zhang and T. Xin, “Immune algorithm with adaptive samplingin noisy environments and its application to stochastic optimizationproblems,” IEEE Computational Intelligence Magazine, vol. 2, no. 4,pp. 29–40, Nov 2007.
[20] T. Park and K. R. Ryu, “Accumulative sampling for noisy evolutionarymulti-objective optimization,” in Genetic and Evolutionary ComputationConference. ACM, 2011, pp. 793–800.
[21] D. Buche, P. Stoll, R. Dornberger, and P. Koumoutsakos, “Multiobjec-tive evolutionary algorithm for the optimization of noisy combustionprocesses,” IEEE Transactions on Systems, Man, and Cybernetics, PartC (Applications and Reviews), vol. 32, no. 4, pp. 460–473, 2002.
[22] A. Syberfeldt, A. Ng, R. I. John, and P. Moore, “Evolutionary optimisa-tion of noisy multi-objective problems using confidence-based dynamicresampling,” European Journal of Operational Research, vol. 204, no. 3,pp. 533 – 544, 2010.
[23] G. Iacca, F. Neri, and E. Mininno, “Noise analysis compact differentialevolution,” Systems Science, vol. 43, no. 7, pp. 1248–1267, 2012.
[24] E. Mininno and F. Neri, “A memetic differential evolution approach innoisy optimization,” Memetic Computing, vol. 2, no. 2, pp. 111–135,Jun 2010.
[25] E. Cantu-Paz, “Adaptive sampling for noisy problems,” in Genetic andEvolutionary Computation Conference. ACM, 2004, pp. 947–958.
[26] A. Di Pietro, Optimising evolutionary strategies for problems withvarying noise strength, 2007.
[27] A. D. Pietro, L. While, and L. Barone, “Applying evolutionary algo-rithms to problems with noisy, time-consuming fitness functions,” inIEEE Congress on Evolutionary Computation, vol. 2, 2004, pp. 1254–1261 Vol.2.
[28] F. Siegmund, A. H. C. Ng, and K. Deb, “A comparative study ofdynamic resampling strategies for guided evolutionary multi-objectiveoptimization,” in IEEE Congress on Evolutionary Computation, 2013,pp. 1826–1835.
[29] S. O. Haraldsson and J. R. Woodward, “Genetic improvement of energyusage is only as reliable as the measurements are accurate,” in Geneticand Evolutionary Computation Companion. ACM, 2015, pp. 821–822.
[30] P. Rakshit and A. Konar, Principles in Noisy Optimization: Applied toMulti-agent Coordination. Springer, 2018.
[31] M. Bokhari and M. Wagner, “Optimising energy consumption heuristi-cally on android mobile phones,” in Genetic and Evolutionary Compu-tation Conference Companion. ACM, 2016, pp. 1139–1140.
[32] A. M. Law, W. D. Kelton, and W. D. Kelton, Simulation modeling andanalysis. McGraw-Hill New York, 1991, vol. 2.
[33] M. A. Bokhari, B. R. Bruce, B. Alexander, and M. Wagner, “Deep Pa-rameter Optimisation on Android Smartphones for Energy Minimisation:A Tale of Woe and a Proof-of-concept,” in Genetic and EvolutionaryComputation Conference Companion. ACM, 2017, pp. 1501–1508.
[34] M. A. Bokhari, B. Alexander, and M. Wagner, “In-vivo and offlineoptimisation of energy use in the presence of small energy signals: A
case study on a popular android library,” in 15th EAI Int. Conference onMobile and Ubiquitous Systems: Computing, Networking and Services(MobiQuitous). ACM, 2018, pp. 207–215.
[35] Devantech Limited, “WIFI8020 - 20 x 16A WIFI relay,” http://www.robot-electronics.co.uk/wifi8020-20-x-16a-relay-module.html,2018, accessed on 15 October 2018.
[36] A. Eiben and J. Smith, “Introduction to evolutionary computing (naturalcomputing series),” 2008.
APPENDIX
Android 6
10s
vs.1
0.25
s10
svs
.10.
50s
10s
vs.1
2.00
s
Android 7
10s
vs.1
0.25
s10
svs
.10.
50s
10s
vs.1
2.00
s
Fig. 6: Power use of repeated runs of BusyLoop app on Nexus 6running Android 6/7. Blue: 10s, orange: as listed.
Android 6
10s
vs.1
0.25
s10
svs
.10.
50s
10s
vs.1
2.00
s
Android 7
10s
vs.1
0.25
s10
svs
.10.
50s
10s
vs.1
2.00
s
Fig. 7: Power use of repeated runs of BusyLoop app on Nexus 9running Android 6/7. Blue: 10s, orange: as listed.
Android 7
10s
vs.1
0.25
s10
svs
.10.
50s
10s
vs.1
2.00
s
Android 8
10s
vs.1
0.25
s10
svs
.10.
50s
10s
vs.1
2.00
s
Fig. 8: Power use of repeated runs of the BusyLoop app on Sony XZrunning Android 7/8. Blue: 10s, orange: as listed.