Embed Size (px)
Citation preview

MILITARY AVIATION AND THE ENVIRONMENT:HISTORICAL TRENDS AND COMPARISON TO CIVIL AVIATION
Ian A. Waitz,* Stephen P. Lukachko,† and Joosung J. Lee‡
* Professor and Deputy Head, Department of Aeronautics and Astronautics, MIT, Room 33-207, 77 Massachusetts Avenue,Cambridge, MA, 02139, [email protected], AIAA Associate Fellow.† Doctoral Candidate, Department of Aeronautics and Astronautics, MIT, Room 31-216, 77 Massachusetts Avenue, Cam-bridge, MA, 02139, [email protected], AIAA Student Member.‡ Doctoral Candidate, Department of Aeronautics and Astronautics, MIT, Room 31-258, 77 Massachusetts Avenue, Cam-bridge, MA, 02139, [email protected], AIAA Student Member.
ABSTRACTThis paper articulates trends in the environmental im-
pact of military aviation between 1960 and 2000. The fo-cus is on community noise, local air quality, and globalclimate impacts and the discussion is restricted to fixed-wing aircraft. Comparisons are made to trends within thecommercial air transport industry. The unique features ofmilitary aircraft technology and operations responsible forthe differences in environmental impacts are described.The discussion also considers the effects of environmentalrestrictions on the deployment and combat readiness ofmilitary aviation services. Regulations designed to mitigateenvironmental impacts from military and civil aviation arealso reviewed.
The analysis shows that military aviation has beenresponsible for a small and decreasing fraction of totalfossil fuel use in the United States. Further, when averagednationally, contributions to local air quality impacts andcommunity noise have decreased over the period consid-ered. These trends are a result of historical reductions infleet sizes and number of operations. However, since baseclosures were largely responsible for these reductions, theimpacts at any given installation may not reflect overalltrends. Community noise and air quality are expected to bea growing concern for military aviation due to increasingurbanization, increasing public and regulatory attention,and use of training spaces for larger, multi-service opera-tions involving longer range, higher speed weapon sys-tems.
LIST OF ABBREVIATIONSATM air traffic managementBRAC Base Alignment and ClosureCAA Clean Air ActCNS communication, navigation, and surveillanceDNL day-night noise levelDoD Department of DefenseEPA Environmental Protection AgencyEPNL effective perceived noise levelEIS environmental impact statementFAA Federal Aviation AdministrationFCLP field carrier landing practiceIPCC Intergovernmental Panel on Climate Change
NAAQS National Ambient Air Quality StandardNALF Naval Air Landing FieldNAS Naval Air StationNCA Noise Control ActNEPA National Environmental Policy ActPL public lawPM particulate matterSIP state implementation planUHC unburned hydrocarbonUSC United States Code
1 INTRODUCTIONIn the United States, environmental concerns have
increasingly focused on the impacts of aircraft operations.This reflects a decrease in public willingness to acceptenvironmental deterioration, improved identification ofaviation contributions (which generally increase withgrowth), and a better understanding of the ways health andwelfare might be affected. To effectively balance needs formobility with demand for environmental protection, ac-tions in the commercial arena must address a wide range ofscientific, design, and policy problems that require jointattention to noise, air quality, and climate issues. Militaryaviation faces an equally complex challenge in balancingthese issues against national security needs. This paperdescribes the technological and operational factors thatcharacterize military aviation impacts. It provides an as-sessment of the current scope and magnitude of environ-mental effects and the present policy approach. Our goal isto contribute to a more effective balancing of environ-mental and national security objectives.
Our analysis concludes that when averaged nationally,noise and emissions impacts associated with military avia-tion have generally declined in the United States. How-ever, local circumstances have resulted in discrete areas ofincreased impact and it is these local issues that are likelyto define future pressures for environmental progress. Sec-tion 2 begins by discussing current regulatory measuresused to control health and welfare impacts, along with ex-amples of the trade-offs imposed on military operations.Section 3 reviews the pathways through which noise andemissions produced by aviation operations are currentlyunderstood to result in environmental change, and identi-

fies relevant metrics. Section 4 employs these metrics toevaluate the historical evolution of community noise, localair quality, and global climate impacts associated withmilitary aviation. Section 5 is a summary.
Unique features of military aircraft technology andoperations are responsible for differences in environmentalperformance when compared to commercial aviation. Itwill be apparent from our investigation that data and meth-ods for quantifying trends in environmental impact aremore readily available than complementary informationfor quantifying how environmental requirements affectnational security. Because the lack of such a capabilitymakes it difficult to fully evaluate this important interac-tion, we recommend an effort to establish metrics for as-sessing national security impacts. This is an importantchallenge for the U.S. Department of Defense (DoD), theagency ultimately responsible finding the right balance.
2 CONTEXT OF MILITARY AVIATIONENVIRONMENTAL IMPACTS
The most important impacts of environmental issueson military aviation are associated with the deploymentand combat readiness of the airborne services, particularlyas related to limitations on the realism of training activi-ties.1,2,3 Navy pilot training for aircraft carrier landings inthe U.S. is a valuable example of the practical implica-tions. Land-based training for carrier landings is intendedto closely mimic actual procedures at sea. To best preserverealism, pilots would ideally execute such field carrierlanding practice (FCLP) procedures from a 600 ft (~185m) pattern altitude to simulate an approach at sea. How-ever, resulting noise levels in residential areas surroundingsome bases have proved unacceptably high using this alti-tude. Naval Air Station (NAS) Oceana and Naval AirLanding Field (NALF) Fentress, the primary East Coasttraining areas for Navy pilots, raised FCLP procedures to1000 ft (~305 m) and 800 ft (~245 m), respectively, gain-ing a reduction in noise levels, but also losing realism.Because this is a potential safety issue for operations at seaand may extend training requirements, the Navy has re-cently launched an effort to identify a new remote outlyingfield at a potential cost of $40M to $115M to alleviatethese operational impacts.4
Issues related to operational restrictions resulting fromnoise, such as the FCLP case, or air quality concerns arebroadly termed encroachment. Once remote and suffi-ciently large to minimize interactions with local popula-tions, bases and training ranges have faced increasingpressure from local communities to mitigate environmentaleffects. Evolving DoD requirements for use of trainingranges compounds the effect of increasing urbanization.As the DoD pursues more multi-service, coordinated war-fighting, and as the speed and range of sensors and weap-ons systems increase, the size of the battle spaceeffectively increases. Thus, the area required for trainingincreases.
While tort cases have long been a route for resolution
of environmental grievances (nuisance complaints, forexample), a significant basis of U.S. federal environmentaland administrative law has been established over the lastthree decades that outlines the minimum extent to whichencroachment is considered in decisions concerning mili-tary aviation. The broadest legal standard addressing theuse of DoD environmental expenditures is the 1969 Na-tional Environmental Policy Act (NEPA) (42 USC 4332).NEPA requires federal agencies to assess the health, socio-economic, ecological, cultural, and aesthetic impacts ofmajor actions through the development of an environ-mental impact statement (EIS). NEPA has an importantrole in weapon system basing decisions.5 While it is notpossible to generalize which issues will be most importantin any particular EIS, recent assessments for the F/A-18C/D, F/A-18E/F, and F-22 aircraft suggest noise andemissions have increasingly influenced deliberations.6,7 Anational security exemption in the 1972 Noise Control Act(NCA) (42 USC 4901 to 4912) gives the EIS process andcourt actions based on constitutional and tort law a centralrole in responses to noise impacts. For example, propertyowners in Virginia Beach and Chesapeake, Virginia, havealleged that overflights of Navy F/A-18C/D aircraft haveadversely impacted the value of their property and haveresulted in a taking without compensation, in violation ofthe Fifth Amendment of the U.S. Constitution.7 The regu-latory treatment of military aviation emissions is broader.Unlike noise, federal law provides states with an importantadditional measure of control over the emissions of mili-tary aircraft through the general conformity rule of the1970 Clean Air Act (CAA) (with amendments, 42 USC7401 to 7601).
The CAA provides for minimum air quality standardsfor certain pollutants (the National Ambient Air QualityStandards, or NAAQS) and requires states to implement aplan to achieve or exceed these minimum standards. Whilethere are no direct emissions regulations for military avia-tion technology, the general conformity rule (42 USC7506) prohibits the federal government from funding, li-censing, permitting, approving, or otherwise supportingactivities that do not conform to an approved state imple-mentation plan (SIP). Any activities at a military installa-tion or range that are not consistent with state plans canthus be halted. Conformity rule-based obligations wererequired for the F/A-18E/F introduction at NAS Lemoorein 1998 where the Navy had to identify 300 tons (~270metric tons) of NOx emissions offsets before the aircraftwould be allowed to operate.8 The Joint Strike Fighter mayface similar restrictions as more than half of the bases con-sidered for operations could be impacted by their presencein non-attainment zones, areas that do not meet the pri-mary NAAQS set by the federal government.9 The militaryhas closed more than a dozen bases in California as part ofthe Base Realignment and Closure (BRAC) process, anddifficulty in attaining emissions standards was one of themany important factors considered. Commercial airportsmust also conform to an applicable SIP, and this indirectly

influences certification standards for commercial aircraftemissions. A similar indirect connection to design practiceis also apparent for military systems. Although there are nocertification standards, manufacturers are increasinglyconsidering environmental performance in their research,design, and development activities for military aircraft.
In fiscal year 2002, the DoD was authorized to spendup to $4B in public funds for environmental programs(PL107-107).10 While legal standards provide a means toresolve environmental complaints, military planning hashistorically emphasized land-use policy to manage localimpacts associated with noise and emissions. Indeed, com-patible land-use policies (along with enhanced administra-tive functions and improved community outreach) are thebasis of the Sustainable Ranges Initiative8 and the Readi-ness and Range Preservation Initiative,3 the most recentDoD programs to balance environment and national secu-rity. The continued necessity for operational limitationsand erosion of land buffers at existing sites, as well asnegative effects on basing decisions for future systems,suggest that a different approach may be necessary in thefuture. Emissions and noise performance requirementsmay become a more significant part of military technologydevelopment. This may be particularly important in deal-ing with environmental issues that do not as yet have aninstitutionally defined standard of control. While it is ex-pected that the local noise and emissions issues over-viewed in this section will remain central for severaldecades, climate issues represent an important source ofuncertainty in establishing future military aviation envi-ronmental requirements.
Alternatively, to limit the perceived costs of environ-mental restrictions on military readiness, legislative reme-dies have been proposed that would require an explicitbalancing of the environmental and national security re-quirements placed on military aviation. An early version ofthe 2002 DoD budget authorization bill (PL107-107)would have required a national security impact assessmentto be performed in parallel with the EIS. While not passedinto law, this proposal highlights the ongoing search for animproved methodology through which environmental andnational security impacts can be comparatively assessedand balanced. The next sections demonstrate that data andmethods for quantifying the environmental impact ofmilitary actions are available. However, complementaryinformation for assessing the national security impact ofvarious environmental actions, beyond anecdotal evidence,is comparatively lacking.
3 METRICS FOR AVIATION NOISE ANDEMISSIONS IMPACTS
A variety of metrics are available for assessing thenoise and emissions performance of aircraft, and the civiland military systems in which they operate. Some are moreuseful for understanding trends in technology whereasothers have greater relevance to evaluating environmentalimpact. Our focus is on the latter. For example, noise lev-
els are well correlated to the overall weight, number ofengines, and the mission defined for an aircraft. Whenthese factors are taken into account, as in commercial air-craft certification standards, technology trends are moreclearly highlighted. However, from a community noiseperspective, the person on the ground is less concernedwith the configuration of the aircraft than with the per-ceived noise it produces. Thus, trends in environmentalimpact are more appropriately assessed using measuressuch as the effective perceived noise level (EPNL), inde-pendent of the weight of the aircraft. As another example,NOx is a strong function of engine pressure ratio and over-all rated thrust output of the engine. While technology per-formance is typically evaluated in terms of the mass ofNOx per unit thrust, placed on a sliding scale in terms ofengine pressure ratio, local air quality is more directly re-lated to the total mass of pollutants emitted (e.g. kg-NOx
per day). This section reviews the metrics used to judge themagnitude and scope of aviation emissions and noise im-pacts. Noise is addressed in Section 3.1 and emissions inSection 3.2. Section 4 addresses the underlying techno-logical and operational trends.
3.1 Assessment of Noise ImpactsAlthough auditory damage is an important occupa-
tional hazard for aircraft support personnel, communitynoise levels around bases are not typically high enough tocause hearing loss. Noise in any case produces a variety ofadverse physiological and psychological responses. Com-mon among these are speech interference and sleep distur-bance, which may result in reduced productivity for avariety of tasks associated with learning and work. Defini-tive evidence of other non-auditory health effects as a di-rect consequence of aviation noise is not available,11 butsome studies suggest such connections, including hyper-tension in children.12 The most widespread measure ofadverse reactions to living in noisy environments is annoy-ance, a generalized and subjective descriptor that by defi-nition overlaps with the impacts already mentioned. Thereare a variety of well-established procedures and metrics forrelating sound measurements to human annoyance. Thesetake account of the non-uniform response of the human earboth in frequency and amplitude, sensitivity to tonal versusbroadband noise, and levels of background noise. For asingle aircraft operation these effects are usually repre-sented by EPNL measured in decibels (EPNdB). Forcommercial aircraft, EPNL forms the basis of noise certifi-cation standards set under the NCA and subsequentamendments. The EPNL signature of a military aircraft iscontrolled primarily by engine noise. Studies have alsoattempted to determine the impact of aircraft noise on overone hundred different species of domestic and wild mam-mals, birds, and marine mammals. The majority of theliterature indicates that domestic and wild animals exhibitminimal behavioral reactions to military overflights andseem to habituate to the disturbances over a period of timewithout discernible long-term effects.5 In the absence of

Table 1. Residential response to noise levels described by the DNL measure.11
Day-NightAverage
Sound Levelin Decibels
QualitativeDescription
% ofPopulation
HighlyAnnoyed
Hearing LossEffects: Annoyance
AverageCommunity
Reaction
General CommunityAttitude Towards Area
75 andabove
May beginto occur
37% Very severe Noise is likely to be the most important of all adverseaspects of the community environment
70 Will notlikely occur
22% Severe Noise is one of the most important adverse aspectsof the community environment
65 Will notoccur
12% Significant Noise is one of the important adverse aspects of the community environment
60 Will notoccur
7% Moderateto slight
Moderateto slight
Noise may be considered an adverse aspect of the community environment
55 andbelow
Will notoccur
3% Noise considered no more important than various other environmental factors
definitive data on the effect of noise on animals, the U.S.National Research Council has proposed that protectivenoise criteria for animals be taken to be the same as forhumans.13
For assessing the noise impact of a specific base onthe local community, it is more useful to consider a sum-mative measure of the noise produced by flight operations.One such measure is the day-night noise level (DNL), ametric correlated with community annoyance from aircraftnoise. The DNL metric is calculated as the A-weightedsound energy (i.e. accounting for unequal loudness per-ception across different frequencies) averaged over a 24-hour period. A 10 dB penalty is added for nighttimeevents, assuming that night operations are twice as annoy-ing as those occurring at other times of the day because ofthe potential for sleep disturbance and because backgroundnoise is lower at night. The U.S. Federal Aviation Admini-stration (FAA) and DoD employ DNL to determine thecompatibility of airport-local land uses with aircraft noiselevels. Table 1 summarizes community response to noiseas described by DNL.11 At 55 dB DNL (indoors or out-doors) a community will generally perceive aviation noiseas no more important than various other environmentalfactors with about 3% of the population highly annoyed.At 65 dB DNL, 12% of the population may be highly an-noyed and the community will generally consider aviationnoise as one of the important adverse aspects of the envi-ronment. For comparison, the range of exposure to noise inurban areas is typically 58 to 72 dB. Corresponding rangesfor suburban and wilderness areas are 48 to 57 dB and 20to 30 dB, respectively.
It is important to note that while the correlation inTable 1 is a useful gauge of community response, it doesnot necessarily determine when noise ceases to have aneconomic impact on a community (e.g. via property valuedepreciation). Noise mitigation policies based on DNLimplicitly perform a cost-benefit balance, and current DoDand FAA noise planning policies suggest that areas withless than 65 dB DNL levels should not be considered for
noise abatement. However, for both military and commer-cial aviation, most complaints regarding aviation noisecome from areas with a DNL less than 65 dB. Data com-piled by the FAA to evaluate extent of population exposureto commercial aircraft noise levels at or above outdoorurban environments indicates that the number of peopleliving in areas with a DNL of 55 to 65 dB may be 5 to 30times the number of people living with greater than 65 dBDNL. Figure 1 shows the historical evolution of noise ex-posure in these zones and future projections developed bythe FAA. The large reductions in the population affectedby commercial aviation noise indicated by Figure 1 haveresulted primarily from two factors: low noise aircraft op
0
10
20
30
40
50
60
70
80
1975 1980 1985 1990 1995
Sta
ge 2
Dea
dlin
e
Sta
ge 1
Dea
dlin
e
Year
FAA Projection:Aviation growthbalanced bytechnologyadvancementDay-Night
Noise Level
55 dB
65 dB
Peo
ple
(M
illio
ns)
2000
Stage 2Phaseout
Stage 1Phaseout +High Bypass
Ratio Engines
2005 2010 2015 2020
Figure 1. Estimated number of people exposed to commer-cial aircraft noise in the U.S.30 Noise exposure for 65 dBDNL to 1996 estimated from historical FAA sources. Fu-ture estimates calculated using the FAA MAGENTA noisemodel. Exposure to 55 dB DNL is based on scaling from
current population distributions around airports.

erations enabled by advances in aircraft communication,navigation and surveillance, and air traffic management(CNS/ATM) technology, and the phase-out of high noiseaircraft through regulatory action enabled by the availabil-ity of improved engine technology (e.g. as increased by-pass ratio). The importance of the latter, made possiblethrough international agreement and enacted through the1990 Airport Noise Control Act (49 USC App. 2151 to2158), is quite significant. While the total number of air-craft phased-out corresponded to 55% of the fleet in 1990,that portion of the fleet accounted for more than 90% ofthe total cumulative noise at airports. The cost of prema-turely retiring these aircraft has been estimated at between$5B and $10B.14,15 Over the next 20 years, estimates by theFAA suggest that the number of people affected by com-mercial aircraft noise in the U.S. will be constant; in-creases in the number of operations are expected to offsetprojected improvements in technology within the fleet. Toaddress continued noise concerns the FAA has adopted a‘Balanced Approach’—a combination of source reduction(quieter aircraft), land-use planning and management,noise abatement operational procedures, and operatingrestrictions.
The DoD assesses noise exposure at individual mili-tary bases using similar modeling techniques as the FAAfor commercial aircraft. No overall exposure data is avail-able for the military case, but an example comparison be-tween the military and commercial experiences with noiseexposure can be found in the map shown in Figure 2,
Figure 2. Noise exposure mappings of DNL contours forNAS Oceana, NALF Fentress, and NS Norfolk ChambersField with comparison to Norfolk International Airport.Compiled by the DoD Air Installations Compatible UseZones (AICUZ) program using the NOISEMAP model.19
Image data provided by J. Ghosen, Ecology and Environ-ment, Inc., Lancaster, NY, 2001.
which includes three military airfields and one commercialairfield. NAS Oceana and NALF Fentress have perhaps themost significant community noise opposition of any mili-tary airfields. FCLP procedures conducted at these basesrepresent particularly noisy operations, reflected in theextent to which the 65 dB DNL contours reach into thelocal community. In comparison to Norfolk InternationalAirport, the land area exposed to 65 dB DNL or higheraround Oceana is greater by approximately 10 times. Ap-proximately 87,000 people reside within the 65 dB DNLcontours around Oceana and Fentress alone.16 In compari-son, the FAA estimates that cumulatively, approximately500,000 people reside within the 65 dB DNL contoursaround all commercial airports in the United States.17 Abalance between number of operations and the noise levelof the related technology explains the difference in expo-sure area. There are only ~120 take-offs per day at Oceanacompared to the average 210 take-offs per day at Nor-folk.18 However, military aircraft can be significantlynoisier than their commercial counterparts. These techno-logical and operational trends are further elaborated inSection 4. The large contours around Fentress, built tomove FCLP operations from Oceana, are the result of anaverage of 354 FCLP and 20 take-off operations per day19
and reflect the modified, higher altitude FCLP proceduresdiscussed previously. As noted, military aviation has typi-cally relied on operational changes and land-use planningto address these noise concerns.
3.2 Measurement of Emissions ImpactsEmissions impacts are distinct from noise impacts for
a variety of reasons. These include a more direct connec-tion to human and ecosystem health (e.g. morbidity andmortality versus annoyance), a broader range of timescales over which the effects can occur (from a day to100’s of years), and a broader range of length scales overwhich the effects are realized (local, regional and global).As a whole, aviation emissions are expected to increaseand constitute a greater proportion of both the local contri-butions to regional emissions around airports and theglobal anthropogenic climate impact.20,21
The total mass of emissions from an aircraft is directlyrelated to the amount of fuel consumed. Chemical speciesin the exhaust that are of consequence to emissions im-pacts include carbon dioxide (CO2) and water vapor (H2O),nitrogen oxides (NOx), unburned hydrocarbons (UHC),carbon monoxide (CO), sulfur oxides (SOx), other tracechemical species that include the extended family of nitro-gen compounds (NOy), and non-volatile particulate matter(PM). Emissions of CO2 and H2O are products of hydro-carbon fuel combustion and are thus directly related to theaircraft fuel consumption, which in turn is a function of theweight, aerodynamic design, and engine performance ofthe aircraft. Emissions of NOy, non-volatile PM, CO,UHC, and SOx are further related to the manner in whichfuel is combusted within the engine and, to some extent, topost-combustion chemical reactions occurring within the

engine. PM and UHC emissions are additionally dependenton fuel composition. Thus, emissions other than CO2 andH2O are primarily controlled by the engine design, buttotal emissions can be reduced through improvements inoverall fuel efficiency. Such emissions are therefore typi-cally quoted relative to the total amount of fuel burned asan emission index (e.g. g-NOx/kg of fuel).
Local air quality issues around airports focus on thehuman health (e.g. cardiac and respiratory) and welfare(e.g. visibility and acidic precipitation) impacts of ozoneproduction, related to emissions of NOx, CO, and UHC,and changes to ambient concentrations of fine particulates,due to direct perturbations from non-volatile PM emissionsand secondary formation of volatile PM resulting fromconversion of NOy, SOx, and possibly UHC emissions. TheNAAQS determined by the U.S. Environmental ProtectionAgency (EPA) set limits on ozone, and two size ranges ofPM, less than 10 µm (PM10) and less than 2.5 µm(PM2.5). Aviation-related PM emissions are found in thesmaller size range. The remaining NAAQS address CO,SO2, NO2, and lead. Additional chemical species emittedfrom aircraft engines have relevance to climate change.20
Climate change is also associated with a broader range ofimpacts on human and ecosystem health and welfare. 22
Assessments of aviation contributions to local andregional emissions inventories and how they may alter airquality are lacking for military aviation. Furthermore, incontrast to noise assessments, few metrics have been de-veloped to evaluate population exposure to airport airquality impacts. Airport NOx, UHC, and CO emissions,which result from a combination of both aircraft and non-aircraft related ground operations, can be important con-tributors to regional ozone levels. One example is shownin Figure 3, which compares the NOx contributions ofKennedy and LaGuardia airports around New York City tomajor point sources in the region.23 In many regions, air-ports are among the single largest sources with contribu-tions to regional emissions inventories that are typically
1800
1600
1400
1200
1000
800
600
400
200
0KennedyAirport
Hudson Ave.PowerPlant
E.F. BarrettPowerPlant
LaGuardiaAirport
HempsteadIncinerator
Em
issi
on
s (t
on
s p
er y
ear)
Figure 3. Ranking of top sources for NOx emissions for theNew York City metropolitan area.23
several percent of the total.21 For many air quality changes,a direct proportionality between emissions and ambientconcentrations can be assumed as a first order estimate ofimpact.
Health and ecosystem impacts associated with climatechange are related to alterations in surface temperatures,which vary regionally and occur as the result of perturba-tions to the radiative balance of the atmosphere. Changesin this balance are communicated in terms of radiativeforcing, measured in watts per unit of surface area (e.g.W/m2). Positive radiative forcing indicates a net warmingtendency and is typically determined relative to pre-industrial times. Because the majority of aircraft emissionsare injected into the upper troposphere and lower strato-sphere (typically 9-13 km in altitude), aviation emissionsimpacts are unique among all industrial activities. Theimpact of burning fossil fuels at altitude is approximatelydouble that due to burning the same fuels at ground level.The mixture of exhaust species discharged from aircraftperturbs radiative forcing 2 to 4 times more than if theexhaust was CO2 alone. This is largely a result of the ef-fects of NOx and aviation-induced cloudiness (contrailsand cirrus formation), although there is high uncertaintywith respect to the latter. In contrast, the overall radiativeforcing from the sum of all anthropogenic activities is es-timated to be a factor of 1.5 times CO2 alone.20
Figure 4 shows recent estimates of the radiative forc-ing by various aircraft emissions for 1992 and projectionsfor the year 2050 published by the IntergovernmentalPanel on Climate Change (IPCC).20 These estimates trans-late into an estimated 3.5% of the total anthropogenicforcing in 1992 and 5% by 2050 for an all-subsonic com-mercial fleet. For both 1992 and 2050, it is estimated thatthere is a 67% probability that the value for radiativeforcing falls (or will fall) within the range indicated by theerror bars. Thus, for 2050, it is likely that the radiativeforcing due to aircraft alone may fall between 2.5% and13.2% of the total anthropogenic forcing. While broadlyconsistent with these IPCC projections, subsequent re-search reviewed by the Royal Commission on Environ-mental Protection has suggested that the climate impactindicated in Figure 4 is likely to be an underestimate.24 Inparticular, while the impact of contrails is probably over-estimated, aviation-induced cirrus clouds could be a sig-nificant contributor to positive radiative forcing, NOx-related methane reduction is less than shown, reducing theassociated cooling effect, and growth of aviation in theperiod 1992-2000 has continued at a rate larger than thatused in the IPCC reference scenario. The trends discussedin the next section will help assess the extent to which thispotentially significant impact relates to emissions frommilitary aviation.
4 TRENDS IN MILITARY AIRCRAFTENVIRONMENTAL PERFORMANCE
In light of increasing demand for environmental pro-tection and increasing requirements for range access8 to

20501992
3.5% of TotalAnthropogenicForcing
good fair poor poor fair verypoor
fair fair
Rad
iati
ve F
orc
ing
(W
m-2
)
-0.04
0.00
0.04
0.08
0.12
-0.1
0.0
-0.2
0.1
0.2
0.3
0.4
0.5
5% of TotalAnthropogenicForcing
CO2 O3
CH4
DirectSulfate
DirectSulfate H2O
CO2 O3
CH4H2O
DirectSoot
Total(withoutcirrus
clouds)
DirectSoot
Total(withoutcirrus
clouds)
Contrails
good
from NOx
poorpoor poor fair verypoor
fair fair
CirrusClouds
Contrails CirrusClouds
Figure 4. Aircraft radiative forcing estimated for 1992 (+0.05 W/m2 total) and projected to 2050 (+0.19 W/m2 total).20 Notedifferences in scale. Notations below graphs indicate the level of scientific understanding for the impact of each exhaust spe-
cies. The heavier dashed bar for aviation-induced cirrus cloudiness describes the range of estimates, not the uncertainty.
maintain national security, it is valuable to assess trends inthe environmental performance of military aviation sys-tems. This section examines these trends, and in order tohighlight the governing factors, our analysis further re-flects the evolution of military aviation noise and emis-sions characteristics against similar characteristics incommercial aviation. Much of the public pressure to alle-viate aviation environmental impacts derives from theirexperience with commercial aircraft.
The contrasting goals of military and civil aviationlead to systems designed for significantly different mis-sions, and it is the performance and use of these systems,rather than fundamentally different mechanisms of noise oremissions production, that drive differences in operationaland technological trends. This is particularly the case forhigh performance military aircraft. Section 4.1 briefly re-views the functional requirements of military and commer-cial aircraft and their effect on aircraft and engine design,noise, and emissions. Section 4.2 discusses trends in fleetsize and differences in operational tempo between militaryand commercial aviation. Following this, historical trendsin noise and emissions are presented in Sections 4.3 and4.4, respectively. Metrics of comparison were chosen toassess trends in technology as they affect environmentalimpact. Several data sources were used as inputs to theanalysis including emissions and noise data,25-31 fleet andoperational statistics,32-39 and descriptions of aircraft andengine parameters. 40-42 The analysis considers only fixed-wing aircraft.
4.1 Mission Aircraft Requirements, Effects on Design,and Implications for Noise and Emissions
Before discussing specific relationships between air-craft and engine design, and noise and pollutant emissions,
some general observations regarding unique features ofaviation systems relative to other modes of transport willhelp provide useful benchmarks. Compared to land-basedsystems, aviation systems are characterized by more strin-gent weight and volume constraints, and higher complex-ity, and safety is often a more critical issue in design andoperation. These characteristics lead to very long technol-ogy development times (10 to 20 years) and high capitalcosts ($100M for a commercial aircraft, and as high as $1Bfor some military aircraft). Further, aircraft typically havevery long service lives, 30 years for commercial and up to100 years planned for selected military systems (such asthe B-52). Technology evolution and uptake is thus slowerthan in other forms of transportation. The average age ofthe Air Force fleet is approximately 21 years38 whereasthat of the U.S. commercial fleet is 13 years. 32
The mission requirements of commercial and militaryaircraft differ, with the exception of military aircraft usedfor fuel tankering and transportation (which constituteabout half of the military fleet). As a result, specific designtrades are made that affect the environmental performanceof the systems. In particular, commercial aircraft are de-signed to maximize range for a given fuel and passengerpayload. In doing so, fuel efficiency becomes the mostimportant metric. However, for military aircraft and inparticular fighter aircraft, maneuverability is a prime de-sign driver in addition to range. Thus, the thrust-to-weightratio of the aircraft is often as important as fuel efficiency.This difference drives the design of many military andcommercial engines in different directions.
Commercial aircraft tend to use high-bypass ratio en-gines with large frontal areas, an application suitable onlyfor subsonic flight. Compared to military engines, they arerelatively larger in size and weight. Because of the corre

19701960 1980 1990 2000Year
0
2000
4000
6000
8000
10000
12000
14000
16000
No
. of
Air
craf
tTotal Air Force and NavyAir ForceTotal Commercial
Figure 5. Military and commercial fleet sizes.32,34,35,38,40
spondingly low exit velocities, these engines also are rela-tively quieter than engines with lower mass flows andhigher exit velocities. In contrast, many military aircraftmissions mandate engines of high thrust-to-weight for ma-neuverability, and low frontal area to minimize drag forsupersonic flight and to provide better integration with theairframe for low-observability requirements. Thus, the sizeand weight of the propulsion system are more importantand high specific thrust (thrust per unit mass flow) enginesare typically used. These engines have higher noise be-cause of the higher exit velocities. Military aircraft canalso cause sonic boom at high speeds, but such operation isalmost always restricted to non-residential areas. Bothtypes of engines suffer from high NOx emissions sinceboth employ high temperatures and pressures to increaseefficiency and thrust per unit mass flow.
4.2 Fleet Size and Operational TempoWhile the size of the fixed-wing military aviation fleet
is larger than the commercial fleet, military aircraft areflown at a much slower operational tempo. This has sig-nificant implications for noise and fuel use. Figure 5 showsthat over the past decade, the fixed-wing military fleet hasdramatically contracted, as older systems have been retiredand fewer, multi-mission capable aircraft introduced asreplacements. Currently the combined Air Force and Navyfleet numbers roughly 9000 aircraft and the commercialfleet numbers approximately 6000 aircraft. Note that in2000 there were roughly 5500 aircraft in the Army fleet,however only 4% of these were fixed-wing aircraft.43 Incontrast, the commercial fleet has grown, driven by anapproximately 4% long-term annual growth in demand forair travel 33 and despite an historical increase in the numberof seats per aircraft.46 Note that subsequent to the events ofSeptember 11, 2001, total revenue passenger kilometers(RPK) fell by 8% and fuel burn by 16%, comparing 2-yearaverages before and after.39 In addition, the percentage ofthe commercial fleet parked increased from 6% to 13%.
0
1
2
3
4
5
6
1988 1990 1992 1994 1996 1998 2000Year
Op
s/D
ay
Large Commercial Total Commercial Total Air Force and Navy
Figure 6. Average number of daily operations for commer-cial and military aircraft.34-39 Each flight is considered oneoperation. In other references, each take-off and landing
may be considered as separate operations, resulting in twooperations per flight.
However, future projections estimate a resumption of thelong-term growth trend within the next several years.33
As revenue generation is a primary motivation, utili-zation of commercial aircraft is much higher than formilitary aircraft. As shown in Figure 6, large commercialaircraft are flown on average 4.7 times per day. To arriveat an estimate for military operational tempo, data for fly-ing hours per year 37 were combined with estimates forflying hours per operation for generic aircraft types foundin Metwally 44 to estimate operations per year for each typeof aircraft. The result indicates a much lower usage of ap-proximately 0.35 times per day, a factor of approximately13 less than their commercial counterparts. Historicaltrends in noise and emissions described in the followingsections demonstrate that these differences in operationaltempo largely offset differences in technology perform-ance between the military and commercial fleets.
4.3 Historical Trends in NoiseMilitary aircraft are, in general, noisier than commer-
cial aircraft on a single event basis, particularly in certainmodes such as afterburning. Figure 7 presents noise levelsfor military and commercial aircraft presented in terms ofEPNL for a single overflight at 1000 ft (~305 m). For ref-erence, an increase of 10 EPNdB is roughly equivalent to adoubling of annoyance for a single event. It is important tonote that the flight profiles used in take-off and landing aregenerally different for each type of military and commer-cial airplane. Using a 1000 ft (~305 m) flyover is a con-sistent basis for comparison for all of these aircraft, but isone step removed from the community noise impact sinceaircraft-specific operational measures are absent. Forcommercial aircraft the 1000 ft (~305 m) flyover data areon average 10% higher than certified take-off noise with arange of 0% to +23%.30 The correspondence with actualmilitary noise exposures at take-off averages 5% with a

1950 1955 1960 1965 1970 1975 1980 1985 1990 1995 2000 2005Year of Introduction or Deploy Date
Large Commercial Com Ops Weighted Average EPNL 1000 ft flyoverMilitary TF/TJ Only Mil Ops Weighted Average EPNL 1000 ft flyoverMilitary Afterburner
B1-B
B52-H
A10-A
F117-A
F14-A
F14-BF14-D
F15-A/B F15-C/D
F15-EF16-A
F18-A/B
F18-C/D
F18-E/F
EA-6B
S-3B
OA10-A
C-141A/B/C C-17A
C-21A
C-5A/B
KC-10A
KC-135A/E/T
KC-135R
T-1A
T-37B
T-39B T-45AF16-C/D
AV-8B
B707-100B
B720-000B
B707-300B
DC-9-10
DC-9-30
B737-100/200
B727-200/231A
DC-10-10
B747-200/300
B747-100
DC-10-30/40L1011-1/100/200
DC-9-50
MD-80/DC-9-80
L1011-500TristarB767-200/ER
B737-300
B757-200/300A310-200/300
B747-400
A230-100/200MD-11
B737-500/600
B777-200/ER
B737-400
70
80
90
100
110
120
130
EP
Nd
B
F22(est.)
Figure 7. Effective perceived noise level for military and commercial aircraft, 1000 ft (~305 m) flyover operation.29,34-39 Op-erations-weighted fleet averages are shown.
range of –3% to +10% based on comparison with dataprovided in Shahady.31 The high noise from tactical mili-tary aircraft is a direct result of the high specific thrustengines employed by these aircraft. Where new productioncommercial aircraft noise has declined by approximately15 EPNdB from 1960 to 1995, there has been an increasein noise from new military fighter aircraft over the sameperiod. There is, however, no evidence of discernabletrends for other types of military aircraft.
These historical characteristics are manifest in thefleet average noise levels tracked in Figure 7, calculated asthe logarithmic, operations-weighted average EPNL for thefleet based on the number of operations performed by eachaircraft in each year for which data was available. For air-craft with afterburners it is assumed they are used 50% ofthe time. From the commercial data, a 10 to 15 year lag isapparent between the introduction of new technology andthe time for the fleet to reach the equivalent average per-formance. This is a reflection of the long service lives ofcommercial aircraft. In Figure 8, 1000 ft (~305 m) flyoverdata is shown, organized by the number of operations foreach aircraft type in 1990 and 1998 in the Air Force andNavy fleets. Similar information is given for the commer-cial fleet. By performing a logarithmic sum of the EPNdBdata for each aircraft for each operation as a function ofyear, it is possible to compare in an approximate way thebalance between number of operations and noise intensityin determining the noise impact of the fleet. When such anenergy sum is made, data for military and commercial air-craft fall on top of one another as shown in Figure 8. Thecalculation again assumes aircraft with afterburners use
them 50% of the time. Although 1000 ft (~305 m) flyoverdata is only representative of the single event noise expo-sures, Figure 8 suggests that the high noise levels of mili-tary aircraft make up for the small number of operations incomparison to commercial aircraft. This is certainly thecase for the specific example shown in Figure 2.
4.4 Historical Trends in EmissionsFlying hours data 32,37 were combined with fuel flow
factors 36 to estimate historical trends in fleet fuel use andefficiency for military aircraft. These trends have a directrelationship to CO2 emissions, and when combined with arelevant emission index can be used to develop an under-standing of the state of the military fleet with respect toother pollutants such as NOx. These analyses are pertinentto both local air quality and climate change impacts.
Approximately 2-3% of the total fossil fuel use in theUnited States is currently attributed to aviation. This repre-sents about 14% of that used by the transportation sector asa whole.39,45 As indicated by the total fuel use trends inFigure 9, the commercial aircraft fleet currently burns ap-proximately 7 times the fuel used for military aviation(Navy and Air Force only). Where total fuel use for com-mercial aircraft has increased, for military aircraft totalfuel use has decreased. Although there are more aircraft inthe fixed-wing military fleet than in the commercial fleet,military aircraft are flown much less frequently. As a re-sult, Air Force and Navy fuel use for aviation is currentlyabout 0.4% of total U.S. fossil fuel use. The increase infuel burn for commercial aviation is a reflection of growthoutpacing technological improvement. Considering the

0
500
1000
1500
2000
2500
3000
3500
4000
90-100 100-110 110-120 120-130EPNdB Bin
(a)
Op
erat
ion
s (t
ho
usa
nd
s)
1990 Large Commercial1998 Large Commercial1990 Military TJ/TF Only1998 Military TJ/TF Only
170
172
174
176
178
180
1990 1995 2000Year of Introduction or Deploy Date
EP
Nd
B
Military TF/TJ OnlyLarge Commercial
(b)
Figure 8. Effective perceived noise level for military and commercial aircraft, fleet summary, 1000 ft (~305 m) flyover opera-tion.29.34-39 In (a), the number of operations is shown, categorized by aircraft type and noise level for activity in 1990 and 1998.
In (b), the cumulative noise level is shown as an energy sum.
disproportionate radiative effect of aviation fuel burn rela-tive to ground-based sources discussed in Section 3.2,these fuel use levels suggest that U.S. military aviation(excluding the Army) may be responsible for approxi-mately 1% of the total U.S. impact on the climate.
Trends in fuel efficiency, presented on a consumptionper time basis are shown for military aircraft in Figure 10.The evolution of the energy intensity for the U.S. fleet andfor individual aircraft by year of introduction based onoperating data for the period 1991-1998 is given in Figure11. Thirty-one aircraft types are represented covering over85% of all domestic and U.S. originating or arriving inter-national RPKs performed by the 10 major airlines.46 En-ergy intensity is a measure of how much fuel it takes tomove one passenger a unit distance (e.g. mega-Joules offuel energy per revenue passenger kilometer, MJ/RPK).Because military aircraft are optimized for a broad rangeof mission requirements, there is no obvious trend towards
0
20
40
60
80
100
1970 1975 1980 1985 1990 1995 2000Year
To
tal F
uel
Co
nsu
med
(b
illio
n li
ters
)
Total CommericalTotal Military (AF and NAVY)
Figure 9. Fuel use for commercial and military aviation.34-39
improved fuel efficiency as in the commercial fleet. How-ever, the importance of fuel efficiency, even for tacticalaircraft, is well recognized.47 Besides reducing operatingcosts, fuel efficiency provides greater warfighting capabil-ity since less fuel must be tankered or transported, therebyenhancing mobility and reducing logistical requirements.
While reducing energy intensity or fuel consumptiontends to reduce overall emissions, there are barriers inher-ent to air transportation that can act counter to the realizedbenefit. Reductions in emissions are hindered by the rela-tively long lifespan and large capital cost of individualaircraft and the inherent lag in the adoption of new tech-nologies throughout the aviation fleet as a result. Forcommercial aircraft, year-to-year variations in fuel effi
1955
1960
1965
1970
1975
1980
1985
1990
1995
2000
Year of Introduction (or Year for Fleet Average)
Fu
el C
on
sum
pti
on
(lit
ers/
hr)
10,000
5,000
0
15,000
A-10AAV-8B
B-1B
B-52H
Fighter/Attack Bomber Transport/Tanker
Trainer Reconnaissance/Other
C-130EC-130H
C-130J
C-141A/B
C-17
C-21A
C-5A/B
E-2C
EA-6BF-117A
F-14A/B/D
F-15A/B/C/D/E
F-16C/D
F-18A/B/C/D
Fleet Average - All
KC-10A
KC-135A/E
KC-135R
MC-130EOA-10AP-3C
S-3BT-1AT-34CT-37B
T-38T-44A
T-45A
Figure 10. Historical trends in fuel efficiency for militaryaircraft.34-38
0
1
2
3
4
5
6
7
1955 1960 1965 1970 1975 1980 1985 1990 1995 2000
Year (or Year of Introduction for New Technology)
En
erg
y In
ten
sity
(M
J/R
PK
)
Short range
Long range
B707-300
B707-300B
B720-000B720-000B
B727-200/231A
B737-100/200
B707-100B
B737-300
DC9-10
DC9-30
DC9-40 DC9-50
MD80/DC9-80All
B737-400
B737-500/600
B757-200
B767-200/200ER B767-300/300ER
B747-100
B747-200/300
B747-400B777
A300-600/R/CF/RCF
A310-300
A320-100/200
DC10-30
DC10-10
DC10-40
MD-11
L1011-1/100/200
L1011-500
Fleet Average(31 Aircraft Types)
Fleet Average(Entire U.S.)
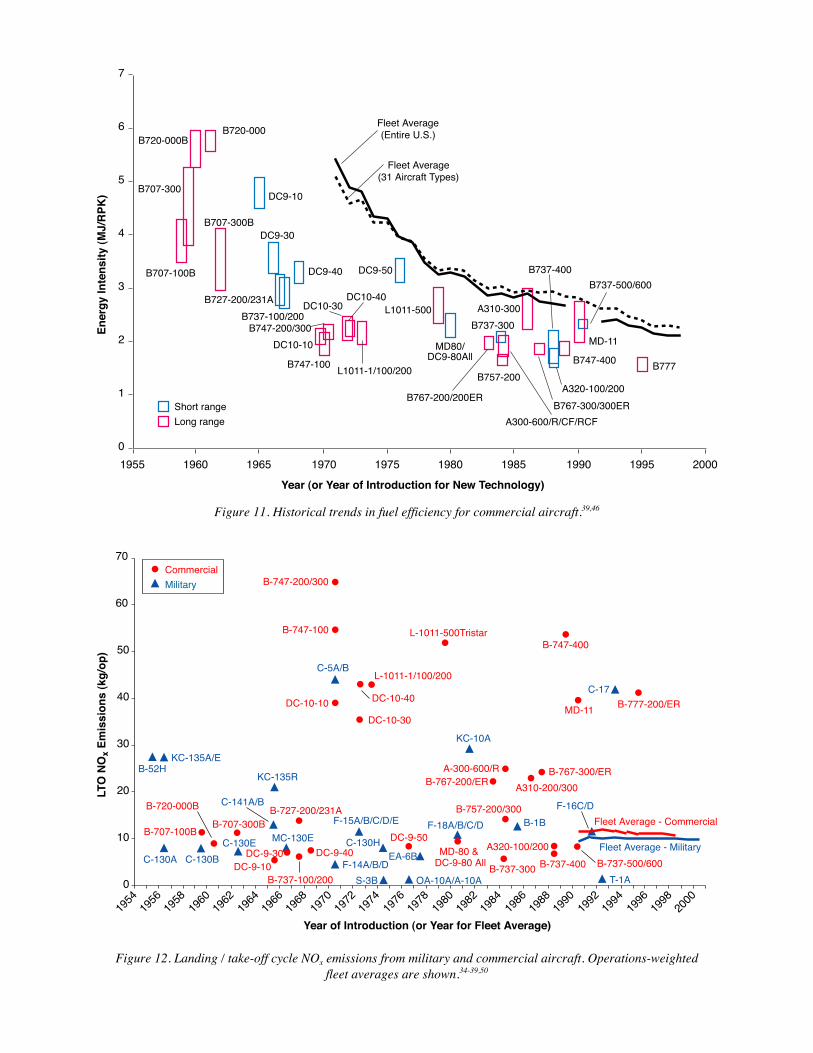
Figure 11. Historical trends in fuel efficiency for commercial aircraft.39,46
70
60
50
40
30
20
10
0
1954
1956
1958
1960
1962
1964
1966
1968
1970
1972
1974
1976
1978
1980
1982
1984
1986
1988
1990
1992
1994
1996
1998
2000
Year of Introduction (or Year for Fleet Average)
LTO
NO
x E
mis
sio
ns
(kg
/op
)
Commercial
Military
C-130A C-130B
KC-135A/E
B-1B
B-52H
C-130E
C-141A/B
C-17
C-5A/B
EA-6BF-14A/B/D
F-15A/B/C/D/E
F-16C/D
F-18A/B/C/D
KC-10A
KC-135R
MC-130E
OA-10A/A-10AS-3B T-1A
Fleet Average - MilitaryC-130HB-707-100B
B-707-300B
B-720-000B B-727-200/231A
B-737-500/600
B-747-400L-1011-500Tristar
B-737-400B-737-300B-737-100/200
B-757-200/300
B-767-200/ERB-767-300/ER
B-777-200/ER
DC-9-10DC-9-30 DC-9-40
DC-9-50MD-80 &
DC-9-80 All
A-300-600/R
A310-200/300
A320-100/200
DC-10-10
DC-10-30
DC-10-40MD-11
L-1011-1/100/200
B-747-100
B-747-200/300
Fleet Average - Commercial
Figure 12. Landing / take-off cycle NOx emissions from military and commercial aircraft. Operations-weightedfleet averages are shown.34-39,50

ciency for each aircraft type, due to different operatingconditions, such as load factor, flight speed, altitude, androuting controlled by different operators, can be ±30%, asrepresented by the vertical extent of the data symbols inFigure 11. A combination of technological and operationalimprovements has led to a reduction in energy intensity ofthe entire U.S. fleet of more than 60% between 1971 and1998, averaging about 3.3% per year. In contrast, totalRPK has grown by 330%, or 5.5% per year over the sameperiod. Growth is anticipated to continue at a rate ~4% peryear after recovery from the downturn following the eventsof September 11, 2001.33
Because of the high temperatures and pressures withinboth commercial and military aircraft engines, NOx tendsto be the most difficult of the local air quality pollutants tocontrol. NOx emissions are thus a useful, conservativebenchmark for the impacts of aviation on local air quality.Trends in NOx emissions for commercial and military air-craft on a per-operation basis are shown in Figure 12. Con-sistent with the certification standards, the data representall emissions that occur below 3000 ft (~915 m) altitude.The large variability between different aircraft is mainlyattributable to the wide range of thrust levels and enginepressure ratios across the aircraft in Figure 12. Note inparticular that high values are typically found for large,long-range aircraft. These aircraft also have generallyhigher fuel efficiencies than other aircraft types as shown
in Figure 11, highlighting the strong trade-off between fuelefficiency and NOx. In improving the emissions perform-ance of future aviation systems, such trade-offs are inevi-table.
On average, per operation, there is minimal differencebetween the NOx characteristics of commercial and mili-tary aircraft. Operations-weighted fleet averages for com-mercial and military aircraft are almost identical and havebeen nearly constant over the last ten years. When theroughly constant fleet-average NOx emissions per flightare combined with the changes in number of flights peryear for military and commercial aircraft, the overall im-pact of commercial aircraft on local air quality has risenwhereas that for military aviation has declined. These re-sults are depicted in Figure 13 where it can also be seenthat the total NOx emissions from commercial aircraft arenearly 6 times those of military aviation. Less than 1% ofall U.S. mobile source emissions of NOx come from com-mercial, military and general aviation aircraft.48,49
5 CONCLUSIONS AND RECOMMENDATIONSTo explain the factors that govern the relationship
between military aviation and the environment, this paperhas presented a review of the current issues and trendsrelated to noise and emissions impacts. Against a backdropof increasing public concern about the environment andincreasing regulatory stringency, the impact of military
aviation on the environment has decreased when averagednationally. This is a result of roughly constant levels oftechnology performance coupled with reduced numbers ofaircraft and operations and is reflected in terms of fuelburn, total NOx emissions, and integrated measures ofcommunity noise. Nonetheless, environmental issues areincreasing in importance in terms of their impact on na-tional security. Encroachment on training and constraintson basing choice directly result from requirements to as-sess and minimize environmental impact. Trends forcommercial aviation have been quite different, with evolu-tionary improvements in technology coupled with rapidgrowth in numbers of aircraft and operations. These haveled to generally increased environmental impacts fromcommercial aviation for emissions and decreased impactsfor noise over the period considered (1960-2000).
There has been a significant change in public willing-ness to accept noise from aircraft. While the number ofpeople living in a contour of constant noisiness in the U.S.has been reduced by a factor of 15 over the last 30 years,noise complaints and associated constraints on airport ex-pansion and airline operations continue. Against this trend,commercial aircraft are generally getting quieter at a rateestimated to almost balance the increased number of op-erations in the future. Similarly, military aircraft are pro-ducing a roughly constant level of community noise.Notably, the relatively small number of operations bymilitary aircraft does not compensate for the relativelyhigh level of single event noise, which is at least twice asannoying on average than commercial aircraft. As the de-
mand for environmental amenities such as quiet grows, asareas around bases become increasingly urbanized, and asrequirements for range use increase, noise constraints onmilitary aviation are expected to rise.
Trends in NOx emissions were employed in this dis-cussion as a surrogate for air quality impacts from militaryaviation. New military and commercial aircraft tend tohave higher NOx emissions than older aircraft as a by-product of the higher temperatures and pressures used inmodern engines for reduced fuel burn and higher thrust-to-weight ratio. While the contraction of the military fleet has
1988 1990 1992 1994 1996 1998 2000Year
To
tal N
Ox
Em
issi
on
s (m
illio
n k
g)
100
50
0
Total Commercial
Total Military (AF and NAVY)
Figure 13. Total NOx emissions from the commercial andmilitary fleets. 34-39,50

reduced the total national NOx emissions, the contractiontypically came about through base closures. Therefore thelocal air quality impact around any one base may be ex-pected to increase as new aircraft such as the Joint StrikeFighter are introduced into the fleet. This is a particularlyimportant issue for the military with respect to the confor-mity requirements of the CAA.
The policy outlook for the impact of climate issues onmilitary aviation is uncertain. Aviation is currently respon-sible for approximately 2-3% of U.S. fossil fuel use.Roughly 0.4% is attributable to military aviation. How-ever, fuel burn at altitude is estimated to lead to a dispro-portionate impact on the environment (by roughly a factorof two). Thus it can be approximated that 1% of all U.S.anthropogenic forcing of the climate is presently related tomilitary aviation. Whereas commercial aviation is ex-pected to see improvements in fuel burn averaging about1% per year,46 similar improvements are not expected formilitary aviation. This is because of the unique require-ments for speed and maneuverability for military aircraft,such that fuel burn is not always the dominant design re-quirement, and also because of the very slow evolution ofthe military fleet due to high capital costs. The average ageof the military fleet is 21 years versus 13 years for thecommercial fleet.
It is critical to establish and monitor trends nationallyas part of communicating changes in environmental im-pact. This should include maintaining estimates of thenumber of people impacted by military aviation noise andemissions. This review is intended to help launch a consid-eration of the factors that determine information needsconcerning environmental impact, but also to highlight thattools and processes to assess the national security impactof various operational restrictions are not available. This isperhaps the most important challenge for the DoD inachieving an effective balance of national security andenvironmental impact. Currently, the DoD has little spe-cific quantitative information to assess impacts of envi-ronmental restrictions on training and readiness.
ACKNOWLEDGEMENTSWe thank the mentors for the Defense Science Study
Group, personnel from the Institute for Defense Analyses,and the many members of the Defense Department whoprovided information for this study. Holly Whitt of theInstitute for Defense Analyses library was particularlyhelpful in obtaining the data and references used in thestudy. We also thank Diana Park of the MIT Gas TurbineLaboratory for her work in producing this paper.
REFERENCES1. United States Department of Defense, “FY 2001 De-
fense Environmental Quality Program Annual ReportTo Congress,” Office of the Deputy Under Secretary ofDefense (Installations and Environment), 2001.
2. United States Department of Defense, “Implementationof the Department of Defense Training Range Compre-
hensive Plan: Insuring Training Ranges Support Train-ing Requirements, Report to the Congress,” Office ofthe Under Secretary of Defense (Personnel and Readi-ness), February 2004.
3. United States Department of Defense, “Readiness andRange Preservation Initiative,” Defense EnvironmentalNetwork and Information Exchange [online], URL:http://www.denix.osd.mil/denix/Public/Library/Sustain/RRPI/rrpi.html, [cited June 2004].
4. Pike, J., “Naval Auxiliary Landing Field (NALF) Fen-tress,” GlobalSecurity.org [online], URL:http://198.65.138.161/military/facility/fentress.htm[cited May 2002].
5. United States Air Force, “Final Environmental ImpactStatement for Initial F-22 Operational Wing Beddown,”Air Combat Command / CEVP, Langley Air ForceBase, Virginia, November 2001.
6. Engleman, L., “Draft Airborne Noise EncroachmentAction Plan, Pre-Decision Working Paper,” SustainableRanges Outreach Committee, Department of Defense,United States Air Force, Bases and Units Branch,Washington, D.C., 2001.
7. Fallon, Adm. W.J., “Statement before the House Com-mittee on Government Reform on Constraints on Mili-tary Training,” Department of Defense, Office of theChief of Naval Operations, Washington, D.C., May 9,2001.
8. Bowers, T., “Draft Air Quality Action Plan, Pre-Decision Working Paper,” Sustainable Ranges Plan,Department of Defense, Office of the Chief of NavalOperations, Washington, D.C., 2001.
9. Fargo, Adm. T.B., “United States Pacific Fleet Brief-ing,” United States Pacific Fleet, Pearl Harbor, HI,,June 21, 2001.
10. Levin, Sen. C., and Warner, Sen. J., “Senate and HouseComplete Conference on National Defense Authoriza-tion Bill for Fiscal Year 2002,” Press Release, UnitedStates Senate Committee on Armed Services, Wash-ington, D.C., December 12, 2001.
11. Federal Interagency Committee on Aircraft Noise,“Federal Agency Review of Selected Airport NoiseAnalysis Issues,” Washington, D.C., August 1992.
12. World Health Organization, Guidelines for CommunityNoise, edited by B. Berglund, T. Lindvall, and D. H.Schuela, Cluster of Sustainable Development andHealthy Environment, Department of the Protection ofthe Human Environment, Occupational and Environ-mental Health. Geneva, Switzerland, 1999.
13. National Research Council, “Guidelines for PreparingEnvironmental Impact Statements on Noise,” Report ofWorking Group 69, Assembly of Behavioral and SocialSciences, Committee on Hearing, Bioacoustics, andBiomechanics, Washington, D.C., 1977.
14. Morrison, S. A., Winston, C., and Watson, T., “Fun-damental Flaws of Social Regulation: The Case of Air-plane Noise,” The Journal of Law and Economics, Vol.XLII, October 1999, pp. 723-743.

15. United States General Accounting Office, “Aviationand the Environment: Transition to Quieter AircraftOccurred as Planned, but Concerns About Noise Per-sist: Report to the Ranking Democratic Member,Committee on Transportation and Infrastructure,House of Representatives,” GAO-01-1053, Washing-ton, D.C., September 2001.
16. Downing, M., Schmidt-Bremer, M., Kanzler, J., andAmefia, K., “Noise Study for the Introduction of theF/A-18E/F to the East Coast,” Wyle Acoustics Group,Wyle Laboratories, WR 02-08, prepared for the De-partment of the Navy, Engineering Field ActivityChesapeake, Naval Facilities Engineering Command,Washington, D.C., April 2003.
17. National Research Council, “For Greener Skies: Re-ducing Environmental Impacts of Aviation,” Commit-tee on Aeronautics Research and Technology forEnvironmental Compatibility, Aeronautics and SpaceEngineering Board, Washington, D.C., 2002.
18. Norfolk International Airport, “Frequently AskedQuestions,” URL:http://www.norfolkairport.com/faq_answers2.html#planes, [cited June 2004].
19. United States Navy, “Air Installation Compatible UseZone (AICUZ) Study for NAS Oceana and NALFFentress,” Naval Air Station Oceana, Virginia Beach,VA, 1999.
20. Intergovernmental Panel on Climate Change, Aviationand the Global Atmosphere, edited by J.E. Penner,D.H. Lister, D.J. Griggs, D.J. Dokken, and M. McFar-land, Cambridge University Press, Cambridge, UK,1999.
21. United States Environmental Protection Agency,“Evaluation of Air Pollutant Emissions from SubsonicCommercial Jet Aircraft, Final Report,” EPA 420-R-99-013, Engine Programs and Compliance Division,Office of Mobile Sources, Ann Arbor, MI, preparedfor EPA by ICF Consulting Group, April 1999.
22. Intergovernmental Panel on Climate Change, “ClimateChange 2001: Synthesis Report,” contribution ofWorking Groups I, II, and III to the Third AssessmentReport of the Intergovernmental Panel on ClimateChange, Cambridge University Press, Cambridge, UK,2002.
23. Stenzel, J., Trutt, J., and Cunningham, C., “Flying OffCourse, Environmental Impacts of America’s Air-ports,” National Resources Defense Council, October1996.
24. United Kingdom Royal Commission on EnvironmentalPollution, “The Environmental Effects of Civil Air-craft in Flight,” Special Report, London, U.K., No-vember 29, 2002.
25. United States Environmental Protection Agency, “Pro-cedures for Emission Inventory Preparation, VolumeIV: Mobile Sources,” EPA 420-R-92-009, EmissionPlanning and Strategies Division, Office of MobileSources, and Technical Support Division, Office of Air
Quality Planning and Standards, Washington, D.C.,1992.
26. Environmental Quality Management, and Weston,R.F., “Aircraft Engine and Auxiliary Power UniteEmissions Testing Final Report,” prepared for theUnited States Air Force, IERA/RESQ, Brooks AirForce Base, Texas, December 1998.
27. International Civil Aviation Organization, Engine Ex-haust Emissions Data Bank [online database], URL:http://www.qinetiq.com/home/markets/aviation/aircraft_engine_exhaust_ emissions_databank.html, [citedJuly 2002].
28. Scott, “Aircraft Air Pollution Emission EstimationTechniques,” Air Force Center for Environmental Ex-cellence, Civil and Environmental Engineering Devel-opment Office, Air Force Engineering and ServicesCenter, Brooks Air Force Base, TX, September 1978.
29. United States Federal Aviation Administration, Inte-grated Noise Model, Noise Level Database, Version6.0c, Office of Environment and Energy, Washington,D.C., September 2001.
30. United States Federal Aviation Administration, “NoiseLevels for U.S. Certificated and Foreign Aircraft,”Advisory Circular 36-1G, Office of Energy and Envi-ronment, Washington, D.C., August 1997.
31. Shahady, P.A., “Military Aircraft Noise,” Paper 73-1291, presented at AIAA/SAF 9th Propulsion Confer-ence, Las Vegas, Nevada, November 5-7, 1973.
32. BACK Aviation Solutions, Fleet PC Database, Version4.0, New Haven, CT, 2001.
33. United States Federal Aviation Administration, “FAAAerospace Forecasts Fiscal Years 2004-2015,” FAA-APO-04-1, Office of Aviation Policy & Plans, U.S.Department of Transportation, March 2004.
34. United States Navy, “Actual Analysis Report, Version1261, Fiscal Years 1990-2000,” provided by A.Fowler, N78CF, Naval Operations Staff (OPNAV),Washington, D.C., 2001.
35. United States Air Force, “The USAF Summary,” Di-rectorate of Management Analysis, Comptroller of theAir Force, February 1978.
36. United States Air Force, “Command Unique MDSAVFUEL Factor Summary, FY 2000 AFCAIG Cy-cle,” Assistant Secretary of the Air Force (FinancialManagement and Comptroller), Washington, D.C.,2001.
37. United States Air Force, “History of USAF FlyingHours for Planning and Programming” A-41 Report,provided by D. J. O’Neil, Air Force Training Division(AF/XOOT), Washington, D.C., 2001.
38. United States Air Force, “United States Air Force Sta-tistical Digest FY2000,” Assistant Secretary of the AirForce (Financial Management And Comptroller),Washington, D.C., 2001.
39. United States Department of Transportation, Air Car-rier Summary Data (Form 41 and 298C SummaryData) [online database], Bureau of Transportation Sta-

tistics, URL: http://www.transtats.bts.gov, [cited1999].40. Bushnell, D. M., “Application Frontiers of ‘Designer
Fluid Mechanics’: Visions versus Reality,” AIAA 98-0001, 1998.
41. Gunston, B., Jane’s Aero-Engines, Jane’s InformationGroup. Alexandria, Virginia, 1998.
42. Jane’s Information Group, Jane’s All the World’s Air-craft 1960-2000, Samson Low, Martin & Co., NewYork, 1999.
43. Hinson, E., “Army Aviation Usage Data,” UnitedStates Army, Army Logistics Support Center, Red-stone Arsenal, AL, 2001.
44. Metwally, M., “Jet Aircraft Engine Emissions Data-base Development: 1992 Military, Charter and Non-scheduled Traffic,” NASA CR-4684, November 1995.
45. Energy Information Administration (EIA), AnnualEnergy Review, United States Department of Energy,Washington, DC, 2001.
46. Lee, J.J., Lukachko, S.P., Waitz, I.A., and Schafer, A.,“Historical and Future Trends in Aircraft Performance,Cost and Emissions, “Annual Review of Energy andthe Environment, Vol. 26, 2001.
47. Defense Science Board (DSB), “More Capable War-fighting Through Reduced Fuel Burden,” Task Forceon Improving Fuel Efficiency of Weapons Platforms,Office of the Under Secretary of Defense for Acquisi-tion, Technology, and Logistics, Washington, DC,January 2001.
48. United States Environmental Protection Agency, “Na-tional Air Quality and Emissions Trends Report,1999,” EPA-454/R-01-004, Office of Air QualityPlanning and Standards, Emissions Monitoring andAnalysis Division, Air Quality Trends Analysis Group,Research Triangle Park, NC, March 2004.
49. United States General Accounting Office, “Aviationand the Environment: Strategic Framework Needed toAddress Challenges Posed by Aircraft Emissions: Re-port to the Chairman, Subcommittee on Aviation,Committee on Transportation and Infrastructure,House of Representatives,” GAO-03-252, Washington,D.C., February 2004.
50. United States Federal Aviation Administration, Emis-sions and Dispersion Modeling System, EmissionFactors Database, Version 6.0, Office of Environmentand Energy, Washington, D.C., 2001.