Embed Size (px)
Citation preview

2
Is a comprehensive, community-owned healthcare system focused on
achieving measurable, better value for our customers. Our mission is to
improve the health of our communities.
Appleton
Medical Center 160-Bed Acute Care
Medical Center
ThedaCare
Physicians Employing Over
125 Physicians
At 22 Locations
Ingenuity First Offers Innovative
Solutions to Employers
For Health Care Costs
Gold Cross
Ambulance Service Jointly Owned With
Affinity Health
Systems
Theda Clark
Medical Center 260-Bed Acute Care
Medical Center
New London Family
Medical Center 25-Bed Acute Care
Medical Center
Riverside
Medical Center 25-Bed Acute Care
Medical Center
ThedaCare at Home Home Health, Hospice,
DME, Respiratory
Therapy, Infusion,
Pharmacy Services
ThedaCare at Work Occupational and
Employee Health
Services, Employee
Assistance Program
Orthopedics Plus The New Standard for
Quick, High Quality
Orthopedic Services
In The Fox Cities
The Heritage/
Peabody Manor Continuing Care
Campus for Older
Adults
ThedaCare
Behavioral Health Inpt and Outpt Mental
Health, Substance
Abuse Services
Fox Cities
Community Clinic A Free Clinic Jointly
Owned With
St. Elizabeth Hospital
Shawano
Medical Center 25-Bed Acute Care
Medical Center
6,600 employees - located in Eastern
Wisconsin

A Community of Problem Solvers Delivering MBV
3
5 10 15 ??
K
Lean “Grad” School
. We are Here
100% of employees are problem
solvers improving something every
day!!!
Time (years)
Edu
cation
/Skill Level

How is your hospital or health system performing today?
4

What does the future look like?
5
2015?
2020?

Family of Four – Total PPO Cost Versus Median Family Income
6
% of Income 15% 18% 26% 45% 42% 38%
Sources: PPO cost 2002-2011, Milliman; median family income 2002-2011, Census Bureau Notes: 2011 family income is an estimate for Federal FY12; total PPO cost = employer contribution, employee payroll deduction, and employee out-of-pocket co-pays/deductibles. Numbers rounded to nearest hundred.

The Word of the Moment in Healthcare Is “Unsustainable”
The size of the federal budget deficit is unsustainable
The annual increase in the Medicare budget is unsustainable
The percentage of healthcare spending to GDP is unsustainable
State Medicaid programs are unsustainable
The continued transfer of costs to employers and consumers is unsustainable
7

8
Do you feel a sense of urgency?

What actions will be necessary to preserve your margin?
9
What impact will those actions have on your overall
performance?
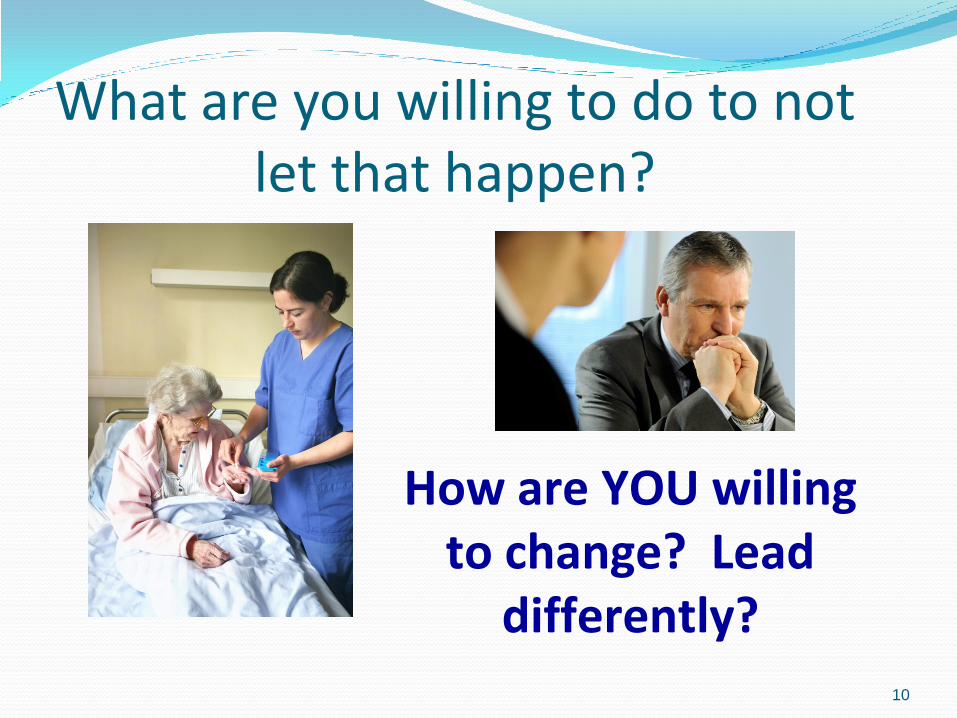
What are you willing to do to not let that happen?
10
How are YOU willing to change? Lead
differently?


What is Lean About?
12
• Providing Value to Our Customers
• Continuous Improvement
• Engaging People in Problem Solving
• Respect for People
• Identify and Eliminate Waste


Elements of Lean Processes
14


Respect for People
No Layoff Philosophy
Reassignment Process
Candor with Respect
Learning Environment
Communicate!
Engage staff and physicians in problem solving
16

Problems are Opportunities – Failures are okay!!
17

Lean Tools
18
• PDSA (Plan, Do, Study, Act) – A3
• Rapid Improvement Event (Kaizen Event)
• Value Stream Mapping
• 2P/3P (Process, Preparation, Production)
• 5S (Sort, Scrub, Straighten, Safety, Standardize, Sustain)
• Strategy Deployment

Background
Why are you talking about it ?
Tell the story
Current Situation
Where do we stand ?
What’s the problem?
Analysis
- What is the root cause(s) of the problem?
- What requirements, constraints and
alternatives need to be considered?
Goal Where we need to be?
What is the specific change you
want to accomplish now?
Plan
What activities will be required for
implementation and who will be responsible
for what and when?
Recommendations/Experiments
What is your proposed countermeasure(s)?
How will you know it is working?
Follow-up/Study/Adjust
How we will know if the actions have the
impact needed? What remaining issues can
be anticipated ?
A3/PDSA thinking

What is a Rapid Improvement Event? •A two to five day focused improvement activity
•It has aggressive, measurable objectives
• Emphasis on the elimination of unnecessary non value-adding activities
•Rapid Implementation (during the event)
•Anticipate the work to really begin after the event – followup and sustainment

21
Value Stream Mapping
• 2-4 day process to create a future state picture and action plan to create
breakthrough and fundamentally change how we perform a process
• Starts with the customer and their requirements
• Includes understanding the flow of the product being transformed as well as the
flow of information
• Identifies key problems to be worked
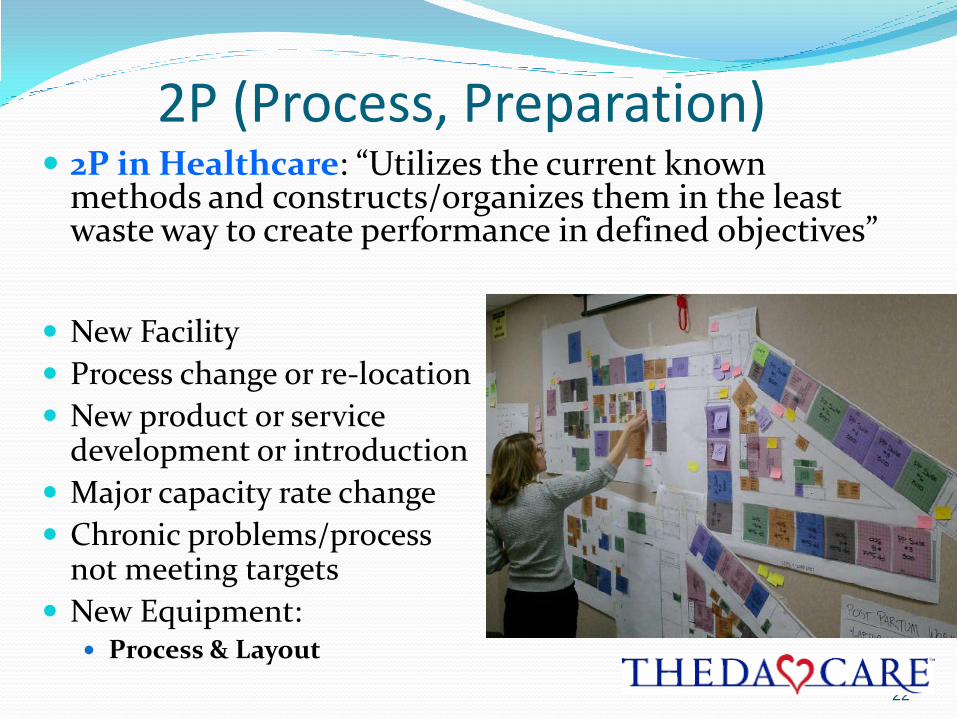
2P (Process, Preparation)
22
2P in Healthcare: “Utilizes the current known
methods and constructs/organizes them in the least waste way to create performance in defined objectives”
New Facility
Process change or re-location
New product or service development or introduction
Major capacity rate change
Chronic problems/process not meeting targets
New Equipment: Process & Layout

23
GET RID OF WHAT'S
NOT NEEDED 1: SORT
2: STRAIGHTEN
3: SCRUB
4: SAFETY
6: SUSTAIN
5: STANDARDIZE
6-S APPLIES
TO ALL AREAS
AUDIT AND IMPROVE
ORGANIZE WHAT IS NEEDED (VISUAL MANAGEMENT)
CLEAN UP (SEE AND SOLVE)
ADDRESS UNSAFE ACTS, CONDITIONS, MOTIONS
ESTABLISH
WHO / WHAT / WHEN
FOR UPKEEP
SELF-DISCIPLINE
AND CARE
6S

Strategy Deployment
ThedaCare’s
Strategic
Plan
Safety
(level 2)
People
(level 2) People
level 2 A3 Safety
(level 2) Safety
(level 2) Safety
(level 2) Safety
(level 2) Safety
(level 2) Safety
level 2 A3
Shared Growth
(level 2) Shared Growth
(level 2) Shared Growth
(level 2) Shared Growth
(level 2) Shared Growth
(level 2) Shared Growth
level 2 A3
Productivity
(level 2) Productivity
level 2 A3
Safety A3
(level 1)
People A3
(level 1)
Shared
Growth A3
(level 1)
Productivity A3
(level 1) Plan Plan Plan Plan
ThedaCare’s Breakthrough Objectives
“Measurably Better Value”
Cross
Function
Team
Cross
Functional
Team
Cross
Function
Team
Cross
Function
Team
Cross
Function
Team
Cross
Function
Team
Cross
Function
Team
Cross
Function
Team
Cross
Functional
Team
Cross
Function
Team
Cross
Function
Team
Cross
Function
Team
Cross
Function
Team
Cross
Function
Team
Cross
Functional
Team
Cross
Function
Team
Cross
Functional
Team

Leadership – The Key to Lean
25

26
“We have been trying to add Toyota Production System practices and principles on top of our existing management thinking and practice without adjusting that thinking and practice.” Mike Rother from Toyota Kata

27
“Culture is an idea arising from experience. That is, our idea of the culture of a place or organization is a result of what we experience there. In this way, a company’s culture is a result of its management system…culture is critical, and to change it, you have to change your management system.” Creating a Lean Culture by David Mann
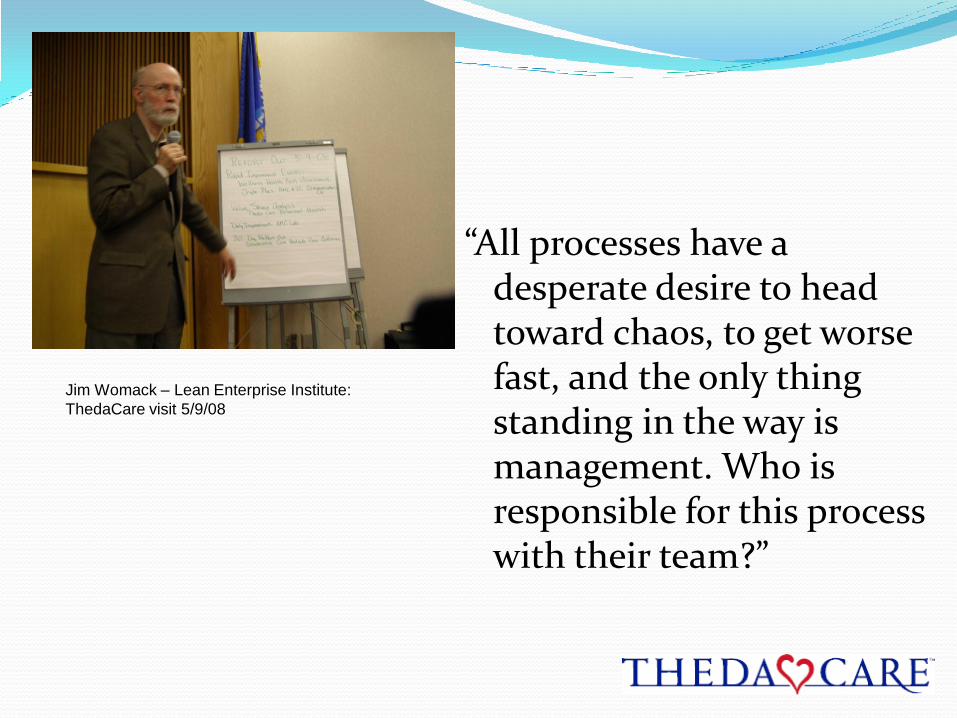
“All processes have a desperate desire to head toward chaos, to get worse fast, and the only thing standing in the way is management. Who is responsible for this process with their team?”
Jim Womack – Lean Enterprise Institute:
ThedaCare visit 5/9/08

Leadership In Lean
29
• Lean is much more about
transforming the way we lead than
any tool.
• Paradigm shift: leader as a
teacher of problem solving instead
of solving problems

Staff
Leads/Supervisors
Manager
Executives
Where the work happens
that provides value to the
customer
Customers
Customers

My Story
31

Lean Management System
No Meeting Zone
Daily Stat Sheets
Leader Standard Work
Daily Performance Huddles with Team
Monthly Scorecard Reviews
PDSA thinking
Process Observation Calendaring
Visual Management
32

NO MEETING ZONE
33
Won’t we just
have to stay
later in the
day?
How do you
possibly make
that stick? People don’t
actually follow
it do they?
When will we
really get
things done?
I nice idea
but…..?

VP Daily/Weekly Stat Sheet Kim B.
Dates
Monday Tuesday
Daily Measures
Safety
How many Patients/Families or staff are at Risk?
Quality
Any Quality Opportunities or concerns?
Falls, bundles, med rec/errors
Patient complaints/Follow Ups
People : Any Staff with Problems/Barriers?
Who needs the most support today (weakest link)
Any Physician or Leadership issues?
Any thing, staff or provider to recognize or celebrate
today?
Delivery
Any areas that Demand exceeeds Capacity
For Oncology- Any non- oncology pts on the floor ?
How many filled beds ? 16 beds 16 beds
How is care management helping to progress care today
How many discharges planned today?
Department: Inpt Oncology Manager 3S Inpatient Oncology
Daily Measures
Safety
How many patients or staff are at risk?
infections
interpreter concerns
employee injuries
Quality
Any quality opportunities or concerns?
falls, bundles, med. Rec/errorsAny patient complaints/Follow ups?
Any equipment or room concerns?
People
Any staff with special concerns or barriers?
Who needs the most support how can we help them?
Any physician or leadership concerns?
Any thing, staff or provider to recognize or celebrate today?
How are you planning on covering lunches and breaks?
Any care management concerns?
Delivery (Service and Timeliness)
Daily Stat Sheet Manager to VP

Leader Standard Work
35

Daily Performance Huddle
36
PICK Chart
New Improvement
Opportunities
S Q C P F
Work In Progress
“Just Do Its”
PDSAs
Improvement Ideas
Implemented
Daily
Tracking
Monthly
Tracking

Hospital Leadership Team
True North Metrics
Hospital Leadership Team Monthly Performance
Review
Monthly Performance Communication Diagram
Leadership Teams, Monthly Scorecards and Monthly Performance Reviews
Vice President Leadership
Team
Vice President Leadership Team Monthly Performance
Review
COO
Ops VP
Mgr 2 Mgr 1
Mgr 3 Mgr 4
… Repeat for each VP
VP Drivers
Manager Leadership
Team
Manager Leadership Team Monthly Performance Review
Mgr
… Repeat for each Manager
Business Unit Drivers
4th or 5th
Business
Day
6th or 8th
Business
Day
3rd Monday
of the month
Lessons Learned Shared
Stratification of Red Metrics
Lessons Learned Shared
Stratification of Red Metrics
The manger meets with
leadership team following defined
Standard Work around scorecard.
When areas are not meeting goal-
countermeasures are developed.
VP meets with managers
around their scorecards.
Countermeasures summaries
are presented, and additional
resources are allocated if
needed.
The VP’s meet together to
discuss their scorecard as it
relates to strategic
deployment and True North

Problem Solving A3 Template

Process Observation Calendaring
Sun Mon Tue Wed Thu Fri Sat
Process Observation Pareto
Processes No
vem
ber
D
ece
Jan
ua ry
Fe
bru ary
Mar
c h
Ap
ril
May
Jun
e
July
A
ugu
s t Se
pte
mb
er
Oct
ob
er
No
vem
ber
D
ece
mb
er
Example Process White Board
PCB Problem Solving Tool (tollgates/delays) I&O
Pain Management
Environmental Safety
Safe Patient Handling Care Plan Notes
Purposeful Rounding Fall Bundle

40

Lessons Learned
41
•Adopting lean means adopting a new way of leading •Involve customers wherever possible
•Communicate early and often to line staff
•Engage key stakeholders
•Teach people to fish – don’t just give them the fish (ask questions, don’t give answers) •Once you’ve implemented a change, you’ve only just begun (you’re only at the ‘D’ in PDSA) •Don’t underestimate the pull of process to go back to their original state, regardless of how great the new process seems


91
65
52
37 37
45
0
10
20
30
40
50
60
70
80
90
100
2005 2006 2007 2008 2009 2010
Min
ute
s
Year
AMC Code Stemi Door to Balloon 2005-2010 (Goal 60 min)
CODE STEMI

212
154 140
93 93 89
0
50
100
150
200
250
2005 2006 2007 2008 2009 2010
Min
ute
s
Year
ThedaCare Remote Stemi-6 sites 2005-2010
(Goal 90 min)
1st of 6 remote sites initiated
Remote STEMI

82
60
0
10
20
30
40
50
60
70
80
90
2009 2010
Min
ute
s
Year
Field Stemi 2009-2010 (EMS contact to reperfusion)
(Goal 90 min)
Field STEMI

Isolated CABG Mortality
% O
pera
tive M
ort
ali
ties

79.01 79.11 79.10 79.15 79.23
79.33 79.34 79.50 79.53
79.63 79.79
79.90
78.00
79.00
80.00
81.00
Jan-11 Feb-11 Mar-11 Apr-11 May-11 Jun-11 Jul-11 Aug-11 Sep-11 Oct-11 Nov-11 Dec-11
Baseline and Current HAT Scores Monthly Most Current Mean HAT Score
All ThedaCare Employees
Target
EE Actual & YTD HAT Score
Feb-11 Removed
Shawano Medical
Center.
Employees
2011 TARGET: 80.0
% Improvement: 1.25%
2009 Baseline: 77.5
2011 YTD: 79.9
YTD % Improvement: 3.0%
2011 Wellness Monthly Scorecard Current HAT Scores All ThedaCare Employees

NET A/R Days
32
34
36
38
40
42
44
46
48
50
52
54
56
58
Apr-
08
May-
08
Jun-
08
Jul-
08
Aug-
08
Sep-
08
Oct-
08
Nov-
08
Dec-
08
Jan-
09
Feb-
09
Mar-
09
Apr-
09
Month 2008
Nu
mb
er
of
da
ys
AMC/TC
NLFMC
Physician
ServicesTarget
System AR

Cost per Case
49
Average Cost per case inliers, fully loaded
$3,000
$4,000
$5,000
$6,000
$7,000
$8,000
$9,000
$10,000
Bas
eline
2006
-07
Feb-0
7
Mar
-07
Apr
-07
May
-07
Jun-
07
Jul-0
7
Aug
-07
Sep
-07
Oct-0
7
Nov-
07
Dec-
07
Jan-
08
Feb-0
8
Mar
-08
Apr
-08
May
-08
Jun-
08
Jul-0
8
Aug
-08
Sep
-08
Oct-0
8
Nov-
08
Dec-
08
Jan-
09
Feb-0
9
Mar
-09
Apr
-09
Collaborative Care
model implementedAvoidable Day Production
control implemented

Collaborative Care Outcomes through 2010
•Financial Indicators represent a subset of the patients to demonstrate impact of the delivery model. Excluded from both baseline and pilot are:
observation patients, ICU patients, and LOS >15 days. Pilot numbers includes: Admits from ED to Unit, or direct admits to unit. 2006 is updated
baseline.
•Case mix was not significantly different between collaborative care and non-collaborative care
•Updated from: "Writing the new playbook for health care: lessons from Wisconsin," 2009, Health Affairs, 28, p.1348
•Copyright © 2011 ThedaCare. All Rights Reserved.
Measure Pre-
Collaborative
Care (2006)
End of
2007
End of
2008
2009 2010 Compares to non-
Collaborative Care
units thru 2009
Defect-Free
Admission
Medication
Reconciliation
1.05 defects per
chart
0.01
defects
per chart
0 defects 0 defects 0 defects 1.25 defects per chart
without RPh
Patient
Satisfaction
(number of
patients rating
care 5 out of 5)
68% 87% 90% 86% 95% Not captured for other
units.

Measure Pre-
Collaborative
Care (2006)
End of
2007
End of
2008
2009 2010 Compares to non-
Collaborative Care
units thru 2009
Length of
Stay*
(In days)
3.51 2.92 3.09 3.05 2.91 3.5
30-day
re-admission
rate
No data No data 13.98% 13.7% 12.9% 15.2% (2009)
14.7% * (2010)
Average Cost
Per Case*
(using
Medicare RCC)
and restated in
current dollars
$6512 $5024 $6326 $5789 $5781 $7775
Collaborative Care Outcomes through 2010 (Continued )
* This is all medical surgical unit re-admissions from a comparable non-collaborative care unit in the same hospital

Pa
rt A
& B
Me
dic
are
Ex
pe
nd
itu
re in
Do
lla
rs
* 2008 Medicare Data
* $57 Billion/yr in savings if all are at Outagamie spending levels

Where can you get help?
53
Learn from each other!
Get your hands dirty!
Go and See!

Caution when going to see…
54
• Lean is not about ‘other peoples’ solutions
• Focus on how they are leading through
the process and on the methods used to
create the solutions

55
1. Identify the crisis 2. Create a lean promotion office 3. Find change agents 4. Map your value streams 5. Engage senior leaders early in
strategy deployment 6. Acquire and disperse knowledge
broadly 7. Teach a man to fish 8. Involve suppliers in lead 9. Restructure your organization into
product families

Lean Enterprise Institute: www.lean.org
ThedaCare Center for Healthcare Value:
www.createhealthcarevalue.com
Healthcare Value Network: www.healthcarevalueleaders.com