Embed Size (px)
Citation preview

Migration fromNorth-Eastern Region toBangalore: Level andTrend Analysis
Marchang Reimeingam

ISBN 978-81-7791-227-2
© 2016, Copyright Reserved
The Institute for Social and Economic Change,Bangalore
Institute for Social and Economic Change (ISEC) is engaged in interdisciplinary researchin analytical and applied areas of the social sciences, encompassing diverse aspects ofdevelopment. ISEC works with central, state and local governments as well as internationalagencies by undertaking systematic studies of resource potential, identifying factorsinfluencing growth and examining measures for reducing poverty. The thrust areas ofresearch include state and local economic policies, issues relating to sociological anddemographic transition, environmental issues and fiscal, administrative and politicaldecentralization and governance. It pursues fruitful contacts with other institutions andscholars devoted to social science research through collaborative research programmes,seminars, etc.
The Working Paper Series provides an opportunity for ISEC faculty, visiting fellows andPhD scholars to discuss their ideas and research work before publication and to getfeedback from their peer group. Papers selected for publication in the series presentempirical analyses and generally deal with wider issues of public policy at a sectoral,regional or national level. These working papers undergo review but typically do notpresent final research results, and constitute works in progress.

MIGRATION FROM NORTH-EASTERN REGION TO BANGALORE:
LEVEL AND TREND ANALYSIS
Marchang Reimeingam1
Abstract Migration from North Eastern Region (NER) to the rest of India (ROI) in general and to Bangalore in particular has increased. The rate of migration from NER to Karnataka has declined steadily; however, to Bangalore it has slightly increased. Urban people from NER show a higher tendency to migrate to Bangalore which is not the case for migrants from NER to ROI. Migration level from NER in Karnataka as well as in Bangalore is relatively insignificant. Migrants from NER are not choosing Karnataka as migration destination as before. Migrants from NER in Bangalore and Karnataka were dominated by males. Conversely, females dominated migration from NER in ROI. Males, unlike females, continue to prefer and choose Bangalore as one of their favourite migration destinations. NE people, particularly males, migrated to Karnataka and specifically to Bangalore mainly for education and employment. Females migrated mostly due to family migration. Migration from NER to Bangalore for employment and education has increased while migration along with their family has declined recently.
Introduction Migration from North Eastern Region (NER) to the rest of India (ROI) especially in the big cities such as
Delhi, Mumbai, Bangalore, Kolkata and Chennai has been noticeably increasing in recent times. The
paper examines the level, pattern and trend of migration from the region – covering Arunachal Pradesh,
Assam, Manipur, Meghalaya, Mizoram, Nagaland, Sikkim and Tripura – specifically to Bangalore urban
agglomeration (hereafter Bangalore) using an available secondary data from the Population Census of
India. Most of the migrants likely migrated in big cities like Bangalore for various pursuits such as
employment or studies apart from other reasons. They migrate to big cities for some definite reason as
“new employment opportunities are coming up in selective sectors and in a few regions/urban centres”
(Kundu, 2007:353).
Migrant based on census data in this paper refers to those migrants defined by place of last
residence (POLR) with all duration of residence including unspecified durations. POLR unclassifiable as
rural or urban is included in the total. For data comparison the reason for migration such as family
moved of 1991 was classified as moved with household category of 2001. The reason for migration
namely natural calamities like drought, floods, etc is club in the category others in 1991. The reason for
migration such as moved after birth that was added in 2001 census was separately classified.
The basic objective of study is to understand the underlying reasons for migration from the
region. The paper begins by examining the concept and definition of the migrants from Population
Census as well as National Sample Survey (NSS) which is followed by a brief review of literature on
migration emphasizing on migration from the region to elsewhere in India. Subsequently, the level,
pattern and trend, and the different reasons such as education, employment etc for out-migration from
1 Assistant Professor in CSSCD, ISEC, Bangalore, thanks the anonymous referee. The referee’s suggestion to
incorporate field study in Bangalore to enrich the study of migrants from NER to Bangalore by providing qualitative information including reasons for migration (employment, education and marriage), reasons for preferring Bangalore, racial prejudice and discrimination, etc would be undertaken in the future as further study. Usual disclaimers apply.

2
the region to the rest of India, Karnataka and Bangalore in 1991 and 2001 are analysed using simple
proportion.2 Finally, a precise concluding remark is made.
Concept and Definition of Migrants Migrants are not required to be registered in India either at the place of origin or at the place of
destination (Bhagat, 2005). In lack of registration of migrants, Census and NSS are the two main
sources of migration data in India. Census provides data on migrants based on place of birth (POB) and
place of last residence (POLR).3 Migrants defined on the basis of POB or POLR are called the lifetime
migrants because the time of their move is not known (Visaria, 1980). Moreover, POB “migration data
are not particularly useful indicator of trends in movement because they provide no information on
timing of the movement” (Skeldon, 1986:761).
If the POB or POLR is different from the place of enumeration, a person is defined as a
migrant. A person is considered as migrant by POB if the place in which the person is enumerated
during the census is other than the person’s POB. As a person could have migrated number of times
during his lifetime, migration by POB would not give a correct picture of the migration taking place
currently. A person, on the other hand, is considered as migrant by POLR, if the place in which the
person is enumerated during the census is other than the person’s place of immediate last residence. By
capturing the latest of the migrations in cases where persons have migrated more than once, the
concept of migrants by POLR would give a better picture of current migration scenario. At the time of
enumeration in census, a person could have moved from another village or town in the same district, or
from another district of the state, or another state in India or even from another country. Census
provides migration data on all these migration streams by both the concepts to understand the
dynamics in the movement of population and the broad reasons behind. Thus a person is considered as
a migrant when he/she is enumerated in census at a different place than his/her POB or POLR.
Meanwhile NSSO has been carrying out all-India household surveys once in five year in order to know
the employment and unemployment situation and information on internal migration in the country.
Being sample survey, the data have obvious limitations and are not helpful knowing the district level
2 Census of India 2011 has not released D-Series migration data. NSS data on migration could not be incorporated
due to the differences in coverage; for example census data is available for Bangalore UA whereas NSS does not provide unit level data for the same.
3 According to the census of India (2001) till 1961 census, migration data was presented with reference to POB only. The information on POB was being collected since 1872. In 1961 the scope of collecting information on migration was enlarged by including the rural or urban status of the place of birth and duration of residence at the place of residence. Since 1971 Census, data are being collected on the basis of POLR in addition to question on birth place. In 1981 census, the scope of enquiry on migration has been further widened by collecting information on reason for migration from POLR in addition to the enquiry made in 1971 census. Thus a question on reason for migration was introduced for the first time in 1981. The pattern adopted in 1991 and 2001 Census remained same as in 1981 except that in 2001 Census, the rural urban status of POB was not collected. The reasons for migration includes employment, education, family moved (moved with households in 2001), marriage, and others in 1981; two category such as business and natural calamities like drought etc were included in 1991; however, the category natural calamities as one of the reasons for migration in 1991 was excluded and a new reason such as moved after birth was added in 2001. The “others” includes all other reasons for migration not covered by work/employment, business (1991 and 2001), education, family moved, marriage, natural calamities (1991) and moved after birth (2001). This includes cases like movement due to retirement, movement for economic reasons such as setting up of shops, starting of business, etc in 1981. However, since the census of 1991, “business” has been categorised as one separate reason for migration.

3
pattern in the internal migration within each state. The concept of usual place of residence (UPR) is
adopted by NSS to define migrants. UPR is defined as a place (village/town) where the person had
stayed continuously for a period of six months or more. According to NSS, a migrant is defined if the
person had stayed continuously for at least six months or more in a place other than the place where
the person was enumerated. The village/town where the person had stayed continuously for at least six
months or more prior to moving to the place of enumeration was referred to as the last usual place of
residence of that migrated person (NSSO, 2001).
Literature Review The basic cause of voluntary migration is to achieve maximum individual satisfaction through obtaining
better employment or wage or security or environment (Santhapparaj, 1996). Indeed people tend to
migrate to maximise their welfare (Faggian and McCann, 2006). In India, recent migrants do have a
strong tendency to migrate to localities which had previously attracted natives of their region
(Greenwood, 1973). It indicates that Indian migration process is largely a type of chain migration.
MacDonald and MacDonald (1964:82) defined chain migration as “that movement in which prospective
migrants learn of opportunities, are provided with transportation, and have initial accommodation and
employment arranges by means of primary social relationships with previous migrants.” Past migrant
flows can be expected to influence current migration for several important reasons. Family and friends
who have previously migrated from one region to another may provide information about their present
location to persons residing in their former place of residence. Former migrants may also provide
temporary food and shelter as well as ease social transition (Levy and Wadycki, 1973). NE migration is
also largely a chain migration (Marchang, 2011). Chain migration increases the population of migration
destination thereby create certain problems like congestion, overcrowding of educational institutions,
unemployment and other that reduce quality of life. However, when they are employed and make some
remittances it further contribute to chain migration by aiding in both funding and interest in migration.
Dimova and Wolff (2009:1) noted that besides the recognized benefits remittances provide to the
economies of the home countries of immigrants, money sent home can lead to chain migration. They
posit that remittances can provide the necessary capital. It benefit not only the money sent to families
at home but also valuable information about their life, environment, work, education and information to
guide other prospective migrants in the family or community to ease their journey.
It is a well-known fact of economic history that material progress usually has been associated
with the gradual but continuous transfer of economic agents from rural based traditional agriculture to
urban oriented modern industry. A process of labour migration from a low productivity rural job directly
to a higher productivity urban industrial job particularly in less developed countries is a one-stage
phenomenon. For Todaro (1969:139) for ‘more realistic picture of labour migration in LCD would be one
that views migration as a two-stage phenomenon. The first stage finds the unskilled rural workers
migrating to an urban area and initially spending a certain period of time in the so-called “urban
traditional” sector. The second stage is reached with the eventual attainment of a more permanent
modern sector job’.

4
Mukherji (2001) pointed out that migration especially towards largest metropolises of India has
a nature of low quality – illiterate or semi-literate peasants and labourers – migration. Meanwhile,
numerous studies (Jackson, 1969; Rossi, 1980; Friedlander and Roshier, 1966 as cited in Cote, 1997) in
Britain have found that the propensity to migrate increases with an increase in educational
qualifications. Migration is massively associated with late adolescence and the early 20s (Rees, 1979 as
cited in Cote, 1997). In India, the rural to urban migration is the important flow for literate youth
migrants (Sebastian, 1989).
North east people are increasingly migrating towards different destinations such as the
National Capital Region, Mumbai, Bangalore, Chennai to mention few in search of opportunities despite
problems and racial discrimination. Many of them are youth and have substantially increased
(Marchang, 2008 and 2011). For example, Census of India (2001) recorded that half of the NE migrants
to Delhi were youth in the age group of 15-29 years of age. About 96 percent of the NE migrants to
Delhi were youth (Marchang, 2011). A similar study by Usha and Shimray (2010) and Remesh (2012)
showed that about 90 percent of the NE migrants were youth in the age group of 15-30 years.
Marchang (2008 and 2011), Usha and Shimray (2010), Chandra (2011) and Remesh (2012) concluded
in their recent studies of NE migrants to Delhi that major push factors include lack of educational
infrastructures, growing unemployment problems, social unrest and political tension. Racial prejudice
and discrimination were common and obvious to them. Studies by Chandra (2011) concluded that in
Delhi a racial discrimination against North East people has increased and social profiling is the root
cause of racial discrimination from North East India. Further, Marchang (2008 and 2011), Usha and
Shimray (2010), Chandra (2011) and Remesh (2012) concluded that pull factors of migration from NER
include better environment of educational and job opportunities. They established that many of them
were students or employed in formal and informal salaried employments including retail sectors,
hospitality, BPO, etc. Globalisation has widened employment opportunities in BPO, hospitality industries,
shopping malls etc. Sachdeva (2005) opined that the culture of bandhs in the NER have created
disorder with the education system. Gooptu and Sengupta (2012) assumed that the population of NER
in Bangalore was estimated at 2.5 lakh in 2012.4 A large number of Northeasterners are employed in
organised as well as unorganised sectors such as in hospitality, retail and BPO jobs in Bangalore.
Moreover, Remesh (2012) established that migrants from the NER to Delhi are from relatively rich
segment, better economic condition and better educational background. They are largely educated who
have completed matriculation and above education (Marchang, 2011 and Remesh, 2012).
4 This figure seems to be overestimated when compared with the size and trend of census data. However, a recent
study by the Centre for North East Studies and Policy Research, Jamia Millia Islamia, entitled as “Discrimination and Challenges before Women from North East India: Case Studies from four metros - New Delhi, Mumbai, Kolkata and Bengaluru” estimated migrants from NER to Delhi, Mumbai, Kolkata, Bangaluru, Hyderabad, Pune and Lucknow to be over 414850 (India Tomorrow News, 2014). For women migrants, the study concluded that Delhi is the most unsafe place (81% responded they were harassed or discriminated) followed by Bangalore (60%) and Kolkata; and Mumbai the safest city.

5
Out-migration from NER The level of social and economic development at origin and destination of migration determines the
magnitude of migration. People of NER are increasingly migrating outside the region (Table 1). In 1991
only 1.47 percent of the total migrants in the ROI, i.e. states and UTs in India excluding the eight NE
states, were from the region. In the following decade it increases to 1.87 percent. Most of them
continue to originate from rural areas, as shown in Table 2, which is true for both males and females. In
1991 about 57 percent of the migrants from the region to the ROI were from rural area that has
increased to 65 percent in 2001.
Table 1: Share (%) of migrants from NER to ROI
Last residence
Migration stream
1991 2001
Person Male Female Person Male Female
NER
Total-Rural 1.97 2.46 1.76 3.23 2.18 3.69
Rural-Rural 1.83 2.27 1.67 3.32 1.86 3.88
Urban-Rural 2.14 2.49 1.90 2.15 2.26 2.07
Total-Urban 1.19 1.16 1.23 1.21 1.10 1.33
Rural-Urban 0.98 0.91 1.08 0.89 0.76 1.08
Urban-Urban 1.35 1.41 1.29 1.58 1.59 1.57
Total-Total 1.47 1.47 1.46 1.87 1.33 2.33
Rural-Total 1.37 1.30 1.42 1.90 1.03 2.62
Urban-Total 1.49 1.58 1.41 1.66 1.68 1.65
Notes: ROI figures include migrants from NER; however, the total states exclude NER. ROI in 1991
excludes J&K and eight NE states of India; and in 2001 all eight NE states are excluded.
Source: Author’s calculation based on Census of India, 1991 and 2001.

Table 2: Rural-urban distribution (%) of migrants from NER to Bangalore, Karnataka
and ROI
Course of migration Last residence
Place of enumeration
1991 2001 Sex Ratio
Person Male Female Person Male Female 1991 2001
NER to Bangalore
Total UA 3780 1900 1880 6429 3816 2613 989 685 Rural UA 27.78 24.21 31.38 27.36 27.46 27.21 -- --
Urban UA 66.14 67.37 64.89 66.25 66.01 66.59 -- --
NER to Karnataka
Total Total 11180 5010 6170 12258 7542 4716 1232 625 Rural Total 45.17 33.73 54.46 37.68 38.37 36.58 -- --
Urban Total 49.73 59.28 41.98 55.54 55.08 56.28 -- --
Outside Karnataka* to Karnataka
Total Total 1600231 693422 906809 2074471 945236 1129235 1308 1195 Rural Total 51.53 45.75 55.95 52.63 47.86 56.62 -- --
Urban Total 46.69 52.15 42.52 41.02 45.31 37.43 -- --
NER to ROI
Total Total 379473 167967 211506 754406 247965 506441 1259 2042 Rural Total 56.62 51.86 60.41 65.03 48.76 73.00 -- --
Urban Total 39.41 43.72 35.99 27.38 39.64 21.37 -- --
NER population
Total 31953771 16603656 15350115 38857769 20065658 18792111 925 937 Rural 86.17 85.75 86.63 84.34 84.04 84.66 -- --
Urban 13.83 14.25 13.37 15.66 15.96 15.34 -- -- Notes: Italic figures are in numbers. Figures may not sum up to 100 due to the exclusion of unclassifiable migrants in rural or urban. ROI includes all states of India
excepting J&K and eight NE states in 1991 and eight NE states in 2001. *States in India beyond the state (Karnataka) of enumeration.
Source: Same as Table 1.

Table 3: Migrants from NER to Karnataka as percentage to outside Karnataka to Karnataka
Last residence Migration stream 1991 2001
Person Male Female Person Male Female
NER
Total-Rural 0.74 0.83 0.69 0.50 0.95 0.27
Rural-Rural 0.62 0.56 0.65 0.38 0.80 0.19
Urban-Rural 1.00 1.25 0.80 0.97 1.41 0.61
Total-Urban 0.67 0.67 0.67 0.64 0.74 0.54
Rural-Urban 0.60 0.51 0.70 0.47 0.53 0.41
Urban-Urban 0.67 0.71 0.63 0.77 0.90 0.63
Total-Total 0.70 0.72 0.68 0.59 0.80 0.42
Rural-Total 0.61 0.53 0.66 0.42 0.64 0.27
Urban-Total 0.74 0.82 0.67 0.80 0.97 0.63
Note: Outside Karnataka – States in India beyond the state (Karnataka) of enumeration.
Source: Same as Table 1.
During 1991-2001 migration from the region to the state of Karnataka declines from 0.70 to
0.59 percent (Table 3). However, in terms of absolute number it slightly increased from just over eleven
thousand in 1991 to over twelve thousand in the following decade (Table 2). These migrants largely
originated from urban areas as presented in Table 2. Migrants chose to migrate to urban areas due to
the better availability of facilities and services such as infrastructure, amenities etc.
Migrants from the region are gradually relinquishing Karnataka as their migration destination
especially among the females when compared to the migrants from the region to the ROI. As much as
2.95 percent of the migrants from the region to the ROI migrated to Karnataka in 1991 (Table 4). In
2001, it dropped to 1.62 percent due to the considerable change in the migration behaviour among the
females who no longer choose Karnataka as their destination likely due to a far distance factor. During
this period, for males, there was a slight increase in the migration level from the region to Karnataka.
However, migration data on migrants from the region to Bangalore shows a slight
improvement in migration rate that is mainly contributed by the male migrants. Table 5 shows that the
share of migrants from the region to Bangalore in the all migrants to Bangalore has increased from 0.77
to 0.80 percent during 1991-2001. It has declined for migrants from rural NER to Bangalore. Whereas
for migrants from urban NER migrating to Bangalore, the share has increased for males as well as for
females indicating that urban people from NER in comparison with urban people from other than NER
has a higher tendency to migrate to the Bangalore. This seems to be invalid for rural people migrating
to Bangalore.

8
Table 4: Migrants from NER to Karnataka as Percentage to NER to ROI
Migration stream 1991 2001
Person Male Female Person Male Female
Total-Rural 2.75 2.87 2.68 0.89 2.83 0.39
Rural-Rural 2.35 1.98 2.54 0.63 2.71 0.26
Urban-Rural 4.14 4.89 3.46 3.10 4.59 1.91
Total-Urban 3.12 3.06 3.18 2.59 3.16 2.04
Rural-Urban 2.35 1.90 2.82 1.76 2.14 1.39
Urban-Urban 3.57 3.76 3.38 3.34 4.15 2.59
Total-Total 2.95 2.98 2.92 1.62 3.04 0.93
Rural-Total 2.35 1.94 2.63 0.94 2.39 0.47
Urban-Total 3.72 4.04 3.40 3.30 4.23 2.45
Note: ROI includes all states of India excepting J&K and eight NE states in 1991 and eight NE states
in 2001.
Source: Same as Table 1.
Table 5: Migrants from NER to Bangalore as Percentage to All-migrants from Outside
Karnataka to Bangalore
Last residence 1991 2001
Person Male Female Person Male Female
NER
Total 0.77 0.75 0.80 0.80 0.85 0.72
Rural 0.69 0.56 0.83 0.58 0.60 0.56
Urban 0.78 0.78 0.79 0.96 1.05 0.85
Outside Karnataka to Bangalore* (Nos.)
Total 488230 254500 233730 808669 446442 362227
Rural 153160 82060 71100 301743 174162 127581
Urban 318530 163370 155160 444516 240523 203993
Note: *States in India beyond the state (Bangalore) of enumeration.
Source: Same as Table 1.
Migration from the region to the ROI is dominated by the females as the sex ratio (Table 2) is
1259 in 1991. Females became more dominant among the migrants as 2042 female migrated per
thousand male migrants in 2001 indicating that there is no gender discrimination in sending those
migrants by their parents. Specifically, female migration is largely due to marriage. It is more than the
general sex ratio of population of the region where females never outnumbered the males in these
years. The pace of female migration from the region to the ROI is increasing; however, the pace is not
the same for migrants from the region to Karnataka as well as to Bangalore. In 1991 females
outnumbered the males among the migrants from the region to Karnataka; but later in 2001 males
greatly outnumbered females or the sex ratio was only 625. Similarly, the sex ratio of migrants from
NER to Bangalore was 989 in 1991 however in the following decade it dropped to 685. Presumptuously,

9
females were not under-enumerated during the census enumeration. Then it indicates that females did
not like Karnataka or Bangalore as much as before or male preference of Karnataka or Bangalore goes
much beyond female preferences. It is also possible that the opportunities available in Bangalore are
more suitable for males.
As expected larger share of the migrants from the region are from the more populated states
like Assam with 41 percent in 1991 and 58 percent in 2001 (Table 6). However, it is always not the case
that most populated state has a higher share of migrants in Bangalore because a smallest and least
populated NE state like Sikkim has a larger share of migrants with 22 percent than a more populous
state like Manipur with about six percent in 1991. In 2001, Assam continues to dominate in terms of
migration level among the NER followed by Manipur with about 13 percent. It is surprising to observe a
significant decline in the share of migrants from Sikkim from about 22 to about four percent during the
same period. Such decline although low is noticed for Arunachal Pradesh as well as for Mizoram. It
suggests that the pace of migration from Assam, Manipur, Meghalaya, Nagaland and Tripura exceed
migration from Arunachal Pradesh, Mizoram and Sikkim which are relatively peaceful and politically
stable states in the region. Moreover, larger share of the migrants coming to Bangalore are from urban
areas that seems to be relatively more informative, educated and affluent. As presented in Table 2,
about 66 percent of the migrants from the region to Bangalore originated from urban areas in 1991
which does not change much even after a decade in 2001. This could arises due to a forward migration
when people initially migrated from rural to urban areas in their respective state or region; further
migrated to Bangalore in urban areas in search of better job, better education, transfer of job, family
moved, etc.
Table 6: Migrants from NE States as Percentage to NER in Bangalore/ROI
NE states to Bangalore % NER to Bangalore NE states to ROI % NER to ROI
Last residence
1991 2001 1991 2001
Person Male Female Person Male Female Person Male Female Person Male Female
Ar. Pradesh 9.26 9.47 9.04 3.87 3.90 3.83 7.34 6.96 7.65 1.74 2.50 1.37
Assam 40.74 34.74 46.81 57.86 58.41 57.06 53.02 55.83 50.79 67.53 67.87 67.36
Manipur 6.08 6.32 5.85 13.08 13.05 13.13 5.97 5.28 6.52 3.09 4.80 2.25
Meghalaya 7.67 10.53 4.79 8.12 7.21 9.45 5.15 4.79 5.43 2.85 4.22 2.17
Mizoram 5.29 5.26 5.32 2.97 2.62 3.48 5.83 6.03 5.67 0.71 1.15 0.50
Nagaland 3.70 3.68 3.72 5.44 5.45 5.43 3.20 3.02 3.35 18.82 11.37 22.46
Sikkim 22.49 25.26 19.68 3.56 3.35 3.87 9.04 8.10 9.78 1.73 2.40 1.40
Tripura 4.76 4.74 4.79 5.09 6.00 3.75 10.45 10.00 10.80 3.54 5.70 2.49
NER (Nos.) 3780 1900 1880 6429 3816 2613 379473 167967 211506 754406 247965 506441
Source: Same as Table 1.

10
Table 7: Migrants from NER to Bangalore, Karnataka and ROI as percentage to total
migrants from NER in Karnataka, ROI and NER Population
Share 1991 2001
Person Male Female Person Male Female
NER to Bangalore % NER to Karnataka 33.81 37.92 30.47 52.45 50.60 55.41
NER to Karnataka % Outside Karnataka* to Karnataka 0.70 0.72 0.68 0.59 0.80 0.42
NER to Bangalore % NER to ROI 1.00 1.13 0.89 0.85 1.54 0.52
NER to Karnataka % NER to ROI 2.95 2.98 2.92 1.62 3.04 0.93
NER to ROI % NER population 1.19 1.01 1.38 1.94 1.24 2.69
NER population (Nos.) 31953771 16603656 15350115 38857769 20065658 18792111
Notes: ROI includes all states of India excepting J&K and eight NE states in 1991 and eight NE states in
2001. *States in India beyond the state (Karnataka) of enumeration.
Source: Same as Table 1.
All NE states do not migrate uniformly in size across the cities and state outside the region
over the years. For example, majority of the NE migrants to Bangalore were from Assam which was
followed by Manipur, Meghalaya, and so on; and the least from Mizoram in 2001. In the same year,
Assam dominated in the course of migration from the region to the ROI with about 68 percent that was
followed by Nagaland, Tripura, Manipur, etc and the least from Mizoram with less than one percent. A
similar pattern is observed for males and females. Importantly, the states with smaller population were
increasingly migrating outside the region for instance like Nagaland. In 1991, about three percent of the
migrants from the region to the ROI were from Nagaland, which has significantly increased to about 19
percent in 2001. Contrary to this, the share of migrants from Mizoram has significantly declined from
about six to less than one percent during the same period. It indicates that the extent of migration from
each NE state was not consistent at different point of time.
North east people have become increasingly mobile as the share of out-migrants from NER in
the population of the region rose from 1.19 percent in 1991 to 1.94 percent in 2001. It was attributed
by a significant increase among the female migrants. The size of female migrants became large in
number (Table 2) as well as in proportion (Table 7) indicating a serious issue. It can be argued that
females are finding difficulties in getting job in their region or they preferred job elsewhere with a
higher wage. It is also possible that they are increasingly enrolling in higher studies outside their region.
Moreover, migrants from NE to Karnataka are not very significant when compared to the size of
migrants from the region to the ROI. In 1991, about three percent of the out-migrants from the region
migrated to Karnataka; later in 2001 it decline to 1.62 percent because of the sharp decline among the
female migrants. Many females were not choosing Karnataka as their migration destination. This affects
the size of out-migrants from the region to Karnataka as well as Bangalore. In 1991, only 0.70 percent
of the migrants from outside Karnataka were from NER. In 2001, it has reduced to 0.59 percent.
Moreover, only one percent of the out-migrants from the region migrated to Bangalore in pre and

11
during the 1980s, during India’s pre-reform period, which was registered in 1991. The size of migrants
in number swelled up; however, the share has dropped to less than one percent in 2001. Again the
reason is simple that females do not migrate as much as the males to Karnataka or Bangalore. Further,
about 34 percent of the out-migrants to Karnataka lived in Bangalore in 1991. In 2001, it has
substantially improved to 52 percent suggesting Bangalore the favourite migration destination for the
NE people in Karnataka. About half of the male migrants and about 55 percent of the female migrants
from the region migrated to Karnataka lived in Bangalore.
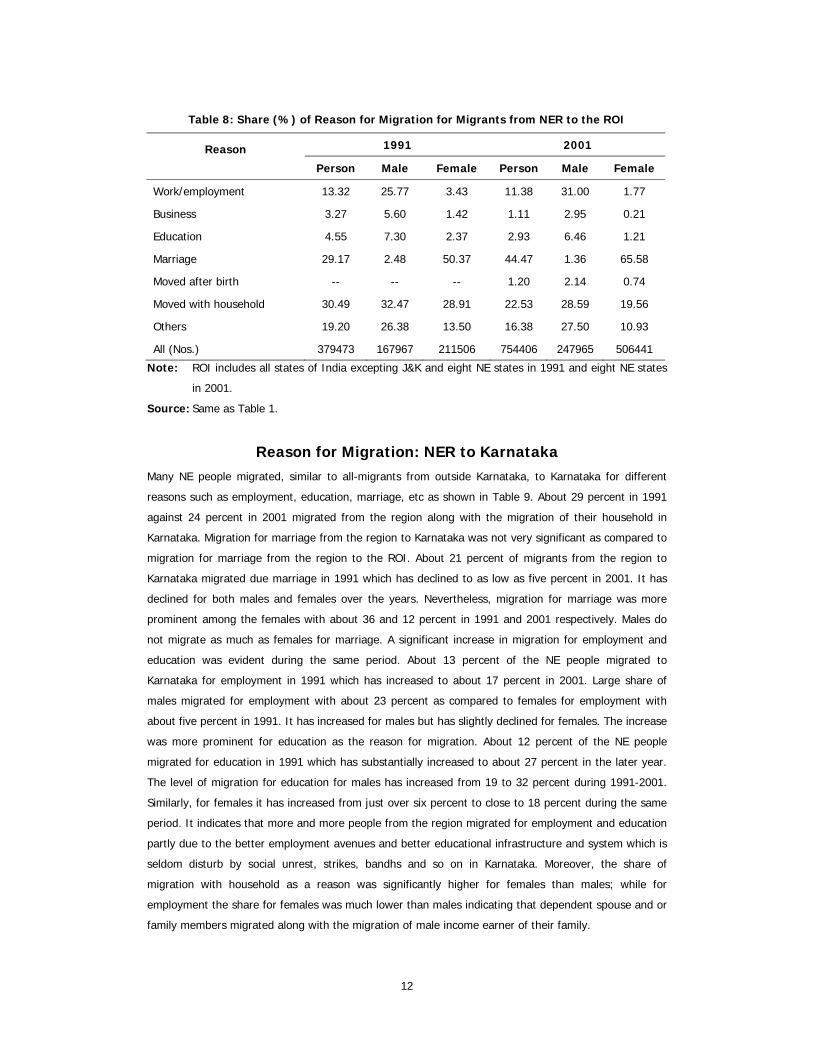
Reason for Migration: NER to Rest of India People migrated outside NER for various reasons and the reasons are not uniformly distributed for
males and females. NE people migrated to the ROI mainly due to the migration along with the
household and for marriage. Empirical evidence shows that about 30 percent of the migrants from the
region to the ROI migrated due to the migration along with their household in 1991 (Table 8). Such
type of migration occurs when transfer of job arises, parents or main income earner migrates and
spouse migrated along with spouse and or children. About 29 percent migrated for marriage. Migration
for employment and business was about 17 percent. The share of migrants for education was prevailing
at over four percent. And the remaining share migrated for various reasons that are not included in the
aforementioned reasons. Migration from the region to the ROI for marriage has increased drastically to
44 percent in 2001 which arises mainly with a high female mentioning marriage as their reason for
migration. A very insignificant proportion of males migrated for marriage. In 1991 just over two percent
of the males migrated for marriage which has gone down to just over one percent in the following
decade.
Migration along with the movement of their household or family continues to be significant
even in 2001 with a share of about 23 percent. NE people specifically migrated for education decline
from 4.55 to 2.93 percent from 1991 to 2001. Similarly, migration for employment and business
declined. Females do not migrate for education, employment and business as much as the male
counterparts. Migration for education, employment and business among the males and females has
declined for the same period. Except an increase of migration for employment for males from about 26
to 31 percent during the same period that implies that unemployment issue in their region was
becoming a major reason for migration.
12
Table 8: Share (%) of Reason for Migration for Migrants from NER to the ROI
Reason 1991 2001
Person Male Female Person Male Female
Work/employment 13.32 25.77 3.43 11.38 31.00 1.77
Business 3.27 5.60 1.42 1.11 2.95 0.21
Education 4.55 7.30 2.37 2.93 6.46 1.21
Marriage 29.17 2.48 50.37 44.47 1.36 65.58
Moved after birth -- -- -- 1.20 2.14 0.74
Moved with household 30.49 32.47 28.91 22.53 28.59 19.56
Others 19.20 26.38 13.50 16.38 27.50 10.93
All (Nos.) 379473 167967 211506 754406 247965 506441
Note: ROI includes all states of India excepting J&K and eight NE states in 1991 and eight NE states
in 2001.
Source: Same as Table 1.
Reason for Migration: NER to Karnataka Many NE people migrated, similar to all-migrants from outside Karnataka, to Karnataka for different
reasons such as employment, education, marriage, etc as shown in Table 9. About 29 percent in 1991
against 24 percent in 2001 migrated from the region along with the migration of their household in
Karnataka. Migration for marriage from the region to Karnataka was not very significant as compared to
migration for marriage from the region to the ROI. About 21 percent of migrants from the region to
Karnataka migrated due marriage in 1991 which has declined to as low as five percent in 2001. It has
declined for both males and females over the years. Nevertheless, migration for marriage was more
prominent among the females with about 36 and 12 percent in 1991 and 2001 respectively. Males do
not migrate as much as females for marriage. A significant increase in migration for employment and
education was evident during the same period. About 13 percent of the NE people migrated to
Karnataka for employment in 1991 which has increased to about 17 percent in 2001. Large share of
males migrated for employment with about 23 percent as compared to females for employment with
about five percent in 1991. It has increased for males but has slightly declined for females. The increase
was more prominent for education as the reason for migration. About 12 percent of the NE people
migrated for education in 1991 which has substantially increased to about 27 percent in the later year.
The level of migration for education for males has increased from 19 to 32 percent during 1991-2001.
Similarly, for females it has increased from just over six percent to close to 18 percent during the same
period. It indicates that more and more people from the region migrated for employment and education
partly due to the better employment avenues and better educational infrastructure and system which is
seldom disturb by social unrest, strikes, bandhs and so on in Karnataka. Moreover, the share of
migration with household as a reason was significantly higher for females than males; while for
employment the share for females was much lower than males indicating that dependent spouse and or
family members migrated along with the migration of male income earner of their family.
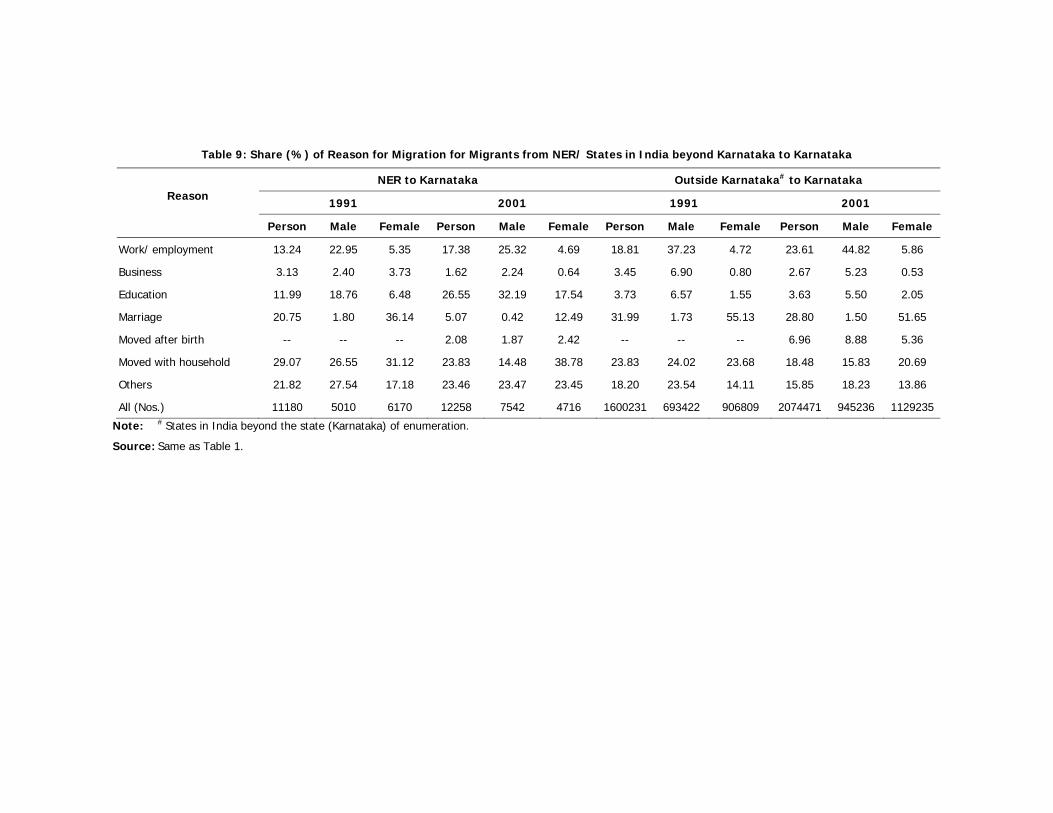
Table 9: Share (%) of Reason for Migration for Migrants from NER/ States in India beyond Karnataka to Karnataka
Reason NER to Karnataka Outside Karnataka# to Karnataka
1991 2001 1991 2001
Person Male Female Person Male Female Person Male Female Person Male Female
Work/ employment 13.24 22.95 5.35 17.38 25.32 4.69 18.81 37.23 4.72 23.61 44.82 5.86
Business 3.13 2.40 3.73 1.62 2.24 0.64 3.45 6.90 0.80 2.67 5.23 0.53
Education 11.99 18.76 6.48 26.55 32.19 17.54 3.73 6.57 1.55 3.63 5.50 2.05
Marriage 20.75 1.80 36.14 5.07 0.42 12.49 31.99 1.73 55.13 28.80 1.50 51.65
Moved after birth -- -- -- 2.08 1.87 2.42 -- -- -- 6.96 8.88 5.36
Moved with household 29.07 26.55 31.12 23.83 14.48 38.78 23.83 24.02 23.68 18.48 15.83 20.69
Others 21.82 27.54 17.18 23.46 23.47 23.45 18.20 23.54 14.11 15.85 18.23 13.86
All (Nos.) 11180 5010 6170 12258 7542 4716 1600231 693422 906809 2074471 945236 1129235
Note: # States in India beyond the state (Karnataka) of enumeration.
Source: Same as Table 1.

Further, interestingly, NE people migrated for education was more significant when compared
to the all-migrants from outside Karnataka to Karnataka. For example, in 2001, close to 27 percent
migrated from the NE to Karnataka for education; however, about four percent of all-migrants from
outside Karnataka to Karnataka migrated for the same reason.
Reason for Migration: NER to Bangalore Migrants in pre and during the 1980s which was recorded in 1991 from the NER migrated to Bangalore
mainly because of the family migration with a share of about 46 percent as presented in Table 10.
Employment was the second largest reason for migration with a share of about 16 percent followed by
the education with 15 percent, marriage with 11 percent and the rest for business and others. Similarly
the migrants from the region to Bangalore in the 1990s that was registered in 2001 largely migrated
along with the household or family migration with about 29 percent followed by migration for education
with a similar share, employment with about 20 percent and so on. During 1991-2001, NE people
migration for employment has increased. Their migration for education has shown a substantial
increased by about 13 percentage points. As a consequences the share of migration for business,
marriage and moved with household has declined. A similar trend prevails for both males and females.
Noticeably, a considerable size of females has migrated for education in the 1990s as compared to the
pre and during the 1980s migrants. This situation is mesmerised with the inability to deliver a desirable
education at the region. Males largely migrated for employment as well as education while females
mostly migrated due to family migration and marriage. A disproportionately large share of males (for
example about 30 percent in 2001) when compared to females (five percent in 2001) migrated for
employment and a disproportionately small share of males (for example about 17 percent in 2001)
when compared to females (46 percent in 2001) migrated due to family or household migration
indicates that females are largely a dependent to males for their livelihood. Similarly, a large share of
males migrated for employment whereas a large proportion of females migrated for marriage implies
that females are unlikely to support their family.

Table 10: Share (%) of reason for migration of migrants from NER/outside Karnataka to Bangalore
Reason
NER to Bangalore Outside Karnataka# to Bangalore
Person Male Female Person Male Female
1991 2001 1991 2001 1991 2001 1991 2001 1991 2001 1991 2001
Work/ Employment 16.14 19.88 28.42 29.93 3.72 5.20 29.13 32.45 49.81 52.32 6.62 7.97
Business 2.38 2.10 3.16 3.07 1.60 0.69 4.08 3.30 7.05 5.36 0.85 0.77
Education 15.08 28.51 22.63 32.84 7.45 22.20 3.99 4.00 5.88 5.35 1.94 2.33
Marriage 11.11 4.28 1.58 0.16 20.74 10.29 19.93 17.29 1.00 1.01 40.53 37.35
Moved after birth -- 1.79 -- 1.55 -- 2.14 -- 4.86 -- 4.82 -- 4.91
Moved with household 45.77 28.88 35.26 16.98 56.38 46.27 29.58 21.06 22.87 14.68 36.89 28.91
Others 9.52 14.56 8.95 15.49 10.11 13.20 13.28 17.04 13.39 16.46 13.16 17.76
All (Nos.) 3780 6429 1900 3816 1880 2613 488230 808669 254500 446442 233730 362227
Note: #States in India beyond the state (Bangalore) of enumeration.
Source: Same as Table 1.

Furthermore, NE migrants migrated to Bangalore for employment and business was not up to
the extent of all-migrants from outside Karnataka migrated to Bangalore in 1991 as well as 2001. For
example as large as 36 percent of all-migrants to Bangalore migrated for employment and business
against 22 percent among the NE migrants for the same reason in 2001 which could be attributed by
distance factor where close and adjacent states might have contributed considerably among the all-
migrants. However, for education the NE people migrated considerably more than the all-migrants. For
education unlike migrants from NE, the share of all-migrants migrated for it does not change at all in
2001 from the previous decade. In 2001, more than 28 percent of the migrants from NE migrated for
education, against about four percent for all-migrants, indicating the prevalence of serious problem in
the educational system in NE that relates to the law and order problem, strikes, bandhs, etc.
NE people do not migrate as much as all-migrants for marriage likely due to differences in
cultural practice. Migration along with their household is more prominent among the NE migrants than
all-migrants. Migration for marriage and migration along with household are more apparent for females
when compared to the males. Migration for marriage is insignificant for both the NE and all migrants for
males. It is possible that considerable size of females migrated after their marriage to join their
husband; specifically migrated for marriage; and joined in migration as a dependent to the main income
earner of their family. The share of migration for other reason like natural calamities and not mentioned
earlier grouped as others is larger for all than NE migrants to Bangalore can explain partly by location
proximity.
These migrants mostly originated from urban areas in 1991 and 2001 (Table 11) indicating
that urban people are more informative about the migration destination concerning the possible
employment availability, educational system etc. NE migrants from urban areas were about 66 percent
in 1991 which does not change even after a decade in 2001; whereas, for all-migrants the share of
urban migrants gradually declines with an increase in the share of rural migrants from 31 to 37 percent
during the same period. Similarly, majority of the migrants for employment, business, education,
marriage etc were from urban areas. During 1991-2001, NE migrants migrated from rural areas has
increased for employment from about 20 to 30 percent and for migrants migrated along with their
household from 26 to 34 percent. The share of rural migrants for the rest reasons from NE to Bangalore
have declined. In case of all-migrants, migrants originated from rural areas for employment, business,
marriage and family moved as a reason of migration have increased; while for education and others
have declined. It suggests that rural people of NE are not mobile as the rural all-migrants perhaps
explain by their economic background.5 It also indicates that affluent urban people have a higher
tendency to migrate irrespective of the distance between origin and destination of migration.
5 In Bangalore, unlike in Delhi where one month rent is given in advance, tenants deposit rent for 10 months in
advance as security of house on leased to the house owner which is a disincentive for modest economic background rural people. It might have led to choose other than Bangalore as a destination for migrants particularly originated from rural areas from NE.

Table 11: Rural-urban Distribution (%) of Migrants by Reason from NER/Outside Karnataka to Bangalore
Course of migration Year Last residence
Total migrants
Work/ employment Business Education Marriage Moved after
birth Moved with household Others
NER to Bangalore
1991
Total 3780 610 90 570 420 -- 1730 360
Rural 27.78 19.67 44.44 31.58 38.10 -- 26.01 27.78
Urban 66.14 70.49 55.56 59.65 54.76 -- 69.36 69.44
2001
Total 6429 1278 135 1833 275 115 1857 936
Rural 27.36 29.58 19.26 21.77 28.00 31.30 33.71 23.18
Urban 66.25 67.68 77.04 75.34 70.55 64.35 64.62 47.12
Outside Karnataka# to Bangalore
1991
Total 488230 142240 19940 19490 97290 -- 144430 64840
Rural 31.37 35.43 32.20 24.88 31.76 -- 29.29 28.21
Urban 65.24 61.09 63.94 71.93 65.07 -- 67.96 66.93
2001
Total 808669 262447 26693 32315 139798 39319 170287 137810
Rural 37.31 45.60 36.07 24.33 40.04 32.60 35.53 25.60
Urban 54.97 52.29 61.26 73.33 56.87 61.52 61.02 43.27
Notes: Italic figures are in numbers. Figures may not sum up to 100 due to the exclusion of unclassifiable migrants in rural or urban. #States in India beyond the
state (Bangalore) of enumeration.
Source: Same as Table 1.

Concluding Remarks Migration from NER to the rest of India in general and to Bangalore in particular is increasing over the
years. Urban people from NER have a higher tendency to migrate to Bangalore. On the contrary,
migration from the region to the rest of India is dominated by the rural migrants. Migration from the
region to Karnataka is not very significant in comparison with all-migrants from outside Karnataka to the
state. Less than two percent of the out-migrants from the region migrated to Karnataka. Migrants from
the region are not choosing Karnataka as migration destination as before. An insignificant size of below
one percent of migrants from outside Karnataka to Bangalore is from NER. Males greatly outnumbered
the females for migration from the region to Bangalore as well as to Karnataka which is not the case for
migrants from the region to the rest of India. Female migrants from the region are increasingly
choosing other than Bangalore as their migration destination. However, males continue to prefer and
choose Bangalore as one of their favourite migration destinations. There is an inconsistency in the level
of out-migration from each states of the region; nevertheless, populated states have a greater tendency
to out-migrate from their state. Migration from the region to the rest of India is largely for employment
for males while for females the reason is mainly for marriage. NE people, particularly males, migrated to
Karnataka in general and Bangalore in particular mainly for education and employment. Females
migrated mostly due to family migration. Conversely, most of the migrants from outside Karnataka to
Bangalore were for employment for males and marriage for females. Migration from NER to Bangalore
for employment and education has increased while migration along with their family has declined
recently. It depicts a lack of educational infrastructures and unemployment problems in the region. It
calls forth to formulate and create adequate educational infrastructure, proper educational system and
economic opportunities in the region. Nonetheless, migration from the region to the rest of India is to
be encouraged to promote the national integrity.
References
Bhagat, Ram B (2005). Conceptual Issues in Measurement of Internal Migration in India. XXVth IUSSP
International Conference, Tours, France.
Chandra, Madhu (2011). North East Migration and Challenges in Mega Cities. Accessed on 22.06.2012 >
http://nehelpline.net/?p=490).
Cote, Guy L (1997). Socio-economic Attainment, Regional Disparities, and Internal Migration. European
Sociological Review, 13 (1).
Dimova, Ralitza and Wolff, Francois Charles (2009). Remittances and Chain Migration: Longitudinal
Evidence from Bosnia and Herzegovina. Discussion Paper, Institute for the Study of Labor
(IZA).
Faggian, Alessandra and McCann, Philip (2006). Human Capital Flows and Regional Knowledge Assets:
A Simultaneous Equation Approach. Oxford Economic Paper 52.
Gooptu, Biswarup and Sengupta, Devina (2012). North East Exodus: Bangalore Businesses Facing the
Impact. The Economic Times. Aaccessed on 17.09.2014 >
http://economictimes.indiatimes.com/news/politics-and-nation/north-east-exodus-bangalore-
businesses-facing-the-impact/articleshow/15525819.cms).

19
Greenwood, M J (1973). The Influence of Family and Friends on Geographic Labor Mobility in a Less
Developed Country: the Case of India, Review of Regional Studies. In Levy, Mildred B and
Wadycki, Walter J (1973) The Influence of Family and Friends on Geographic Labor Mobility:
An International Comparison. The Review of Economics and Statistics, 55 (2).
India Tomorrow News (2014). 81% of North East women harassed in Delhi: Survey. India Tomorrow,
January. Accessed on 24.09.2014 > http://www.indiatomorrow.net/eng/81-of-north-east-
women-harassed-in-delhi-survey).
Kundu, Amitabh (2007). Mobility of Population. In Kaushik Basu (ed), The Oxford Companion to
Economics in India. New Delhi: Oxford University Press.
Levy, Mildred B and Walter J Wadycki (1973). The Influence of Family and Friends on Geographic Labor
Mobility: An International Comparison. The Review of Economics and Statistics, 55 (2).
MacDonald, John S and Leatrice D MacDonald (1964). Chain Migration Ethnic Neighborhood Formation
and Social Networks. The Milbank Memorial Fund Quarterly, 42 (1).
Mukherji, Shekhar (2001). Low Quality Migration in India: The Phenomena of Distressed Migration and
Acute Urban Decay. 24th IUSSP International Conference. Salvador, Brazil.
Reimeingam, Marchang (2008). Educated Unemployed Youth and Migration from North Eastern Region:
A Case Study of Migrants from Ukhrul District to Delhi. Thesis Unpublished, JNU, Delhi.
————— (2011). Unemployment, Job Aspiration and Migration: A Case Study of Tangkhul Migrants to
Delhi, Eastern Quarterly, 7 (3&4).
Remesh Babu, P (2012). Migration from North-East to Urban Centres: A Study of Delhi Region. NLI
Research Studies Series, No. 094/2012, V.V. Giri National Labour Institute, Noida.
Sachdeva, Gulshan (2005). Preparing the Northeastern Economy for the Future. Eastern Quarterly, 3
(3).
Santhapparaj, A Solucis (1996). Job Search and Earnings of Migrants in Urban Labour Market: A Study
of Madurai Metropolis. The Indian Journal of Labour Economics, 39 (2).
Sebastian, A (1989). Youth Migrants for Employment in India. In Nair, P S, Vemuri, H D, Farijdar and
Ram (eds), Indian Youth: A Profile. Delhi: Mittal Publications.
Skeldon, Ronal (1986). On Migration Patterns in India during the 1970s. Population and Development
Review, 12 (4).
Todaro, Michael P (1969). A Model of Labor Migration and Urban Unemployment in Less Developed
Countries. The American Economic Review, 59 (1).
Usha Devi, M D and U A Shimray (2010). Report on Migration from the North Eastern Region: A Study
of Educated Youth from NER in Bangalore and Delhi. Bangalore: ISEC.
Visaria, Pravin (1980). The Level and Pattern of Economic Activity by Migration Status in India.
Demography India, 9 (1&2).

309 Historical Issues and Perspectives ofLand Resource Management in India: AReviewM S Umesh Babu and Sunil Nautiyal
310 E-Education: An Impact Study of SankyaProgramme on Computer EducationN Sivanna and Suchetha Srinath
311 Is India’s Public Debt Sustainable?Krishanu Pradhan
312 Biomedical Waste Management: Issuesand Concerns - A Ward Level Study ofBangalore CityS Manasi, K S Umamani and N Latha
313 Trade and Exclusion: Review of ProbableImpacts of Organised Retailing onMarginalised Communities in IndiaSobin George
314 Social Disparity in Child Morbidity andCurative Care: Investigating forDetermining Factors from Rural IndiaRajesh Raushan and R Mutharayappa
315 Is Access to Loan Adequate for FinancingCapital Expenditure? A Household LevelAnalysis on Some Selected States of IndiaManojit Bhattacharjee and Meenakshi Rajeev
316 Role of Fertility in Changing Age Structurein India: Evidence and ImplicationsC M Lakshmana
317 Healthcare Utilisation Behaviour in India:Socio-economic Disparities and the Effectof Health InsuranceAmit Kumar Sahoo
318 Integrated Child Development Services inIndia – A Sub-National ReviewJonathan Gangbar, Pavithra Rajan and K Gayithri
319 The Infrastructure-Output Nexus:Regional Experience from IndiaSumedha Bajar
320 Uncertainty, Risk and Risk Mitigation: FieldExperiences from Farm Sector inKarnatakaMeenakshi Rajeev and B P Vani
321 Socio-Economic Disparities in Health-Seeking Behaviour, Health Expenditureand Sources of Finance in Orissa: Evidencefrom NSSO 2004-05Amit Kumar Sahoo and S Madheswaran
322 Does Living Longer Mean Living Healthier?Exploring Disability-free Life Expectancy inIndiaM Benson Thomas, K S James and S Sulaja
323 Child and Maternal Health and Nutrition inSouth Asia - Lessons for IndiaPavithra Rajan, Jonathan Gangbar and K Gayithri
324 Reflecting on the Role of Institutions inthe Everyday Lives of Displaced Women:The Case of Ganga-Erosion in Malda, WestBengalPriyanka Dutta
325 Access of Bank Credit to VulnerableSections: A Case Study of KarnatakaVeerashekharappa
326 Neighbourhood Development and CasteDistribution in Rural IndiaRajesh Raushan and R Mutharayappa
Recent Working Papers327 Assessment of India’s Fiscal and External
Sector Vulnerability: A Balance SheetApproachKrishanu Pradhan
328 Public Private Partnership’s GrowthEmpirics in India’s InfrastructureDevelopmentNagesha G and K Gayithri
329 Identifying the High Linked Sectors forIndia: An Application of Import-AdjustedDomestic Input-Output MatrixTulika Bhattacharya and Meenakshi Rajeev
330 Out-Of-Pocket (OOP) Financial RiskProtection: The Role of Health InsuranceAmit Kumar Sahoo and S Madheswaran
331 Promises and Paradoxes of SEZs Expansionin IndiaMalini L Tantri
332 Fiscal Sustainability of National FoodSecurity Act, 2013 in IndiaKrishanu Pradhan
333 Intergrated Child Development Servicesin KarnatakaPavithra Rajan, Jonathan Gangbar and K Gayithri
334 Performance Based Budgeting:Subnational Initiatives in India and ChinaK Gayithri
335 Ricardian Approach to Fiscal Sustainabilityin IndiaKrishanu Pradhan
336 Performance Analysis of National HighwayPublic-Private Partnerships (PPPs) in IndiaNagesha G and K Gayithri
337 The Impact of Infrastructure Provisioningon Inequality: Evidence from IndiaSumedha Bajar and Meenakshi Rajeev
338 Assessing Export Competitiveness atCommodity Level: Indian Textile Industryas a Case StudyTarun Arora
339 Participation of Scheduled CasteHouseholds in MGNREGS: Evidence fromKarnatakaR Manjula and D Rajasekhar
340 Relationship Between Services Trade,Economic Growth and ExternalStabilisation in India: An EmpiricalInvestigationMini Thomas P
341 Locating the Historical Past of the WomenTea Workers of North BengalPriyanka Dutta
342 Korean Media Consumption in Manipur: ACatalyst of Acculturation to KoreanCultureMarchang Reimeingam
343 Socio-Economic Determinants of EducatedUnemployment in IndiaIndrajit Bairagya
344 Tax Contribution of Service Sector: AnEmpirical Study of Service Taxation inIndiaMini Thomas P

345 Effect of Rural Infrastructure onAgricultural Development: District-LevelAnalysis in KarnatakaSoumya Manjunath and Elumalai Kannan
346 Moreh-Namphalong Border TradeMarchang Reimeingam
347 Emerging Trends and Patterns of India’sAgricultural Workforce: Evidence from theCensusS Subramanian
348 Estimation of the Key EconomicDeterminants of Services Trade: Evidencefrom IndiaMini Thomas P
349 Employment-Export Elasticities for theIndian Textile IndustryTarun Arora
350 Caste and Care: Is Indian HealthcareDelivery System Favourable for Dalits?Sobin George
351 Food Security in Karnataka: Paradoxes ofPerformanceStacey May Comber, Marc-Andre Gauthier,Malini L Tantri, Zahabia Jivaji and Miral Kalyani
352 Land and Water Use Interactions:Emerging Trends and Impact on Land-useChanges in the Tungabhadra and TagusRiver BasinsPer Stalnacke, Begueria Santiago, Manasi S, K VRaju, Nagothu Udaya Sekhar, Maria ManuelaPortela, António Betaâmio de Almeida, MartaMachado, Lana-Renault, Noemí, Vicente-Serranoand Sergio
353 Ecotaxes: A Comparative Study of Indiaand ChinaRajat Verma
354 Own House and Dalit: Selected Villages inKarnataka StateI Maruthi and Pesala Busenna
355 Alternative Medicine Approaches asHealthcare Intervention: A Case Study ofAYUSH Programme in Peri Urban LocalesManasi S, K V Raju, B R Hemalatha,S Poornima, K P Rashmi
356 Analysis of Export Competitiveness ofIndian Agricultural Products with ASEANCountriesSubhash Jagdambe
357 Geographical Access and Quality ofPrimary Schools - A Case Study of South24 Parganas District of West BengalJhuma Halder
358 The Changing Rates of Return toEducation in India: Evidence from NSS DataSmrutirekha Singhari and S Madheswaran
359 Climate Change and Sea-Level Rise: AReview of Studies on Low-Lying and IslandCountriesNidhi Rawat, M S Umesh Babu andSunil Nautiyal
360 Educational Outcome: Identifying SocialFactors in South 24 Parganas District ofWest BengalJhuma Halder
361 Social Exclusion and Caste Discriminationin Public and Private Sectors in India: ADecomposition AnalysisSmrutirekha Singhari and S Madheswaran
362 Value of Statistical Life: A Meta-Analysiswith Mixed Effects Regression ModelAgamoni Majumder and S Madheswaran
363 Informal Employment in India: An Analysisof Forms and DeterminantsRosa Abraham
364 Ecological History of An Ecosystem UnderPressure: A Case of Bhitarkanika in OdishaSubhashree Banerjee
365 Work-Life Balance among WorkingWomen – A Cross-cultural ReviewGayatri Pradhan
366 Sensitivity of India’s Agri-Food Exportsto the European Union: An InstitutionalPerspectiveC Nalin Kumar
367 Relationship Between Fiscal DeficitComposition and Economic Growth inIndia: A Time Series EconometricAnalysisAnantha Ramu M R and K Gayithri
368 Conceptualising Work-life BalanceGayatri Pradhan
369 Land Use under Homestead in Kerala:The Status of Homestead Cultivationfrom a Village StudySr. Sheeba Andrews and Elumalai Kannan
370 A Sociological Review of Marital Qualityamong Working Couples in BangaloreCityShiju Joseph and Anand Inbanathan
Price: ` 30.00 ISBN 978-81-7791-227-2
INSTITUTE FOR SOCIAL AND ECONOMIC CHANGEDr V K R V Rao Road, Nagarabhavi P.O., Bangalore - 560 072, India
Phone: 0091-80-23215468, 23215519, 23215592; Fax: 0091-80-23217008E-mail: [email protected]; Web: www.isec.ac.in