Embed Size (px)
Citation preview

MigrationA type of relocation diffusion
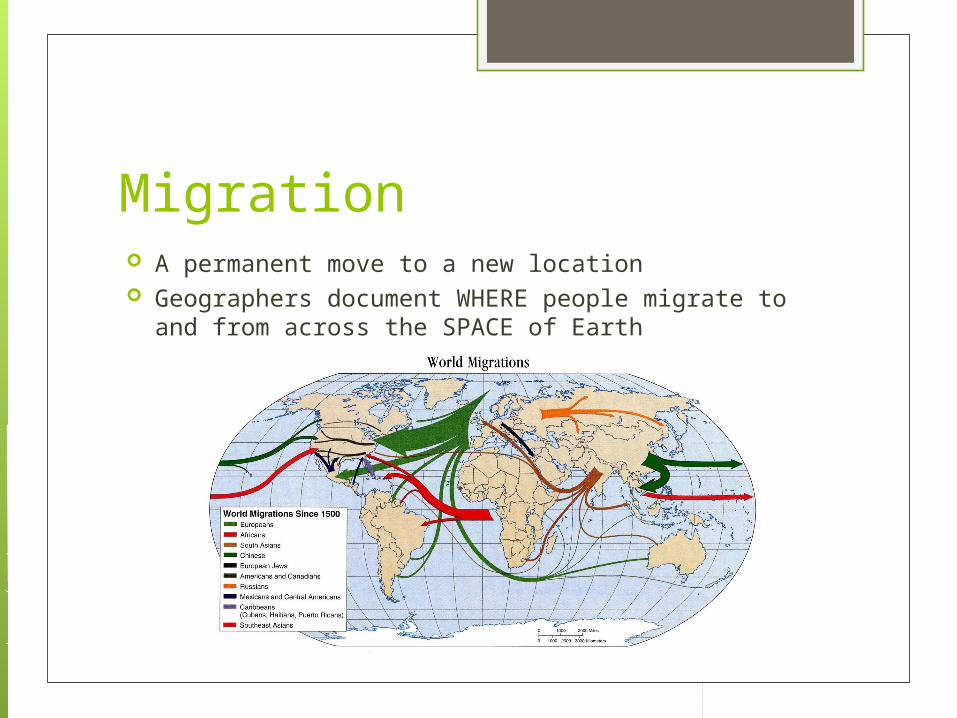
Migration A permanent move to a new location Geographers document WHERE people migrate to and
from across the SPACE of Earth

Migration Generally A form of mobility
covering all types of movements from one place to another
Short-term daily, monthly, or annual movements occurring on a regular basis are called circulation

“Em” or “Imm”??? Emigration is migration FROM a location
(Emigrants) Immigration is migration TO a location
(Immigrants) Ex. Bob from Canada migrates to Brazil.
Canada’s data shows him as an emigrant, while Brazil considers him an immigrant.
Net Migration is the difference between the # if immigrants and the # of emigrants

Net Migration If the # of immigrants > than # of emigrants = positive net
migration (region has net in-migration) Opposite of that = negative net migration (region has net out-
migration)

Let’s Discuss: Why does true migration occur less
often than circulation or other forms of movement?
How might a region be effected if it has large levels of net in-migration?
If globalization connects the world, why do people still feel the need to migrate?

Why do people Migrate?

Reasons for Migrating: Most people migrate for economic
reasons Cultural and environmental factors
exist, but not as frequently as economic Push (centrifugal) Factors – induce
people to move out of current location Pull (centripetal) Factors – induce
people to move into a new location* Both typically play a role

Let’s Discuss: What are some economic push/pull
factors? What are some cultural push/pull
factors? What are some environmental
push/pull factors?

Intervening Obstacles Intervening Obstacle is am environmental
or cultural feature that hinders migration Past – environmental played huge role- Large bodies of water, mountains, deserts,
etc. (no modern transportation) - People ended up settling short of desired
location Present – cultural plays role- Local diversity in government and politics- Need a passport to legally emigrate, and a
visa to legally immigrate

Homework!!! Compare and Contrast:1) International v. Internal Migration2) Interregional v. Intraregional Migration3) Voluntary v. Forced Migration Describe each stage of the Migration
Transition (Correlates w/ Dem. Trans.)4) Stage 15) Stage 26) Stage 3 & 4

On your own… Characteristics of Migrants (84-85) U.S. Immigration Patterns (86-88)

Global Migration Patterns Asia, Latin America, and Africa have net
out-migration North America, Europe, and Oceania
have net in-migration Three largest flows currently:1. Asia Europe2. Asia North America3. Latin America North America

Global Patterns Continued… Reflects importance of migration from LDCs
MDCs U.S. has more foreign born residents than
any other country (approx. 40 million in 2010), growing by 1 million annually
Australia and Canada have higher rates of net in-migration (smaller populations)
Countries with highest rates are in oil exporting countries of the Middle East
- Attract workers from poorer neighboring countries to work dangerous jobs

Impact of Immigration on U.S. 18th Century – England and Africa 19th Century – Europe * Euro migrants declined after WWII 20th Century – Latin America and Asia

European Pattern The Industrial Revolution moved many
European countries into Stage 2 As the populations increased economic
opportunities decreased Migration to the U.S. helped decrease
the population in Europe, creating opportunities for all
Most of Europe in Stages 3 & 4 now, no need to reduce population

European Culture 65 million European emigrants
worldwide Indo-European languages spoken by half
of the world Europe’s most prevalent religion,
Christianity, also the world’s largest Euro art, music, literature, philosophy,
and ethics diffused worldwide

Most European Impact Countries sparsely populated prior to
Euro migration (U.S. & Australia) Conflict in places w/ indigenous people
where Euro dominated and imposed political domination
Conflicts today in Africa and Asia a result of arbitrary boundary lines drawn while Euro colonized the area

Unauthorized Immigration to the U.S. Unauthorized (undocumented) Immigrants – enter
the U.S. illegally 2008 11.9 million- 6.3 mill. adult males- 4.1 mill. adult females- 1.5 mill. children• 4 mill. children born in U.S. to illegal parents• 8.3 mill. employed (Normally constructions or
service job) 59% Mexico 22% Elsewhere in Latin America 12% Asia