Embed Size (px)
Citation preview

COST Action ES0604: Atmospheric Water Vapour in the Climate System (WaVaCS) - Working Group 1
Middle – upper water vapour estimation from MSG/UTH products combined with
NCEP/NCAR analysis
Simona Malmusi, Mauro BoccolariDept. of Materials and Environment EngineeringUniversity of Modena and Reggio Emilia (Italy)
21 - 23 May 2008Deutscher Wetterdienst, Lindenberg Meteorological Observatory, Germany

Objectives of our work:
• integrate tropospheric humidity satellite observations with analysis dataset in order to estimate daily middle/upper precipitable water (MUPW)
• check its consistence with known moisture climatic fields
Atmospheric water vapour is extremely variable on almost all scales, mainly in the troposphere
Its distribution and variation knowledge is still incomplete and long term changes, mainly in the upper troposphere, are difficult to evaluate
Long time satellite observations, collected since several years, could be useful for a better comprehension of moisture climatology

SEVIRI (Spinning Enhanced Visible and Infrared Imager) Meteosat-8 on board radiometer
EUMETSAT provides two hourly tropospheric relative humidity products:
Period from February 2004 to August 2006
Area between 63°N - 63° S and 63°W – 63°E
Channel WV6.2 μm Upper Tropospheric Humidity(between 300 and 600 hPa)
Channel WV7.3 μm Middle Tropospheric Humidity(between 600 and 850 hPa)
Resolution: 3km

Tropospheric humidity (TH) comparison with averaged RH data from Integrated Global Radiosonde Archive (IGRA) has been performedFixed level air temperaturefrom NCEP/NCAR daily global analysis
MUPW dataset for the 850 – 300 hPa layer, for the period between February 2004 and August 2006, with a resolution of 2.5° x 2.5° ( resolution lost but the clear sky restraint is reduced)
Estimation of Middle/Upper Precipitable Water Vapour using mixing ratio w calculated from:
Results

Monthly mean MUPW (02/2004 – 08/2006)

63° west – 20° west
Patterns are consistent with the annual-mean specific humidity global distribution
Precipitation-evaporation processes joint with wind-driven circulation can be noted
Hovmöller graphs show the seasonal variability (due to the observed short time period)
Middle PW (850-600 hPa) and upper PW (600-300 hPa) patterns are similar
MUPW annual mean

20° east – 63° east
MUPW maximum follows ITCZ in its migration from the southern position in January to the northern position in July. Over the oceanic longitudes this band holds an almost stationary position north of the equator
Hovmöller longitude-time graphs (not reported) show only the seasonal variability
20° west – 20° east

Possible future applications
A more extensive analysis, including upper tropospheric humidity (UTH) from Meteosat-7 (1997 - 2003) and TH from Meteosat-9 (2007 - now) might be useful to identify typical atmospheric variability modes
Comparison with layered precipitable water vapour directly retrieved from satellite images, already available from SAF-NWC

Thanks for your attention
Mauro Boccolari: [email protected] Malmusi: [email protected]
Other wv works in progress
Water vapour retrieval from SEVIRI observations (Meteosat-9) using split-window techniques
PW estimations from ground-based GPS measurements
COST Action ES0604: Atmospheric Water Vapour in the Climate System (WaVaCS) - Working Group 1
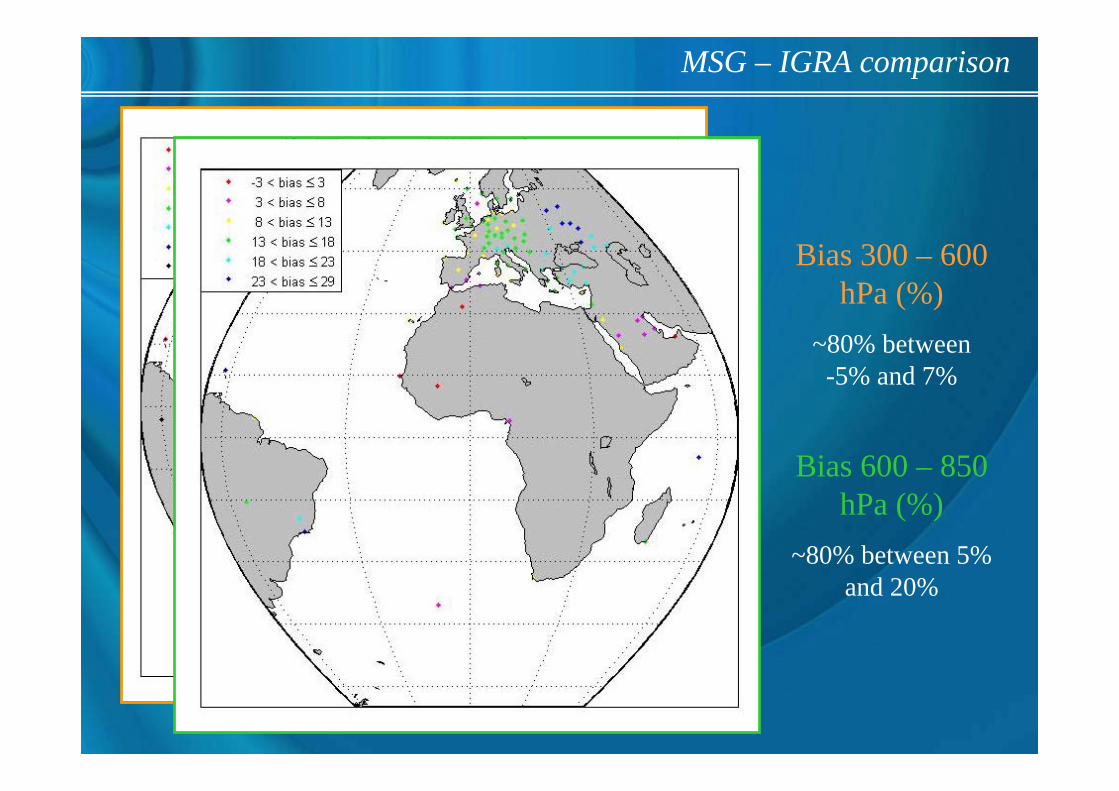
Bias 300 – 600 hPa (%)
~80% between-5% and 7%
Bias 600 – 850 hPa (%)
~80% between 5% and 20%
MSG – IGRA comparison

rms 300 – 600 hPa (%)
~82% between13% and 22%
rms 600 – 850 hPa (%)
~61% between16% and 28%
MSG – IGRA comparison

MPW – UPW patterns
Middle precipitable water (MPW) latitude-time
Hovmöller graph
Upper precipitable water (UPW) latitude-timeHovmöller graph

⎟⎠⎞
⎜⎝⎛
+⋅
⋅= TT
E 7.2375.7
1011.6
⎟⎠⎞
⎜⎝⎛ ⋅
−
⋅
⋅=−
⋅=
100
100622.0622.01
1
600,700,850 THEP
THE
ePew
ii
i
ii
i
Saturated water vapour pressure
Mixing ratio
⎟⎟⎠
⎞⎜⎜⎝
⎛ ⋅−
⋅
⋅=
100
100622.02
2
300,400,500,600 THEP
THE
wj
j
j
Algorithm

300400400500500600600700700850 −−−−− ++++= PWVPWVPWVPWVPWVPWV
( )g
PPwPWV 700850700,850
700850
−⋅=−For each level
∫ ⋅=P
dPwg
PWV0
1∑= i iPWVPWV
Algorithm

EOF
2° EOF (19.9%): PWV seasonality, e.g. when PWV increases in southern Africa, it decreases in northern Africa and vice-versa
1° EOF (69%): annual PWV content variability is more evident in the equatorial band than in higher latitude areas

MUPW/Precipitation: coupled fields?
SVD method has been applied to monthly mean MUPW and precipitation fields. Precipitation data have been collected from Global Precipitation Climatology Project (GPCP).
Time seriesof expandedcoeff. for the 1° mode of variability
Time seriesof expandedcoeff. for the 2° mode of variability Fraction of squared covariance (SCF):
SCF(1) =58.4% SCF(2)=22.4%SCF(3)=5.4%
MUPW spatial patterns (1° and 2° mode)
Precipitation spatial patterns (1° and 2° mode)

Trends
MSG MUPW annual trend (02/2004 – 08/2006)
NCEP/NCAR PWV trend (02/2004 – 08/2006)