Embed Size (px)
Citation preview

Middle East 502017The annual report on the world’s most valuable Middle Eastern brandsApril 2017

Brand Finance Middle East 50 April 2017 3.Brand Finance Australia 100 March 2016 2. 3.Brand Finance Global 500 February 2016 2. Brand Finance Airlines 30 30 February 2015 2.
Brand Finance Middle East 50 April 2017 2.
Foreword.
Foreword 2
Definitions 4
Methodology 6
Executive Summary 8
Full Table (USDm) 15
Understand Your Brand’s Value 16
How We Can Help 18
Contact Details 19
Contents
David Haigh, CEO, Brand Finance
What is the purpose of a strong brand; to attract customers, to build loyalty, to motivate staff? All true, but for a commercial brand at least, the first answer must always be ‘to make money’.
Huge investments are made in the design, launch and ongoing promotion of brands. Given their potential financial value, this makes sense. Unfortunately, most organisations fail to go beyond that, missing huge opportunities to effectively make use of what are often their most important assets. Monitoring of brand performance should be the next step, but is often sporadic. Where it does take place it frequently lacks financial rigour and is heavily reliant on qualitative measures poorly understood by non-marketers.
As a result, marketing teams struggle to communicate the value of their work and boards then underestimate the significance of their brands to the business. Skeptical finance teams, unconvinced by what they perceive as marketing mumbo jumbo may fail to agree necessary investments. What marketing spend there is can end up poorly directed as marketers are left to operate with insufficient financial guidance or accountability. The end result can be a slow but
steady downward spiral of poor communication, wasted resources and a negative impact on the bottom line.
Brand Finance bridges the gap between the marketing and financial worlds. Our teams have experience across a wide range of disciplines from market research and visual identity to tax and accounting. We understand the importance of design, advertising and marketing, but we also believe that the ultimate and overriding purpose of brands is to make money. That is why we connect brands to the bottom line.
By valuing brands, we provide a mutually intelligible language for marketers and finance teams. Marketers then have the ability to communicate the significance of what they do and boards can use the information to chart a course that maximises profits. Without knowing the precise, financial value of an asset, how can you know if you are maximising your returns? If you are intending to license a brand, how can you know you are getting a fair price? If you are intending to sell, how do you know what the right time is? How do you decide which brands to discontinue, whether to rebrand and how to arrange your brand architecture? Brand Finance has conducted thousands of brand and branded business valuations to help answer these questions.
Brand Finance’s recently conducted share price study revealed the compelling link between strong brands and stock market performance. It was found that investing in the most highly branded companies would lead to a return almost double that of the average for the S&P 500 as a whole. Acknowledging and managing a company’s intangible assets taps into the hidden value that lies within it. The following report is a first step to understanding more about brands, how to value them and how to use that information to benefit the business. The team and I look forward to continuing the conversation with you.
Brand Finance Middle East 50 April 2017 5.Brand Finance Middle East 50 April 2017 4.
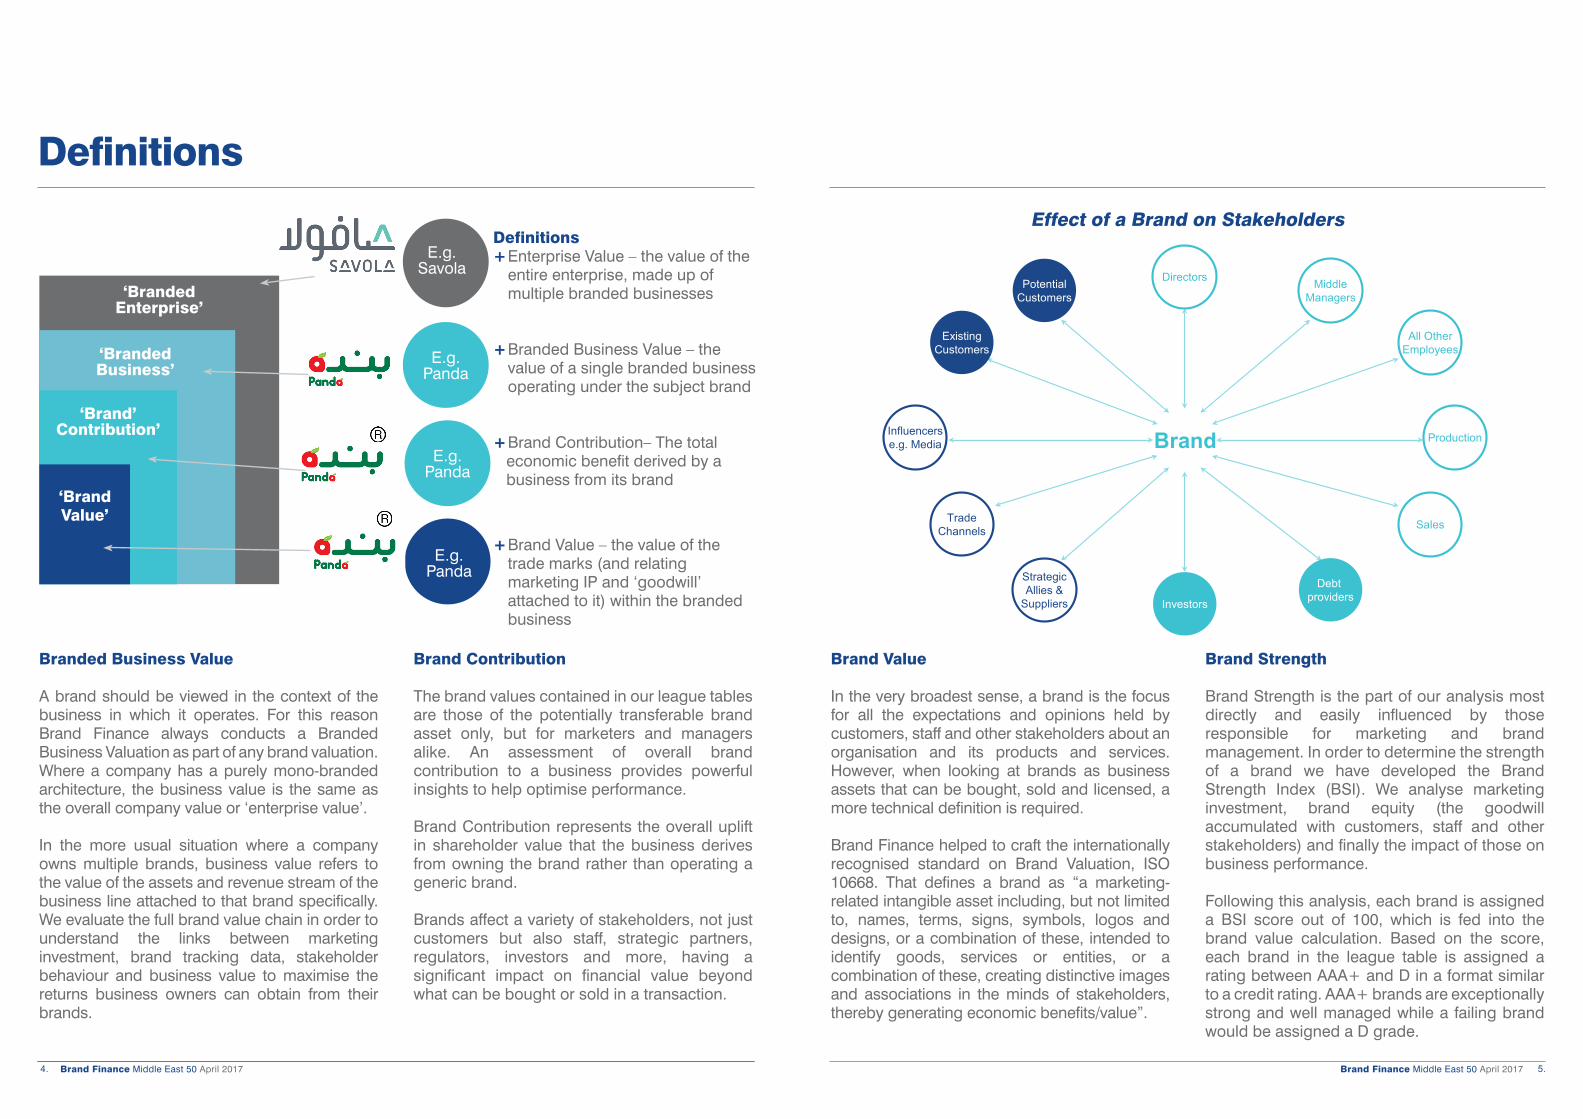
Definitions
Definitions+ Enterprise Value – the value of the
entire enterprise, made up of multiple branded businesses
+ Branded Business Value – the value of a single branded business operating under the subject brand
+ Brand Contribution– The total economic benefit derived by a business from its brand
+ Brand Value – the value of the trade marks (and relating marketing IP and ‘goodwill’ attached to it) within the branded business
‘Branded Business’
‘Branded Enterprise’
E.g.Savola
E.g.Panda
E.g.Panda
‘Brand Value’
‘Branded Business’
‘Branded Enterprise’
‘Brand’ Contribution’
E.g.Panda
Branded Business Value
A brand should be viewed in the context of the business in which it operates. For this reason Brand Finance always conducts a Branded Business Valuation as part of any brand valuation. Where a company has a purely mono-branded architecture, the business value is the same as the overall company value or ‘enterprise value’.
In the more usual situation where a company owns multiple brands, business value refers to the value of the assets and revenue stream of the business line attached to that brand specifically. We evaluate the full brand value chain in order to understand the links between marketing investment, brand tracking data, stakeholder behaviour and business value to maximise the returns business owners can obtain from their brands.
Brand Contribution
The brand values contained in our league tables are those of the potentially transferable brand asset only, but for marketers and managers alike. An assessment of overall brand contribution to a business provides powerful insights to help optimise performance.
Brand Contribution represents the overall uplift in shareholder value that the business derives from owning the brand rather than operating a generic brand.
Brands affect a variety of stakeholders, not just customers but also staff, strategic partners, regulators, investors and more, having a significant impact on financial value beyond what can be bought or sold in a transaction.
Brand Value
In the very broadest sense, a brand is the focus for all the expectations and opinions held by customers, staff and other stakeholders about an organisation and its products and services. However, when looking at brands as business assets that can be bought, sold and licensed, a more technical definition is required.
Brand Finance helped to craft the internationally recognised standard on Brand Valuation, ISO 10668. That defines a brand as “a marketing-related intangible asset including, but not limited to, names, terms, signs, symbols, logos and designs, or a combination of these, intended to identify goods, services or entities, or a combination of these, creating distinctive images and associations in the minds of stakeholders, thereby generating economic benefits/value”.
Brand Strength
Brand Strength is the part of our analysis most directly and easily influenced by those responsible for marketing and brand management. In order to determine the strength of a brand we have developed the Brand Strength Index (BSI). We analyse marketing investment, brand equity (the goodwill accumulated with customers, staff and other stakeholders) and finally the impact of those on business performance.
Following this analysis, each brand is assigned a BSI score out of 100, which is fed into the brand value calculation. Based on the score, each brand in the league table is assigned a rating between AAA+ and D in a format similar to a credit rating. AAA+ brands are exceptionally strong and well managed while a failing brand would be assigned a D grade.
Effect of a Brand on Stakeholders
PotentialCustomers
ExistingCustomers
Influencerse.g. Media
TradeChannels
StrategicAllies &
Suppliers Investors
Debt providers
Sales
Production
All OtherEmployees
MiddleManagers
Directors
Brand

Brand Finance Middle East 50 April 2017 7.Brand Finance Middle East 50 April 2017 6.
Methodology
InputsStakeholderBehaviour
PerformanceBrand Equity Value Drivers
Brand Contribution
Audit the impact of brand management and investment on brand equity
Run analytics to understand how perceptions link to behaviour
Link stakeholder behaviour with key financial value drivers
Model the impact of behaviour on core financial performance and isolating the value of the brand contribution
Brand Audit Trial & Preference Acquisition & Retention
Valuation Modelling
1 2 3 4
Brand Finance Typical Project ApproachBrand Finance calculates the values of the brands in its league tables using the ‘Royalty Relief approach’. This approach involves estimating the likely future sales that are attributable to a brand and calculating a royalty rate that would be charged for the use of the brand, i.e. what the owner would have to pay for the use of the brand—assuming it were not already owned.
Brand strength expressed as a BSI score out of 100.
BSI score applied to an appropriate sector royalty rate range.
Royalty rate applied to forecast revenues to derive brand values.
Post-tax brand revenues are discounted to a net present value (NPV) which equals the brand value.
The steps in this process are as follows:
1 Calculate brand strength on a scale of 0 to 100 based on a number of attributes such as emotional connection, financial performance and sustainability, among others. This score is known as the Brand Strength Index, and is calculated using brand data from the BrandAsset® Valuator database, the world’s largest database of brands, which measures brand equity, consideration and emotional imagery attributes to assess brand personality in a category agnostic manner.
Strong brand
Weak brand
Brand strength index(BSI)
Brand‘Royalty rate’
Brand revenues Brand value
Forecast revenues
Brand investment
Brand equity
Brand performance
2 Determine the royalty rate range for the respective brand sectors. This is done by reviewing comparable licensing agreements sourced from Brand Finance’s extensive database of license agreements and other online databases.
3 Calculate royalty rate. The brand strength score is applied to the royalty rate range to arrive at a royalty rate. For example, if the royalty rate range in a brand’s sector is 1-5% and a brand has a brand strength score of 80 out of 100, then an appropriate royalty rate for the use of this brand in the given sector will be 4.2%.
4 Determine brand specific revenues estimating a proportion of parent company revenues attributable to a specific brand.
5 Determine forecast brand specific revenues using a function of historic revenues, equity analyst forecasts and economic growth rates.
6 Apply the royalty rate to the forecast revenues to derive brand revenues.
7 Brand revenues are discounted post tax to a net present value which equals the brand value.
League Table Valuation Methodology
How We Help to Maximise Value
6. Build scale through licensing/franchising/partnerships
5. Build core business through market expansion
4. Build core business through product development
3. Portfolio management/rebranding Group companies
2. Optimise brand positioning and strength
1. Base-case brand and business valuation(using internal data), growth strategyformulation, target-setting, scorecard andtracker set-up
Evaluate ongoing performance
Current brand and business value
Target brand and business value
Max
imis
ing
a s
tro
ng
bra
nd

Brand Finance Middle East 50 April 2017 9.Brand Finance Middle East 50 April 2017 8.
Emirates has been the most valuable brand in the Middle East ever since Brand Finance initiated its ranking in 2010 and the Dubai-based airline has been top of its industry at a global level for the last five years. However 2017 sees a dramatic shift. Emirates’ brand value is down 21% to US$6.1 billion. This sees it lose its place at the top of its industry; three US brands (American, United and Delta) have overtaken it. Even more dramatically however, Emirates has lost its place as the Middle East’s most valuable brand to STC.
STC grew 11% in value this year to US$6.2 billion. Brand Finance Middle East Managing Director Andrew Campbell comments, “The Riyadh-based giant demonstrates a departure from its once traditional approach; it is embarking down a path of ‘humanisation’, re-engaging its many stakeholders with a fresh, personable outlook. A clear indication of its success is the 5-point increase in its brand strength index score, proving that putting some heart into it pays off.”
Like STC, Ooredoo has generally tried to employ a mono-brand structure. Since rebranding in its home market of Qatar in 2014, Ooredoo has pursued a successful rebrand strategy across seven other markets, establishing a significant regional brand spanning Africa, the Middle East and South East Asia. This has provided a platform for launching a new network in Myanmar, as well as fully dual branding with large, well-established operator, Indosat in Indonesia. Ooredoo’s brand value has grown from below $1bn to more than $3bn in four years, propelling it into the top 10. Ooreedoo is now 6th, up from 11th last year.
Though STC is top and four of the Middle East’s top ten brands are telecoms companies, telecoms is only the second most valuable sector by brand value, accounting for 28% of the total. Banking makes up the biggest share of total brand value of the Brand Finance Middle East’s 50, comprising 43% of the US$75 billion total. Banking is also the source of the region’s fastest growing brand,
Middle East 50
Executive Summary
Rank 2017: 1 2016: 2 BV 2016: $ 6,218m BV 2015: $ 5,613mBrand Rating: AA+
Rank 2017: 2 2016: 1 BV 2016: $ 6,082m BV 2015: $ 7,743mBrand Rating: AAA
Rank 2017: 5 2016: 9 BV 2016: $ 3,406m BV 2015: $ 2,186mBrand Rating: AAA-
1
2
5
+11%
-21%
Rank 2017: 6 2016: 11 BV 2016: $ 3,104m BV 2015: $ 2,104mBrand Rating: AA
Rank 2017: 7 2016: 7 BV 2016: $ 2,593m BV 2015: $ 2,308mBrand Rating: AA-
Rank 2017: 8 2016:17 BV 2016: $ 2,497m BV 2015: $ 1,538mBrand Rating: AA+
Rank 2017: 9 2016: 10 BV 2016: $ 2,339m BV 2015: $ 2,141mBrand Rating: AA+
6
7
8
9
+48%
+12%
+9%
+56%
Rank 2017: 3 2016: 3 BV 2016: $ 5,512m BV 2015: $ 3,797mBrand Rating: AA+
3
Rank 2017: 4 2016: 5 BV 2016: $ 3,826m BV 2015: $ 2,453mBrand Rating: AA+
4 +56%
Rank 2017: 10 2016: 20 BV 2016: $ 2,186m BV 2015: $ 1,232mBrand Rating: AAA-
10 +77%
+45% +62%
Dubai Islamic Bank, whose brand value is up 136% on 2016.
This growth has been aided by its strength in the Islamic banking sector. Dubai Islamic Bank has the largest brand value contribution from Islamic banking of any bank brand; US$580 million of its US$1.9 billion total brand value. The Middle East’s most valuable bank brands cannot quite match DIB’s rate of growth, but have nonetheless put in a strong performance.
Qatar National Bank, the Middle East’s most valuable bank brand is up 56%. QNB completed the acquisition of Turkey’s Finansbank this year and continues to strengthen its position not just in the Middle East but in Africa and Asia too. Commenting on the results, Yousef Darwish, QNB GM Communications, stated, “We are extremely proud to confirm our dominant position as the leading bank in the Middle East and Africa, and it great to get confirmation from the Brand Finance

Brand Finance Middle East 50 April 2017 11.Brand Finance Middle East 50 April 2017 10.
Executive Summary
data that our hard work on positioning and building the brand, across the 3 continents and more than 30 countries where we operate, has paid off. It remains a key focus area for QNB Group to continuously strengthen the brand - in support of the QNB Group vision of becoming a leading bank in the Middle East and Africa and South East Asia by 2020.”
The Middle East’s second most valuable bank brand is Emirates NBD, which like QNB has grown 56% in the last year. National Bank of Abu Dhabi and Abu Dhabi Commercial Bank are up 62% and 77% respectively.
Brand Finance’s head banking analyst Alex Corringham comments: “The increase in brand performance of so many of the Middle East’s bank brands has come about as a result of more favourable economic conditions, international expansion and an increased need for branded products and services within these markets. Over the past few years many have replaced their older, more localised brand names and logos for those that resonate with consumers and can be recognised on an international level.”
Airlines is the third most significant sector by brand value and has seen its share of the total fall to 14%. Explaining the difficult year faced by GCC airlines, Brand Finance CEO David Haigh comments, “Last year, Emirates’ half-year profits plunged 75%. The lower oil price has levelled the playing field for international rivals, leading to increased competition, driving down fares. The discount rate applied to all Gulf airlines has increased in tandem with this less favourable environment, reducing long term value. Finally, the strength of the dollar has increased operating costs and also had a negative FX impact on all non-US domiciled brands.” Etihad has weathered the trend fairly well, its value is flat, staying at US$1.56bn. Qatar Airways has been most strongly affected, with brand value falling 38% from 2016 to US$2.16 billion, losing its position as Qatar’s most valuable brand to QNB.
Brand Value Over Time
0
1
2
3
4
5
6
7
8
Emirates NBD
QNB
Etisalat
Emirates
STC
2017201620152014201320122011
Bra
nd
val
ue
(US
Db
n)
Colour Sector Total Brand Value ($Bn)
% of Total Brand Value
Banks 32.0 43%
Telecoms 20.9 28%
Airlines 10.5 14%
Food 3.0 4%
Chemicals 2.7 4%
Pro Services 2.4 3%
Utilities 1.7 2%
Others 2.0 3%
Total 75.3 100%
Total Brand value by Sector 2017
Banks43%
Airlines14%
KEY
Telecoms28%
-1900.000000-1342.857143-785.714286-228.571429328.571429885.7142861442.857143
Emirates
Qatar Airways
Mobily
Samba
NCB
Al-Rajhi Bank
TAQA
SABB
Arab National Bank
Riyad Bank
Union National Bank
Almarai
First Gulf Bank
Abu Dhabi Commercial Bank
National Bank of Abu Dhabi
Ooredoo
Dubai Islamic Bank
Emirates NBD
QNB
Etisalat $1715
$1373
$1220
$1084
$1001
$959
$954
$485
$285
$214
-70 -44 -18 8 34 60 86 112 138 164 190
Qatar Airways
TAQA
Samba
Emirates
Mobily
SABB
Arab National Bank
Masraf Al Rayan
The Commercial Bank of Qatar
NCB
Qatar Islamic Bank
First Gulf Bank
Etisalat
Ooredoo
Union National Bank
Emirates NBD
QNB
National Bank of Abu Dhabi
Abu Dhabi Commercial Bank
Dubai Islamic Bank
$-65
$-91
$-184
$-199
$-210
$-259
$-265
$-362
$-1329
$-1661
136%
77%
62%
56%
56%
49%
48%
45%
35%
32%
-12%
-12%
-13%
-13%
-19%
-21%
-21%
-24%
-29%
-38%
Brand Value Change 2016-2017 (USDm)
Brand Value Change 2016-2017 (%)
-1900.000000-1342.857143-785.714286-228.571429328.571429885.7142861442.857143
Emirates
Qatar Airways
Mobily
Samba
NCB
Al-Rajhi Bank
TAQA
SABB
Arab National Bank
Riyad Bank
Union National Bank
Almarai
First Gulf Bank
Abu Dhabi Commercial Bank
National Bank of Abu Dhabi
Ooredoo
Dubai Islamic Bank
Emirates NBD
QNB
Etisalat $1715
$1373
$1220
$1084
$1001
$959
$954
$485
$285
$214
-70 -44 -18 8 34 60 86 112 138 164 190
Qatar Airways
TAQA
Samba
Emirates
Mobily
SABB
Arab National Bank
Masraf Al Rayan
The Commercial Bank of Qatar
NCB
Qatar Islamic Bank
First Gulf Bank
Etisalat
Ooredoo
Union National Bank
Emirates NBD
QNB
National Bank of Abu Dhabi
Abu Dhabi Commercial Bank
Dubai Islamic Bank
$-65
$-91
$-184
$-199
$-210
$-259
$-265
$-362
$-1329
$-1661
136%
77%
62%
56%
56%
49%
48%
45%
35%
32%
-12%
-12%
-13%
-13%
-19%
-21%
-21%
-24%
-29%
-38%

Brand Finance Middle East 50 April 2017 13.Brand Finance Middle East 50 April 2017 12.
Executive Summary
BSI Score
87.3BSI Score
81.8BSI Score
81.2BSI Score
79.8BSI Score
79.3BSI Score
79.3BSI Score
78.7BSI Score
78.5BSI Score
77.6BSI Score
77.3
The 10 Most Powerful BrandsThese are the most powerful Middle Eastern brands, whose rating is based on Brand Finance’s Brand Strength Index (BSI).
Although many airline brand values have dropped significantly, brand strength is holding up well. Brand Strength is the part of our analysis most directly and easily influenced by those responsible for marketing and brand management. We analyse marketing investment, brand equity factors such as familiarity, consideration, preference, satisfaction, recommendation, governance and sustainability and finally the impact of those on business performance.
Looking at brand strength reveals that despite Emirates’ significant brand value drop, brand strength has not been affected. With a Brand Strength Index score of 87.3 Emirates remains the Middle East’s most powerful brand by a long way. At the international level it has lost its status as the world’s most powerful airline brand to Aeroflot, though it remains a close second place and with the right strategy could retain its position in 2018. Similarly Qatar Airways has retained its AA+ brand strength rating despite its value fall, meaning that it remains Qatar’s most powerful brand, if not its most valuable.
Zain is the Middle East’s second strongest brand, with a Brand Strength Index score of 81.8, a rare success story for Kuwait, whose brands have been losing ground in recent years. Brand Finance’s Middle East Managing Director Andrew Campbell continues, “Zain flies the flag for Kuwait. It has improved its brand value rank from 10th to 9th and is the Middle East’s second most powerful brand behind Emirates. However Kuwait needs more brands to follow Zain’s example by investing in and managing brand value, if it to regain its podium position in the region.”
It is useful to look not just at the values of a specific brand but also the combined values of all brands owned by a corporate organisation. This emphasises that brands are assets of a larger enterprise to be used to maximise business value. Comparing portfolio values rather than individual brand values in this way reveals some hidden brand powerhouses.
For example, on a portfolio basis, Etisalat comes out on top in the Middle East, US$1.5 bn ahead of second placed STC. Its stable of brands includes not just its flagship, but also Mobily, Maroc Telecom, PTCL, Ufone and Moov. The core brand is growing at a rapid pace (45% year on year) as a result of improving revenues due to focused brand activities, global sports sponsorships and employee satisfaction. As well as developing its core brand, Etisalat has pursued a broader brand portfolio strategy as a way to build business value through leveraging branded assets. Brands such as Mobily in Saudi Arabia provide access to very significant GCC markets and in addition, the portfolio approach has provided a foothold in key regional territories adjacent to the Middle East base - for example through Maroc Telecom in North Africa and in Pakistan. The latter gives the opportunity for branded development of a broader converged proposition, involving mobile and fixed line operators Ufone and PTCL. This brand portfolio strategy opens up a range of opportunities in the future to use brand as a means of growing further business value.
STC’s victory means Saudi Arabia can now lay claim to the region’s most valuable brand after years of the UAE taking the title. Saudi Arabia has been less successful in other respects however. It continues to have the most brands in the table, 18 to UAE’s 17, however this is down from 21 last year. It also continues to trail the UAE on total brand value, making up 32% of the total value of the top 50; the UAE constitutes 44%.
A glance at the top ten goes some way to explaining why. The UAE is home to six of the top ten while there are just two Saudi brands, STC and Almarai. Almarai is one of the few brands not from Banking, Telecoms or the airline industry to feature in the list, reflecting the slightly greater diversity of Saudi Arabia’s brand landscape, which also included Jarir (retail), SABIC (chemicals) and Saudi Electric Company (utilities).
Rank 2017: 1 BV 2017: $ 7,728m BV 2016: $ 6,294m
Rank 2017: 2BV 2017: $ 6,218m BV 2016: $ 5,613m
Rank 2017: 5BV 2017: $ 3,722m BV 2016: $ 2,914m
1
2
5
Rank 2017: 3 BV 2017: $ 6,082m BV 2016: $ 7,743m
3
Rank 2017: 4 BV 2017: $ 3,826m BV 2016: $ 2,453m
4
The 5 Most Valuable Middle Eastern Brand Portfolios

Brand Finance Middle East 50 April 2017 15.Brand Finance Middle East 50 April 2017 14.
Executive Summary
Top 50 most valuable Middle Eastern brands 1 - 50.
Rank2017
Rank2016 Brand name Sector Country Brand
Value ($m)2017
%change
Brand Value ($m)
2016
Brandrating2017
Brandrating2016
1 2 STC Telecoms Saudi Arabia 6,218 11% 5,613 AA+ AA2 1 Emirates Airlines Uae 6,082 -21% 7,743 AAA AAA3 3 Etisalat Telecoms Uae 5,512 45% 3,797 AA+ AA-4 5 QNB Banks Qatar 3,826 56% 2,453 AA+ AA5 9 Emirates NBD Banks Uae 3,406 56% 2,186 AAA- AA6 11 Ooredoo Telecoms Qatar 3,104 48% 2,104 AA AA+7 7 Almarai Food Saudi Arabia 2,593 12% 2,308 AA- AA-8 17 National Bank of Abu Dhabi Banks Uae 2,497 62% 1,538 AA+ AA-9 10 Zain Telecoms Kuwait 2,339 9% 2,141 AA+ AA+10 20 Abu Dhabi Commercial Bank Banks Uae 2,186 77% 1,232 AAA- AA11 4 Qatar Airways12 6 Al-Rajhi Bank13 12 SABIC14 13 Du15 8 NCB16 14 Emaar Properties17 26 Dubai Islamic Bank18 19 First Gulf Bank19 18 NBK20 16 Etihad Airways21 15 Mobily22 21 Saudi Electricity Company23 23 Riyad Bank24 25 Kuwait Finance House25 22 Samba26 24 SABB27 29 Saudia28 30 Abu Dhabi Islamic Bank29 31 Banque Saudi Fransi30 33 Dp World31 39 Union National Bank32 27 Arab National Bank33 37 RAKBANK34 35 Mashreq35 32 Petro Rabigh36 38 Qatar Islamic Bank37 36 Panda38 44 Agility39 28 TAQA40 New Commercial Bank Of Dubai41 34 The Commercial Bank of Qatar42 40 Doha Bank43 New Jarir44 46 NADEC45 47 OmanTel46 41 Barwa Real Estate47 New Arab Bank48 43 Alawwal49 New Bank Audi50 42 Masraf Al Rayan
Brand Finance Middle East 50 (USDm)
Flag Country Total BV ($Bn)
% of Total BV
Number of brands
UAE 33.1 44% 17
Saudi Arabia 24.5 32% 18
Qatar 11.3 15% 8
Kuwait 5.4 7% 4
Oman 0.4 1% 1
Jordan 0.4 1% 1
Lebanon 0.4 0% 1
Total 75.3 100% 50
Total Brand Value by Country 2017
KEY
UAE44%
Saudi Arabia32%
Qatar15%
Qatar continues to solidify its position as the Middle East’s third most important brand building nation, further marginalising Kuwait, which used to hold that status. Kuwait’s 4 brands now account for 7% of total brand value, the total of Qatar’s 8 brands.
Oman has just one brand in the list, with Omantel managing to improve its rank from 47th to 45th despite modest 5% brand value growth. 2017 sees a positive development for Jordan and Lebanon which have both re-entered the Brand Finance Middle East 50. Jordan’s Arab Bank just edges out Lebanon’s Bank Audi with a brand value of US$382 million to US$368 million. Bahrain is the only GCC nation not to feature. Ahli United bank, Bahrian’s most valuable brand has had a positive year, growing from US$252 million to US$296 million, however this has not been enough to reach the US$358 million threshold for 50th place.

Brand Finance Middle East 50 April 2017 17.Brand Finance Middle East 50 April 2017 16.
Understand Your Brand’s Value
$707
$6,265
$3,031 $2,328 $1,913
213
275 320
607
729
650
0
100
200
300
400
500
600
700
800
2011 2012 2013 2014 2015 2016
58%
37%
4%
Nutrition
Performance Materials
Other Activities
Brand Value Dashboard
$707m AA+78/100
$10,216m
Peer Group Comparison (USDm)Historic brand value performance
Brand Value by Product Segment
7%
Brand Value
€650mEnterprise Value
€9,399m(EUR) (EUR)
(EURm)
$882mBrand Value
€729m(EUR)[XXX]
[XXX]
A Brand Value Report provides a complete breakdown of the assumptions, data sources and calculations used to arrive at your brand’s value. Each report includes expert recommendations for growing brand value to drive business performance and offers a cost-effective way to gaining a better understanding of your position against competitors.
A full report includes the following sections which can also be purchased individually.
Brand Valuation Summary Overview of the brand valuation including executive summary, explanation of changes in brand value and historic and peer group comparisons.
+ Internal understanding of brand+ Brand value tracking+ Competitor benchmarking+ Historical brand value
Brand Strength Index
A breakdown of how the brand performed on various metrics of brand strength, benchmarked against competitor brands in a balanced scorecard framework.
+ Brand strength tracking+ Brand strength analysis+ Management KPI’s+ Competitor benchmarking
Brand PerformanceAn ideal balanced scorecard of fundamental brand related measures
Brand Performance
Brand Strength Index
The brand’s ability to drive a volume premium. Implied by current and future revenue.
The brand’s ability to drive a price premium. Implied by current and future margins.
The brand’s ability to improve business prospects across
various KPIs
Revenue Margin % Forecast Revenue Growth % Forecast Margin %
6.25% 6.25% 6.25%
Dow Akzo Nobel Du Pont
Effective Weighting
Best in Class
6.25%
Akzo Nobel
8.98.1
5.0
8.9
0.0
2.0
4.0
6.0
8.0
10.0
DSM Best in Class Competitor Average[XXX]
Drivers of ChangeThree key areas impact Brand Value (EURm)
Brand Strength
[XXX]’s brand strength has increased compared to last year.
As the brand continues its sustainability drive, [XXX] hasbeen improving across all CSR scores. It now has thehighest CSR scores it has had in the last four years acrossEnvironment, Employees and Governance.
The premium approach is also leading to significant marginadvantages – positively affecting “performance”.
Business Outlook
Brands drive higher revenues. An investor would thereforepay more for a brand that makes more money.
[XXX]’s revenue base and the 5 year forecast growth havefallen this year, resulting in a loss of $177m USD to totalbrand value.
However, it is important to note that this has arisen as aresult of the company divesting a number of divisions.
Economic Outlook
All future returns are subject to risk. If the risk of notreceiving the forecast returns is higher (increasing thediscount rate), the brand’s market is not growing as quicklyas expected (lower long term growth rate) or the tax rate inthe brand’s regions of operation is higher, then the brand’svalue is reduced and vice versa.
2016 2015
Discount Rate 9.1% 8.6%
Long Term Growth 3.2% 2.6%
Tax 28.9% 30.2%
2016 2015
5 Year Forecast Growth 2.6% 3.4%
Base Year Revenue (EURm)
8,205 9,570
2016 2015
BrandStrength 78 76
729 729616 616 650
18 13134
2015 Brand Strength Business Performance External Changes 2016
Brand InvestmentProven inputs that drive the Brand Equity and financial results
Relative quality of the brand’s investment in its products. The measure can include R&D spend and capital expenditure.
Relative quality of a brand’s distribution network. It can include the quality of logistical infrastructure available to the brand, the quality of its online presence, or the number and quality of its retail outlets.
Relative quality of the human network supporting the brand. This may include the size of the support network, its likely future growth or the investment in workforce training and human resources.
Relative quality of the brand’s promotions. Marketing investment, the quality of visual identity and the effectiveness of the brand’s social media is covered by this measure.
Product Place People Promotion
Brand Investment
Brand Strength Index
6.25% 6.25% 6.25%
Du Pont Multiple Akzo Nobel
Effective Weighting
Best in Class
6.25%
[XXX]
7.7
9.3
5.36.4
0.0
2.0
4.0
6.0
8.0
10.0
DSM Best in Class Competitor Average[XXX]
Royalty Rates
Analysis of competitor royalty rates, industry royalty rate ranges and margin analysis used to determine brand specific royalty rate.
+ Transfer pricing+ Licensing/ franchising negotiation+ International licensing+ Competitor benchmarking
Cost of Capital
A breakdown of the cost of capital calculation, including risk free rates, brand debt risk premiums and the cost of equity through CAPM.
+ Independent view of cost of capital for internal valuations and project appraisal exercises
Trademark Audit
Analysis of the current level of protection for the brands word marks and trademark iconography highlighting areas where the marks are in need of protection.
+ Highlight unprotected marks + Spot potential infringement+ Trademark registration strategy
For more information regarding our Brand Value Reports, please contact:
Alex HaighDirector of League Tables, Brand Finance
+44 (0)20 7389 9400
Brand Strength Index 2016An ideal balanced scorecard of fundamental brand related measures
Widely recognised factors deployed by Marketers to create brand loyalty and market share. We therefore benchmark brands against relevant input measures by sector against each of these factors.
How do stakeholders feel about the brand vs. competitors?
• Brand equity accounts for 50% to reflect the importance of stakeholder perceptions to behaviour
• Brand Equity is important to all stakeholder groups with customers being the most important
Quantitative market, market share and financial measures resulting from the strength of the brand.
BSI Attributes
Product: R&D expenditure,Capital expenditure
Place: Website Ranking
People: Number of Employees,Employee Growth
Promotion: Marketing expenditure
FamiliarityConsiderationPreferenceSatisfactionRecommendation/NPS
Employee Score
Credit RatingAnalyst Recommendation
Environment ScoreCommunity ScoreGovernance Score
Revenue% Margin% Forecast Margin% Forecast Revenue Growth
Bra
nd
Str
eng
th In
dex
35%
25%
5%
5%
5%
Effective Weighting
25%Brand
Investment
25%
BrandEquity
50%
BrandPerformance
25%
Customer
Outputs
Inputs
Staff
Financial
External
6.25%
6.25%
6.25%
6.25%
5.00%
7.50%
7.50%
7.50%
7.50%
5.00%
2.50%
2.50%
1.67%
1.67%
1.67%
6.25%
6.25%
6.25%
6.25%
Determining the Royalty RateIn order to apply the Brand Strength Index, a hypothetical royalty rate range needs to be set
Following the OECD guidelines, Brand Finance sets the hypothetical brand royalty rate ranges by reference to three tests:
• Comparable Agreements: A search of comparable licensing agreements for brands in each industry is conducted every year. The margin analysesare then compared against the royalty rates found in these agreements to analyse the importance of brand in the industry and set an appropriateaverage industry royalty rate.
• Industry Margins: An analysis of 25% to 40% of margins, generally accepted as rules of thumb for licensing rates for all intangible assets in acompany. These rates are adjusted to take into account the importance of brand in a given industry.
• Affordability: Thirdly, an analysis of the brand’s specific royalties is conducted. If the brand has been able to sustain extraordinary profits over anextended time it is likely that hypothetical brand owners would be willing to pay closer to the company’s margins than the industry average. In thecase of Brand Finance’s League Table models, affordability will be based on the forecast EBIT.
• Average industry royalty rate ranges can be seen below
High
Mid
Low
Brand Valuation AssumptionsUnderlying economic assumptions used in valuation
Brand value (EURm)
$650
Discount Rate
Earnings in the future are worth lessthan consumption now. This rate istherefore used to reduce futureearnings to their value today.
Long Term Growth Rate
After the explicit forecasts, the brandwill continue to grow. However, it isunlikely that the company will sustainextraordinary returns into the futureso forecast industry growth rates areapplied.
Revenue
Licensing payments for the use of abrand are derived from revenue.Increases or decreases in forecastedrevenue increase or decrease thefinal valuation.
Tax Rate
Forecasted royalties are reduced bythe tax rate to reflect the actualamount that would be received bythe brand owner after tax.
5 year Compound Annual Growth Rate (CAGR)
2015 2014
2.6% 3.4% -0.8%
Discount Rate
2015 2014
9.1% 8.6% +0.5%
Long Term Growth Rate
2015 2014
3.2% 2.6% +0.6%
Tax Rate
2015 2014
29% 30% -1.3%
Brand Investment
Brand Equity
Brand Performance
X = $Forecast revenues
%Strong brand
Weak brand
0.00% 0.00% 0.00% 0.00% 0.00% 0.00%
0.8% 0.8%
0.6%
0.8% 0.8%
1.2%
0.6% 0.6%
0.5%
0.6%0.7%
1.0%
DSM BASF Dow Du Pont Akzo Nobel Akzo Nobel
Competitor Royalty RatesCompetitor royalty rates will be different based on different strengths of the brand, having different operating segments and company-specific long term affordability
[XXX] BASF Dow Du Pont Akzo Nobel - CorporateAkzo Nobel – Paints and
Coatings
78 78 80 80 82 82
[XXX]

Brand Finance Middle East 50 April 2017 19.Brand Finance Middle East 50 April 2017 18.
How we can help
MARKETING FINANCE TAX LEGAL
Contact usFor brand value report enquiries, please contact:Alex HaighDirector of League Tables Brand Finance [email protected]
For media enquiries, please contact:Robert HaighMarketing & Communications Director Brand Finance [email protected]
For all other enquiries, please contact:[email protected]+44 (0)207 389 9400
linkedin.com/company/brand-finance
facebook.com/brandfinance
twitter.com/brandfinance
For further information on Brand Finance®’s services and valuation experience, please contact your local representative:
Country Contact Email addressAustralia Mark Crowe [email protected] Pedro Tavares [email protected] Bill Ratcliffe [email protected] Minnie Fu [email protected] Nigel Cooper [email protected] Africa Jawad Jaffer [email protected] Victoire Ruault [email protected] Dr. Holger Mühlbauer h.mü[email protected] Ioannis Lionis [email protected] Marc Cloosterman [email protected] Ajimon Francis [email protected] Jimmy Halim [email protected] Massimo Pizzo [email protected] Samir Dixit [email protected] Laurence Newell [email protected] (exc. Brazil) Laurence Newell [email protected] East Andrew Campbell [email protected] Babatunde Odumeru [email protected] Pedro Tavares [email protected] Alexander Eremenko [email protected] Alexander Todoran [email protected] Samir Dixit [email protected] Africa Jeremy Sampson [email protected] Lorena Jorge ramirez [email protected] Lanka Ruchi Gunewardene [email protected] Victoire Ruault [email protected] Muhterem Ilgüner [email protected] Alex Haigh [email protected] Ken Runkel [email protected] Lai Tien Manh [email protected]
Contact detailsOur offices
Disclaimer
Brand Finance has produced this study with an independent and unbiased analysis. The values derived and opinions produced in this study are based only on publicly available information and certain assumptions that Brand Finance used where such data was deficient or unclear . Brand Finance accepts no responsibility and will not be liable in the event that the publicly available information relied upon is subsequently found to be inaccurate.
The opinions and financial analysis expressed in the report are not to be construed as providing investment or business advice. Brand Finance does not intend the report to be relied upon for any reason and excludes all liability to any body, government or organisation.
We help marketers to connect their brands to business performance by evaluating the return on investment (ROI) of brand based decisions and strategies.
+ Branded Business Valuation+ Brand Contribution+ Trademark Valuation+ Intangible Asset Valuation+ Brand Audit+ Market Research Analytics+ Brand Scorecard Tracking+ Return on Marketing Investment+ Brand Transition+ Brand Governance+ Brand Architecture & Portfolio Management+ Brand Positioning & Extension+ Franchising & Licensing
We provide financiers and auditors with an independent assessment on all forms of brand and intangible asset valuations.
+ Branded Business Valuation+ Brand Contribution+ Trademark Valuation+ Intangible Asset Valuation+ Brand Audit+ Market Research Analytics+ Brand Scorecard Tracking+ Return on Marketing Investment+ Brand Transition+ Brand Governance+ Brand Architecture & Portfolio Management+ Brand Positioning & Extension+ Mergers, Acquisitions and Finance Raising Due Diligence+ Franchising & Licensing+ Tax & Transfer Pricing+ Expert Witness
We help brand owners and fiscal authorities to understand the implications of different tax, transfer pricing and brand ownership arrangements.
+ Branded Business Valuation+ Brand Contribution+ Trademark Valuation+ Intangible Asset Valuation+ Brand Audit+ Market Research Analytics+ Franchising & Licensing+ Tax & Transfer Pricing+ Expert Witness
We help clients to enforce and exploit their intellectual property rights by providing independent expert advice in- and outside of the courtroom.
+ Branded Business Valuation+ Brand Contribution+ Trademark Valuation+ Intangible Asset Valuation+ Brand Audit+ Tax & Transfer Pricing+ Expert Witness
2. Analytics: How can I improve marketing effectiveness?
Analytical services help to uncover drivers of demand and insights. Identifying the factors which drive
consumer behaviour allow an understanding of how brands create bottom-line impact.
• Market Research Analytics • Brand Audits
• Brand Scorecard Tracking • Return on Marketing Investment
3. Strategy: How can I increase the value of my branded business?
Strategic marketing services enable brands to be leveraged to grow businesses. Scenario
modelling will identify the best opportunities, ensuring resources are allocated to those activities
which have the most impact on brand and business value.
• Brand Governance • Brand Architecture & Portfolio Management
• Brand Transition • Brand Positioning & Extension
4. Transactions: Is it a good deal? Can I leverage my intangible assets?
Transaction services help buyers, sellers and owners of branded businesses get a better deal by leveraging the value of their intangibles.
• M&A Due Diligence • Franchising & Licensing
• Tax & Transfer Pricing • Expert Witness
1. Valuation: What are my intangible assets worth?
Valuations may be conducted for technical purposes and to set a baseline against which potential strategic brand scenarios can be evaluated.
• Branded Business Valuation • Trademark Valuation
• Intangible Asset Valuation • Brand Contribution
2. ANALYTICS
3. STRATEGY 4.TRANSACTI
ON
1. V
ALUATION
Brand & Business Value

Contact us.
The World’s Leading Independent Branded Business Valuation and Strategy ConsultancyT: +971 5081 13341 E: [email protected] www.brandfinance.com
Bridging the gap between marketing and finance