Embed Size (px)
Citation preview

A&A 524, A33 (2010)DOI: 10.1051/0004-6361/201015504c© ESO 2010
Astronomy&
Astrophysics
Mid-infrared spectroscopy of Spitzer-selected ultra-luminousstarbursts at z ∼ 2�
N. Fiolet1,2, A. Omont1,2, G. Lagache3,4, B. Bertincourt3,4, D. Fadda5, A. J. Baker6, A. Beelen3,4, S. Berta7,F. Boulanger3,4, D. Farrah8, A. Kovács9, C. Lonsdale10, F. Owen11, M. Polletta1,2,12, D. Shupe13, and L. Yan5
1 UPMC Univ. Paris 06, UMR7095, Institut d’Astrophysique de Paris, 75014 Paris, Francee-mail: [email protected]
2 CNRS, UMR7095, Institut d’Astrophysique de Paris, 75014 Paris, France3 Univ. Paris-Sud, Institut d’Astrophysique Spatiale, UMR8617, 91405 Orsay, France4 CNRS, 91405 Orsay, France5 Spitzer Science Center, California Institute of Technology, MS 220-6, Pasadena, CA 91125, USA6 Department of Physics and Astronomy, Rutgers, the State University of New Jersey, 136 Frelinghuysen Road,
Piscataway NJ 08854, USA7 Max-Planck Institut für extraterrestrische Physik, Postfach 1312, 85741 Garching, Germany8 Department of Physics & Astronomy, University of Sussex, Falmer, Brighton BN1 9RH, UK9 University of Minnesota, 116 Church St SE, Minneapolis, MN 55414, USA
10 North American ALMA Science Center, NRAO, Charlottesville, USA11 National Radio Astronomy Observatory, PO Box O, Socorro, NM 87801, USA12 INAF - IASF Milano, via E. Bassini 15, 20133, Italy13 Herschel Science Center, California Institute of Technology, 100-22, Pasadena, CA 91125, USA
Received 30 July 2010 / Accepted 26 August 2010
ABSTRACT
Context. Spitzer’s wide-field surveys and followup capabilities have allowed a new breakthrough in mid-IR spectroscopy up to red-shifts ≥2, especially for 24 μm detected sources.Aims. We want to study the mid-infrared properties and the starburst and AGN contributions, of 24 μm sources at z ∼ 2, throughanalysis of mid-infrared spectra combined with millimeter, radio, and infrared photometry. Mid-infrared spectroscopy allows us torecover accurate redshifts.Methods. A complete sample of 16 Spitzer-selected sources (ULIRGs) believed to be starbursts at z ∼ 2 (“5.8 μm-peakers”) wasselected in the (0.5 deg2) J1064+56 SWIRE Lockman Hole field (“Lockman-North”). These sources have S 24 μm > 0.5 mJy, a stellaremission peak redshifted to 5.8 μm, and r′Vega > 23. The entire sample was observed with the low resolution units of the Spitzer/IRSinfrared spectrograph. These sources have 1.2 mm observations with IRAM 30 m/MAMBO and very deep 20 cm observations fromthe VLA. Nine of our sources also benefit from 350 μm observation and detection from CSO/SHARC-II. All these data were jointlyanalyzed.Results. The entire sample shows good quality IRS spectra dominated by strong PAH features. The main PAH features at 6.2, 7.7,8.6, and 11.3 μm have high S/N average luminosities of 2.90 ± 0.31, 10.38 ± 1.09, 3.62 ± 0.27, and 2.29 ± 0.26 × 10¹⁰ L�, respec-tively. Thanks to their PAH spectra, we derived accurate redshifts spanning from 1.750 to 2.284. The average of these redshifts is2.017 ± 0.038. This result confirms that the selection criteria of “5.8 μm-peakers” associated with a strong detection at 24 μm arereliable to select sources at z ∼ 2. We have analyzed the different correlations between PAH emission and infrared, millimeter, andradio emissions. Practically all our sources are strongly dominated by starburst emission, with only one source showing an importantAGN contribution. We have also defined two subsamples based on the equivalent width at 7.7 μm to investigate AGN contributions.Conclusions. Our sample contains strong starbursts and represents a particularly 24 μm-bright class of SMGs. The very good cor-relation between PAH and far-IR luminosities is now confirmed in high-z starburst ULIRGs. These sources show a small AGNcontribution to the mid-IR, around ∼20% or less in most cases.
Key words. galaxies: high-redshift – galaxies: starburst – galaxies: active – infrared: galaxies – submillimeter: galaxies –techniques: spectroscopic
1. Introduction
The mid-infrared (MIR) regime is known to provide very richdiagnostics of the interstellar medium (ISM) of galaxies. Hotdust from starbursts and especially AGN contributes to contin-uum emission. Dust also produces various absorption features,most spectacularly from silicates. However, the MIR spectra of
� Colour figures and Appendices are only available in the electronicform at http://www.aanda.org
star-forming galaxies are dominated by strong emission featuresattributed to polycyclic aromatic hydrocarbons (PAHs). Theselarge molecules, typically a few hundred carbon atoms in theISM, are the carriers of the series of prominent emission bandsobserved between 3 and 19 μm, especially between 6 and 12 μm(Leger & Puget 1984; Allamandola et al. 1985). PAHs efficientlyabsorb UV and optical photons from young stars and reemit theenergy mostly in the mid-infrared.
Article published by EDP Sciences Page 1 of 20

A&A 524, A33 (2010)
After their discovery in the local ISM and nearby star-forming regions, PAH features have proved to be common, notonly in various regions of the Milky Way, but in other galaxiesranging from local systems to high-z starbursts (e.g., Tielens2008). PAH features were the focus of a good fraction of theMIR spectroscopy programs of the infrared space observatoriesISO and Spitzer. Important key projects of both missions weredevoted to MIR spectroscopy of large samples of galaxies. TheISO Key Project on Nearby Galaxies (Helou et al. 2000) showedan amazing similarity of PAH spectra in various galaxy envi-ronments. More detailed studies with the SINGS spectral map-ping program (Kennicutt et al. 2003) using the Spitzer InfraredSpectrograph (IRS: Houck et al. 2004) provided further evi-dence of interband PAH feature strength variations, especially inthe presence of weak AGN (Smith et al. 2007).
The high sensitivity of Spitzer/IRS allowed the extension ofPAH spectroscopy to z >∼ 2 for samples of hundreds of galax-ies that could be observed in the ∼5–35 μm spectral range. Thisled to the measurement of a large number of redshifts of dust-enshrouded Spitzer sources at 1.5 < z < 2.5 in the so-called“redshift desert” of optical spectroscopy. These MIR spectra al-low one to distinguish power-law AGN-dominated spectra fromPAH starburst-dominated spectra and composite systems. Thislong series of high-z IRS studies has thus established the cri-teria for the identification of various types of sources fromSpitzer 3.5–24 μm photometry (Fadda et al. 2010; Houck et al.2005; Yan et al. 2005, 2007; Sajina et al. 2007; Weedmanet al. 2006; Dasyra et al. 2009; Hernán-Caballero et al. 2009;Bertincourt et al. 2009). Particular types of sources can be se-lected using various criteria: dust-enshrouded AGN from strong24 μm fluxes and/or power-law IRAC 3.6–8.0 μm spectra (Deyet al. 2008; Dey & The Ndwfs/MIPS Collaboration 2009), star-bursts from the presence of a visible redshifted 1.6 μm stellarbump (Farrah et al. 2006, 2008; Lonsdale et al. 2009; Huanget al. 2009; Desai et al. 2009), type 1 or type 2 QSOs (Lutzet al. 2008; Martínez-Sansigre et al. 2008), and submillimeter-selected galaxies (SMGs: Valiante et al. 2007; Menéndez-Delmestre et al. 2007, 2009; Pope et al. 2008; Coppin et al.2010).
Indeed, strong PAH emission is so characteristic of starburststhat the strength of PAH features may be used as a star forma-tion rate indicator. This is justified by the good correlation thathas been found between the luminosity of PAH features (mostlyat 6.2 and 7.7 μm) and the total IR or far-IR luminosity, whichin the absence of an AGN is taken to be a good tracer of star-forming activity (Kennicutt 1998). Such a correlation has beenchecked for starburst galaxies at both low and high redshift (e.g.,Brandl et al. 2006; Pope et al. 2008; Menéndez-Delmestre et al.2009). It is the origin of the correlation found between the ISO7.0 μm- or Spitzer 8.0 μm-band flux and the star formation rate(e.g., Elbaz et al. 2002; Wu et al. 2006; Alonso-Herrero et al.2006; Farrah et al. 2007) in low-z luminous infrared galaxies.It is similarly related to the use of the single-band 24 μm lumi-nosity for determining star formation rates of galaxies at highredshift, especially at z ∼ 2 (e.g., Bavouzet et al. 2008; Riekeet al. 2009; Elbaz 2010, Fiolet et al. in prep.).
Such rich diagnostics of the properties of the ISM and starformation at high redshift provided by mid-IR PAH spectral fea-tures have justified the many studies performed with the uniquecapabilities of Spitzer/IRS. We have used this experience tofocus one of the last observations of “cold” Spitzer to obtainhigh-quality mid-IR spectra of z ∼ 2 starbursts. Our samplewas Spitzer-selected in a field with very rich multiwavelengthdata. We aimed to select starburst-dominated ultra-luminous
IR galaxies at z ∼ 2 based on the presence of a rest-frame 1.6 μmstellar bump – caused by the photospheric opacity minimum ingiant or supergiant stars (e.g. John 1988; Simpson & Eisenhardt1999; Weedman et al. 2006) – in the 5.8 μm IRAC band, to-gether with very strong PAH emission implied by a high 24 μmflux density. Using these “5.8 μm-peakers”, we sought to addressin the best conditions the various goals allowed by such studies:determination of redshifts from PAH features, accurate enoughfor allowing CO line observations with current millimeter facil-ities; detailed examination of the properties of PAH features insuch high-z sources, especially their luminosity ratios, and com-parison to local systems; estimation of the ratio between PAHbands and the weak underlying continuum that may constrainthe modest AGN contribution; and accurate assessment of thecorrelation of PAH luminosities with total and far-infrared lumi-nosities (and with the radio luminosity). Silicate absorption at9.7 μm may provide additional information about the distribu-tion of interstellar dust.
In this paper, we present the observations and the resultsfrom IRS spectroscopy of a complete sample of 16 sources se-lected by their IRAC and MIPS fluxes. The sample selection andthe observations are described in Sect. 2. The method adopted toreduce these observations is presented in Sect. 3. The results andtheir analysis are discussed in Sects. 4 and 5. In Sect. 6, we dis-cuss the discrimination between starburst- and AGN-dominatedsources, and we make comparisons with the other samples ofSMGs. Throughout the paper, we adopt a standard flat cosmol-ogy with H0 = 71 km s−1 Mpc−1, ΩM = 0.27, and ΩΛ = 0.73(Spergel et al. 2003).
2. Sample selection and observations
2.1. Sample selection
Our sample is based on the Spitzer/SWIRE “5.8 μm-peaker”sample of (Fiolet et al. 2009, hereafter F09). Using the 2007SWIRE internal catalogue, we have selected the sixteen 24 μm-brightest sources of this sample with S 24 μm > 0.5 mJy.These sources obey the “5.8 μm-peaker” criteria with S 3.6 μm <S 4.5 μm < S 5.8 μm > S 8.0 μm. Some of our sources have no detec-tion in the 8.0 μm band, but we assume that these sources are also“5.8 μm-peakers” if their fluxes at 5.8 μm are greater than thedetection limits at 8.0 μm (∼40 μJy). To remove low-redshift in-terlopers, we also require that the sources be optically faint, i.e.,r′Vega > 23 (Lonsdale et al. 2006). Our sample is complete for
these criteria over 0.5 deg2. This area includes the “Lockman-North” field observed with the VLA (Owen & Morrison 2008;Owen et al. 2009) and Herschel (Oliver et al. 2010). For thissample from F09, we have 1.2 mm flux densities (S 1.2 mm)obtained with IRAM/MAMBO [Institut de RadioastronomieMillimétrique/Max-Planck Millimeter Bolometer] array (Kreysaet al. 1998). 62% (10/16) of our sources are detected withS/N > 3 at 1.2 mm (Table 1) and are thus submillimeter galaxies(SMGs) with S 1.2 mm > 2 mJy (〈S 1.2 mm〉 = 2.72±0.54 mJy). Thesix other sources have an average 〈S 1.2 mm〉 = 1.01 ± 0.68 mJy(see Table 1 and F09). This sample is thus representative of aSpitzer-selected subclass of powerful z ∼ 2 ULIRGs (SMGs andOFRGs, Chapman et al. in prep; Magdis et al. 2010), of whichthere are ∼2000 in all SWIRE fields that peak at 4.5 or 5.8 μmand have S 24 μm > 500 μJy.
Nine of our sources detected at 1.2 mm were observed at350 μm by Kovács et al. (2010). All these sources have beendetected, and our 16 sources are also detected at 250–350 μmby Herschel (Fiolet et al. in prep; Magdis et al. 2010). The
Page 2 of 20

N. Fiolet et al.: Mid-infrared spectroscopy of Spitzer-selected ultra-luminous starbursts at z ∼ 2
Table 1. Spitzer mid-IR, submillimeter, and radio data of the selected sample.
IDa IAU name S 24 μmb S 24 μm,spectra
c S 350 μmd S 1.2 mm
a S 20 cme α f
(μJy) (mJy) (μJy)L1 SWIRE4_J104351.17+590058.1 664 ± 18 674 ± 38 30.0 ± 10.5 2.95 ± 0.66 76.3 ± 9.0 –0.84L3 SWIRE4_J104410.00+584056.0 589 ± 12 495 ± 80 . . . 1.04 ± 1.11 105.5 ± 35.0 +0.86L5 SWIRE4_J104427.52+584309.6 542 ± 11 645 ± 26 . . . 2.75 ± 0.76 71.0 ± 20.0 –1.03L7 SWIRE4_J104430.60+585518.6 825 ± 13 871 ± 105 . . . 1.39 ± 0.79 101.7 ± 13.3 –0.81L9 SWIRE4_J104440.25+585928.3 653 ± 14 586 ± 109 55.1 ± 17.1 4.00 ± 0.55 116.5 ± 9.2 –0.54L10 SWIRE4_J104549.77+591904.0 626 ± 12 605 ± 76 . . . 1.39 ± 0.81 67.2 ± 11.7 –0.40L11 SWIRE4_J104556.90+585318.8 661 ± 13 825 ± 55 38.9 ± 5.8 3.08 ± 0.58 314.8 ± 4.1 –0.45L14 SWIRE4_J104638.68+585612.5 631 ± 13 661 ± 48 29.7 ± 4.9 2.13 ± 0.71 159.5 ± 6.0 –0.73L15 SWIRE4_J104656.46+590235.5 579 ± 14 695 ± 41 25.7 ± 5.9 2.36 ± 0.62 68.6 ± 3.7 –1.03L17 SWIRE4_J104704.97+592332.3 644 ± 14 629 ± 83 45.3 ± 12.4 2.24 ± 0.64 341.0 ± 33.0 –0.76L19 SWIRE4_J104708.78+590627.2 556 ± 14 618 ± 42 . . . 0.89 ± 0.97 102.2 ± 12.0 –0.44L20 SWIRE4_J104717.96+590231.7 692 ± 15 558 ± 107 51.6 ± 7.2 2.66 ± 0.78 51.1 ± 4.7 –1.25L25 SWIRE4_J104738.32+591010.0 704 ± 13 667 ± 74 36.1 ± 7.1 2.56 ± 0.74 69.0 ± 9.0 –1.09L27 SWIRE4_J104744.60+591413.5 533 ± 13 591 ± 50 27.4 ± 7.9 2.48 ± 0.73 77.2 ± 13.7 –0.38L31 SWIRE4_J104830.70+585659.3 640 ± 16 640 ± 101 . . . 1.62 ± 0.60 121.0 ± 39.0 –0.31L33 SWIRE4_J104848.23+585059.3 536 ± 15 487 ± 61 . . . –0.28 ± 1.09 109.0 ± 33.0 +0.27
Notes. (a) IDs and S 1.2 mm are the same as F09. The bold values are >3σ detections; (b) S 24 μm comes from the internal SWIRE catalogue;(c) S 24 μm,spectra is calculated by convolution of the 24 μm MIPS filter and our spectra; (d) S 350 μm comes from Kovács et al. (2010); (e) S 20 cm
comes from Owen & Morrison (2008); ( f ) The radio spectral index α is calculated using the best power law fit, S ν ∝ να, between S 20 cm, S 50 cm,and S 90 cm as reported in F09.
“5.8 μm-peaker” criterium also implies that our sample is a massselected-sample and has z ∼ 2.
All of our sources benefit from very deep radio data at 1400,610, and 324 MHz from the VLA and GMRT (Owen & Morrison2008; Owen et al. 2009, Owen et al. in prep.), with observed fluxdensities S 20 cm > 50 μJy (Table 1 and F09).
Our sample differs from the other samples of ULIRGs essen-tially in its selection criteria and redshift range. Indeed, Farrahet al. (2008) and Sajina et al. (2007) have selected bright sourcesat 24 μm. However, the sample of Sajina et al. (2007) is built toselect the reddest objects in the [24 μm−8 μm] vs. [24 μm − R]color–color diagram and is composed of PAH-weak and PAH-strong sources. In the comparisons that follow, we consideronly the PAH-strong sources of this sample. Pope et al. (2008),Menéndez-Delmestre et al. (2009), and Valiante et al. (2007)have built samples of SMGs detected at 850 μm. Nevertheless,the sources from Pope et al. (2008) selected with S 24 μm > 200 μJy are fainter than our sources (S 24 μm > 500 μJy). Menéndez-Delmestre et al. (2009) and Valiante et al. (2007) have also se-lected their sample based on 1.4 GHz flux density. The sampleof Desai et al. (2009) is relatively similar to ours, with sourcesselected by a redshifted 1.6 μm stellar bump in the IRAC bandsand S 24 μm > 500 μJy. These sources are also optically faint andsatisfy the definition of Dust-Obscured Galaxies (DOGs: Deyet al. 2008). The sample of Huang et al. (2009) is also selectedwith S 24 μm > 500 μJy and with color–color criteria yieldingstar-forming galaxies. Coppin et al. (2010) have built a sampleof SMGs selected to be AGN-dominated. While our sample hasredshifts from ∼1.7 to ∼2.3, the other samples span larger red-shift ranges. Shi et al. (2009) have selected sources at intermedi-ate redshift around z ∼ 1. Farrah et al. (2008) observed sourceswith z = 1.3−2.2 centered at z ∼ 1.7 (“4.5 μm-peakers”). Thesamples of SMGs from Pope et al. (2008); Menéndez-Delmestreet al. (2009) and Valiante et al. (2007), and the DOG sample ofDesai et al. (2009), span redshifts from ∼1 to ∼3 (0.6 to 3.6 forMenéndez-Delmestre et al. 2009). The sample of star-forminggalaxies of Huang et al. (2009) has redshifts between 1.7 and 2.1centered at z ∼ 1.9. Finally, the sample of Coppin et al. (2010)ranges from z ∼ 2.45 to ∼3.4.
Table 2. Summary of Spitzer IRS observations.
ID LL1 time on target LL2 time on target(s)
L7 2 × 120 × 6 8 × 120 × 6L1, L9, L11, L17, L20, L25 3 × 120 × 6 8 × 120 × 6L3, L10, L14, L15, L31 4 × 120 × 6 9 × 120 × 6L5, L19, L27, L33 5 × 120 × 6 11 × 120 × 6
2.2. Observations
The photometric redshifts of our targets, based on the IRACbands, lie in the range z ∼ 1.5−2.7 with uncertainties of± 0.5 (see F09). In this redshift range, the low-resolution(R ∼ 60−127) Long-Low observing modules of IRS, LL1(19.5−38.0 μm) and LL2 (14.0−21.3 μm), can cover most ofthe PAH emission features from 6.2 to 11.3 μm in the rest frame.Indeed, the actual redshifts have all proved to lie in the range1.7 < z < 2.3 (see Sect. 4.1).
This project (GO50119, PI G. Lagache) was observed for atotal time of 53 h (41 h on-source) during the last cold campaignof Spitzer, on January 20–22, 2009. We have divided our sampleinto four groups based on 24 μm flux density. For each group,the on-target exposure time is summarized in Table 2. We chosethese exposure times following the guidelines from the IRS ISTreport, based on IRS low-resolution observations of two faintsources by Teplitz et al.1 and the Spectroscopy “PerformanceEstimation Tool” (SPEC-PET). We also used our own IRS ob-servations of distant galaxies to check the expected S/N. Theintegration times have been fixed to achieve a S/N ∼ 4–5 perwavelength element in LL1 and LL2. The observations weredone in mapping mode to maximize the rejection of “rogue” pix-els and (immediately after applying the “skydark” calibrations)to limit contamination by latent charge from bright objects in our“Long” spectra of faint sources.
1 http://ssc.spitzer.edu/irs/documents/irs_ultradeep_memo.pdf
Page 3 of 20

A&A 524, A33 (2010)
3. Data reduction
The observed spectra were processed with version S18.5.0 ofthe Spitzer Science Center pipeline. The pipeline produces thebasic calibrated data (BCD), which are corrected for differenteffects (e.g., cosmic ray removal, masking of saturated pixels,and linearization of the science data signal ramps).
Applying the IDL code IrsLow, developed by Fadda et al.(2010) and available on-line2, we have extracted the spectrafrom the BCD. IrsLow is a data reduction code built especiallyfor low-resolution IRS observations. This code makes a back-ground subtraction and extracts the spectra of the target. Thebackground is estimated after the user has manually masked theregions of interest of the data. In practice, we mask the posi-tion of the sources on the spectra to estimate and subtract thebackground. The spectrum is then extracted using a PSF fitting.The code also allows the simultaneous extraction of two differentspectra in the case of two nearby sources. The details of usingIrsLow and some examples can be found in Fadda et al. (2010).The output of the program is an ASCII file containing the spec-trum and its errors. To facilitate our analysis, we make somemodifications to each of these files. First, we limit the wave-lengths to 20.5 μm through 35 μm for the first order (i.e., LL1)– the errors on the flux outside this range becoming quite large– and to <20.5 μm for the second order (i.e., LL2). Second, wesort the data by wavelength. Finally, we smooth the spectrum inIDL. This filter makes a running mean over five points provid-ing thus an effective spectral channel width of 0.10 μm. To avoidartificial improvement of S/N, the errors on the spectra are keptunchanged by the smooth filter.
4. Results: spectra
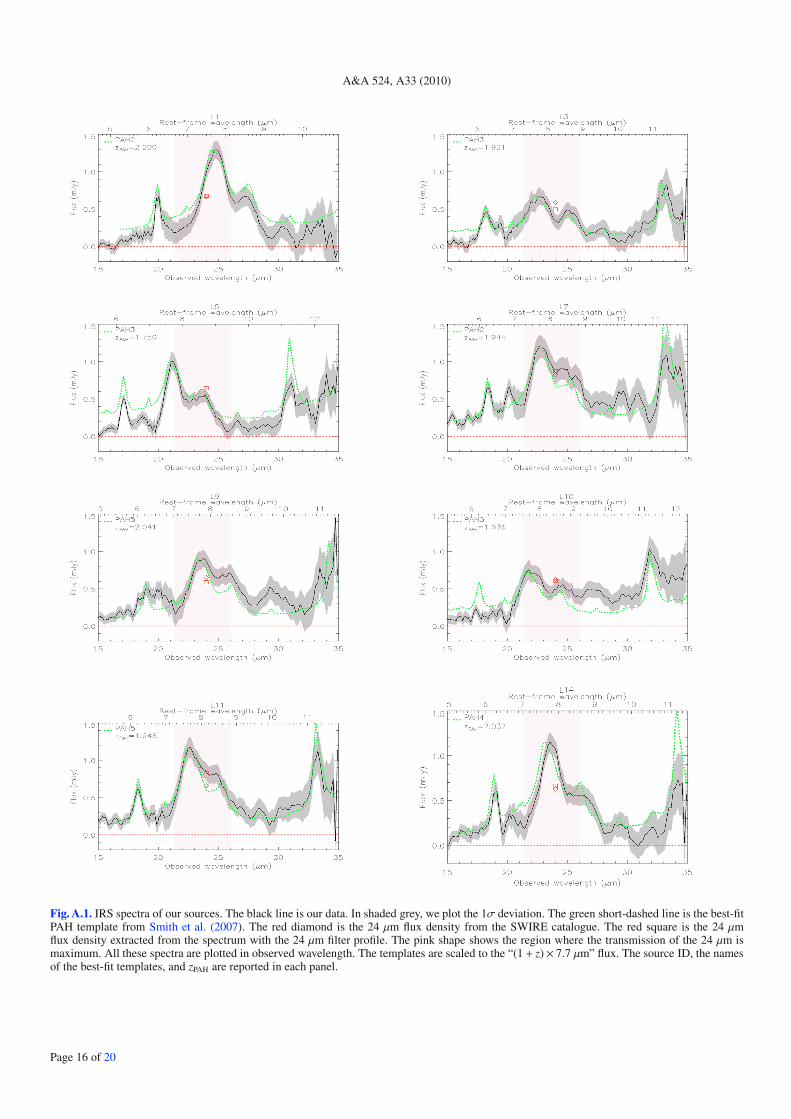
The spectra of our 16 sources are shown in Appendix A (see alsoFigs. 3 and B). These spectra show high-S/N (>5σ) detectionsof PAH features at 6.2, 7.7, 8.6, and (in many cases) 11.3 μm forz ∼ 2 (Table 4).
Considering the uncertainties of our data, all our sourceshave MIPS S 24 μm from the 2007 SWIRE internal catalogue thatare compatible with the 24 μm flux density (S 24 μm,spectra) that wehave directly measured from the spectra after convolution withthe MIPS 24 μm filter profile (Fig. A). For 8/16, the differenceis less than 10%. These flux densities are reported in Table 1. Asimilar result was obtained by Pope et al. (2008).
4.1. PAH redshifts
Applying the method described in Bertincourt et al. (2009),we have determined redshifts from PAH features (zPAH). Thismethod is based on the cross-correlation of 21 templates withour IRS spectra. These templates are spectra of different kindsof sources. Five templates are dominated by PAHs (Smith et al.2007). 13 are less PAH-dominated local ULIRGs from Armuset al. (2007), including among others Arp 220 and Mrk 231. Theremaining three are a radio galaxy, a quasar, and a Wolf-Rayetgalaxy. The best estimate of the redshift, zPAH, is the averageof redshifts found for all templates after rejection in cases ofvery high χ2 (χ2/S NR > 8) or too low S NR(< 1). These red-shifts are reported in Table 3. The estimated rms error of zPAHis on average 〈ΔzPAH〉 = 0.010 (median= 0.007; min= 0.004;max= 0.064). We also report in Table 3 the redshift, zbest, ofthe best-matching template. The small differences between zPAH
2 http://web.ipac.caltech.edu/staff/fadda/IrsLow
Fig. 1. Ratio of S 24 μm, spectra deduced from our spectra using the MIPS24 μm filter, to S 24 μm from the 2007 SWIRE internal catalogue, as afunction of S 24 μm. The black square is the mean for our full sample.The error bars correspond to 1σ.
Table 3. Redshifts.
ID zPAHa zbest
b mid-IR best matching templatefrom Smith et al. (2007)
L1 2.200 ± 0.005 2.196 pah2L3 1.921 ± 0.005 1.922 pah3L5 1.750 ± 0.007 1.756 pah3L7 1.944 ± 0.064 1.886 pah2L9 2.041 ± 0.007 2.046 pah5L10 1.836 ± 0.005 1.834 pah3L11 1.946 ± 0.010 1.946 pah5L14 2.032 ± 0.005 2.034 pah4L15 1.851 ± 0.010 1.844 pah4L17 1.959 ± 0.004 1.964 pah3L19 2.240 ± 0.012 2.222 pah2L20 2.072 ± 0.010 2.066 pah1L25 1.972 ± 0.005 1.974 pah3L27 2.022 ± 0.008 2.014 pah4L31 2.284 ± 0.009 2.272 pah2L33 2.206 ± 0.010 2.200 pah3
Notes. (a) Average PAH spectroscopic redshift; (b) redshift for best-matching template.
and the redshift for the best-matching template are very consis-tent with the estimated rms error 〈ΔzPAH〉. We use zPAH in thefollowing analysis because this determination is less biased bytemplate selection than the redshift from the best-matching tem-plate (〈zbest〉 = 2.011; median= 1.994; scatter= 0.023). We notethat zPAH and zbest are very similar for all of our sample, andthat our sources are best matched by a specific “PAH” templatefrom Smith et al. (2007). The average of zPAH is 2.017 ± 0.038
Page 4 of 20

N. Fiolet et al.: Mid-infrared spectroscopy of Spitzer-selected ultra-luminous starbursts at z ∼ 2
Table 4. Fluxes and equivalent widths for PAH features from PAHFIT (Smith et al. 2007).
ID F6.2 μm F7.7 μm F8.6 μm F11.3 μm EW6.2 μm EW7.7 μm EW8.6 μm EW11.3 μm τ9.7 S 10 μma
(10−22 W.cm−2) (μm) (mJy)
L1 4.93 ± 0.51 21.69 ± 1.80 5.48 ± 1.03 . . . 2.86 9.42 2.70 . . . 1.08 0.037L3 3.44 ± 0.51 8.28 ± 0.69 3.22 ± 1.30 2.94 ± 0.85 2.90 8.17 2.67 1.85 0.00 0.036L5 3.82 ± 0.51 12.41 ± 1.37 5.16 ± 1.07 2.48 ± 0.83 3.67 12.02 4.99 1.63 0.02 0.033L7 3.11 ± 0.56 12.44 ± 1.82 6.22 ± 2.24 2.13 ± 1.26 0.55 2.82 1.37 0.52 0.00 0.133L9 2.41 ± 0.38 8.68 ± 0.67 4.53 ± 0.61 1.28 ± 0.91 0.63 2.41 1.33 0.27 0.00 0.096L10 0.29 ± 0.50 7.99 ± 1.51 2.83 ± 1.33 2.10 ± 0.89 0.10 2.32 0.77 0.48 0.00 0.128L11 3.61 ± 0.48 12.99 ± 1.74 6.43 ± 1.70 3.06 ± 1.68 0.81 4.72 2.28 1.15 0.10 0.080L14 3.37 ± 0.57 13.17 ± 1.10 4.39 ± 1.30 2.50 ± 1.87 1.19 7.54 2.80 3.17 0.00 0.034L15 4.47 ± 0.33 14.48 ± 1.30 5.83 ± 0.52 4.25 ± 0.53 1.73 6.88 3.22 3.92 0.00 0.044L17 2.38 ± 0.51 14.10 ± 1.82 5.39 ± 0.75 3.16 ± 0.96 0.84 5.04 2.21 1.71 0.54 0.051L19 4.93 ± 0.35 15.67 ± 1.01 3.87 ± 0.48 . . . 1.71 7.52 2.30 . . . 0.00 0.035L20 3.85 ± 0.63 9.49 ± 1.49 3.11 ± 1.77 5.25 ± 2.46 1.31 4.40 1.30 2.83 0.18 0.066L25 5.39 ± 0.50 12.45 ± 1.00 5.98 ± 1.08 4.82 ± 1.51 1.72 2.86 1.57 1.43 1.32 0.067L27 3.77 ± 0.42 12.77 ± 1.54 3.40 ± 0.77 3.54 ± 1.18 1.81 3.43 1.12 1.01 1.09 0.069L31 4.07 ± 0.52 16.25 ± 1.37 4.82 ± 0.60 . . . 1.26 6.80 2.44 . . . 0.03 0.043L33 3.12 ± 0.41 10.57 ± 2.11 2.29 ± 0.86 . . . 0.93 3.93 1.01 . . . 0.10 0.054
Notes. (a) S 10 μm is the continuum flux density at 10 μm.
Fig. 2. PAH spectroscopic redshift zPAH as a function of photometricredshift from F09. The dashed lines correspond to Δ log (1+ z) = ±0.06or ± 15%.
(median= 1.997). The IRS redshifts of our sample span a nar-rower range, from 1.7 to 2.3, than the photometric redshiftsmaybe due to the strong S 24 μm. This result is compatible withthe fact that “5.8 μm-peakers” have a high probability of beingdominated by a strong starburst at z ∼ 2 because the stellar bumpat 1.6 μm rest-frame is redshifted to around 5.8 μm at redshift∼2 (see, e.g., Lonsdale et al. 2009). Compared to the photo-metric redshifts reported in F09 found using the Hyper-z code(Bolzonella et al. 2000), the difference is fairly significant (seeFig. 2). Nevertheless, except for four sources, the photometricredshifts differ from zPAH by less than 15%, the boundary forcatastrophic outliers defined by Rowan-Robinson et al. (2008).
4.2. Spectral decomposition
We perform spectral decompositions using the PAHFIT codedeveloped by Smith et al. (2007). PAHFIT adjusts some PAHfeatures and spectral lines as a function of rest wavelength(Fig. 3). The PAH features are represented by Drude profilesand the atomic and molecular spectral lines by Gaussians. Thedecomposition also tries to fit a stellar continuum component(T� = 5000 K) and dust components for different temperatures(35, 50, 135, 200, 400, 600, 800, 1000, and 1200 K) representedby modified blackbodies. Only the intermediate dust tempera-tures make significant contributions to the mid-IR continuum.The dust extinction, mostly due to silicate absorption, is alsotaken into account. In our decompositions, we have adopted ascreen geometry, corresponding to a uniform mask of dust ab-sorbing the emission, to model the silicate absorption (Smithet al. 2007). Figure 3 presents an example of the result of thespectral decomposition. The PAH complexes at 6.2, 7.7, 8.6, and11.3 μm are clearly visible. As proposed by Smith et al. (2007),the 7.7, 8.6, and 11.3 μm features are better fitted by combi-nations of several features at 7.42, 7.60, and 7.85 μm for the7.7 μm feature, at 8.33 and 8.61 μm for the 8.6 μm feature, andat 11.23 and 11.33 μm for the 11.3 μm feature. The results of ourdecompositions are somewhat uncertain, due to the difficulty ofestimating the silicate absorption. However, this absorption isknown to be weak to moderate in such starburst sources (e.g.Spoon et al. 2007; Farrah et al. 2008; Weedman & Houck 2008;Li & Draine 2001; Yan et al. 2005). Our targets appear to haveespecially weak absorption making them a good sample for an-alyzing with this decomposition approach. The spectral decom-positions for the entire sample are reported in Appendix B forindividual sources, and in Fig. 4 for the stacked spectrum of all16 sources (see also Fig. 12). It is seen from individual spec-tra and the stack that the level of the continuum between 5 and11 μm remains modest compared to the PAH features (except forL10, Sect. 6.1).
In the stacked spectrum (Fig. 4), a weak line is visible at∼9.7 μm and identified as the 0–0 S(3) pure rotational tran-sition of molecular hydrogen at 9.665 μm (J = 5−3) in thePAHFIT spectral decomposition. This line is also visible in thepartial stacks of Fig. 12 and may be present in the spectral
Page 5 of 20

A&A 524, A33 (2010)
Fig. 3. Spectral decomposition for source L17. The solid green line isthe fitted model. Blue lines above the continuum are PAH features;violet lines are spectral lines. Thin grey lines represent thermal dustcontinuum components. The thick red line shows the total continuum(stars+dust). The dotted black line shows the extinction (e−τλ , = 1 for noextinction). In this example, the top axis is labelled in observed wave-length. The redshift is zPAH = 1.959. Spectral decompositions for theother sources are presented in Appendix B.
Stack of all sources
6 8 10 12Wavelength (um)
-0.1
0.0
0.1
0.2
0.3
0.4
Flu
x/(1
+z)
(m
Jy)
0.0
0.2
0.4
0.6
0.8
1.0
Rel
ativ
e E
xtin
ctio
n
Fig. 4. Spectral decomposition for the stacked spectrum of all16 sources. The solid green line is the fitted model. The blue linesabove the continuum are the PAH features. The narrow violet lines arethe spectral lines. The grey lines represent the thermal dust continuumcomponents. The thick red line shows the total continuum (stars+dust).The dotted black line shows the extinction (e−τλ , = 1 if no extinction).
decompositions of 13/16 sources (Fig. B). The detection of thisline is confirmed by the detailed data analysis that we performin a separate paper (Fiolet et al. in prep.). The very large lu-minosity of this line, stronger than the CO luminosity, proba-bly implies very strong shocks to excite its upper level ∼2500 Kabove the ground state of H2, although H2 excitation could alsobe influenced by X-rays or UV from AGN. We also see hints ofother lines, although not at significant levels: the S(5) and S(4)transitions of molecular hydrogen at 6.86 μm and 8.08 μm, re-spectively, as well as the ionized species [Ar III] at 8.98 μm and[S IV] at 10.52 μm.
For each spectrum, we evaluate the continuum flux densityand luminosity density at 5.8 μm (ν Lν(5.8 μm)). These val-ues are reported in Table 5. There is only a small dispersion
of ν Lν(5.8 μm) for our sources (average= 1.87 × 10¹¹ L�, me-dian= 1.77×10¹¹ L�, min= 0.71×10¹¹ L�, max= 2.99×10¹¹ L�).In Fig. 5, we plot PAH luminosity at 7.7 μm (L7.7 μm) as a func-tion of ν Lν(5.8 μm). The PAH luminosity at 7.7 μm is calculatedas the integral of the total flux between 7.3 μm and 7.9 μm af-ter subtraction of the continuum contribution (see Eq. (1)). Wehave also plotted the sample of Sajina et al. (2007). To make atrue comparison, we have applied a similar reduction and spec-tral decomposition to the PAH-rich sources from Sajina et al.(2007). The values of ν Lν(5.8 μm) found in this case show nosignificant difference from the published continuum luminosi-ties. We see, in Fig. 5, that our sample shows somewhat weakerν Lν(5.8 μm) than the PAH-rich sample of Sajina et al. (2007) orthe AGN-dominated sample of Coppin et al. (2010), while thevalues of L7.7 μm stay in the same range. This is likely due to astronger AGN contribution in the sample of Sajina et al. (2007).Note also that the ratio L7.7 μm/ν Lν(5.8 μm) is very consistentwith that found for the local starbursts of Brandl et al. (2006).
4.3. PAH features
Thanks to the spectral decomposition, we have determined thefluxes (F) and equivalent widths (EW) for the PAH complexes at6.2, 7.7, 8.6, and 11.3 μm (Table 4). The flux is calculated by in-tegrating the spectra between 6.2 and 6.3 μm, 7.3 and 7.9 μm, 8.3and 8.7 μm, and 11.2 and 11.4 μm, respectively, after subtract-ing the continuum flux. We calculate the associated luminositiesL6.2 μm, L7.7 μm, L8.6 μm, and L11.3 μm, reported in Table 5, using:
Li = 4πD2LFi (1)
where DL is the luminosity distance and Fi =∫ λ2
λ1(S λ − S c)dλ
with S λ and S c the total and the continuum flux densities at theconsidered wavelengths.
The equivalent width is calculated following:
EW =∫ λ2
λ1
S λ − S c
S cdλ . (2)
All our sources show L7.7 μm >∼ 5×10¹⁰ L� and EW7.7 μm > 2 μm,i.e., well above the EW7.7 μm > 0.8 μm limit for “strong” PAHsources defined by Sajina et al. (2007). All our sources exceptL10 also show EW6.2 μm 0.2 μm and L6.2 μm 2 × 10¹⁰ L�.These values are usually used to separate starburst- from AGN-dominated sources (Armus et al. 2007).
Our sample has PAH luminosities on average comparable tothose of the PAH-rich sources of Sajina et al. (2007) and slightlylarger than those of the SMGs observed by Pope et al. (2008)and Menéndez-Delmestre et al. (2009), and of the “4.5 μm-peakers” of Farrah et al. (2008). Such a behavior might be nat-urally explained by stronger S 24 μm than SMG samples samplesand higher redshift than Farrah et al. (2008)’s sample. The S/Nof our average luminosities are higher than the other samples(Table 6). Indeed, the mean values of L6.2 μm, L7.7 μm, L8.6 μm,and L11.3 μm are 2.90 ± 0.31, 10.38 ± 1.09, 3.62 ± 0.27, and2.29 ± 0.26 × 10¹⁰ L�, respectively, for our sample. The stateduncertainties are the standard deviations of the means. These val-ues of luminosities are simple averages. The weighted averagesand the measurements from the stacked spectra of our sourcesgive luminosities consistent with the simple averages within theuncertainties. For example, the weighted average of L6.2 μm is(2.70 ± 0.09) × 1010 L�, and the value derived from the stackedspectrum is (2.81 ± 0.94) × 1010 L�.
Page 6 of 20

N. Fiolet et al.: Mid-infrared spectroscopy of Spitzer-selected ultra-luminous starbursts at z ∼ 2
Table 5. Luminosities for different wavelengths.
ID ν Lν(1.6 μm)a ν Lν(5.8 μm) L6.2 μm L7.7 μm L8.6 μm L11.3 μm ν Lν(1.4 GHz)a LIRb
(1011 L�) (1010 L�) (106 L�) (1012 L�)L1 2.09 1.55 4.83 ± 0.50 21.24 ± 1.76 5.36 ± 1.01 . . . 8.71 ± 1.00 11.00 ± 3.80L3 2.01 0.97 2.41 ± 0.35 7.80 ± 5.12 2.26 ± 0.91 2.07 ± 0.59 1.35 ± 0.43 . . .L5 1.80 0.71 2.12 ± 0.29 6.90 ± 0.76 2.87 ± 0.60 1.38 ± 0.46 5.75 ± 1.59 . . .L7 1.80 2.99 2.24 ± 0.40 9.73 ± 7.18 4.49 ± 1.62 1.54 ± 0.91 8.32 ± 1.15 . . .L9 2.00 2.27 1.96 ± 0.31 7.06 ± 0.55 3.68 ± 0.50 1.04 ± 0.74 7.94 ± 0.55 9.77 ± 3.37L10 1.85 1.06 0.18 ± 0.31 5.01 ± 0.95 1.77 ± 0.83 1.32 ± 0.56 3.16 ± 0.58 . . .L11 1.55 2.54 2.61 ± 0.34 10.77 ± 4.42 4.65 ± 1.23 2.22 ± 1.21 17.78 ± 0.41 8.13 ± 2.24L14 2.14 1.96 2.72 ± 0.46 11.63 ± 5.30 3.54 ± 1.05 2.02 ± 1.51 13.49 ± 0.62 8.51 ± 2.54L15 2.97 1.50 2.86 ± 0.21 9.25 ± 0.83 3.73 ± 0.34 2.72 ± 0.34 6.31 ± 0.29 6.31 ± 1.89L17 2.38 1.57 1.76 ± 0.38 10.37 ± 1.34 3.96 ± 0.55 2.33 ± 0.71 26.92 ± 2.48 9.12 ± 3.36L19 3.63 2.59 5.05 ± 0.35 16.04 ± 1.04 3.96 ± 0.49 . . . 7.59 ± 0.87 . . .L20 4.19 2.05 3.25 ± 0.53 9.82 ± 5.96 2.63 ± 1.50 4.43 ± 2.08 7.94 ± 0.73 12.30 ± 3.40L25 2.36 1.54 4.03 ± 0.37 9.30 ± 0.75 4.47 ± 0.81 3.60 ± 1.13 7.94 ± 1.10 7.76 ± 2.50L27 1.74 1.13 3.00 ± 0.34 10.16 ± 1.22 3.18 ± 0.61 2.82 ± 0.94 4.37 ± 0.80 6.92 ± 2.23L31 1.55 2.97 4.37 ± 0.56 17.44 ± 1.47 5.18 ± 0.64 . . . 7.94 ± 2.56 . . .L33 2.53 2.43 3.08 ± 0.40 10.42 ± 2.08 2.26 ± 0.85 . . . 3.39 ± 1.01 . . .
Notes. (a) From F09; (b) from Kovács et al. (2010).
Fig. 5. L7.7 μm as a function of the continuum luminosity ν Lν(5.8 μm).The red diamonds are the sources of our sample. The open (full) blacktriangle is the stack of our sources with EW7.7 μm > (<) 6μm. Thefull black circle is the composite spectrum of the SMG sample fromMenéndez-Delmestre et al. (2009). The black crosses are the PAH-richsources from Sajina et al. (2007). The black asterisks are the AGN-dominated sources from Coppin et al. (2010). The black line is the bestfit of all these samples. The dashed black line is the best fit to the localstarbursts from Brandl et al. (2006) (black squares).
As seen in Figs. 6–8, and in Table 7, our PAH luminosi-ties L6.2 μm, L7.7 μm, L8.6 μm, and L11.3 μm have ratios similar tothose of SMGs, as well as local starbursts and star-forminggalaxies at z ∼ 1. The AGN-dominated sample from Coppinet al. (2010) seems to have slightly different ratios, with a higherL7.7 μm/L8.6 μm.
The samples plotted in Figs. 6–8 follow the relations:
log (L7.7 μm) = (1.04 ± 0.03) log (L6.2 μm) + (0.10 ± 0.32) (3)
log (L7.7 μm) = (0.87 ± 0.04) log (L8.6 μm) + (1.91 ± 0.34) (4)
log (L7.7 μm) = (1.06 ± 0.03) log (L11.3 μm)−(0.03 ± 0.30). (5)
Note that these relations are just plain fits of the displayed sam-ples of Figs. 6–8. As these samples may be biased in variousways, and the properties of the galaxies may vary with redshift,one should not expect a strong statistical consistency for theserelations. The relations for L6.2 μm and L11.3 μm are consistentwith the relations found by Pope et al. (2008) for local starburstsand SMGs.
These relations show that both L7.7 μm/L6.2 μm andL7.7 μm/L11.3 μm are ∼4 for our sources at z ∼ 2 (see alsoFigs. 13 and 14 and Table 7), i.e., about twice as large as forthe local starbursts of Brandl et al. (2006) and the sourcesof Farrah et al. (2008) at z ∼ 1.7. On the other hand, theratio L7.7 μm/L8.6 μm is about twice as small in these luminousgalaxies at z ∼ 2 as in fainter local starbursts (Table 7). Thisbehavior is similar to that of SMGs (Table 7 and Sect. 6.2). Thedifference with respect to local starbursts could be explained bya difference in the size or ionization of PAH grains (Sects. 6.1,6.2 and Fig. 14), or by a different extinction due to silicatesaround 10 μm (affecting the 8.6 and 11.3 μm bands) or ice at∼6 μm (absorbing the 6.2 μm band) (Menéndez-Delmestre et al.2009; Spoon et al. 2002). However, the effects of extinctionseem somewhat contradictory for the different band ratios.The finding of a lower 7.7/8.6 ratio compared to normal, localstarbursts, is consistent with a low silicate extinction in oursample, as does the generally low level of extinction in thespectral fits. However, the “larger” 7.7/11.3 ratio that we reportis going in the other direction; similarly, our “larger” 7.7/6.2ratio would imply a larger ice absorption than in local starbursts.
L10 is the only source that seems not to follow the rela-tion between L7.7 μm and L6.2 μm, showing too weak a feature at6.2 μm. However, Table 5 and Fig. 6 show that the deviation ofL10 from the correlation remains within the statistical errors ofthis noisy spectrum. The offset is probably due to higher extinc-tion or a more energetically important AGN (Rigopoulou et al.1999); see also Sect. 6.1.
Page 7 of 20

A&A 524, A33 (2010)
Table 6. Average luminosities for different samples.
Sample 〈z〉 〈S 24 μm〉 L6.2 μm L7.7 μm L8.6 μm L11.3 μm ν Lν(1.4 GHz) LIR
(mJy) (1010 L�) (106 L�) (1012 L�)This work 2.017 0.63 2.90 ± 0.31 10.38 ± 1.09 3.62 ± 0.27 2.29 ± 0.26 8.68 ± 1.56 8.87 ± 0.64This work, EW7.7μm>6 μma 2.040 0.60 3.07 ± 0.13 11.30 ± 0.35 3.42 ± 0.15 2.51 ± 0.29 7.31 ± 1.38 8.61 ± 1.35This work, EW7.7μm<6 μma 2.000 0.65 1.94 ± 0.14 7.96 ± 0.72 2.86 ± 0.21 2.12 ± 0.29 9.75 ± 2.59 9.00 ± 0.78Sajina et al. (2007)b 1.524 1.19 2.66 ± 0.46 13.17 ± 3.28 2.87 ± 0.67 1.71 ± 0.37 18.33 ± 6.50 6.32 ± 1.36Menéndez-Delmestre (2009) 2.000 0.33 1.09 ± 0.22 4.10 ± 0.93 1.63 ± 0.17 1.39 ± 0.10 4.63 ± 0.79 7.37 ± 2.45Pope et al. (2008) 1.910 0.45 1.34 ± 0.22 6.46 ± 1.30 2.13 ± 0.38 1.19 ± 0.32 14.32 ± 5.96 5.90 ± 1.00Coppin et al. (2010) 2.730 0.51 3.04 ± 0.71 16.28 ± 3.52 2.55 ± 0.72 . . . . . . 10.98 ± 1.88Farrah et al. (2008) 1.690 0.73 2.37 ± 0.18 3.56 ± 0.24 . . . 1.50 ± 0.10 . . . . . .
(mJy) (108 L�) (105 L�) (1011 L�)
Brandl et al. (2006) 0.008 8.52 × 10³ 2.10 ± 0.85 4.26 ± 1.61 0.83 ± 0.34 1.85 ± 0.65 1.23 ± 0.64 1.18 ± 0.31O’Dowd et al. (2009) 0.092 6.08 4.24 ± 0.49 17.72 ± 1.72 3.82 ± 0.36 5.16 ± 0.43 . . . . . .
Notes. (a) The values are computed from the stacked spectra; (b) the sample of Sajina et al. (2007) is limited to PAH-rich sources with EW7.7μm >0.8 μm.
Fig. 6. L7.7 μm as a function of L6.2 μm. The red diamonds are the sourcesof our sample. The open (full) black triangle is the stack of our subsam-ple with EW7.7 μm > (<) 6 μm. The full black circle is the stacked spec-trum of the SMG sample from Menéndez-Delmestre et al. (2009). Theblack circles are the intermediate-redshift star-forming galaxies fromShi et al. (2009). The black stars are the sample of SMGs from Popeet al. (2008). The black crosses are the PAH-rich sources from Sajinaet al. (2007). The black asterisks are the AGN-dominated sources fromCoppin et al. (2010). The full black squares are the sources from Farrahet al. (2008). The open black squares are the local star-forming galaxiesfrom Brandl et al. (2006). The solid line is our best fit to all these sam-ples. The dashed line is the best fit found by Pope et al. (2008) for theirSMGs and the local starbursts.
4.4. Silicate absorption
The determination of the optical depth of the silicate absorptionat 9.7 μm (τ9.7), reported in Table 4, is a product of the general fitof the spectra with PAHFIT. It is based on interstellar extinctionsimilar to that of the Milky Way (Smith et al. 2007). We note thatthe silicate absorption is weak on average, 〈τ9.7〉 = 0.28 (0.50if we consider only the sources with τ9.7 � 0) vs. 1.09 for the
Fig. 7. L7.7 μm as a function of L8.6 μm. The symbols and the line are thesame as in Fig. 6.
PAH-rich sample of Sajina et al. (2007). Indeed, for 44% (7/16)of our sources, PAHFIT provides τ9.7 = 0. It is clear that all val-ues of extinction (τ9.7) are very uncertain because of the weak-ness of the continuum and its uncertainty, and because of thelack of measurements at long wavelengths. We thus state onlythe qualitative conclusion that the average extinction is likelyweak in most of our sources. Considering the values of EW6.2and τ9.7, most of our sources belong to class 1C of the diagramof Spoon et al. (2007, their Figs. 1 and 3). This class is definedby spectra dominated by PAH emission with weak silicate ab-sorption.
5. PAH emission and star formation
As noted above, it is well known that infrared PAH emission isstrongly correlated with star formation through excitation andIR fluorescence of PAHs induced by the UV radiation of youngstars. The exceptional quality of our PAH spectra at z ∼ 2 allowsus to further assess the correlation between PAH luminosity andtotal IR luminosity, and to compare with other starburst samples
Page 8 of 20

N. Fiolet et al.: Mid-infrared spectroscopy of Spitzer-selected ultra-luminous starbursts at z ∼ 2
Fig. 8. L7.7 μm as a function of L11.3 μm. The symbols and the lines arethe same as in Fig. 6.
at z ∼ 2 and at lower redshift. The deep radio data allow a precisecomparison with the radio luminosity which is also known totrace the starburst IR luminosity well.
5.1. The correlation between IR and PAH luminosities
The correlation between the strength of the PAH emission andthe far-IR luminosity in starbursts is well established althoughnot understood in detail. Remarkably, it has been verified amonglocal starburst galaxies over two orders of magnitude in LIR,from 1010 to 1012 L�, by Brandl et al. (2006). The approxi-mate proportionality between L7.7 μm and LIR has been extendedthrough the ULIRG range up to 1013 L� and z ≥ 2 by severalstudies (Shi et al. 2009; Pope et al. 2008; Menéndez-Delmestreet al. 2009). Our sample gives us an opportunity to check howtight the relation is among the strongest starbursts at z ∼ 2.
For the nine sources of our sample observed at 350 μm byKovács et al. (2010) – all SMGs (F09) – we have an accurateestimate of the infrared luminosity LIR computed by Kovácset al. (2010), who fit a distribution of grey-body models withdifferent dust temperatures (multi-temperature model). All thesesources are powerful ULIRGs with LIR close to 1013 L� (aver-age= 8.87× 10¹² L�, 〈ΔLIR〉 = 2.81× 10¹² L�; see Table 5). Theaverage value of the ratio of IR and PAH luminosities is
〈L7.7 μm/LIR〉 = 11.7 × 10⁻³ (6)
It is seen in Table 7 and Fig. 9 that the L7.7 μm/LIR ratio is withina factor ∼2 of those for the other high-z samples. However,it is a factor ∼3.5 larger than for less luminous local star-bursts as yielded by Eq. (6). Schweitzer et al. (2006) havealso demonstrated the existence of a correlation between thestrength of the PAH emission and the far-IR luminosity for localstarburst-dominated ULIRGs and QSO hosts. Nevertheless, the〈L7.7 μm/LIR〉 ratio that they found is probably lower because ofthe more compact nature of those objects.
In Fig. 9, we plot L7.7 μm as a function of LIR for differentsamples. We can see that our sample has LIR comparable tothose of the other SMG samples (Pope et al. 2008; Menéndez-Delmestre et al. 2009), and the PAH-rich sources from Sajinaet al. (2007). The star-forming galaxies of Shi et al. (2009) have
LIR values slightly lower than our sample. We also note that thebest fit of all these samples is consistent with the relations foundby Pope et al. (2008) and Menéndez-Delmestre et al. (2009)for SMGs and local starbursts (Brandl et al. 2006). The AGN-dominated sample of Coppin et al. (2010) shows LIR and L7.7 μmgreater than our sources, but their ratio is not very different fromour sample. The sources of Shi et al. (2009) seem to follow aslightly different relation but with the same slope as the fit foundby Menéndez-Delmestre et al. (2009). The best fit of all thesesamples, from local starbursts to SMGs, is
log (L7.7 μm) = (1.06 ± 0.04) log (LIR) − (2.57 ± 0.52) (7)
This relation is consistent with L7.7 μm being a good tracer ofhigh-z starbursts: a strong L7.7 μm should be the sign of a highSFR. If we use our relation between L7.7 μm and LIR and assumethe relation from Kennicutt (1998) between SFR and LIR basedon a 0.1–100 M� Salpeter-like IMF, we obtain the following re-lation
log (SFR) = 0.94 log (L7.7 μm) − 7.27 (8)
where SFR is in units of M� yr−1.This relation is slightly different from that found by
Menéndez-Delmestre et al. (2009). The latter is based on theluminosity at 7.7 μm calculated from the total flux between7.1 μm and 8.3 μm after continuum substraction, instead of be-tween 7.3 μm and 7.9 μm as in our case. However, the valuesof L7.7 μm computed with the two definitions are very compa-rable. Applying Eq. (8), we find on average 〈SFR〉 = 1260 ±470 M� yr−1. This value is consistent with the average SFR of1060 M� yr−1 computed from the radio luminosity in F09, andclose to the median SFR of ∼1200 M� yr−1 found for SMGs byMenéndez-Delmestre et al. (2009).
5.2. The correlation between 1.4 GHz and PAH luminosities
The correlation between radio luminosity (L1.4 GHz) and far-infrared luminosity in star-forming regions and in local star-bursts is well known (e.g., Helou et al. 1985; Condon 1992;Crawford et al. 1996; Sanders & Mirabel 1996). This correla-tion has been confirmed at z ∼ 2 by Chapman et al. (2005) (seealso F09; Condon 1992; Smail et al. 2002; Yun & Carilli 2002;Ivison et al. 2002; Kovács et al. 2006; Sajina et al. 2008; Youngeret al. 2009; Ivison et al. 2010; Magnelli et al. 2010).
From the correlation between LIR and L7.7 μm (Fig. 9,Eq. (7)), we might expect a very good correlation between PAHand radio luminosities, as previously observed by Pope et al.(2008). Since our sources benefit from exceptionally good ra-dio data at 20 cm, 50 cm, and 90 cm (Sect. 2.1), it is worthwhileto directly check the tightness of this relation.
It is straightforward to compute the rest-frame luminosity at1.4 GHz (L1.4 GHz = ν Lν(1.4 GHz)) using, e.g., the formula givenby Kovács et al. (2006):
ν Lν(1.4 GHz) = 4πD2L S 20 cm (1.4 × 10⁹) (1 + z)(−α−1) (9)
where DL is the luminosity distance and α is the radio spec-tral index defined by the best power law fit, S ν ∝ να, betweenS 20 cm, S 50 cm, and S 90 cm. We have computed ν Lν(1.4 GHz) forour sample and those of Sajina et al. (2007), Pope et al. (2008),Shi et al. (2009), and Brandl et al. (2006). For our sample, wehave used α as computed in F09 and reported in Table 1. For thePAH-rich sample of Sajina et al. (2007), we have used the val-ues published in Sajina et al. (2008). For the other samples, weuse the average value of α, 〈α〉 = −0.64 found in F09, which is
Page 9 of 20

A&A 524, A33 (2010)
Table 7. Average luminosities ratios for different samples.
SampleL6.2 μm
L7.7 μm
L6.2 μm
L11.3 μm
L7.7 μm
L8.6 μm
L7.7 μm
L11.3 μm
L8.6 μm
L11.3 μm
L6.2 μm
LIR
L7.7 μm
LIR
L7.7 μm
νLν(1.4 GHz)
(10−3) (103)This work 0.28 1.27 2.87 4.53 1.58 3.27 11.70 11.96This work, EW7.7 μm > 6 μma 0.27 1.22 3.30 4.50 1.36 3.57 13.12 15.46This work, EW7.7 μm < 6 μma 0.24 0.92 2.78 3.75 1.35 2.16 8.84 8.16Sajina et al. (2007)b 0.20 1.56 4.59 7.70 1.68 4.21 20.84 7.18Menéndez-Delmestre et al. (2009) 0.27 0.78 2.52 2.95 1.17 1.48 5.56 8.86Pope et al. (2008) 0.21 1.13 3.03 5.43 1.79 2.27 10.95 4.51Coppin et al. (2010) 0.19 . . . 6.38 . . . . . . 2.77 14.83 . . .Farrah et al. (2008) 0.66 1.58 . . . 2.37 . . . . . . . . . . . .Brandl et al. (2006) 0.49 1.14 5.13 2.30 0.45 1.77 3.61 3.46O’Dowd et al. (2009) 0.24 0.83 4.63 3.44 0.74 . . . . . . . . .
Notes. (a) The values are computed from the stacked spectra. (b) The sample of Sajina et al. (2007) is limited to PAH-rich sources with EW7.7 μm >0.8 μm.
Fig. 9. L7.7 μm as a function of LIR. The symbols are the same as in Fig. 6.The solid line is our best fit to all samples. The dashed line is the bestfit found by Pope et al. (2008) from fitting both their SMGs and thelocal starbursts. The dotted line is the best fit found by Shi et al. (2009).The dot-dashed line is the best fit found by Menéndez-Delmestre et al.(2009).
consistent with the typical radio spectral index for star-forminggalaxies (e.g., Condon 1992). The values of ν Lν(1.4 GHz) arereported in Table 5.
As expected, we observe a correlation between L1.4 GHz andL7.7 μm. Considering our sample, but also the local star-forminggalaxy sample (Brandl et al. 2006), the sample of SMGs (Popeet al. 2008), the PAH-rich sources from Sajina et al. (2007), andthe intermediate-redshift starbursts (Shi et al. 2009), we obtainthe following relation (Fig. 10):
log (L7.7μm) = (0.91±0.06) log(νLν(1.4 GHz))+(4.60±0.36)(10)
The effect of the positive k-correction and the value of α are par-ticularly important for the determination of L1.4 GHz and may sig-nificantly affect the reliability of the relation stated in Eq. (10).The correlation between L1.4 GHz and L7.7 μm seems to be more
Fig. 10. L7.7 μm as a function of rest-frame ν Lν(1.4 GHz). The symbolsare the same as in Fig. 6. The black line is our best fit to all these sam-ples.
scattered than the correlation between LIR and L7.7 μm. It is notsurprising considering the uncertainties on L1.4 GHz and the scat-ter of the correlation between LIR and L1.4 GHz as shown bye.g. Kovács et al. (2010).
5.3. PAH emission and stellar mass
The stellar bump luminosity at 1.6 μm (ν Lν(1.6 μm), reportedin Table 5, gives an estimate of the stellar mass (M�) ofour sources (see, e.g., F09; Seymour et al. 2007; Lonsdaleet al. 2009). Applying the same mass-to-light ratio as F09(M�/ν Lν(1.6 μm) = 0.7 M�/L�), M� derived from ν Lν(1.6 μm)ranges from 1.1 to 3.0 × 10¹¹ M� (average= 1.6 × 10¹¹ M�, me-dian= 1.4 × 10¹¹ M�).
In Fig. 11, we plot L7.7 μm as a function of ν Lν(1.6 μm) forour sources and the PAH-rich sample from Sajina et al. (2007).Our sample shows no clear difference from the sources of
Page 10 of 20

N. Fiolet et al.: Mid-infrared spectroscopy of Spitzer-selected ultra-luminous starbursts at z ∼ 2
Fig. 11. L7.7 μm as a function of the stellar bump luminosity L1.6 μm. Thesymbols are the same as in Fig. 6. Only the samples at z ∼ 2 are plotted.The line is the best fit found for the “normal” star-forming galaxies ofLu et al. (2003).
Sajina et al. (2007) in terms of ν Lν(1.6 μm). Both samples fol-low the relation found for “normal” star-forming galaxies (Sajinaet al. 2007; Lu et al. 2003). This result implies that L7.7 μm andν Lν(1.6 μm) do not trace AGN (Sajina et al. 2007). Since thePAH luminosity is tightly correlated with the star formation rate,the relation between ν Lν(1.6 μm) and L7.7 μm seems to confirmthe existence of a correlation between star formation rate andstellar mass at z ∼ 2 as previously observed by Pannella et al.(2009) and Mobasher et al. (2009). However, note that the mass-to-light ratio remains uncertain because of uncertainty in the ageof the dominant stellar population.
6. Discussion
6.1. Distinction between starburst and AGN
As previously discussed, the relative strength of the PAH fea-tures and the mid-IR continuum is a very efficient criterion fordistinguishing starburst- from AGN-dominated ULIRGs (e.g.,Yan et al. 2007; Sajina et al. 2007; Weedman et al. 2006; Houcket al. 2005). Genzel et al. (1998) and Rigopoulou et al. (1999)use the parameter 7.7 μm-(L/C), defined as the ratio between thepeak flux density at 7.7 μm and the continuum flux density atthe same wavelength, to distinguish between AGN and starburst.AGN-dominated composite sources show values of 7.7 μm-(L/C) weaker than starburst-dominated systems. An equivalentstraightforward indicator is the equivalent width of the PAH fea-tures, especially EW7.7 μm, since it is proportional to the ratio ofL7.7 μm to the 7.7 μm continuum. The equivalent widths of oursources span a broad range, more than a factor of 5. Despitethe large uncertainty in the continuum, e.g., as estimated byPAHFIT, it is clear that EW7.7 μm should be a relevant param-eter for discussion of AGN contributions. For our entire sample,we find 〈EW7.7 μm〉 = 5.64 μm (median= 4.88) vs. 3.04 μm forthe stacked spectrum of Menéndez-Delmestre et al. (2009).
Stack of sources with EW>6um
6 8 10 12Wavelength (um)
-0.1
0.0
0.1
0.2
0.3
0.4
Flu
x/(1
+z)
(m
Jy)
0.0
0.2
0.4
0.6
0.8
1.0
Rel
ativ
e E
xtin
ctio
n
Stack of sources with EW<6um
6 8 10 12Wavelength (um)
-0.1
0.0
0.1
0.2
0.3
0.4
Flu
x/(1
+z)
(m
Jy)
0.0
0.2
0.4
0.6
0.8
1.0
Rel
ativ
e E
xtin
ctio
n
Fig. 12. PAHFIT spectral decomposition of stacked spectra. Upperpanel: 7 sources with EW7.7 μm > 6 μm. Lower panel: 9 sources withEW7.7 μm < 6 μm. The solid green line is the fitted model. The blue linesabove the continuum are the PAH features. The narrow violet lines arethe spectral lines. The grey lines represent the thermal dust continuumcomponents. The thick red line shows the total continuum (stars+dust).The dotted black line shows the extinction (e−τλ = 1 if no extinction).
Based on the values of EW7.7 μm (see Table 4), we haveconstructed two subsamples: the first has EW7.7 μm > 6 μm(7 sources, 〈EW7.7 μm〉 = 8.33 μm) and the second hasEW7.7 μm < 6 μm (9 sources, 〈EW7.7 μm〉 = 3.55 μm). We haveproduced stacked spectra of these two subsamples, built fromthe weighted means of the individual spectra scaled to 〈F7.7 μm〉.They are plotted in Fig. 12. It is obvious, as expected, that thesecond subsample has a significantly stronger continuum.
Applying the same method as Menéndez-Delmestre et al.(2009), we estimate an X-ray luminosity (LX) from the 10 μmcontinuum flux (Table 4) via the Krabbe et al. (2001) relation.Then assuming the LX/LIR found for AGN by Alexander et al.(2005), we estimate the contribution of AGN to LIR. We findthat the AGN contribution is ∼20% for our whole sample and∼10% and ∼25% for the subsamples with EW7.7 μm > 6 μm andwith EW7.7 μm < 6 μm, respectively. Menéndez-Delmestre et al.(2009) have found ∼32% to be the AGN contribution in SMGs.The difference can be interpreted as a difference in the contin-uum flux density, with continuum larger by a factor ∼2 for thesample of Menéndez-Delmestre et al. (2009).
In Fig. 9 (see also Table 6), it is seen that the two subsam-ples are not different in term of LIR and follow the correlationbetween L7.7 μm and LIR found in Sect. 5.1. This result tends toargue that the majority of the IR luminosity is associated with thestarburst and not with the AGN. This is not the case in the sample
Page 11 of 20
A&A 524, A33 (2010)
of Menéndez-Delmestre et al. (2009), which shows a smallerL7.7 μm/LIR ratio, implying that the AGN contributes more to LIR(Table 7).
Another possible sign of a strong AGN contribution is alarge L7.7 μm/L6.2 μm ratio, as discussed by, e.g., Rigopoulou et al.(1999) and Pope et al. (2008). They have observed such a rise inL7.7 μm versus L6.2 μm for some SMGs, which they attribute togreater silicate absorption in the presence of a more luminousAGN than is seen in most SMGs or starburst galaxies. Strongersilicate absorption significantly affects L8.6 μm and L11.3 μm, whileit may lead to an overestimate of L7.7 μm. However, as seen inFigs. 6 and 8, there is no significant difference in the value ofL7.7 μm/L6.2 μm between sources with large and small EWs, per-haps because the silicate absorption is small.
We see in Fig. 10 and Table 6 that sources with EW7.7 μm <6 μm seem to have an average value of ν Lν(1.4 GHz) somewhatgreater than that of sources with EW7.7 μm > 6 μm. Radio ex-cess could be a good indication of AGN strength (Seymour et al.2008; Archibald et al. 2001; Reuland et al. 2004). However, wenote that practically all of this difference is due to two sources inthe small-EW subsample, L11 and L17, which are close to theradio loudness limit at z ∼ 2 as defined by Jiang et al. (2007) andSajina et al. (2008): ν Lν(1.4 GHz) = 3.66×10⁷ L�. They are thusgood candidates for having significant AGN emission. Applyingthe same method as previously to determinate the AGN contri-bution, we find 26% and 19% for L11 and L17, respectively.
To summarize: although small, it seems that the AGN con-tribution is slightly greater in the sources with EW7.7 μm < 6 μmthan the systems with EW7.7 μm > 6 μm. Nevertheless, allthese sources show strong PAH emission and individually fol-low more or less the relations found for local starbursts (Brandlet al. 2006). They are probably all starburst-dominated or AGN-starburst composite sources, with at most a weak AGN contribu-tion to the mid-infrared.
Our sample is particularly homogeneous in term of PAHluminosity (see Table 5). Only one source, L10, is different.Indeed, this source shows a spectrum slightly different from theothers. Its continuum is stronger and has a larger slope (Fig. B).Moreover, L10 deviates from the correlation between L6.2 μmand L7.7 μm with a low L6.2 μm. L10 also presents the weakestEW6.2 μm, EW7.7 μm, and EW8.6 μm of our sample, with valuesof 0.10, 2.32, and 0.77 μm, respectively. Such a difference canbe explained by a larger AGN contribution to the mid-infraredemission, and also by a low signal-to-noise ratio (see Fig. A).Nevertheless, the fact that L10 follows the other correlations –especially the correlation between ν Lν(1.4 GHz) and L7.7 μm –seems to prove that this source is starburst-dominated. The samekind of source was observed by Pope et al. (2008).
6.2. Comparison with other studies
The present work is based on a complete sample of 16 sourcesselected to be starburst “5.8 μm-peakers” that are bright at24 μm, with S 24 μm > 0.50 mJy. The average flux density ofour sample is 〈S 24 μm〉 = 0.63 mJy. This is a brighter sampleof SMGs compared to that of Pope et al. (2008) (〈S 24 μm〉 =0.45 mJy) or Menéndez-Delmestre et al. (2009) (〈S 24 μm〉 =0.33 mJy). On the other hand, the PAH-rich sample of Sajinaet al. (2007) is biased toward the brightest 24 μm sources, with amean 〈S 24 μm〉 = 1.19 mJy. Our sample is also brighter than theULIRGs at z ∼ 2 of Fadda et al. (2010) (〈S 24 μm〉 = 0.27 mJy).All these samples have an average redshift z ∼ 2, but oursspans a narrower redshift range than the others. Indeed, oursample has zPAH between 1.75 and 2.28, while the samples of
Pope et al. (2008) and Menéndez-Delmestre et al. (2009), theULIRGs from Fadda et al. (2010) and the PAH-rich sample ofSajina et al. (2007) span z = 0.93 − 2.55, 0.69–3.62, 1.62–2.44,and 0.82–2.47, respectively.
The differences between PAH luminosities for all the sam-ples are small, but our PAH luminosities show an higher S/Nthan the other high-redshift samples (Table 6). Our sample hasPAH luminosities in all bands quite comparable to those ofSajina et al. (2007) and about twice as large as those of Popeet al. (2008) and Menéndez-Delmestre et al. (2009).
As regards the PAH-band luminosity ratios, we see in Table 7that our sample is not very different in term of ratios from theother SMG samples (Pope et al. 2008; Menéndez-Delmestreet al. 2009; Sajina et al. 2007). Nevertheless, Menéndez-Delmestre et al. (2009) find lower ratios for L6.2 μm/LIR andL7.7 μm/LIR. This is probably due to a greater AGN contributionto LIR (Sect. 6.1).
Our sample also shows a higher L7.7 μm/LIR ratio than thelower-redshift sample of Brandl et al. (2006). This differencecould be explained by a more extended PAH distribution in oursources. Indeed, if the PAH distribution is extended, a largerfraction of PAH can survive in strong UV radiation field fromAGN or young stars. Then L7.7 μm/LIR becomes higher than incompact PAH distributions where PAH are easier destroyed byUV radiation field (e.g., Huang et al. 2009).
In Fig. 13, we plot the different PAH ratios of these samplesfollowing O’Dowd et al. (2009). We find that our sample andthe other SMG samples show L7.7 μm/L11.3 μm vs. L6.2 μm/L11.3 μmratios consistent with the sample of O’Dowd et al. (2009). Thesample of Brandl et al. (2006) falls in the border of the dispersionfor the PAH ratios of Galactic HII regions, dwarf spirals, andstarburst galaxies found by Galliano et al. (2008). The plot ofL7.7 μm/L11.3 μm vs. L8.6 μm/L11.3 μm shows that all these sampleshave ratios different from those of O’Dowd et al. (2009) becauseof stronger emission at 8.6 μm. Our sample does not follow therelation found by Galliano et al. (2008).
A likely explanation of these differences in PAH ratios ismodification of the size or ionization of PAH grains. Figure 14,adapted from O’Dowd et al. (2009), seems to prove that our sam-ple has PAH grains with sizes comparable to those in the othersamples of SMGs, but with a slightly lower fraction of ionizedgrains than the samples of Pope et al. (2008) and (especially)Sajina et al. (2007). Brandl et al. (2006) find smaller and moreneutral grains in local starbursts than our sample. The differ-ence could arise due to the strongest ionizing UV radiation fromyoung stars in the most powerful starbursts but less ionising thanin the sample of Pope et al. (2008) and Menéndez-Delmestreet al. (2009) probably because of lower AGN contamination.
7. Summary and conclusions
In this paper, we have presented the results of Spitzer/IRS ob-servations of a complete sample of 16 sources selected to be24 μm-bright and “5.8 μm-peakers.” The spectra obtained showvery strong PAH features at 6.2, 7.7, 8.6, and 11.3 μm, alongwith a weak continuum. Thanks to these exceptionally strongfeatures, we have estimated accurate PAH redshifts that span therange z = 1.75−2.28. Our average PAH redshift is 〈zPAH〉 = 2.02,and the average error of the individual zPAH is 〈ΔzPAH〉 = 0.010(median= 0.007; min= 0.004; max= 0.064). The stacked spec-trum of our 16 sources displays evidence for the pure rotational0–0 S(3) molecular hydrogen line at λ = 9.67 μm, which is con-firmed and analyzed in a separate paper.
Page 12 of 20

N. Fiolet et al.: Mid-infrared spectroscopy of Spitzer-selected ultra-luminous starbursts at z ∼ 2
Fig. 13. Upper panel: L7.7 μm/L11.3 μm as a function of L6.2 μm/L11.3 μm.Lower panel: L7.7 μm/L11.3 μm as a function of L8.6 μm/L11.3 μm. In bothpanels, the red diamonds are the sources in our sample. The small blackcircles are the sample of O’Dowd et al. (2009). The open (full) blacktriangle is the stack of our sources with EW7.7 μm > (<) 6 μm. Theblack cross shows the average for the PAH-rich sources from Sajinaet al. (2007). The black star shows the average for the sample of SMGsfrom Pope et al. (2008). The open black square shows the average forthe local star-forming galaxies from Brandl et al. (2006). The full blacksquare is the average for the sample of “4.5 μm-peakers” from Farrahet al. (2008). The large black circle is based on the composite spectrumof the SMG sample from Menéndez-Delmestre et al. (2009). The blackline and the dotted lines are the best linear regression and the 1σ dis-persion found by Galliano et al. (2008) for Galactic HII regions, dwarfspirals, and starburst galaxies.
Thanks to the very good quality of our IRS spectra, we havecalculated PAH luminosities L6.2 μm, L7.7 μm, L8.6 μm, and L11.3 μm
Fig. 14. Adapted from O’Dowd et al. (2009): L11.3 μm/L7.7 μm as a func-tion of L6.2 μm/L7.7 μm. The symbols are the same as in Fig. 13. The blacklines represent the expected ratios for fully neutral or fully ionized PAHmolecules of a given number of carbon atoms from the models of Draine& Li (2001).
to have average values 2.90±0.31, 10.38±1.09, 3.62±0.27, and2.29 ± 0.26 × 10¹⁰ L�, respectively. These luminosities have aS/N higher than the other SMGs samples. We have studied thecorrelation between L7.7 μm and the other PAH luminosities. Allour sources, except perhaps L10, follow a correlation similar tothat found for local starbursts, and they are not very differentfrom other samples of SMGs at z ∼ 2. We have also confirmedthe very good correlation, previously observed, between L7.7 μmand LIR at high redshift, and we have verified its extension to theradio luminosity ν Lν(1.4 GHz). It also extends more loosely tostellar mass through ν Lν(1.6 μm).
All these relations, the luminosity ratios, and the equiva-lent widths allow us to estimate the AGN contribution to themid-IR luminosity. We conclude that our sources are starburst-dominated and that the AGN contribution is ∼20%. This sampleis the most pure selection of massive starbursts at z ∼ 2 com-pared to the other z ∼ 2 Spitzer-selected samples. The knownfact that the equivalent width of PAH features is a good discrim-inant between starburst-dominated and AGN-dominated sourcesis reinforced by the study of two subsamples of sources withEW7.7 μm > 6 μm and EW7.7 μm < 6 μm. The subsample withEW7.7 μm < 6 μm shows a larger AGN contribution (∼25%) thanthe EW7.7 μm > 6 μm subsample (∼10%), although the AGNcontribution is small in both subsamples.
Acknowledgements. We thank Karin Menéndez-Delmestre and Hélène Rousselfor their helpful contributions. This work is based primarily on IRS observa-tions and observations made within the context of the SWIRE survey with theSpitzer Space Telescope, which is operated by the Jet Propulsion Laboratory,California Institute of Technology under NASA contract. This work includesobservations made with IRAM, which is supported by INSU/CNRS (France),MPG (Germany) and IGN (Spain). The VLA is operated by NRAO, the NationalRadio Astronomy Observatory, a facility of the National Science Foundation op-erated under cooperative agreement by Associated Universities, Inc. The CSO isfunded by NSF Cooperative Agreement AST-083826. G.L., B.B., A.B. and F.B.had support for this work provided by ANR “D-SIGALE” ANR-06– BLAN-0170 grant.
Page 13 of 20

A&A 524, A33 (2010)
ReferencesAlexander, D. M., Bauer, F. E., Chapman, S. C., et al. 2005, ApJ, 632, 736Allamandola, L. J., Tielens, A. G. G. M., & Barker, J. R. 1985, ApJ, 290, L25Alonso-Herrero, A., Rieke, G. H., Rieke, M. J., et al. 2006, ApJ, 650, 835Archibald, E. N., Dunlop, J. S., Hughes, D. H., et al. 2001, MNRAS, 323, 417Armus, L., Charmandaris, V., Bernard-Salas, J., et al. 2007, ApJ, 656, 148Bavouzet, N., Dole, H., Le Floc’h, E., et al. 2008, A&A, 479, 83Bertincourt, B., Helou, G., Appleton, P., et al. 2009, ApJ, 705, 68Bolzonella, M., Miralles, J.-M., & Pelló, R. 2000, A&A, 363, 476Brandl, B. R., Bernard-Salas, J., Spoon, H. W. W., et al. 2006, ApJ, 653, 1129Chapman, S. C., Blain, A. W., Smail, I., & Ivison, R. J. 2005, ApJ, 622, 772Condon, J. J. 1992, ARA&A, 30, 575Coppin, K., Pope, A., Menéndez-Delmestre, K., et al. 2010, ApJ, 713, 503Crawford, T., Marr, J., Partridge, B., & Strauss, M. A. 1996, ApJ, 460, 225Dasyra, K. M., Yan, L., Helou, G., et al. 2009, ApJ, 701, 1123Desai, V., Soifer, B. T., Dey, A., et al. 2009, ApJ, 700, 1190Dey, A., Soifer, B. T., Desai, V., et al. 2008, ApJ, 677, 943Dey, A., & The Ndwfs/MIPS Collaboration. 2009, in ASP Conf. Ser. 408, ed.
W. Wang, Z. Yang, Z. Luo, & Z. Chen, 411Draine, B. T., & Li, A. 2001, ApJ, 551, 807Elbaz, D. 2010, in IAU Symp., 267, 17Elbaz, D., Cesarsky, C. J., Chanial, P., et al. 2002, A&A, 384, 848Fadda, D., Yan, L., Lagache, G., et al. 2010, ApJ, 719, 425Farrah, D., Lonsdale, C. J., Borys, C., et al. 2006, ApJ, 641, L17Farrah, D., Bernard-Salas, J., Spoon, H. W. W., et al. 2007, ApJ, 667, 149Farrah, D., Lonsdale, C. J., Weedman, D. W., et al. 2008, ApJ, 677, 957Fiolet, N., Omont, A., Polletta, M., et al. 2009, A&A, 508, 117Galliano, F., Madden, S. C., Tielens, A. G. G. M., Peeters, E., & Jones, A. P.
2008, ApJ, 679, 310Genzel, R., Lutz, D., Sturm, E., et al. 1998, ApJ, 498, 579Helou, G., Soifer, B. T., & Rowan-Robinson, M. 1985, ApJ, 298, L7Helou, G., Lu, N. Y., Werner, M. W., Malhotra, S., & Silbermann, N. 2000, ApJ,
532, L21Hernán-Caballero, A., Pérez-Fournon, I., Hatziminaoglou, E., et al. 2009,
MNRAS, 395, 1695Houck, J. R., Roellig, T. L., van Cleve, J., et al. 2004, ApJS, 154, 18Houck, J. R., Soifer, B. T., Weedman, D., et al. 2005, ApJ, 622, L105Huang, J., Faber, S. M., Daddi, E., et al. 2009, ApJ, 700, 183Ivison, R. J., Greve, T. R., Smail, I., et al. 2002, MNRAS, 337, 1Ivison, R. J., Magnelli, B., Ibar, E., et al. 2010, A&A, 518, L31Jiang, L., Fan, X., Ivezic, et al. 2007, ApJ, 656, 680John, T. L. 1988, A&A, 193, 189Kennicutt, Jr., R. C. 1998, ARA&A, 36, 189Kennicutt, Jr., R. C., Armus, L., Bendo, G., et al. 2003, PASP, 115, 928Kovács, A., Chapman, S. C., Dowell, C. D., et al. 2006, ApJ, 650, 592Kovács, A., Omont, A., Beelen, A., et al. 2010, ApJ, 717, 29Krabbe, A., Böker, T., & Maiolino, R. 2001, ApJ, 557, 626Kreysa, E., Gemuend, H.-P., Gromke, J., et al. 1998, in Advanced Technology
MMW, Radio, and Terahertz Telescopes, ed. T. G. Phillips, SPIE Conf., 3357,319
Leger, A., & Puget, J. L. 1984, A&A, 137, L5Li, A., & Draine, B. T. 2001, ApJ, 554, 778Lonsdale, C. J., Omont, A., Polletta, M. d. C., et al. 2006, in BAAS, 38, 1171Lonsdale, C. J., Polletta, M. d. C., Omont, A., et al. 2009, ApJ, 692, 422Lu, N., Helou, G., Werner, M. W., et al. 2003, ApJ, 588, 199Lutz, D., Sturm, E., Tacconi, L. J., et al. 2008, ApJ, 684, 853Magdis, G. E., Hwang, H., Elbaz, D., et al. 2010, MNRAS, 409, 22Magnelli, B., Lutz, D., Berta, S., et al. 2010, A&A, 518, L28Martínez-Sansigre, A., Lacy, M., Sajina, A., & Rawlings, S. 2008, ApJ, 674, 676Menéndez-Delmestre, K., Blain, A. W., Alexander, D. M., et al. 2007, ApJ, 655,
L65Menéndez-Delmestre, K., Blain, A. W., Smail, I., et al. 2009, ApJ, 699, 667Mobasher, B., Dahlen, T., Hopkins, A., et al. 2009, ApJ, 690, 1074O’Dowd, M. J., Schiminovich, D., Johnson, B. D., et al. 2009, ApJ, 705, 885Oliver, S. J., Wang, L., Smith, A. J., et al. 2010, A&A, 518, L21Owen, F. N., & Morrison, G. E. 2008, AJ, 136, 1889Owen, F. N., Morrison, G. E., Klimek, M. D., & Greisen, E. W. 2009, AJ, 137Pannella, M., Carilli, C. L., Daddi, E., et al. 2009, ApJ, 698, L116Pope, A., Chary, R.-R., Alexander, D. M., et al. 2008, ApJ, 675, 1171Reuland, M., Röttgering, H., van Breugel, W., & De Breuck, C. 2004, MNRAS,
353, 377Rieke, G. H., Alonso-Herrero, A., Weiner, B. J., et al. 2009, ApJ, 692, 556Rigopoulou, D., Spoon, H. W. W., Genzel, R., et al. 1999, AJ, 118, 2625Rowan-Robinson, M., Babbedge, T., Oliver, S., et al. 2008, MNRAS, 386, 697Sajina, A., Yan, L., Armus, L., et al. 2007, ApJ, 664, 713Sajina, A., Yan, L., Lutz, D., et al. 2008, ApJ, 683, 659Sanders, D. B., & Mirabel, I. F. 1996, ARA&A, 34, 749Schweitzer, M., Lutz, D., Sturm, E., et al. 2006, ApJ, 649, 79Seymour, N., Stern, D., De Breuck, C., et al. 2007, ApJS, 171, 353Seymour, N., Dwelly, T., Moss, D., et al. 2008, MNRAS, 386, 1695Shi, Y., Rieke, G. H., Ogle, P., Jiang, L., & Diamond-Stanic, A. M. 2009, ApJ,
703, 1107Simpson, C., & Eisenhardt, P. 1999, PASP, 111, 691Smail, I., Ivison, R. J., Blain, A. W., & Kneib, J.-P. 2002, MNRAS, 331, 495Smith, J. D. T., Draine, B. T., Dale, D. A., et al. 2007, ApJ, 656, 770Spergel, D. N., Verde, L., Peiris, H. V., et al. 2003, ApJS, 148, 175Spoon, H. W. W., Keane, J. V., Tielens, A. G. G. M., et al. 2002, A&A, 385, 1022Spoon, H. W. W., Marshall, J. A., Houck, J. R., et al. 2007, ApJ, 654, L49Tielens, A. G. G. M. 2008, ARA&A, 46, 289Valiante, E., Lutz, D., Sturm, E., et al. 2007, ApJ, 660, 1060Weedman, D. W., & Houck, J. R. 2008, ApJ, 686, 127Weedman, D., Polletta, M., Lonsdale, C. J., et al. 2006, ApJ, 653, 101Wu, Y., Charmandaris, V., Hao, L., et al. 2006, ApJ, 639, 157Yan, L., Chary, R., Armus, L., et al. 2005, ApJ, 628, 604Yan, L., Sajina, A., Fadda, D., et al. 2007, ApJ, 658, 778Younger, J. D., Omont, A., Fiolet, N., et al. 2009, MNRAS, 394, 1685Yun, M. S., & Carilli, C. L. 2002, ApJ, 568, 88
Pages 15 to 20 are available in the electronic edition of the journal at http://www.aanda.org
Page 14 of 20

N. Fiolet et al.: Mid-infrared spectroscopy of Spitzer-selected ultra-luminous starbursts at z ∼ 2
Appendix A: Spectra and best fit-templates
In Fig. A, we present our spectra and the best-fit templatesamong the 21 templates described in Sect. 4.1 using the methoddescribed in Bertincourt et al. (2009). We also plot the 24 μmflux densities from the SWIRE catalogue and the values deter-mined from the IRS spectra convolved with the MIPS 24 μmfilter.
Page 15 of 20
A&A 524, A33 (2010)
Fig. A.1. IRS spectra of our sources. The black line is our data. In shaded grey, we plot the 1σ deviation. The green short-dashed line is the best-fitPAH template from Smith et al. (2007). The red diamond is the 24 μm flux density from the SWIRE catalogue. The red square is the 24 μmflux density extracted from the spectrum with the 24 μm filter profile. The pink shape shows the region where the transmission of the 24 μm ismaximum. All these spectra are plotted in observed wavelength. The templates are scaled to the “(1 + z)× 7.7 μm” flux. The source ID, the namesof the best-fit templates, and zPAH are reported in each panel.
Page 16 of 20

N. Fiolet et al.: Mid-infrared spectroscopy of Spitzer-selected ultra-luminous starbursts at z ∼ 2
Fig. A.1. continued.
Page 17 of 20

A&A 524, A33 (2010)
Appendix B: Spectral decomposition of the spectra
In Fig. B, we present the decompositions of our spectra madewith the PAHFIT code developed by Smith et al. (2007).
Page 18 of 20

N. Fiolet et al.: Mid-infrared spectroscopy of Spitzer-selected ultra-luminous starbursts at z ∼ 2
L1
5 6 7 8 9 10Wavelength (um)
-0.1
0.0
0.1
0.2
0.3
0.4
Flu
x/(1
+z)
(mJy
)
0.0
0.2
0.4
0.6
0.8
1.0
Rel
ativ
e E
xtin
ctio
n
L3
6 8 10Wavelength (um)
-0.1
0.0
0.1
0.2
0.3
0.4
Flux
/(1+z
) (m
Jy)
0.0
0.2
0.4
0.6
0.8
1.0
Rela
tive
Extin
ctio
n
L5
6 8 10 12Wavelength (um)
-0.1
0.0
0.1
0.2
0.3
0.4
Flux
/(1+z
) (m
Jy)
0.0
0.2
0.4
0.6
0.8
1.0
Rela
tive
Extin
ctio
n
L7
5 6 7 8 9 10 11Wavelength (um)
-0.1
0.0
0.1
0.2
0.3
0.4
Flux
/(1+z
) (m
Jy)
0.0
0.2
0.4
0.6
0.8
1.0
Rela
tive
Extin
ctio
n
L9
5 6 7 8 9 10 11Wavelength (um)
-0.1
0.0
0.1
0.2
0.3
0.4
Flux
/(1+z
) (m
Jy)
0.0
0.2
0.4
0.6
0.8
1.0
Rela
tive
Extin
ctio
n
L10
6 8 10 12Wavelength (um)
-0.1
0.0
0.1
0.2
0.3
0.4
Flux
/(1+z
) (m
Jy)
0.0
0.2
0.4
0.6
0.8
1.0
Rela
tive
Extin
ctio
nL11
5 6 7 8 9 10 11Wavelength (um)
-0.1
0.0
0.1
0.2
0.3
0.4
Flux
/(1+z
) (m
Jy)
0.0
0.2
0.4
0.6
0.8
1.0
Rela
tive
Extin
ctio
n
L14
5 6 7 8 9 10 11Wavelength (um)
-0.1
0.0
0.1
0.2
0.3
0.4
Flux
/(1+z
) (m
Jy)
0.0
0.2
0.4
0.6
0.8
1.0Re
lativ
e Ex
tinct
ion
Fig. B.1. Decompositions of the spectra of our sources. The solid green line is the fitted model. The blue lines above the continuum are the PAHfeatures. The violet lines are the spectral lines. The thin grey lines represent the thermal dust continuum components. The thick red line shows thetotal continuum (stars+dust). The dotted black line shows the extinction (e−τλ , = 1 if no extinction). The source ID is reported as the title of eachpanel.
Page 19 of 20

A&A 524, A33 (2010)
L15
6 8 10 12Wavelength (um)
-0.1
0.0
0.1
0.2
0.3
0.4
Flux
/(1+z
) (m
Jy)
0.0
0.2
0.4
0.6
0.8
1.0
Rela
tive
Extin
ctio
n
L17
5 6 7 8 9 10 11Wavelength (um)
-0.1
0.0
0.1
0.2
0.3
0.4
Flux
/(1+z
) (m
Jy)
0.0
0.2
0.4
0.6
0.8
1.0
Rela
tive
Extin
ctio
n
L19
5 6 7 8 9 10Wavelength (um)
-0.1
0.0
0.1
0.2
0.3
0.4
Flux
/(1+z
) (m
Jy)
0.0
0.2
0.4
0.6
0.8
1.0
Rela
tive
Extin
ctio
n
L20
5 6 7 8 9 10 11Wavelength (um)
-0.1
0.0
0.1
0.2
0.3
0.4
Flux
/(1+z
) (m
Jy)
0.0
0.2
0.4
0.6
0.8
1.0
Rela
tive
Extin
ctio
n
L25
5 6 7 8 9 10 11Wavelength (um)
-0.1
0.0
0.1
0.2
0.3
0.4
Flux
/(1+z
) (m
Jy)
0.0
0.2
0.4
0.6
0.8
1.0
Rela
tive
Extin
ctio
n
L27
5 6 7 8 9 10 11Wavelength (um)
-0.1
0.0
0.1
0.2
0.3
0.4
Flux
/(1+z
) (m
Jy)
0.0
0.2
0.4
0.6
0.8
1.0
Rela
tive
Extin
ctio
n
L31
5 6 7 8 9 10Wavelength (um)
-0.1
0.0
0.1
0.2
0.3
0.4
Flux
/(1+z
) (m
Jy)
0.0
0.2
0.4
0.6
0.8
1.0
Rela
tive
Extin
ctio
n
L33
5 6 7 8 9 10Wavelength (um)
-0.1
0.0
0.1
0.2
0.3
0.4
Flux
/(1+z
) (m
Jy)
0.0
0.2
0.4
0.6
0.8
1.0
Rela
tive
Extin
ctio
n
Fig. B.1. continued.
Page 20 of 20


![Infrared Spectroscopy[1]](https://img.dokumen.tips/doc/110x75/5415f1617bef0a7f3f8b49ff/infrared-spectroscopy1.jpg)


