Embed Size (px)
Citation preview

MID-CURRITUCK BRIDGE STUDY
2040
TRAFFIC ALTERNATIVES REPORT
WBS ELEMENT: 34470.1.TA.1
STIP NO. R-2576
CURRITUCK COUNTY
DARE COUNTY
Prepared by WSP USA
for the
North Carolina Turnpike Authority North Carolina Department of Transportation
September 2017
(Updated November 2018)


Mid-Currituck Bridge Study iii 2040 Traffic Alternatives Report
Table of Contents
1.0 INTRODUCTION ................................................................................................................ 1
1.1 Project Background .................................................................................................. 1
1.2 Chronology of Traffic Studies ............................................................................... 1
1.3 Need for Updated Analysis .................................................................................... 2
1.4 Alternatives Under Consideration ........................................................................ 4
1.4.1 Existing Conditions – Base Year 2015 .................................................................... 4 1.4.2 No-Build Alternative – Future Year 2040 .............................................................. 4 1.4.3 Existing Road Improvement Alternative (ER2) – Future Year 2040 .................. 4 1.4.4 Mid-Currituck Bridge Preferred Alternative – Future Year 2040 ...................... 5
1.5 Methodology ............................................................................................................. 6
2.0 TRAFFIC FORECASTS ..................................................................................................... 11
2.1 Link Traffic Forecasts ............................................................................................ 11
2.1.1 2015 Existing Conditions ........................................................................................15 2.1.2 2040 No-Build Alternative and ER2 ......................................................................15 2.1.3 2040 Build Preferred Alternative ...........................................................................15
2.2 Hourly Traffic Volumes ........................................................................................ 19
2.2.1 Traffic Characteristics of Roadway Network.......................................................19 2.2.2 Computation of Hourly Link Volumes ................................................................19 2.2.3 Computation of Peak Hour Turn Movement Volumes ......................................21
3.0 ROADWAY CONGESTION MEASURES..................................................................... 23
3.1 Level of Service ....................................................................................................... 23
3.1.1 Desired Level of Service..........................................................................................23
3.2 Generalized Service Volume Table .................................................................... 25
3.2.1 NC 12 – Two Lane ...................................................................................................25 3.2.2 Mid-Currituck Bridge .............................................................................................27 3.2.3 US 158 – Multi-Lane ................................................................................................28 3.2.4 Capacity LOS Thresholds Lookup Table ..............................................................28
3.3 LOS and V/C Ratio ................................................................................................. 30
3.4 Duration of Congestion ......................................................................................... 34
3.5 Roadway Measures by Alternative ..................................................................... 37
3.5.1 Existing Conditions .................................................................................................37 3.5.2 No-Build Alternative ...............................................................................................37

Mid-Currituck Bridge Study iv 2040 Traffic Alternatives Report
Table of Contents (concluded)
3.5.3 ER2 .............................................................................................................................37
3.5.4 Mid-Currituck Bridge Preferred Alternative .......................................................37
4.0 NETWORK CONGESTION MEASURES ..................................................................... 42
4.1 Miles of Congested Roadway ............................................................................... 42
4.2 Travel Time .............................................................................................................. 44
5.0 CONCLUSIONS ................................................................................................................. 48
5.1 Traffic Forecasts ...................................................................................................... 48
5.2 Capacity and Level of Service .............................................................................. 48
5.2.1 US 158 West of Wright Memorial Bridge .............................................................48 5.2.2 US 158 east of Wright Memorial Bridge ...............................................................48 5.2.3 NC 12 in Dare County .............................................................................................49 5.2.4 NC 12 in Currituck County ....................................................................................49
5.3 Network Measures of Effectiveness ................................................................... 49
5.4 Travel Time .............................................................................................................. 49

Mid-Currituck Bridge Study v 2040 Traffic Alternatives Report
List of Tables
Table 1. Roadway Cross-Section by Alternative ------------------------------------------------ 10
Table 2. Link Traffic Forecasts ----------------------------------------------------------------------- 12
Table 3. Hourly Traffic Volume Factor ------------------------------------------------------------ 20
Table 4. Hourly Peak Direction Traffic Volume Factor ---------------------------------------- 21
Table 5. Level of Service Definitions --------------------------------------------------------------- 24
Table 6. Two-Lane Highway LOS Calculation Inputs ----------------------------------------- 26
Table 7. Generalized Service Volumes for Two-Lane and Three-Lane Cross-
Sections along NC 12 (Two-Way) ------------------------------------------------------- 26
Table 8. Two-Lane Bridge Highway LOS Calculation Inputs -------------------------------- 27
Table 9. Generalized Service Volumes for Two-Lane Mid-Currituck Bridge
(Two-Way) ------------------------------------------------------------------------------------ 27
Table 10. Multi-Lane Highway Capacity Calculation Inputs ---------------------------------- 29
Table 11. Generalized Service Volumes for Five-Lane and Six-Lane Cross-Sections along
US 158 (One-Way)--------------------------------------------------------------------------- 30
Table 12. Level of Service & V/C Ratios for Roadway Sections ------------------------------- 31
Table 13. Duration of Congestion for Roadway Sections --------------------------------------- 34
Table 14. Miles of Congested Roadway ------------------------------------------------------------ 42
Table 15. Total & Congested VMT Percentages by Roadway Section ----------------------- 43
Table 16. Total and Congested VMT for Multiple Congestion Level ------------------------ 45
Table 17. Travel Time and Speed for Summer Weekday (Inbound only; AM peak) ----- 47
Table 18. Travel Time and Speed for Summer Weekend (Inbound only; PM peak) ----- 47
Mid-Currituck Bridge Study vi 2040 Traffic Alternatives Report
List of Figures
Figure 1. Study Area ------------------------------------------------------------------------------------- 3
Figure 2. ER2 (Revised Design) Alternative -------------------------------------------------------- 7
Figure 3. Preferred Alternative (Revised Design) ------------------------------------------------- 8
Figure 4. Roadway Corridor (Link) Definition ---------------------------------------------------- 9
Figure 5. Existing (2015) Daily Traffic Volumes -------------------------------------------------- 16
Figure 6. Future Year (2040) No-Build / ER2 Daily Traffic Volumes ------------------------ 17
Figure 7. Future Year (2040) Build Bridge with Tolls (MCB4) Alternative
Daily Traffic Volumes ---------------------------------------------------------------------- 18
Figure 8. Existing (2015) Corridor LOS ------------------------------------------------------------- 38
Figure 9. 2040 No-Build Corridor LOS ------------------------------------------------------------- 39
Figure 10. 2040 ER2 Corridor LOS -------------------------------------------------------------------- 40
Figure 11. 2040 Preferred Alternative Corridor LOS ---------------------------------------------- 41

Mid-Currituck Bridge Study 1 2040 Traffic Alternatives Report
1.0 Introduction
This 2040 Traffic Alternatives Report supports the Mid-Currituck Bridge Final
Environmental Impact Statement (FEIS) reevaluation being conducted by the North
Carolina Turnpike Authority (NCTA). The study is examining a new seven-mile bridge
connecting US 158 near Aydlett to NC 12 south of Corolla on the Currituck County
Outer Banks. The project study area includes US 158 between Barco and Southern
Shores and follows NC 12 north from Southern Shores to Corolla as shown in Figure 1.
1.1 Project Background
The Mid-Currituck Bridge project, STIP R-2576, has been under study for several years
dating back to before 1995. The most recent traffic analysis was prepared and
summarized in the 2035 Traffic Alternatives Report dated April 2008 and revised March
2009. The 2035 Traffic Alternatives Report was utilized in the EIS process to evaluate
congestion measures and design requirements for the proposed project. In 2012, a draft
Record of Decision (ROD) was prepared based on the 2035 Report. Prior to final
signature, however, the NC General Assembly rescinded state funding that was
required for the project. At that time, a decision was made that the ROD would not be
signed since there was inadequate funding to construct the project. In 2015, the Mid-
Currituck Bridge project was included in NCDOT’s 2016-2025 STIP for construction
funding starting in 2017.
The study area traffic network serves highest traffic volumes in summer especially on
summer Saturdays and summer weekends. For this project, the design period is the
Summer Weekday. To test worst case operations from a systems perspective as well as
to verify operations, a Summer Weekend traffic analysis is also included.
1.2 Chronology of Traffic Studies
This traffic report is a result of a series of traffic reports (dating back to 2002) originally
included as part of a similar study conducted for the North Carolina Department of
Transportation (NCDOT). The process has been an iterative process with revised
alternatives, forecasts, measures of effectiveness, and issues that have been raised while
completing the project. A chronology of various stages of traffic studies for the project is
outlined below:
• Traffic Needs Report (July 2002): The initial traffic analysis for this phase of the EIS was
completed and submitted to NCDOT as the Traffic Needs Analysis in July 2002. The
report documented the methodology, assumptions, and findings for existing (2001)
traffic conditions, future (2025) No-Build traffic conditions, and hurricane evacuation
clearance times. The 2025 No-Build traffic conditions included analysis of thirteen
Mid-Currituck Bridge Study 2 2040 Traffic Alternatives Report
roadway links and two intersections. Hereinafter, the July 2002 main report will be
referred to as the Traffic Needs Report (or TNR).
• 2025 Traffic Alternatives Report (May 2007): Building upon the No-Build analysis,
follow-up analysis was developed to look at 2025 traffic forecasts and traffic capacity
under potential alternatives including widening and Build Bridge scenarios. This
analysis step included traffic information for a new link, the Mid-Currituck Bridge.
In addition, non-highway alternatives were investigated, including a sketch-level
examination of reversible lanes. The findings were initially presented in a draft
report in March 2004 to NCDOT, but were finalized and incorporated into the 2025
Traffic Alternatives Report (May 2007) submitted to the NCTA.
• Revised 2025 Traffic Alternatives Report (December 2005): Additional 2025 alternatives
analysis was conducted to address issues identified in the first stage of the
alternatives analysis. The first issue was to determine the year that traffic flow is
expected to reach LOS E and LOS F under different roadway typical sections for the
peak summer traffic seasons. The second issue was to examine the operational
feasibility of a reversible third lane on NC 12 for use on summer weekends when
tourists are arriving and departing beach houses as well as during a hurricane
evacuation. The findings were initially presented in a draft report to NCDOT in
December 2005, but were finalized and incorporated into the 2025 Traffic
Alternatives Report.
• 2035 Traffic Alternatives Report (April 2008): The 2035 Traffic Alternatives Report,
developed in April 2008 and revised in March 2009, was an update of the 2025
Traffic Alternatives Report and utilizing year 2035 traffic volumes. In addition, the
updated analysis examined the impact of expected toll diversion on traffic volumes.
As with previous analyses, this analysis was built upon all previous alternatives
analysis and draft reports. Although new assumptions were utilized in some cases,
most of the analysis assumed that the previous traffic studies were applicable. The
additional analysis focused on new information related to traffic operations.
1.3 Need for Updated Analysis
In 2015, the Mid-Currituck Bridge project was included in NCDOT’s 2016-2025 STIP for
construction funding starting in 2017. To proceed with the project, multiple elements
needed to be reevaluated and the NEPA documentation needed completion. As part of
this reevaluation process, it was determined that the traffic analysis needed to be
updated, primarily to account for a general slowdown in development activity in
Currituck and Dare Counties and reflected in the updated project level traffic forecast
dated June 2016.

Mid-Currituck Bridge Study 3 2040 Traffic Alternatives Report
Figure 1. Study Area

Mid-Currituck Bridge Study 4 2040 Traffic Alternatives Report
As a result, the NCTA requested an update of the traffic analysis. The updated analysis
is intended for two primary purposes:
• Update the project’s assessment of the travel benefits of the project – included in this
report,
• Evaluate the required geometric improvements needed to serve future traffic
volumes – detailed analysis included in another report.
1.4 Alternatives Under Consideration
This report considers a No-Build alternative and two Build alternatives, ER2 and
Preferred Alternative. The Build alternatives are shown in Figure 2 and Figure 3.
The No-Build alternative is evaluated for both 2015 Existing and 2040 Future conditions
while the Build alternatives are evaluated for 2040 Future conditions only.
1.4.1 Existing Conditions – Base Year 2015
This is the Existing or No-Build network with 2015 traffic volumes.
1.4.2 No-Build Alternative – Future Year 2040
This is the No-Build network, identical to the 2015 Existing network with no
improvements, with 2040 traffic forecasts.
TIP Project Number R-3419:
TIP Project Number R-3419 is included in the most recent NCDOT 2018-2027 TIP. It was
added to the TIP close to the end of the completion of this analyses. R-3419, as stated in
the TIP, included access improvements on US 158 from the Wright Memorial Bridge to
US 64. The assumption included in this analyses is that this section of NC 158 would be
a 4-lane superstreet. Analyses including R-3419 was done for all alternatives. The
analyses also include the section of NC 158 east of NC 12 (Link 8). The results of the
analyses are the italicized numbers in tables 14, 15, and 16.
TIP Project Number R-2574 is outside the study area for traffic modelling. However, the
project is factored into the traffic volumes assumed at the NC 158 and NC 168
intersection used in the analysis
1.4.3 Existing Road Improvement Alternative (ER2) – Future Year 2040
The “ER” in ER2 stands for “Existing Roads”. A Mid-Currituck Bridge is not included in
this alternative, but only widening existing sections of US 158 and NC 12. ER2 was
developed to achieve transportation benefits using existing roadways while minimizing
impacts to communities along those roads. The basic features of ER2 are:

Mid-Currituck Bridge Study 5 2040 Traffic Alternatives Report
• Widening US 158 to a six-lane super-street between the Wright Memorial Bridge and
the NC 12 intersection with US 158.
• Constructing a super-street T-intersection at the current intersection of US 158 and
NC 12, with modified access pattern for the Aycock Brown Welcome Center (Visitor
Center).
• Widening NC 12 to three lanes (two travel lanes and a center lane for left turns)
between US158 and a point just south of Duck, at the existing three-lane section in
Duck.
• Hurricane evacuation improvements on US 158 between NC 168 and the Wright
Memorial Bridge, which would not affect normal daily congestion levels.
ER2 is shown in Figure 2. The components shown reflect the revised ER2 design
prepared to take into consideration the 2040 traffic forecasts prepared in 2016.
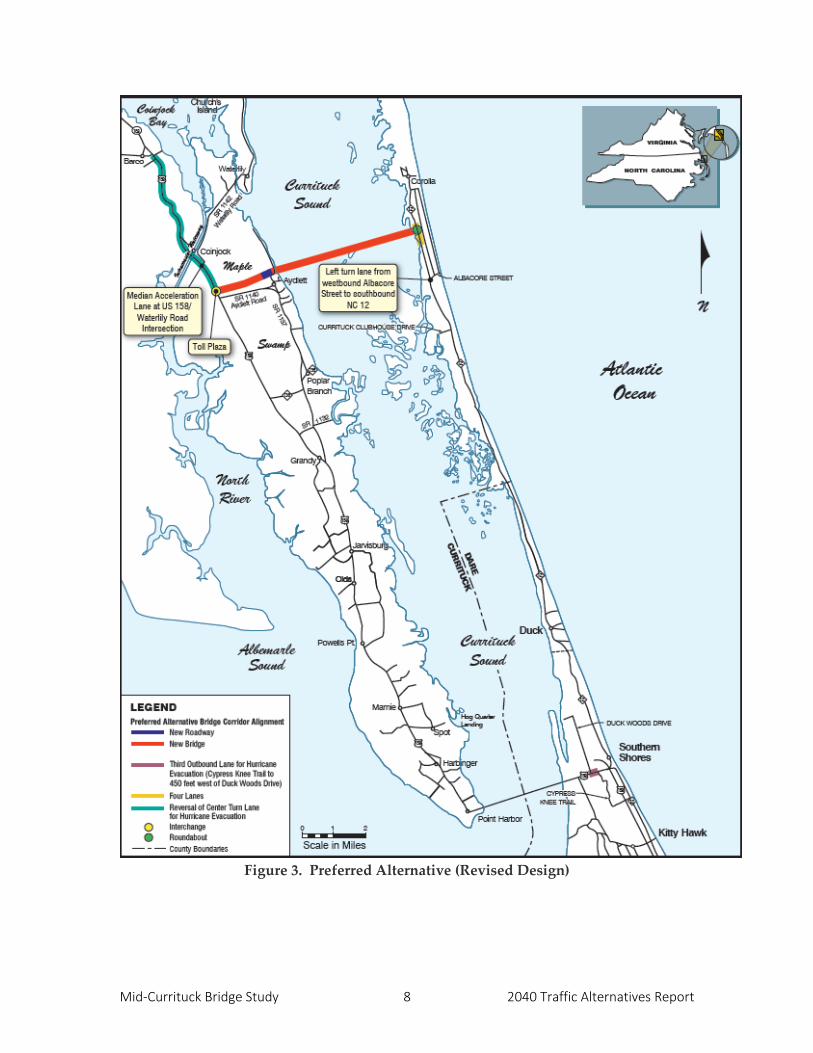
1.4.4 Mid-Currituck Bridge Preferred Alternative – Future Year 2040
The Preferred Alternative includes construction of a Mid-Currituck Bridge, as well as
limited improvements to existing NC 12 and US 158. The Preferred Alternative identifies
the extent to which network congestion and travel time could be improved, as well as
other associated benefits, if only a Mid-Currituck Bridge were built. Limited existing
road improvements were added to MCB4 to ensure that southbound traffic on NC 12
from the bridge would not queue back onto the bridge on summer weekend. The basic
features of this alternative are:
• Constructing a 5.3-mile-long, two-lane toll bridge across Currituck Sound, with
approach roads, in Currituck County. The mainland approach road to the bridge
over Currituck Sound would include a bridge over Maple Swamp.
• Improvement to NC 12 in the bridge terminus area, including a roundabout at the
bridge’s connection to NC 12.
• US 158 improvements would include an interchange at the connection of US 158 and
the proposed bridge. Toll plazas would be just east of the interchange. Drivers
traveling between US 158 and Aydlett would continue to use Aydlett Road.
• For hurricane evacuation improvement, traffic will use the existing center turn lane
on US 158 from the interchange to the intersection of US 158 and NC 168 as a third
outbound evacuation lane. One inbound lane on the Knapp (Intracoastal Waterway)
Bridge would be used as a third outbound evacuation lane. In addition, adding
approximately 1,600 feet of new third outbound lane to the west of the NC 12/US 158
intersection in Dare County to provide additional hurricane evacuation capacity.

Mid-Currituck Bridge Study 6 2040 Traffic Alternatives Report
The Preferred Alternative is shown in Figure 3. The components shown reflect the
revised Preferred Alternative design prepared to take into consideration the 2040
traffic forecasts prepared in 2016.
1.5 Methodology
The focus of this analysis is to understand roadway network performance and along
with transportation supply and trip-demand interactions for Mid-Currituck Bridge
project alternatives from a planning perspective. A sketch-planning tool based on
generalized service volume table approach was used for this analysis. This section provides
an overview of methodology used in this planning level analysis.
The methodology is based on Chapter 6 of Highway Capacity Manual 2016 (HCM 2016).
According to HCM [Page 6-1, Chapter 6/ HCM and Alternative Analysis Tools],
“Generalized service volume tables are sketch-planning tools that provide an
estimate of the maximum volume a system element can carry at a given level
of service (LOS), given a default set of assumptions about the system
element. The use of local default values and local generalized service volume
tables helps reduce the uncertainty in the results of analyses that use these
tools, compared with using the HCM’s national default values and tables.”
As in previous analysis, the network congestion review is a planning level review and
not intended to be a detailed capacity/ simulation analysis of network congestion. As
such, the use of this sketch planning methodology (i.e. lookup tables based on HCS
methodology) is appropriate. In addition, it is consistent with the type of analysis
conducted in the previous analysis.
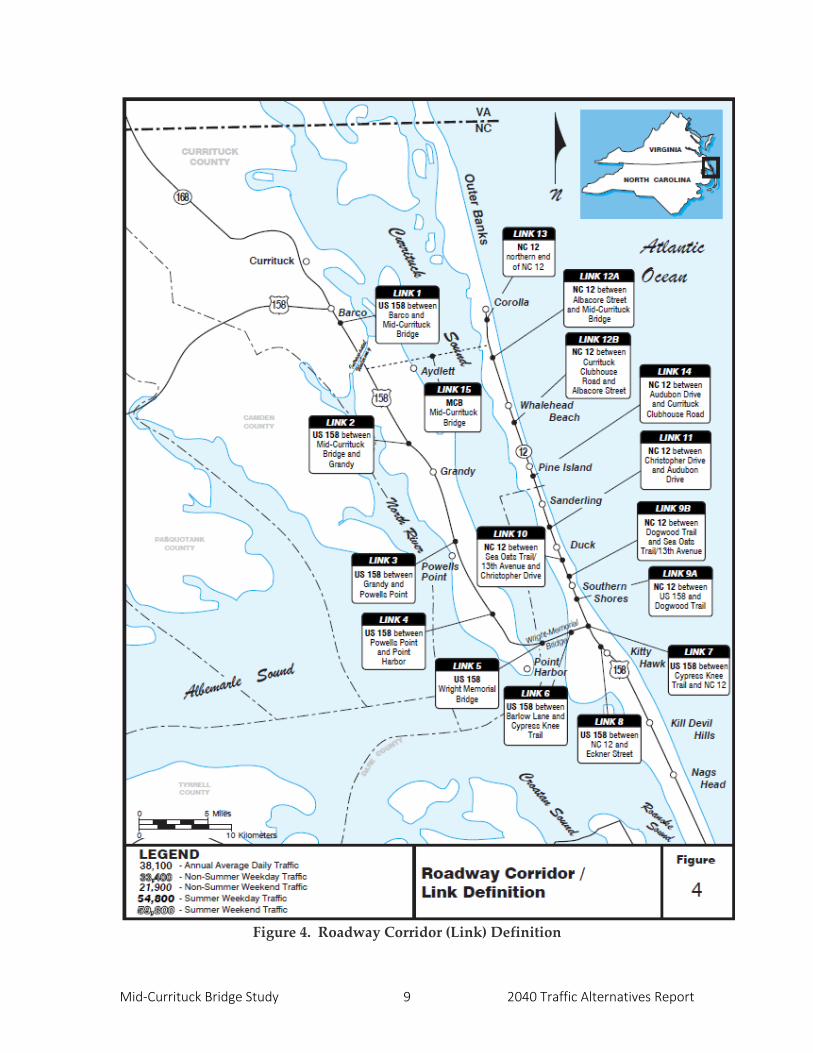
In this study the system element is roadway corridor, as defined by 16 (+1) links in
Figure 4. Table 1 provides details about the 16 (+1) links including cross-section assumed
for analysis.
The generalized service volume table provides a Level of Service (LOS) threshold for
each cross-section examined in this study. Demand to Capacity (D/C) and Volume to
Capacity (V/C) ratios can be computed based on hourly link volumes and LOS
thresholds. If the demand is higher than capacity (LOS F threshold), the hourly volume
is constrained to capacity and the demand is spread to adjacent time period (peak hour
spreading). For this study congestion is generally defined as LOS E or worse.
The following sections provide more details including assumptions and inputs:
• Daily and hourly forecast utilized are discussed in Chapter 2.0
• Level of service thresholds are detailed in Section 3.2

Mid-Currituck Bridge Study 7 2040 Traffic Alternatives Report
Figure 2. ER2 (Revised Design) Alternative
Mid-Currituck Bridge Study 8 2040 Traffic Alternatives Report
Figure 3. Preferred Alternative (Revised Design)
Mid-Currituck Bridge Study 9 2040 Traffic Alternatives Report
Figure 4. Roadway Corridor (Link) Definition

Mid-Currituck Bridge Study 10 2040 Traffic Alternatives Report
Table 1. Roadway Cross-Section by Alternative
Link
# Route Section
Length
(mi)
Existing /
No-Build ER2
Preferred
Alternative
1 US
158
Barco and Mid-
Currituck Bridge 5.17
5-Lane 55
MPH
5-Lane 55
MPH
5-Lane 55
MPH
2 US
158
Mid-Currituck Bridge
and Grandy 6.56
5-Lane 55
MPH
5-Lane 55
MPH
5-Lane 55
MPH
3 US
158
Grandy and Powells
Point 6.12
5-Lane 55
MPH
5-Lane 55
MPH
5-Lane 55
MPH
4 US
158
Powells Point and
Point Harbor 6.66
5-Lane 55
MPH
5-Lane 55
MPH
5-Lane 55
MPH
5 US
158
Wright Memorial
Bridge 3.27
5-Lane 55
MPH
5-Lane 55
MPH
5-Lane 55
MPH
6 US
158
Barlow Lane and
Cypress Knee Trail 0.92
5-Lane
Arterial
6-Lane
Superstreet
5-Lane
Arterial
7 US
158
Cypress Knee Trail
and NC 12 0.48
5-Lane
Arterial
6-Lane
Superstreet
5-Lane
Arterial
8 US
158
NC 12 and Eckner
Street 1.13
5-Lane
Arterial
5-Lane
Arterial
5-Lane
Arterial
9A NC 12 US 158 and Dogwood
Trail 2.29
3-Lane
TWLTL
Arterial
3-Lane
TWLTL
Arterial
3-Lane
TWLTL
Arterial
9B NC 12
Dogwood Trail and
Sea Oats Trail/13th
Avenue
2.34 2-Lane
Arterial
3-Lane
TWLTL
Arterial
2-Lane
Arterial
10 NC 12
Sea Oats Trail/13th
Avenue &
Christopher Drive
1.15
3-Lane
TWLTL
Arterial
3-Lane
TWLTL
Arterial
3-Lane
TWLTL
Arterial
11 NC 12 Christopher Drive
and Audubon Drive 7.18 2-Lane 2-Lane 2-Lane
14 NC 12
Audubon Dr and
Currituck Clubhouse
Road
3.02 2-Lane 2-Lane 2-Lane
12B NC 12 Currituck Clubhouse
Road and Albacore St 1.88
3-Lane
TWLTL
Arterial
3-Lane
TWLTL
Arterial
3-Lane
TWLTL
Arterial
12A NC 12 Albacore St and Mid-
Currituck Bridge 1.8 2-Lane 2-Lane 2-Lane
13 NC 12 Northern end of NC
12 1.39 2-Lane 2-Lane 2-Lane
15 MCB Mid-Currituck Bridge 7 - - 2-Lane
Bridge

Mid-Currituck Bridge Study 11 2040 Traffic Alternatives Report
2.0 Traffic Forecasts
Traffic forecasts for R-2576 were developed for base year (2015) and future year (2040) in
June 2016 and are documented in the 2040 Project Level Traffic Forecast report.
As noted in Section 1.1, because of the unique nature of beach holiday travel pattern in
the study area, the design period for this project is the Summer Weekday instead of the
typical AADT. Additional analysis is also needed for the Summer Weekend, which has
the peak daily trip volumes.
Detailed traffic forecasts (intersection level) were developed for Summer Weekday and
Summer Weekend as per NCDOT Traffic Forecasting guidelines. Link traffic forecasts
(corridor level) were developed for AADT, Non-Summer Weekday, Non-Summer
Weekend, Summer Weekday and Summer Weekend for the four scenarios.
Most of the analysis in this report is based on link forecasts, except for travel time
analysis (Section 5.4), which utilizes peak hour volumes developed from detailed
forecasts.
2.1 Link Traffic Forecasts
Roadway corridor level link based forecasts were prepared for evaluation of Purpose
and Need for this project. The link traffic forecasts are weighted average (by length) of
daily traffic volumes on the constituting segments. The following six (6) scenarios were
developed for 16 (+1) specific links for AADT, Non-Summer Weekday, Non-Summer
Weekend, Summer Weekday and Summer Weekend (i.e., the link forecasts):
• 2015 Base Year No-Build
• 2015 Base Year Build without Tolls
• 2015 Base Year Build with Tolls
• 2040 Future Year No-Build
• 2040 Future Year ER2
• 2040 Future Year Build without Tolls
• 2040 Future Year Build with Tolls
The link forecasts for the four scenarios being evaluated in this report emphasized above
in bold. Table 2 shows link forecasts for 16 (+1) links for the four scenarios. They are also
shown in Figure 5 through Figure 7 for each scenario.

Mid-Currituck Bridge Study 12 2040 Traffic Alternatives Report
Table 2. Link Traffic Forecasts
Link #
Route Section Daily Traffic
Volume
Base Year
Existing (2015)
No Build /
ER2 (2040)
Build Bridge w/ Tolls (2040)
1 US
158
Barco and Mid-
Currituck Bridge
AADT 17,400 26,100 26,100
Non-Summer
Weekday 14,900 22,300 22,300
Non-Summer
Weekend 16,900 25,200 25,200
Summer Weekday 19,600 29,300 29,300
Summer Weekend 43,600 64,200 64,200
2 US
158
Mid-Currituck
Bridge and
Grandy
AADT 16,400 24,700 18,900
Non-Summer
Weekday 14,000 21,100 16,100
Non-Summer
Weekend 15,800 23,900 18,200
Summer Weekday 18,400 27,800 21,200
Summer Weekend 43,000 63,200 47,000
3 US
158
Grandy and
Powells Point
AADT 18,600 27,300 20,300
Non-Summer
Weekday 15,900 23,300 17,300
Non-Summer
Weekend 18,000 26,400 19,600
Summer Weekday 20,900 30,700 22,800
Summer Weekend 44,900 66,200 48,800
4 US
158
Powells Point
and Point Harbor
AADT 21,000 30,600 23,100
Non-Summer
Weekday 17,900 26,100 19,800
Non-Summer
Weekend 20,300 29,600 22,400
Summer Weekday 23,600 34,400 26,000
Summer Weekend 47,400 69,200 51,400
5 US
158
Wright Memorial
Bridge
AADT 21,000 30,600 23,100
Non-Summer
Weekday 17,900 26,100 19,800
Non-Summer
Weekend 20,300 29,600 22,400
Summer Weekday 23,600 34,400 26,000
Summer Weekend 47,400 69,200 51,400

Mid-Currituck Bridge Study 13 2040 Traffic Alternatives Report
Table 2 (continued). Link Traffic Forecasts
Link #
Route Section Daily Traffic
Volume
Base Year
Existing (2015)
No Build /
ER2 (2040)
Build Bridge w/ Tolls (2040)
6 US
158
Barlow Lane and
Cypress Knee
Trail
AADT 24,600 34,900 27,900
Non-Summer
Weekday 21,000 29,800 23,800
Non-Summer
Weekend 23,700 33,700 26,900
Summer Weekday 27,600 39,200 31,300
Summer Weekend 49,600 72,000 55,500
7 US
158
Cypress Knee
Trail and NC 12
AADT 29,500 41,400 34,600
Non-Summer
Weekday 25,200 35,300 29,600
Non-Summer
Weekend 28,600 40,000 33,500
Summer Weekday 33,200 46,500 38,900
Summer Weekend 55,600 79,400 63,600
8 US
158
NC 12 and
Eckner Street
AADT 33,300 43,100 43,100
Non-Summer
Weekday 28,400 36,800 36,800
Non-Summer
Weekend 32,200 41,600 41,600
Summer Weekday 37,400 48,400 48,400
Summer Weekend 50,200 69,400 69,400
9A NC 12 US 158 and
Dogwood Trail
AADT 19,800 30,000 23,200
Non-Summer
Weekday 16,900 25,600 19,800
Non-Summer
Weekend 19,100 29,000 22,400
Summer Weekday 22,200 33,700 26,100
Summer Weekend 27,400 42,200 26,400
9B NC 12
Dogwood Trail
and Sea Oats
Trail / 13th
Avenue
AADT 17,900 28,700 21,500
Non-Summer
Weekday 15,300 24,500 18,400
Non-Summer
Weekend 17,300 27,700 20,800
Summer Weekday 20,100 32,200 24,200
Summer Weekend 26,700 41,300 24,500

Mid-Currituck Bridge Study 14 2040 Traffic Alternatives Report
Table 2 (continued). Link Traffic Forecasts
Link #
Route Section Daily Traffic
Volume
Base Year
Existing (2015)
No Build /
ER2 (2040)
Build Bridge w/ Tolls (2040)
10 NC 12
Sea Oats Trail /
13th Avenue and
Christopher
Drive
AADT 16,000 27,000 19,500
Non-Summer
Weekday 13,700 23,000 16,600
Non-Summer
Weekend 15,500 26,100 18,800
Summer Weekday 18,000 30,300 21,900
Summer Weekend 24,500 40,300 22,500
11 NC 12
Christopher
Drive and
Audubon Drive
AADT 12,600 23,300 15,800
Non-Summer
Weekday 10,800 19,900 13,500
Non-Summer
Weekend 12,200 22,500 15,300
Summer Weekday 14,200 26,200 17,800
Summer Weekend 20,900 36,400 18,500
14 NC 12
Audubon Drive
and Currituck
Clubhouse Road
AADT 12,200 22,800 17,100
Non-Summer
Weekday 10,400 19,500 14,600
Non-Summer
Weekend 11,800 22,000 16,500
Summer Weekday 13,700 25,600 19,200
Summer Weekend 20,600 31,100 18,700
12B NC 12
Currituck
Clubhouse Road
and Albacore
Street
AADT 13,600 21,800 18,900
Non-Summer
Weekday 11,600 18,600 16,100
Non-Summer
Weekend 13,200 21,100 18,200
Summer Weekday 15,300 24,500 21,200
Summer Weekend 20,200 25,700 23,400
12A NC 12
Albacore Street
and Mid-
Currituck Bridge
AADT 10,500 13,500 15,800
Non-Summer
Weekday 9,000 11,600 13,500
Non-Summer
Weekend 10,100 13,100 15,300
Summer Weekday 11,800 15,200 17,800
Summer Weekend 14,300 16,000 21,200

Mid-Currituck Bridge Study 15 2040 Traffic Alternatives Report
Table 2 (concluded). Link Traffic Forecasts
Link #
Route Section Daily Traffic
Volume
Base Year
Existing (2015)
No Build /
ER2 (2040)
Build Bridge w/ Tolls (2040)
13 NC 12 Northern end of
NC 12
AADT 9,500 10,900 10,900
Non-Summer
Weekday 8,100 9,300 9,300
Non-Summer
Weekend 9,200 10,500 10,500
Summer Weekday 10,700 12,200 12,200
Summer Weekend 12,700 13,400 13,400
15 MCB Mid-Currituck
Bridge
AADT - - 7,700
Non-Summer
Weekday - - 6,500
Non-Summer
Weekend - - 7,400
Summer Weekday - - 8,600
Summer Weekend - - 18,000
2.1.1 2015 Existing Conditions
The link-based forecasts for Existing (2015) conditions are shown in Figure 5.
2.1.2 2040 No-Build Alternative and ER2
The Future Year (2040) No-Build Alternative link forecasts are shown in Figure 6. The
No-Build Alternative and ER2 forecasts are identical.
2.1.3 2040 Build Preferred Alternative
The Future Year (2040) Build Preferred Alternative with Tolls alternative link forecasts
are shown in Figure 7.

Mid-Currituck Bridge Study 16 2040 Traffic Alternatives Report
Figure 5. Existing (2015) Daily Traffic Volumes

Mid-Currituck Bridge Study 17 2040 Traffic Alternatives Report
Figure 6. Future Year (2040) No-Build / ER2 Daily Traffic Volumes

Mid-Currituck Bridge Study 18 2040 Traffic Alternatives Report
Figure 7. Future Year (2040) Build Preferred Alternative with Tolls Alternative Daily
Traffic Volumes

Mid-Currituck Bridge Study 19 2040 Traffic Alternatives Report
2.2 Hourly Traffic Volumes
The daily forecasts provided were developed for 16 (+1) links in the study area. To
provide capacity analysis for the roadway links, peaking characteristics and other traffic
flow characteristics were identified in the 2040 Traffic Forecast Report. The details
impacting the capacity analysis are summarized in this section.
2.2.1 Traffic Characteristics of Roadway Network
The traffic analyses for this project utilized traffic diurnal profiles derived from traffic
counts collected in summer of 2015. Count data and diurnal profile from NCDOT’s
Automatic Traffic Recorder (ATR) station A2703 on the Wright Memorial Bridge was
also utilized in addition to the project-level traffic counts.
The temporal distribution of traffic counts along NC 12 and US 158 were analyzed and
general findings include:
• During Summer Weekday conditions, traffic volumes along NC 12 have a traditional
AM and PM peak although traffic volumes throughout the day are only slightly less
than the peak hour flows.
• On summer Saturdays, traffic volumes along NC 12 are higher than on weekdays
and peak period traffic volumes exceed weekday peak period volumes for a longer
timeframe, from 8 AM to 8 PM.
• On summer Sundays, NC 12 traffic volumes are less than Saturdays, but still exceed
peak weekday levels from 10 AM to 5 PM.
2.2.2 Computation of Hourly Link Volumes
Using the traffic data collected and the analysis of peaking and temporal distribution,
traffic flow characteristics were identified for inclusion in the capacity analysis of
roadway links.
Hourly traffic count data from Wright Memorial Bridge ATR 2703 was utilized for
calculating diurnal profile of all links for AADT, Non-Summer Weekday and Non-
Summer Weekend. Average AADT profile, Non-Summer Weekday profile and Non-
Summer Weekend profile were calculated based on data between 2008 and 2012 from
ATR 2703.
For Summer Weekday and Summer Weekend, hourly data was available from the
nineteen classification counts documented in the 2040 Traffic Forecast Report. After a
review of the data, the study area counts were grouped into four zones and an average
profile was calculated for each zone:

Mid-Currituck Bridge Study 20 2040 Traffic Alternatives Report
• Zone A – US 158 between Barco and Wright Memorial Bridge (counts C-1 through C-
4)
• Zone B – US 158 from Wright Memorial Bridge to NC 12 (Counts C-5 through C-8)
• Zone C – NC 12 from US 158 to Currituck-Dare County line (Counts C-9A through
C-11)
• Zone D – NC 12 from Currituck-Dare County line to Corolla (Counts C-14A through
C-13)
Hourly traffic volume factors are provided in Table 3 and hourly peak direction factor
are provided in Table 4.
Table 3. Hourly Traffic Volume Factor
AADT NS
Week- day
NS Week-
end Summer Weekday Summer Weekend
Hr WMB WMB WMB Zone
A
Zone
B
Zone
C
Zone
D
Zone
A
Zone
B
Zone
C
Zone
D
0 0.6% 0.5% 0.7% 0.8% 0.6% 0.6% 0.4% 0.8% 0.8% 0.7% 0.4%
1 0.4% 0.3% 0.5% 0.5% 0.4% 0.3% 0.2% 0.5% 0.5% 0.5% 0.3%
2 0.3% 0.2% 0.3% 0.3% 0.3% 0.3% 0.2% 0.4% 0.4% 0.4% 0.2%
3 0.3% 0.3% 0.4% 0.4% 0.3% 0.2% 0.2% 0.6% 0.6% 0.7% 0.5%
4 0.6% 0.5% 0.6% 0.8% 0.5% 0.3% 0.2% 1.2% 1.1% 1.5% 1.2%
5 1.4% 1.3% 1.3% 1.6% 1.3% 0.7% 0.4% 2.6% 2.2% 3.1% 2.5%
6 3.2% 3.4% 2.6% 3.4% 3.0% 2.0% 1.5% 4.4% 3.8% 5.1% 4.4%
7 5.6% 6.2% 4.4% 5.6% 5.2% 3.8% 3.2% 7.1% 5.7% 6.7% 5.4%
8 6.8% 7.3% 6.1% 6.2% 6.3% 5.7% 4.9% 8.3% 6.9% 7.2% 6.0%
9 6.7% 6.5% 7.3% 6.2% 6.2% 6.4% 6.1% 9.2% 7.8% 7.6% 6.7%
10 7.0% 6.4% 8.2% 6.6% 6.5% 6.8% 8.0% 9.2% 8.1% 7.6% 7.2%
11 7.1% 6.6% 8.1% 6.7% 6.8% 7.0% 8.1% 8.7% 7.8% 6.9% 6.9%
12 7.1% 6.8% 7.9% 6.6% 6.8% 6.7% 8.0% 7.7% 7.6% 6.4% 6.8%
13 7.1% 6.9% 7.7% 6.8% 6.8% 6.7% 7.6% 6.6% 7.2% 6.0% 6.4%
14 7.2% 7.1% 7.8% 6.7% 6.9% 6.9% 7.4% 5.7% 7.0% 5.8% 6.6%
15 7.5% 7.5% 7.8% 6.9% 7.1% 7.0% 7.6% 5.6% 6.6% 5.6% 7.2%
16 7.7% 8.2% 7.3% 7.1% 7.4% 7.2% 7.6% 4.9% 5.9% 5.8% 6.6%
17 7.2% 7.9% 6.3% 7.1% 7.3% 7.1% 7.3% 4.6% 5.4% 5.2% 5.9%
18 5.1% 5.2% 4.8% 5.6% 5.6% 6.1% 6.0% 3.7% 4.2% 4.6% 5.2%
19 3.7% 3.6% 3.4% 4.4% 4.4% 5.1% 5.0% 2.8% 3.4% 3.9% 4.9%
20 2.8% 2.7% 2.5% 3.5% 3.6% 4.6% 4.6% 2.1% 2.7% 3.3% 4.0%
21 2.2% 2.2% 1.9% 2.8% 3.0% 4.2% 3.2% 1.4% 2.1% 2.6% 2.6%
22 1.5% 1.5% 1.3% 2.0% 2.1% 2.6% 1.7% 1.0% 1.5% 1.8% 1.2%
23 1.0% 0.9% 0.8% 1.4% 1.4% 1.4% 0.8% 0.7% 0.9% 1.1% 0.7%
Total 100% 100% 100% 100% 100% 100% 100% 100% 100% 100% 100%

Mid-Currituck Bridge Study 21 2040 Traffic Alternatives Report
Table 4. Hourly Peak Direction Traffic Volume Factor
AADT NS
Week- day
NS Week-
end Summer Weekday Summer Weekend
Hr WMB WMB WMB Zone
A
Zone
B
Zone
C
Zone
D Zone A
Zone
B
Zone
C
Zone
D
0 62% 63% 60% 63% 60% 57% 57% 65% 60% 57% 60%
1 64% 64% 59% 66% 65% 63% 60% 60% 58% 54% 58%
2 53% 54% 52% 57% 58% 55% 59% 55% 52% 65% 65%
3 55% 51% 64% 55% 55% 58% 57% 67% 71% 83% 84%
4 61% 54% 73% 54% 53% 59% 70% 75% 77% 90% 88%
5 59% 51% 71% 56% 52% 54% 57% 70% 77% 85% 89%
6 51% 57% 63% 54% 55% 61% 55% 66% 69% 73% 72%
7 53% 58% 57% 55% 56% 61% 59% 56% 58% 59% 62%
8 53% 59% 58% 53% 56% 61% 57% 53% 56% 51% 53%
9 54% 51% 63% 53% 52% 54% 53% 50% 55% 51% 55%
10 55% 52% 62% 54% 51% 52% 53% 51% 54% 53% 53%
11 51% 51% 55% 52% 51% 54% 53% 52% 51% 52% 57%
12 51% 51% 51% 52% 51% 51% 51% 53% 55% 56% 57%
13 52% 51% 52% 51% 51% 51% 52% 54% 58% 60% 57%
14 51% 52% 53% 52% 51% 51% 52% 57% 59% 60% 55%
15 50% 53% 53% 52% 52% 53% 54% 57% 59% 59% 55%
16 52% 54% 50% 54% 53% 60% 57% 55% 56% 57% 54%
17 53% 55% 51% 56% 55% 63% 58% 54% 55% 56% 55%
18 52% 53% 52% 54% 51% 57% 54% 62% 53% 59% 60%
19 55% 56% 53% 53% 53% 51% 52% 62% 53% 59% 62%
20 54% 55% 52% 53% 53% 52% 52% 60% 53% 58% 63%
21 54% 55% 53% 54% 54% 54% 58% 61% 52% 58% 59%
22 54% 56% 52% 52% 54% 53% 57% 62% 53% 54% 61%
23 57% 59% 54% 56% 54% 57% 58% 65% 54% 54% 59%
Note: For NC 12 roadway links, two-way analysis is utilized so hourly peak direction factors are not used.
2.2.3 Computation of Peak Hour Turn Movement Volumes
A detailed analysis of peak hour traffic operations at study area intersections was
needed as part of the travel time analysis. Peak hour turn movement volumes were
developed for the four scenarios for both Summer Weekday and Summer Weekend:
• 2015 Existing Summer Weekday
• 2015 Existing Summer Weekend
• 2040 No-Build Summer Weekday
• 2040 No-Build Summer Weekend

Mid-Currituck Bridge Study 22 2040 Traffic Alternatives Report
• 2040 ER2 Summer Weekday
• 2040 ER2 Summer Weekend
• 2040 Build (Bridge with Tolls) Summer Weekday
• 2040 Build (Bridge with Tolls) Summer Weekend
These turn movement volumes for AM and PM peak hours were calculated based on the
detailed traffic forecasts by utilizing NCDOT’s latest Intersection Analysis Utility (IAU)
spreadsheet. In all, 16 sets of peak hour volumes and 16 synchro networks were
developed for travel time analysis.
Note that 2040 No-Build and ER2 scenario have identical traffic forecasts but ER2
assumes capacity improvements east of the Wright Memorial Bridge and volume
adjustments due to superstreet configuration.
Peak hour volumes in synchro were not balanced. Peak hour volumes were only
balanced near the intersection of US 158 and NC 12, and at the two ends of the proposed
bridge in the Build scenario.

Mid-Currituck Bridge Study 23 2040 Traffic Alternatives Report
3.0 Roadway Congestion Measures
3.1 Level of Service
Level of service (LOS) is a performance measure indicating the quality of traffic flow.
The LOS performance measure used in this project is based on definitions outlined in
the Highway Capacity Manual, Sixth Edition: A Guide for Multimodal Mobility Analysis
(HCM 6E) (Transportation Research Board, 2016). The analysis used in this study uses the
methodology described in the following chapters of HCM 6E:
• Chapter 6. HCM and Alternative Analysis Tools
• Chapter 7. Interpreting HCM and Alternative Tool Results,
• Chapter 12. Basic Freeway and Multilane Highway Segments,
• Chapter 15. Two-Lane Highways,
• Chapter 16. Urban Street Facilities,
• Chapter 18. Urban Street Segments,
• Chapter 29. Urban Street Facilities: Supplemental,
• Chapter 30. Urban Street Segments: Supplemental, and
• Section B through K. Planning and Preliminary Engineering Applications Guide to
the HCM.
HCM 2016 LOS methodology ranks the quality of traffic flow using a lettering system
ranging from LOS A to LOS F. In this measurement scale, LOS A represents free-flow
traffic conditions and LOS F represents forced or breakdown traffic flow. LOS E
represents traffic operations at or near capacity. Table 5 presents the level of service
concept as summarized in the HCM 2010 and definitions for each level of service.
3.1.1 Desired Level of Service
In general, American Association of State Highway and Transportation Officials
(AASHTO) guidelines indicate that LOS C is considered desirable in rural areas, but in
urban areas the desirable LOS could drop to D, but is not considered ideal. LOS E is
generally considered less than desirable. In addition, the AASHTO Policy on Geometric
Design of Highways and Streets acknowledges that design LOS may vary for specific
circumstances and projects at the discretion of the designer.

Mid-Currituck Bridge Study 24 2040 Traffic Alternatives Report
Table 5. Level of Service Definitions
Level of Service
Classification
Roadway Expected Flow Characteristics
Signalized Intersections Stopped Delay per Vehicle
A Free flowing traffic.
Most vehicles do not stop; average control
delay per vehicle less than or equal to 10
seconds.
B A stable flow with few restrictions on
operating speed.
More vehicles stop, but good progression
and short cycle lengths. Average control
delay per vehicle is between 10.1 and 20.0
seconds.
C Stable flow but with more restrictions
on speed and lane changing.
A large number of vehicles are stopped,
although many still pass through.
Individual cycle failures1 may appear.
Average control delay per vehicle is
between 20.1 and 35.0 seconds.
D
Approaches unstable conditions and
passing becomes extremely difficult.
Motorists are delayed an average of 75
percent of the time. Average highway
speeds are less than 45 mph.
The proportion of vehicles stopping
continues to rise. Individual cycle failures
are noticeable. Average control delay per
vehicle is between 35.1 and 55 seconds.
E
The capacity of a roadway. Passing is
virtually impossible and average
highway speeds can be as low as 25
mph when slow vehicles or other
interruptions are encountered.
The limit of acceptable delay. Individual
cycle failures1 are frequent occurrences.
Average control delay per vehicle is
between 55.1 and 80 seconds.
F
Heavily congested flow with traffic
demand exceeding the capacity of the
highway.
Arrival flow rate exceeds the capacity of
the intersection. Average control delay per
vehicle exceeds 80 seconds.
Note: A cycle failure occurs when an individual vehicle has to wait through more than one red
phase.
For this project, it is acknowledged that there are special circumstances related to tourist
traffic, particularly on summer weekends. For this reason, the design period has been
identified as the summer weekday with consideration of summer weekend operations.
Taking this into account, the goal of this project is to achieve LOS D for the summer
weekday and at least LOS E on the summer weekend. Despite these goals, it is
acknowledged that other issues (such as relocations or environmental impacts) may
require consideration of LOS operations less than identified in this project goal.
For this study, the 2040 peak period LOS was estimated on US 158 and NC 12 for the
average summer weekend day, the average summer weekday, the average non-summer
weekday, the average non-summer weekend day, and the average annual day. For the
study area, the goal was to test roadway alternatives and non-highway strategies to
maintain LOS D traffic operations during a typical summer weekday.

Mid-Currituck Bridge Study 25 2040 Traffic Alternatives Report
3.2 Generalized Service Volume Table
The development of the level of service table was based upon HCM 6.0 methodology
methods with some modifications to provide consistency with previous analysis. The
previous analysis, conducted in 2008, utilized the 2000 Highway Capacity Manual
(HCM2000). Since that analysis was completed, however, the HCM 6.0 was released in
2016. For the network congestion analysis, Two-Lane Highways (Chapter 15) and
Multilane Highways (Chapter 14) methods were used to identify the peak hour
thresholds at which LOS operations changed a letter grade.
3.2.1 NC 12 – Two Lane
For the development of lookup tables for the NC 12 two-lane analysis, a two-lane section
for NC 12 and a two-lane section for the proposed bridge. Basic roadway characteristics
and traffic flow characteristics on NC 12 were applied.
For NC 12, it was recognized that operations in the southern Dare sections operated
more as an arterial while section north of Duck operated more as a standard two-lane
highway. Therefore, it was assumed that the NC 12 capacity was reduced by 25 percent
in arterial sections representing a G/C ratio of approximately 75 percent on NC 12. In
addition, it was estimated that the addition of a third lane would increase capacity by
approximately 13 percent.
In the preparation of the two-lane lookup tables, a difference was noted in the
determination of LOS between the 2000 and 2010 HCS methodologies. While the LOS F
thresholds were similar, there was a discrepancy noted in the LOS E threshold (i.e. the
point where LOS D volumes become LOS E). In the new methodology, the LOS C
threshold was much lower than utilized in the previous analysis. Specifically, the new
methodology indicated LOS E operations occurred at a V/C ratio of approximately 0.5
instead of 0.7 as in the previous analysis. This was critical to the network congestion
analysis utilizes this ratio in determining the total amount of congestion in the network.
With the lower threshold, higher network congestion levels were indicated in the 2040
analysis as compared with the previous 2035 analysis for both the No-Build and Build
scenarios. This is shown in Table 6 and Table 7.

Mid-Currituck Bridge Study 26 2040 Traffic Alternatives Report
Table 6. Two-Lane Highway LOS Calculation Inputs
HCM 6th Edition Input Two-Lane (NC 12)
Cross-section Two-Lane
Class Class III
Segment Length (mi) 4.0
Lanes in each direction 1
Lane Width (feet) 12
Shoulder Width (feet) 2
Terrain Level
Access-Point Density 16
Free-Flow Speed Method Estimated
Base Free Flow Speed (mph) 52
Trucks and Buses 2%
Recreational Vehicles 5%
Directional Split 60-40
Peak Hour Factor 0.90
Percent No-Passing Zones 100%
Passenger-Car Equivalents for Trucks 1.0
Passenger-Car Equivalents for RVs 1.0
Table 7. Generalized Service Volumes for Two-Lane and Three-Lane Cross-Sections
along NC 12 (Two-Way)
Cross-
Section A | B B | C C | D D | E E | F F | Bad F Methodology
2-Lane 158 434 1,034 1,580 2,550 3,315
Based on HCM 6E
Chapter 15: Two-Lane
Highways; with
assumptions in Table 6
2-Lane
Arterial 119 326 776 1,185 1,913 2,487
25% lower than 2-Lane
based on g/C = 0.75
3-Lane
TWLTL 179 490 1,168 1,785 2,882 3,747 13% higher than 2-Lane
3-Lane
TWLTL
Arterial
134 368 877 1,339 2,162 2,811 13% higher than 2-Lane
Arterial
Mid-Currituck Bridge Study 27 2040 Traffic Alternatives Report
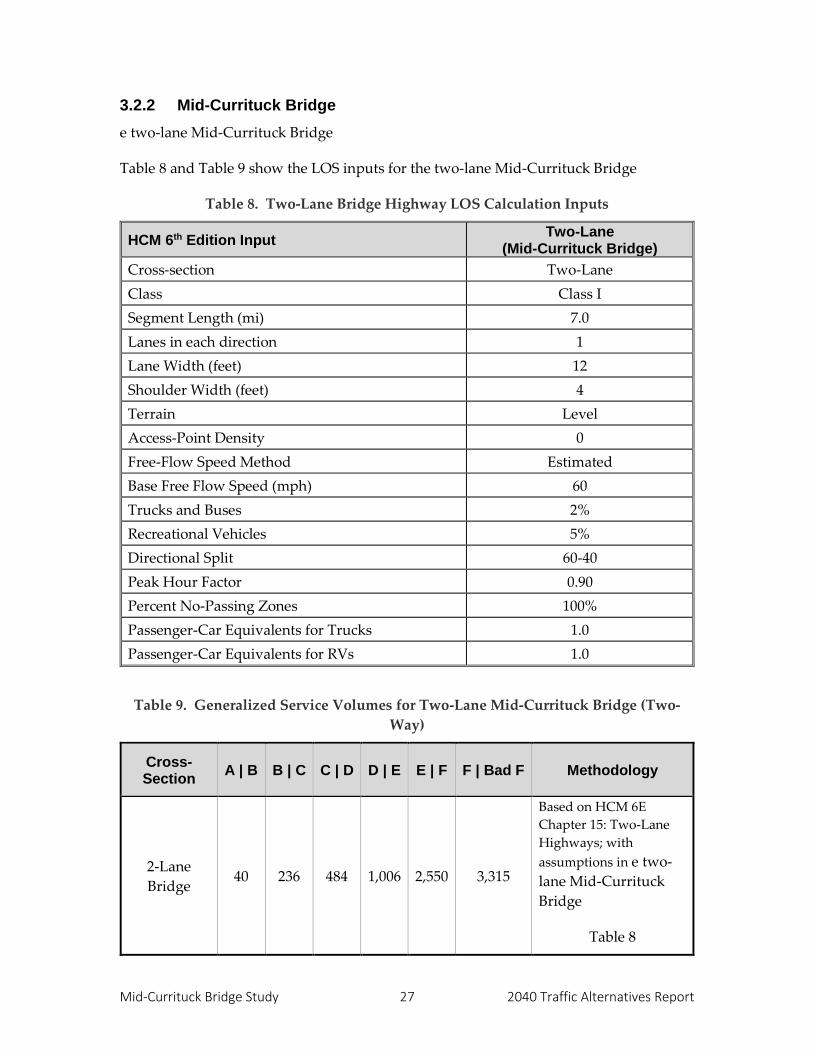
3.2.2 Mid-Currituck Bridge
e two-lane Mid-Currituck Bridge
Table 8 and Table 9 show the LOS inputs for the two-lane Mid-Currituck Bridge
Table 8. Two-Lane Bridge Highway LOS Calculation Inputs
HCM 6th Edition Input Two-Lane
(Mid-Currituck Bridge)
Cross-section Two-Lane
Class Class I
Segment Length (mi) 7.0
Lanes in each direction 1
Lane Width (feet) 12
Shoulder Width (feet) 4
Terrain Level
Access-Point Density 0
Free-Flow Speed Method Estimated
Base Free Flow Speed (mph) 60
Trucks and Buses 2%
Recreational Vehicles 5%
Directional Split 60-40
Peak Hour Factor 0.90
Percent No-Passing Zones 100%
Passenger-Car Equivalents for Trucks 1.0
Passenger-Car Equivalents for RVs 1.0
Table 9. Generalized Service Volumes for Two-Lane Mid-Currituck Bridge (Two-
Way)
Cross-Section
A | B B | C C | D D | E E | F F | Bad F Methodology
2-Lane
Bridge 40 236 484 1,006 2,550 3,315
Based on HCM 6E
Chapter 15: Two-Lane
Highways; with
assumptions in e two-
lane Mid-Currituck
Bridge
Table 8

Mid-Currituck Bridge Study 28 2040 Traffic Alternatives Report
3.2.3 US 158 – Multi-Lane
For the development of lookup tables for the US 158 multi-lane analysis, two basic
sections were analyzed and then factored for alternative treatments. Basic roadway
characteristics and traffic flow characteristics on US 158 were applied. A multi-lane 55
mph posted speed analysis was conducted for US 158 in Currituck County on the
mainland section. For US 158 east of the Wright Memorial Bridge in Dare County,
however, a look-up table was developed reflecting a 45-mph posted speed.
This 45-mph capacity table was then factored to account for arterial operations on this
section. In general, the capacity was reduced by 30 percent to account for arterial flow
assuming a G/C ratio of 0.70 for US 158 for the overall corridor reflecting delays from the
four traffic signals on this section. For the effect of a superstreet section, the capacity
was estimated to be 25 percent greater than a multi-lane arterial. The use of a G/C ratio
and 25 percent factor for a superstreet is consistent with the previous analysis and
appropriate for this planning level review.
Table 10 and Table 11 show the LOS inputs for US 158-multi-lanes.
3.2.4 Capacity LOS Thresholds Lookup Table
The capacity analysis outlined above was utilized to identify the LOS thresholds for each
breakpoint ranging from LOS A to LOS F. In addition, the LOF F capacity (V/C=1.0) was
multiplied to determine very highly congested conditions (V/C=1.3) to be consistent
with previous analysis. In addition, it should be noted that the lookup table for a four-
lane road reflects volumes in the peak direction of flow only while the two-lane
thresholds were based upon volumes in both directions. In the hourly congestion
spreadsheet, the appropriate hourly volume was utilized in the determination of V/C
and LOS grades.
As noted previously, the network congestion review is a planning level review and not
intended to be a detailed capacity/ simulation analysis of network congestion. As such,
the use of this sketch planning methodology (i.e. lookup tables based on HCS

Mid-Currituck Bridge Study 29 2040 Traffic Alternatives Report
Table 10. Multi-Lane Highway Capacity Calculation Inputs
HCM 6th Edition Input Multi-Lane (US 158)
Cross-section Four-Lane
Lanes in each direction 2
Median Type TWLTL
Lane Width (feet) 12
Right Side Clearance (feet) 6
Terrain Level
Access-Point Density 4
Free-Flow Speed Method Estimated
Base Free Flow Speed (mph) 60 / 50
Total Trucks % 2%
Directional Split 60-40
Peak Hour Factor 0.90
Driver Population Balanced Mix
Capacity Adjustment Factor 0.939
Speed Adjustment Factor 0.950

Mid-Currituck Bridge Study 30 2040 Traffic Alternatives Report
Table 11. Generalized Service Volumes for Five-Lane and Six-Lane Cross-Sections
along US 158 (One-Way)
Cross-Section
A | B B | C C | D D | E E | F F | Bad F Methodology
5-Lane 55
MPH 1,092 1,783 2,570 3,153 3,513 4,567
HCM 6E Multi-Lane
Highway; with Base
FFS = 60 mph; and
inputs in Table 10
5-Lane 45
MPH 910 1,484 2,142 2,800 3,204 4,165
HCM 6E Multi-Lane
Highway; with Base
FFS = 50 mph; and
inputs in Table 10
5-Lane
Arterial 637 1,039 1,499 1,960 2,243 2,916
30% Lower than 5-
Lane 45 MPH Multi-
Lane Highway, g/C =
0.70
6-Lane
Arterial 956 1,559 2,249 2,940 3,365 4,375
50% higher than 5-
Lane Arterial
6-Lane
Superstreet 1,195 1,949 2,811 3,675 4,206 5,468
25% higher than 6-
Lane Arterial
Using software HCS 7.2.1.
methodology) is appropriate. In addition, it is consistent with the type of analysis
conducted in the previous network congestion analysis.
Table 9, and Table 11 provide a summary of the lookup tables applied in the network
capacity analysis for a total of 10 section types. Note that not all 10 types were applied,
since some were developed and then factored to account for unique roadway
characteristics (such as a superstreet, fifth lane, or widening). The LOS thresholds in the
table was applied to each of the 16 links in the roadway network for computations of
network delays and summaries.
3.3 LOS and V/C Ratio
Table 12 shows the level of service and volume/capacity ratios for project area roadway
sections.

Mid
-Cu
rrituck B
ridge Stu
dy
31
2
040 Traffic A
lternatives R
epo
rt
Table 12. Level of Service & V/C Ratios for Roadway Sections
Link #
Route Between Alternative Cross-Section
AADT Non-Summer
Weekday
Non-Summer Weekend
Summer Weekday
Summer Weekend
LOS V/C LOS V/C LOS V/C LOS V/C LOS V/C
1 US 158 Barco and Mid-Currituck
Bridge
Existing (2015) 5-Lane 55 MPH A 0.20 A 0.19 A 0.25 A 0.22 C 0.58
No-Build
(2040)
5-Lane 55 MPH A 0.30 A 0.28 B 0.37 B 0.34 D 0.86
ER2 (2040) 5-Lane 55 MPH A 0.30 A 0.28 B 0.37 B 0.34 D 0.86
Build (2040) 5-Lane 55 MPH A 0.30 A 0.28 B 0.37 B 0.34 D 0.86
2 US 158 Mid-Currituck Bridge and
Grandy
Existing (2015) 5-Lane 55 MPH A 0.19 A 0.18 A 0.23 A 0.21 C 0.58
No-Build
(2040)
5-Lane 55 MPH A 0.28 A 0.27 B 0.35 B 0.32 D 0.85
ER2 (2040) 5-Lane 55 MPH A 0.28 A 0.27 B 0.35 B 0.32 D 0.85
Build (2040) 5-Lane 55 MPH A 0.22 A 0.20 A 0.27 A 0.24 C 0.63
3 US 158 Grandy and Powells Point
Existing (2015) 5-Lane 55 MPH A 0.21 A 0.20 A 0.26 A 0.24 C 0.60
No-Build
(2040)
5-Lane 55 MPH B 0.31 A 0.30 B 0.39 B 0.35 D 0.89
ER2 (2040) 5-Lane 55 MPH B 0.31 A 0.30 B 0.39 B 0.35 D 0.89
Build (2040) 5-Lane 55 MPH A 0.23 A 0.22 A 0.29 A 0.26 C 0.65
4 US 158 Powells Point and Point
Harbor
Existing (2015) 5-Lane 55 MPH A 0.24 A 0.23 A 0.30 A 0.27 C 0.63
No-Build
(2040)
5-Lane 55 MPH B 0.35 B 0.33 B 0.43 B 0.39 E 0.93
ER2 (2040) 5-Lane 55 MPH B 0.35 B 0.33 B 0.43 B 0.39 E 0.93
Build (2040) 5-Lane 55 MPH A 0.27 A 0.25 B 0.33 A 0.30 C 0.69
5 US 158 Wright Memorial Bridge
Existing (2015) 5-Lane 55 MPH A 0.24 A 0.23 A 0.30 A 0.27 C 0.63
No-Build
(2040)
5-Lane 55 MPH B 0.35 B 0.33 B 0.43 B 0.39 E 0.93
ER2 (2040) 5-Lane 55 MPH B 0.35 B 0.33 B 0.43 B 0.39 E 0.93
Build (2040) 5-Lane 55 MPH A 0.27 A 0.25 B 0.33 A 0.30 C 0.69
6 US 158 Barlow Lane and Cypress
Knee Trail
Existing (2015) 5-Lane Arterial B 0.44 B 0.42 C 0.54 C 0.49 E 0.96
No-Build
(2040)
5-Lane Arterial C 0.63 C 0.59 D 0.77 D 0.70 F 1.40
ER2 (2040) 6-Lane
Superstreet B 0.34 B 0.32 B 0.41 B 0.37 D 0.75
Build (2040) 5-Lane Arterial C 0.50 C 0.47 C 0.62 C 0.56 F 1.08

Mid
-Cu
rrituck B
ridge Stu
dy
32
2
040 Traffic A
lternatives R
epo
rt
Table 12 (continued). Level of Service & V/C Ratios for Roadway Sections
Link #
Route Between Alternative Cross-Section
AADT Non-Summer
Weekday
Non-Summer Weekend
Summer Weekday
Summer Weekend
LOS V/C LOS V/C LOS V/C LOS V/C LOS V/C
7 US 158 Cypress Knee Trail and
NC 12
Existing (2015) 5-Lane Arterial C 0.53 C 0.50 C 0.66 C 0.60 F 1.08
No-Build
(2040)
5-Lane Arterial D 0.75 D 0.70 E 0.92 D 0.83 F 1.54
ER2 (2040) 6-Lane
Superstreet B 0.40 B 0.38 C 0.49 B 0.44 D 0.82
Build (2040) 5-Lane Arterial C 0.62 C 0.59 D 0.77 D 0.70 F 1.23
8 US 158 NC 12 and Eckner Street
Existing (2015) 5-Lane Arterial C 0.60 C 0.57 D 0.74 D 0.67 E 0.97
No-Build
(2040)
5-Lane Arterial D 0.78 D 0.73 E 0.95 D 0.87 F 1.35
ER2 (2040) 5-Lane Arterial D 0.78 D 0.73 E 0.95 D 0.87 F 1.35
Build (2040) 5-Lane Arterial D 0.78 D 0.73 E 0.95 D 0.87 F 1.35
9A NC 12 US 158 and Dogwood
Trail
Existing (2015) 3-Lane TWLTL
Arterial E 0.71 E 0.64 E 0.73 E 0.74 E 0.96
No-Build
(2040)
3-Lane TWLTL
Arterial F 1.07 E 0.97 F 1.11 F 1.12 F 1.48
ER2 (2040) 3-Lane TWLTL
Arterial F 1.07 E 0.97 F 1.11 F 1.12 F 1.48
Build (2040) 3-Lane TWLTL
Arterial E 0.83 E 0.75 E 0.85 E 0.87 E 0.93
9B NC 12 Dogwood Trail and Sea
Oats Trail / 13th Avenue
Existing (2015) 2-Lane Arterial E 0.72 E 0.66 E 0.75 E 0.76 F 1.06
No-Build
(2040)
2-Lane Arterial F 1.16 F 1.05 F 1.19 F 1.21 F 1.64
ER2 (2040) 3-Lane TWLTL
Arterial F 1.02 E 0.93 F 1.06 F 1.07 F 1.45
Build (2040) 2-Lane Arterial E 0.87 E 0.79 E 0.90 E 0.91 E 0.97
10 NC 12
Sea Oats Trail / 13th
Avenue and Christopher
Drive
Existing (2015) 3-Lane TWLTL
Arterial D 0.57 D 0.52 D 0.59 D 0.60 E 0.86
No-Build
(2040)
3-Lane TWLTL
Arterial E 0.96 E 0.87 E 1.00 F 1.01 F 1.42
ER2 (2040) 3-Lane TWLTL
Arterial E 0.96 E 0.87 E 1.00 F 1.01 F 1.42
Build (2040) 3-Lane TWLTL
Arterial E 0.70 E 0.63 E 0.72 E 0.73 E 0.79

Mid
-Cu
rrituck B
ridge Stu
dy
33
2
040 Traffic A
lternatives R
epo
rt
Table 12 (concluded). Level of Service & V/C Ratios for Roadway Sections
Link #
Route Between Alternative Cross-Section
AADT Non-Summer
Weekday
Non-Summer Weekend
Summer Weekday
Summer Weekend
LOS V/C LOS V/C LOS V/C LOS V/C LOS V/C
11 NC 12 Christopher Drive and
Audubon Drive
Existing (2015) 2-Lane C 0.38 C 0.35 C 0.39 C 0.40 E 0.62
No-Build
(2040)
2-Lane E 0.71 E 0.64 E 0.73 E 0.74 F 1.09
ER2 (2040) 2-Lane E 0.71 E 0.64 E 0.73 E 0.74 F 1.09
Build (2040) 2-Lane D 0.48 D 0.44 D 0.49 D 0.50 D 0.55
14 NC 12
Audubon Drive and
Currituck Clubhouse
Road
Existing (2015) 2-Lane C 0.37 C 0.34 C 0.38 D 0.43 D 0.58
No-Build
(2040)
2-Lane E 0.69 E 0.63 E 0.71 E 0.81 E 0.88
ER2 (2040) 2-Lane E 0.69 E 0.63 E 0.71 E 0.81 E 0.88
Build (2040) 2-Lane D 0.52 D 0.47 D 0.53 D 0.61 D 0.53
12B NC 12 Currituck Clubhouse
Road and Albacore Street
Existing (2015) 3-Lane TWLTL
Arterial D 0.49 D 0.44 D 0.50 D 0.57 E 0.68
No-Build
(2040)
3-Lane TWLTL
Arterial E 0.78 E 0.71 E 0.80 E 0.92 E 0.86
ER2 (2040) 3-Lane TWLTL
Arterial E 0.78 E 0.71 E 0.80 E 0.92 E 0.86
Build (2040) 3-Lane TWLTL
Arterial E 0.67 D 0.61 E 0.69 E 0.79 E 0.78
12A NC 12 Albacore Street and Mid-
Currituck Bridge
Existing (2015) 2-Lane C 0.32 C 0.29 C 0.33 C 0.37 D 0.41
No-Build
(2040)
2-Lane D 0.41 C 0.37 D 0.42 D 0.48 D 0.45
ER2 (2040) 2-Lane D 0.41 C 0.37 D 0.42 D 0.48 D 0.45
Build (2040) 2-Lane D 0.48 D 0.44 D 0.49 D 0.56 D 0.60
13 NC 12 Mid-Currituck Bridge and
north of Shad Street
Existing (2015) 2-Lane C 0.29 C 0.26 C 0.30 C 0.34 C 0.36
No-Build
(2040)
2-Lane C 0.33 C 0.30 C 0.34 C 0.39 C 0.38
ER2 (2040) 2-Lane C 0.33 C 0.30 C 0.34 C 0.39 C 0.38
Build (2040) 2-Lane C 0.33 C 0.30 C 0.34 C 0.39 C 0.38
15 MCB US 158 and NC 12 Build (2040) 2-Lane Bridge D 0.23 D 0.21 D 0.24 D 0.24 E 0.50

Mid-Currituck Bridge Study 34 2040 Traffic Alternatives Report
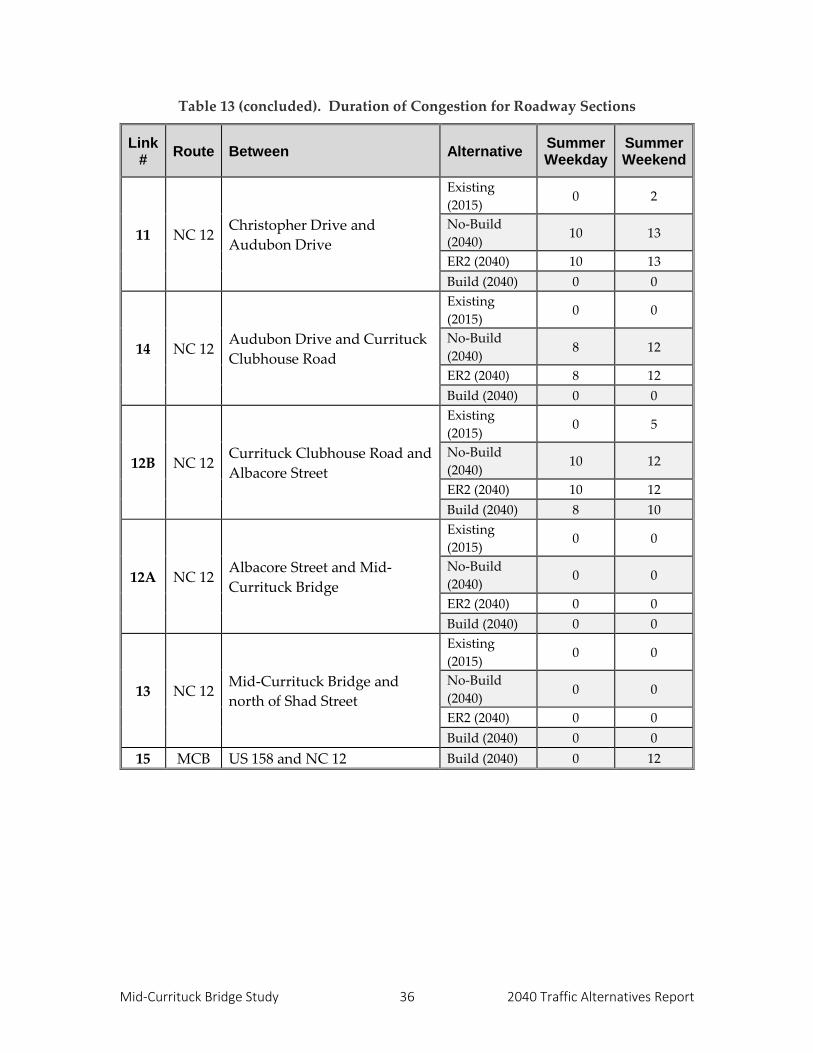
3.4 Duration of Congestion
Duration of congestion is a performance measure defined to assess how peak traffic
congestion spreads out over a day. For the purposes of this study, this measure was
defined to analyze the number of hours that a facility remains at LOS E or worse for the
day. Table 13 shows duration of congestion for summer weekday and summer weekend
for the four alternatives examined.
Table 13. Duration of Congestion for Roadway Sections
Link #
Route Between Alternative Summer Weekday
Summer Weekend
1 US
158
Barco and Mid-Currituck
Bridge
Existing
(2015) 0 0
No-Build
(2040) 0 0
ER2 (2040) 0 0
Build (2040) 0 0
2 US
158
Mid-Currituck Bridge and
Grandy
Existing
(2015) 0 0
No-Build
(2040) 0 0
ER2 (2040) 0 0
Build (2040) 0 0
3 US
158 Grandy and Powells Point
Existing
(2015) 0 0
No-Build
(2040) 0 0
ER2 (2040) 0 0
Build (2040) 0 0
4 US
158
Powells Point and Point
Harbor
Existing
(2015) 0 0
No-Build
(2040) 0 2
ER2 (2040) 0 2
Build (2040) 0 0
5 US
158 Wright Memorial Bridge
Existing
(2015) 0 0
No-Build
(2040) 0 2
ER2 (2040) 0 2
Build (2040) 0 0

Mid-Currituck Bridge Study 35 2040 Traffic Alternatives Report
Table 13 (continued). Duration of Congestion for Roadway Sections
Link #
Route Between Alternative Summer Weekday
Summer Weekend
6 US
158
Barlow Lane and Cypress Knee
Trail
Existing
(2015) 0 6
No-Build
(2040) 0 17
ER2 (2040) 0 0
Build (2040) 0 9
7 US
158 Cypress Knee Trail and NC 12
Existing
(2015) 0 9
No-Build
(2040) 0 19
ER2 (2040) 0 0
Build (2040) 0 13
8 US
158 NC 12 and Eckner Street
Existing
(2015) 0 7
No-Build
(2040) 0 16
ER2 (2040) 0 16
Build (2040) 0 16
9A NC 12 US 158 and Dogwood Trail
Existing
(2015) 10 12
No-Build
(2040) 15 18
ER2 (2040) 15 18
Build (2040) 11 12
9B NC 12 Dogwood Trail and Sea Oats
Trail / 13th Avenue
Existing
(2015) 10 13
No-Build
(2040) 16 21
ER2 (2040) 14 18
Build (2040) 12 12
10 NC 12 Sea Oats Trail / 13th Avenue
and Christopher Drive
Existing
(2015) 0 10
No-Build
(2040) 13 18
ER2 (2040) 13 18
Build (2040) 10 7
Mid-Currituck Bridge Study 36 2040 Traffic Alternatives Report
Table 13 (concluded). Duration of Congestion for Roadway Sections
Link #
Route Between Alternative Summer Weekday
Summer Weekend
11 NC 12 Christopher Drive and
Audubon Drive
Existing
(2015) 0 2
No-Build
(2040) 10 13
ER2 (2040) 10 13
Build (2040) 0 0
14 NC 12 Audubon Drive and Currituck
Clubhouse Road
Existing
(2015) 0 0
No-Build
(2040) 8 12
ER2 (2040) 8 12
Build (2040) 0 0
12B NC 12 Currituck Clubhouse Road and
Albacore Street
Existing
(2015) 0 5
No-Build
(2040) 10 12
ER2 (2040) 10 12
Build (2040) 8 10
12A NC 12 Albacore Street and Mid-
Currituck Bridge
Existing
(2015) 0 0
No-Build
(2040) 0 0
ER2 (2040) 0 0
Build (2040) 0 0
13 NC 12 Mid-Currituck Bridge and
north of Shad Street
Existing
(2015) 0 0
No-Build
(2040) 0 0
ER2 (2040) 0 0
Build (2040) 0 0
15 MCB US 158 and NC 12 Build (2040) 0 12

Mid-Currituck Bridge Study 37 2040 Traffic Alternatives Report
3.5 Roadway Measures by Alternative
3.5.1 Existing Conditions
Figure 8 shows LOS and duration of congestion for summer weekday and summer
weekend for 2015 Existing conditions.
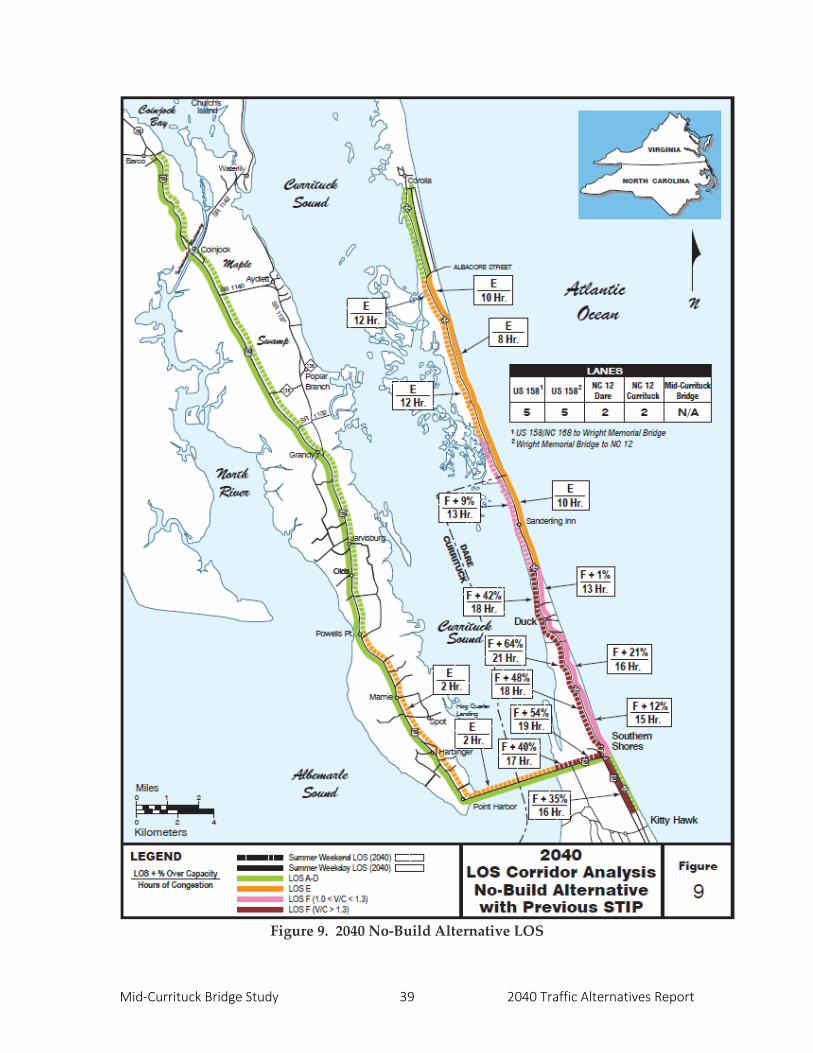
3.5.2 No-Build Alternative
Figure 9 shows LOS and duration of congestion for summer weekday and summer
weekend for 2040 No-Build alternative.
3.5.3 ER2
Figure 10 shows LOS and duration of congestion for summer weekday and summer
weekend for 2040 ER2.
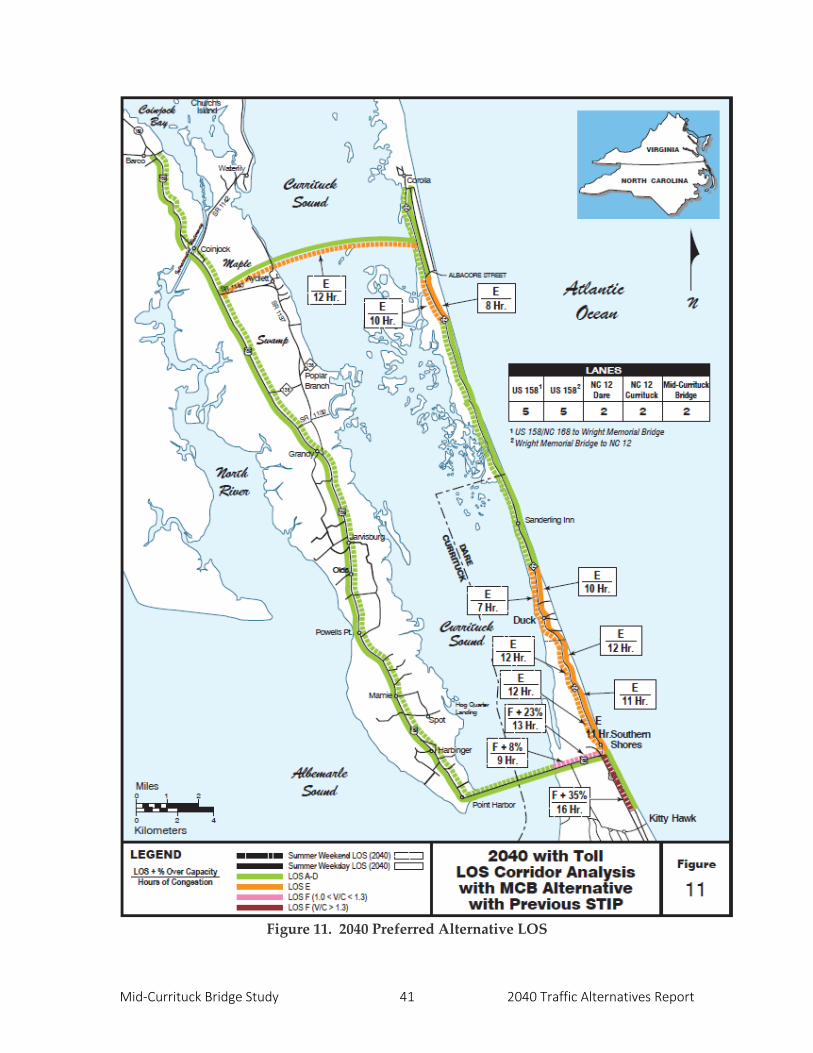
3.5.4 Mid-Currituck Bridge Preferred Alternative
Figure 11 shows LOS and duration of congestion for summer weekday and summer
weekend for 2040 Preferred Alternative.

Mid-Currituck Bridge Study 38 2040 Traffic Alternatives Report
Figure 8. Existing (2015) Conditions LOS
Mid-Currituck Bridge Study 39 2040 Traffic Alternatives Report
Figure 9. 2040 No-Build Alternative LOS

Mid-Currituck Bridge Study 40 2040 Traffic Alternatives Report
Figure 10. 2040 ER2 LOS
Mid-Currituck Bridge Study 41 2040 Traffic Alternatives Report
Figure 11. 2040 Preferred Alternative LOS

Mid-Currituck Bridge Study 42 2040 Traffic Alternatives Report
4.0 Network Congestion Measures
In addition to link level analysis comparing LOS and V/C ratio, network level analysis
was performed comparing congestion measures for the four alternatives examined. The
measures of effectiveness analyzed were miles of congested roadway, congested and total
vehicle miles traveled, and travel time. The network measures are an aggregate of the 16
(+1) links analyzed in section 3.0 and follow similar assumptions.
4.1 Miles of Congested Roadway
In order to examine overall network operations, miles of congested roadway were
computed for each alternative across the study area roadway network. This measure
provides a calculation of the total mileage of roadway operating at LOS E, LOS F or poor
LOS F. LOS F was defined as V/C ratio at or above 1.00 and poor LOS F was defined as
V/C ratio at or above 1.30.
Miles of Congested Roadway are provided in Table 14 for summer weekday, summer
weekend and average summer week for the four alternatives examined. The average
summer week measure is computed as a simple weighted average of five summer
weekdays and two summer weekends.
Table 14. Miles of Congested Roadway
Time Period
Existing (2015)
No-Build (2040)
ER2 (2040)
Preferred (2040)
Miles of Road Operating at LOS E, F, or Poor LOS F
Summer Weekday 4.6 17.9 17.9 7.7
Summer Weekend 17.4 30.3 28.9 17.2
Weighted Average 8.3 21.4 21.0 10.4
Miles of Road Operating at LOS F or Poor LOS F
Summer Weekday 0.0 5.8 5.8 0.0
Summer Weekend 2.8 15.5 14.1 2.5 (1.6)
Weighted Average 0.8 8.6 8.2 0.7 (0.5)
Miles of Road Operating at Poor LOS F
Summer Weekday 0.0 0.0 0.0 0.0
Summer Weekend 0.0 8.3 (5.8) 6.9 (5.8) 1.1 (0.0)
Weighted Average 0.0 2.4 (1.7) 2.0 (1.7) 0.3 (0.0)
Notes: Total network length (excluding Mid-Currituck Bridge) is 51.4 miles.
Note: Italicized numbers reflect the addition of TIP Project R-3419

Mid-Currituck Bridge Study 43 2040 Traffic Alternatives Report
To examine overall network operations, the annual vehicle miles traveled (VMT) were
computed for each alternative across the study area roadway network. Daily VMT was
computed as total number of vehicles traveling on a roadway link multiplied by the
length of the link. Annual VMT was calculated as a weighted average daily VMT for
Non-Summer Weekdays (191), Non-Summer Weekends (76), Summer Weekdays (70)
and Summer Weekends (28). The VMT is shown in units of million vehicle miles (mvm).
Table 15. Total & Congested VMT Percentages by Roadway Section
LOS E, F, poor F Existing (2015)
No-Build (2040)
ER2 (2040)
Preferred (2040)
Total Network
Total VMT (mvm) 330.3 502.1 502.1 416.1
Congested VMT (mvm) 16.4 98.1 (96.8) 94.4 (93.7) 37.0 (35.6)
Percent VMT Congested 5.0% 19.5%
(19.3%)
18.8%
(18.7%) 8.9% (8.6%)
US 158 West of Wright Memorial Bridge
Number of Lanes 5 5 5 5
Total VMT (mvm) 199.0 293.6 293.6 233.7
Congested VMT (mvm) 0.0 3.2 3.2 0.0
Percent VMT Congested 0.0% 1.1% 1.1% 0.0%
US 158 East of Wright Memorial Bridge
Number of Lanes 5 5 (4) 6 5 (4)
Total VMT (mvm) 27.1 36.8 36.8 33.1
Congested VMT (mvm) 1.8 4.3 (3.1) 2.0 (1.3) 3.4 (2.0)
Percent VMT Congested 6.7% 11.8% (8.4%) 5.4%
(3.5%)
10.3%
(6.0%)
NC 12 (Dare & Currituck)
Number of Lanes 2/3 2/3 2/3 2/3
Total VMT (mvm) 104.2 171.7 171.7 128.8
Congested VMT (mvm) 14.6 90.5 89.2 30.8
Percent VMT Congested 14.0% 52.7% 51.9% 23.9%
New Bridge
Number of Lanes 2
Total VMT (mvm) 20.4
Congested VMT (mvm) 2.8
Percent VMT Congested 13.6%
Note: Italicized numbers reflect the addition of TIP Project R-3419

Mid-Currituck Bridge Study 44 2040 Traffic Alternatives Report
Congested VMT for a link is computed as vehicle miles traveled if LOS on the link is E
and is based on volume to capacity (V/C) ratio. Similar to Total VMT, Congested VMT is
also calculated for across the study area network as a weighted average and shown in
units of million vehicle miles. Percent VMT Congested is calculated as a ratio of
Congested VMT to Total VMT. Table 15 provides Total VMT, Congested VMT and
Percent VMT Congested for the entire network and by roadway section.
Table 16 also provides total and congested VMT for three different congestion levels:
• LOS E or worse (LOS E, LOS F and poor LOS F). Defined based on volume to
capacity (V/C) ratio.
• LOS F or worse (LOS F and poor LOS F). Defined as demand to capacity (D/C) ratio
at or above 1.00.
• Poor LOS F. Defined as demand to capacity (D/C) ratio at or above 1.30.
4.2 Travel Time
Travel time is a function of distance, vehicle speed, and traffic signal delays. The
following analysis presents travel time for years 2015 and 2040 for the four alternatives
examined. The travel time analysis was developed for Summer Weekday and Summer
Weekend conditions.
A spreadsheet method with inputs from Synchro analysis was utilized to computes
travel times. Traffic model was developed in Synchro based on NCDOT congestion
management analysis guidelines. Peak hour traffic volumes were computed using
detailed forecasts (intersection level daily forecasts for summer weekday and summer
weekend) and NCDOT’s Intersection Analysis Utility (IAU). The spreadsheet method
computes running time based on length and free-flow speed. It utilizes control delay for
the movement from Synchro model and queue delay for the movement based on V/C
ratio. Travel time was then computed as a sum of running time, control delay and queue
delay.
The travel time was computed for the inbound direction, traveling southbound on US
158 near proposed mid-Currituck bridge through Wright Memorial Bridge to other side
of proposed bridge on NC 12. The inbound direction is the critical direction congestion-
wise as it has higher travel delays. For summer weekday, AM peak is critical in inbound
direction while for summer weekend PM is critical in the inbound direction.

Mid-Currituck Bridge Study 45 2040 Traffic Alternatives Report
Table 16. Total and Congested VMT for Multiple Congestion Level
Vehicle Miles Traveled (VMT) Existing
(2015)
No-Build
(2040)
ER2 (2040)
Preferred (2040)
Total Network
Total 330.3 502.1 502.1 416.1
LOS E, LOS F and Poor F 16.4 (5.0%) 98.1 (19.5%)
96.8 (19.3%)
94.4 (18.8%)
93.7 (18.7%)
37.0 (8.9%)
5.6 (8.6%)
LOS F and Poor F 0.7 (0.2%) 24.1 (4.8%)
23.1 (4.6%)
17.8 (3.6%)
17.3 (3.4%)
2.6 (0.6%)
1.1 (0.3%)
Poor F 0 (0%) 4.1 (0.8%)
2.4 (0.5%)
2.4 (0.5%)
2.1 (0.4%)
0.3 (0.1%)
0.0 (0.0%)
US 158 West of Wright Memorial Bridge
Total 199.0 293.6 293.6 233.7
LOS E, LOS F and Poor F 0 (0%) 3.2 (1.1%) 3.2 (1.1%) 0 (0%)
LOS F and Poor F 0 (0%) 0 (0%) 0 (0%) 0 (0%)
Poor F 0 (0%) 0 (0%) 0 (0%) 0 (0%)
US 158 East of Wright Memorial Bridge
Total 27.1 36.8 36.8 33.1
LOS E, LOS F and Poor F 1.8 (6.7%) 4.3 (11.8%)
3.1 (8.4%)
2.0 (5.4%)
1.3 (3.5%)
3.4 (10.3%)
2.0 (6.0%)
LOS F and Poor F 0.3 (1.2%) 3.6 (9.8%)
2.7 (7.2%)
1.5 (4.1%)
1.0 (2.6%)
2.6 (7.7%)
1.1 (3.3%)
Poor F 0 (0%) 1.6 (4.5%)
0.0 (0.0%)
0.3 (0.9%)
0.0 (0.0%)
0.3 (1.0%)
0.0 (0.0%)
NC 12 (Dare & Currituck)
Total 104.2 171.7 171.7 128.8
LOS E, LOS F and Poor F 14.6 (0.4%) 90.5 (52.7%) 89.2 (51.9%) 30.8 (23.9%)
LOS F and Poor F 0.4 (0.4%) 20.5 (11.9%) 16.3 (9.5%) 0 (0%)
Poor F 0 (0%) 2.4 (1.4%) 2.1 (1.2%) 0 (0%)
New Bridge
Total 20.4
LOS E, LOS F and Poor F 2.8 (13.6%)
LOS F and Poor F 0 (0%)
Poor F 0 (0%)
Note: Italicized numbers reflect the addition of TIP Project R-3419
Mid-Currituck Bridge Study 46 2040 Traffic Alternatives Report
In addition to the total analysis network - from one end of the proposed bridge to the
other - which is approximately 43 miles long, travel time and average speeds are also
shown for four segments:
• US 158 southbound – from proposed the Mid-Currituck Bridge interchange to the
Wright Memorial Bridge
• US 158 southbound – from the Wright Memorial Bridge to NC 12
• NC 12 northbound – from US 158 to Currituck-Dare County line
• NC 12 northbound – from Currituck-Dare county line to the Mid-Currituck Bridge
roundabout
Travel time data was also collected in the field using GPS. Multiple travel time runs
were collected for summer weekdays and summer weekends. An average was
calculated after removing the outliers.
Table 17 shows travel time and average speed for summer weekday AM peak in
inbound direction. Table 18 shows travel time and average speed for summer weekend
PM peak in inbound direction.
The average travel time for summer weekday collected in the field compares well with
the 2015 summer weekday modeled travel time. Existing 2015 summer weekday
conditions experienced little delay and were representative of uncongested travel times.
The similarity of the uncongested travel time with field data serves a validation of the
model. Field travel times for 2015 summer weekend showed high delay and congestion.
Summer weekend travel time from 2015 model are lower than field data as the field data
was skewed because of high travel time from some runs especially on NC 12 in the
Southern Shores and Duck area.

Mid-Currituck Bridge Study 47 2040 Traffic Alternatives Report
Table 17. Travel Time and Speed for Summer Weekday (Inbound only; AM peak)
Summer Weekday Observed (2015)
Existing (2015)
No-Build (2040)
ER2 (2040)
Build (2040)
Inbound Segment Distance
(mi) Travel Time (minutes)
US 158 SB - Aydlett Road to WMB 22.7 23.6 23.6 23.7 23.7 23.7
US 158 SB - WMB to NC 12 1.6 2.9 3.7 9.2 3.4 6.4
NC 12 NB - US 158 to County Line 10.1 19.3 19.3 63.4 55.2 27.2
NC 12 NB - County Line to Albacore Street 7.1 11.0 10.0 19.6 19.6 11.3
Total 41.6 56.8 56.7 115.9 101.9 68.6
Inbound Segment Distance
(mi) Average Travel Speed (mph)
US 158 SB - Aydlett Road to WMB 22.7 57.8 57.7 57.5 57.6 57.5
US 158 SB - WMB to NC 12 1.6 33.0 25.8 10.4 27.9 15.0
NC 12 NB - US 158 to County Line 10.1 31.4 31.4 9.6 11.0 22.3
NC 12 NB - County Line to Albacore Street 7.1 38.8 42.6 21.8 21.8 37.7
Total 41.6 43.9 44.0 21.5 24.5 36.4
Table 18. Travel Time and Speed for Summer Weekend (Inbound only; PM peak)
Summer Weekend Observed
(2015) Existing (2015)
No-Build (2040)
ER2 (2040)
Build (2040)
Inbound Segment Distance
(mi) Travel Time (minutes)
US 158 SB - Aydlett Road to WMB 22.7 49.8 24.0 45.9 45.9 26.4
US 158 SB - WMB to NC 12 1.6 13.7 12.7 30.7 8.3 21.4
NC 12 NB - US 158 to County Line 10.1 65.9 31.4 83.6 74.7 23.2
NC 12 NB - County Line to Albacore Street 7.1 11.1 10.5 26.4 26.4 10.9
Total 41.6 140.5 78.6 186.7 155.3 81.9
Inbound Segment Distance
(mi) Average Travel Speed (mph)
US 158 SB - Aydlett Road to WMB 22.7 27.4 56.9 29.7 29.7 51.7
US 158 SB - WMB to NC 12 1.6 7.0 7.5 3.1 11.6 4.5
NC 12 NB - US 158 to County Line 10.1 9.2 19.3 7.3 8.1 26.2
NC 12 NB - County Line to Albacore Street 7.1 38.5 40.5 16.1 16.1 38.9
Total 41.6 17.7 31.7 13.4 16.1 30.4

R-2576 Mid-Currituck Bridge Study 48 2040 Traffic Alternatives Report
5.0 Conclusions
The purpose of this report is to provide traffic measures of effectiveness to facilitate
comparison of alternatives for the FEIS re-evaluation. The alternatives being compared
include 2015 Existing, 2040 No-Build, 2040 ER2 and 2040 Preferred Alternative. A
similar analysis was done for the original FEIS which evaluated alternatives for 2035
conditions.
5.1 Traffic Forecasts
This analysis utilizes the updated Traffic Forecasts completed on June 2016. The
updated traffic forecasts have 2040 as the horizon year instead of 2035 as the horizon
year as in previous (2009) forecasts and original FEIS. In general, the revised 2040
forecasts are lower than the previous 2035 forecasts, reflecting a slowdown in the
growth rate since the development of previous forecast.
Details about traffic forecast are provided in Chapter 2.0.
5.2 Capacity and Level of Service
Detailed analysis with link level volume to capacity (v/c) ratio and level of service (LOS)
is provided in Chapter 4.0. A summary of findings is provided below.
5.2.1 US 158 West of Wright Memorial Bridge
Links 1, 2, 3 and 4 represent US 158 west of the Wright Memorial Bridge and link 5
represents the Wright Memorial Bridge.
For 2040 Summer Weekday conditions, all alternatives are projected to operate at LOS C
or better for links 1 through 5.
For 2040 Summer Weekend conditions, all alternatives are projected to operate at LOS D
or better for links 1 through 3. On links 4 and 5, 2040 No-Build and 2040 ER2
alternatives would operate at LOS E while 2040 Preferred Alternative would operate at
LOS C due to diverted traffic to the Mid-Currituck Bridge.
5.2.2 US 158 east of Wright Memorial Bridge
Links 6 and 7 represent US 158 between the Wright Memorial Bridge and NC 12, and
link 8 represents US 158 south/ east of NC 12.
For 2040 Summer Weekday conditions, all alternatives are projected to operate at LOS D
or better.

R-2576 Mid-Currituck Bridge Study 49 2040 Traffic Alternatives Report
For 2040 Summer Weekend conditions, the No-Build Alternative is expected to
experience LOS F with sever level of congestion. With ER2, links 6 and 7 get additional
capacity and operate at LOS D. With the Preferred alternative, links 6 and 7 operate at
LOS F.
5.2.3 NC 12 in Dare County
Links 9A, 9B, 10 and 11 represent NC 12 in Dare County.
For 2040 Summer Weekday conditions, No-Build and ER2 alternatives show LOS E and
F with some moderate level of congestion. With the Preferred Alternative, the LOS is D
and E.
For 2040 Summer Weekend conditions, No-Build and ER2 alternatives show LOS F and
high v/c with severe level of congestion. ER2 slightly improves capacity with the third
center lane (part of the section) but still shows high level of congestion. With the
Preferred Alternative, the projected LOS is E due to reduced traffic which gets diverted
through the Mid-Currituck Bridge.
5.2.4 NC 12 in Currituck County
Links 14, 12B, 12A and 13 represent NC 12 in Currituck County.
For both 2040 Summer Weekday and Summer Weekend conditions this section is
projected to operate similar in all the three alternatives with LOS D and E.
5.3 Network Measures of Effectiveness
Congestion is defined here as LOS E or worse.
For 2040 Summer Weekday, No-Build and ER2 alternatives are expected to have 17.9
miles of roadway with congested conditions while the Build alternative is expected to
have 7.7 miles of congested roadway. For 2040 Summer Weekend, No-Build, ER2 and
the Preferred Alternative are expected to have 30.3, 28.9 and 17.2 miles of congested
roadway respectively.
5.4 Travel Time
Travel times were developed for each segment in the study area. The 2040 No-Build
Alternative analysis shows a major increase in travel time from the 2015 existing
analysis. The area where travel time increases the most is along NC 12 from US 158 to
the Dare/Currituck County line. During the peak weekday for the 2040 No-Build
Alternative, the total travel time from the west terminus of the proposed bridge at
US 158 to the east terminus of the bridge at NC 12, along existing routes, is 116 minutes.
With ER2, that drops to 102 minutes. With the Preferred Alternative, that drops even
more to 69 minutes. During the weekend peak, the travel times increase. For the 2040

R-2576 Mid-Currituck Bridge Study 50 2040 Traffic Alternatives Report
No-Build Alternative, the travel time is 187 minutes. ER2 travel time is 155 minutes,
while the Preferred Alternative is 82 minutes. The travel time analyses shows a major
decrease in travel time with the Mid-Currituck Bridge in place along the exiting
corridors.