Embed Size (px)
Citation preview

Microwave Tube Fault-Current Model forDesign of Crowbar ProtectionSubhash Joshi T.G.
Power Electronics GroupCentre for Development of Advanced Computing
Thiruvananthapuram, IndiaEmail:[email protected]
Vinod JohnDepartment of Electrical Engineering
Indian Institute of ScienceBangalore, India
Email:[email protected]
Abstract—Many applications that use high energy plasma arerealized using Microwave tubes (MWT) that operate at peakpower in the range of hundreds of MW and frequency in GHz.One failure mode of the MWT is due to the excess energy in thetube during internal arcing events. Crowbar is used to protectthe MWT by diverting the energy during fault. To compute theenergy released into the MWT, the dc fault current model andthe MWT model are essential. The paper utilizes a model for theMWT for crowbar applications as an equivalent fuse wire. Thepaper proposes a model for the dc fault current, the analysis forwhich is based on joules integral energy concept. The model givesflexibility to choose a range of practically observed reactance toresistance ratio (X/R) of transformer and also allows the useof a range of dc current limiting resistances that are utilizedin the High Voltage (HV) power supply circuits in Microwaveapplications. The non-linearity of the system due to the multipulsediode rectifier is also considered by introducing a correctionfactor in the model. Both dc fault current and MWT models areverified experimentally. Using the model a 10kV , 1kA crowbaris built to limit the energy in MWT below 10J .
Index Terms—microwave tube, crowbar, joules integral
I. INTRODUCTION
Plasma state of matter is widely used in many areas suchas biomedical, material processing, electronic, textile, spaceand defence [1]–[7]. The MWT manufacturers specifies a limiton energy that can be released into the tube during internalarc fault. For many tubes this limit is of the order of 10J .During fault if the energy accumulated inside the tube exceedsthe specified value then the MWT becomes irreparable [8].Conventional HV power supply feeding power to MWTs will
(a) (b)
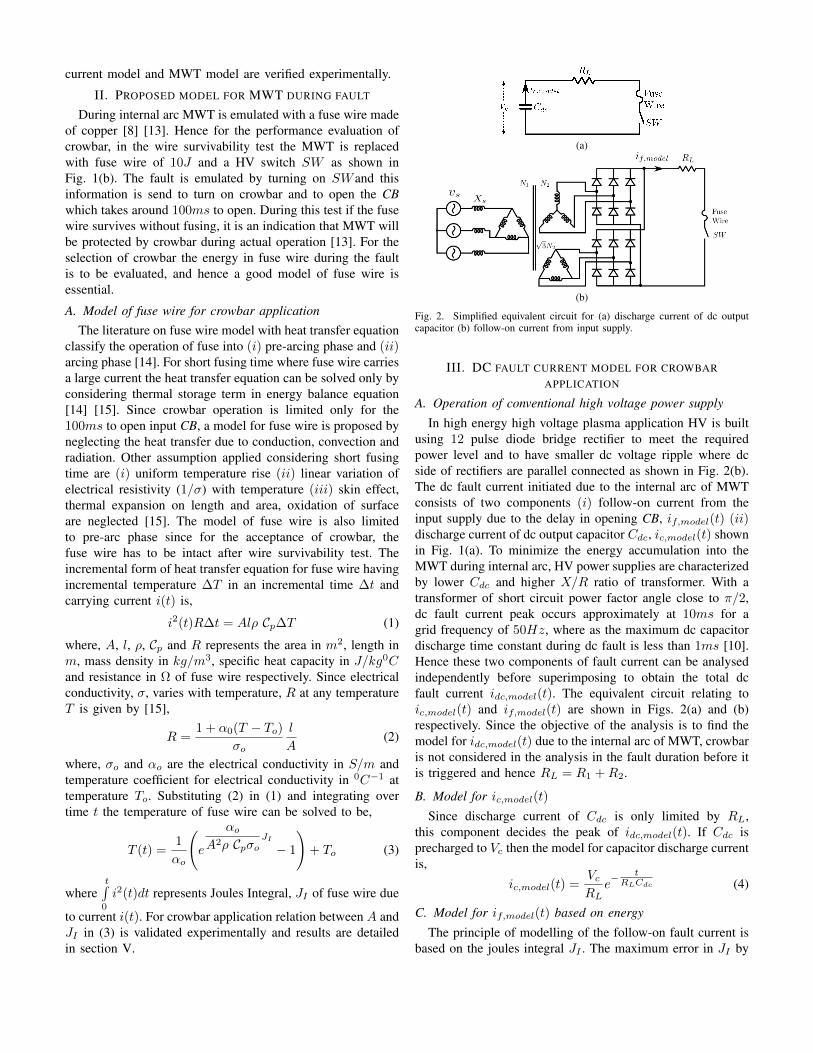
Fig. 1. Circuit network used for crowbar analysis (a) HV power supply withMWT and crowbar (b) MWT is replaced with fuse wire for wire survivabilitytest.
have stored energy comparable to the energy limit of MWTs.Along with this, the slow operation of the circuit breaker(CB) in isolating the power supply from the grid also resultsin accumulation of additional energy into the tube, resultingin fault energy being above the specified limit. Hence fastacting protection is essential to keep the fault energy belowthe specified limit. This is achieved by turning on the crowbarconnected in shunt with MWT providing an alternative pathfor the flow of energy as shown in Fig. 1(a) [9]. The energyreleased into the MWT is decided by the speed of operation ofcrowbar. The energy in MWT can be estimated if the modelof dc fault current as well as the model of MWT are known.Such models are useful for the selection of speed of operationof crowbar. The model of fault current also help in the designof various other components of crowbar such as selection ofthyristor, its gate driver and design of the inductor.
Model for a rectifier are extensively discussed in literature.In [10] dc fault current is estimated by assuming zero faultimpedance and the model is described using multiple equa-tions, each relevant for a specific intervals. In [11] an averagedmodel is given for the rectifier where the transients in the dcfault current are neglected. Model in [12] can only be solvednumerically due to its complexity. Due to the assumptionof zero fault impedance most of the modelling methods arenot suitable for crowbar applications, since during fault inthe MWT the fault impedance is not zero, but is equal to(R1 +R2) as shown in Fig. 1(a). Also, the value of R1 and R2
varies widely depending on the type of MWT and the ratingof crowbar. Reference [8] gives a physical emulation of MWTduring fault conditions without detailing the mathematicalmodel.
In this paper a dc fault current model based on thejoules integral energy concept is proposed. Since the primaryobjective is to limit the energy accumulated in the MWT,the model based on energy concept is shown to lead to amore accurate and simple solution for the fault current anddissipated energy. The proposed model allows one to choose arange of practically observed X/R ratios for the transformer.It also gives flexibility to choose various values of currentlimiting resistances R1 and R2 that are used with MWTs.The non-linearity of the rectifier system is also included byintroducing a correction factor in the model. The dc fault978-1-4673-8888-7/16/$31.00 c©2016 IEEE
current model and MWT model are verified experimentally.
II. PROPOSED MODEL FOR MWT DURING FAULT
During internal arc MWT is emulated with a fuse wire madeof copper [8] [13]. Hence for the performance evaluation ofcrowbar, in the wire survivability test the MWT is replacedwith fuse wire of 10J and a HV switch SW as shown inFig. 1(b). The fault is emulated by turning on SW and thisinformation is send to turn on crowbar and to open the CBwhich takes around 100ms to open. During this test if the fusewire survives without fusing, it is an indication that MWT willbe protected by crowbar during actual operation [13]. For theselection of crowbar the energy in fuse wire during the faultis to be evaluated, and hence a good model of fuse wire isessential.
A. Model of fuse wire for crowbar applicationThe literature on fuse wire model with heat transfer equation
classify the operation of fuse into (i) pre-arcing phase and (ii)arcing phase [14]. For short fusing time where fuse wire carriesa large current the heat transfer equation can be solved only byconsidering thermal storage term in energy balance equation[14] [15]. Since crowbar operation is limited only for the100ms to open input CB, a model for fuse wire is proposed byneglecting the heat transfer due to conduction, convection andradiation. Other assumption applied considering short fusingtime are (i) uniform temperature rise (ii) linear variation ofelectrical resistivity (1/σ) with temperature (iii) skin effect,thermal expansion on length and area, oxidation of surfaceare neglected [15]. The model of fuse wire is also limitedto pre-arc phase since for the acceptance of crowbar, thefuse wire has to be intact after wire survivability test. Theincremental form of heat transfer equation for fuse wire havingincremental temperature ∆T in an incremental time ∆t andcarrying current i(t) is,
i2(t)R∆t = Alρ Cp∆T (1)
where, A, l, ρ, Cp and R represents the area in m2, length inm, mass density in kg/m3, specific heat capacity in J/kg0Cand resistance in Ω of fuse wire respectively. Since electricalconductivity, σ, varies with temperature, R at any temperatureT is given by [15],
R =1 + α0(T − To)
σo
l
A(2)
where, σo and αo are the electrical conductivity in S/m andtemperature coefficient for electrical conductivity in 0C−1 attemperature To. Substituting (2) in (1) and integrating overtime t the temperature of fuse wire can be solved to be,
T (t) =1
αo
(e
αoA2ρ Cpσo
JI
− 1
)+ To (3)
wheret∫
0
i2(t)dt represents Joules Integral, JI of fuse wire due
to current i(t). For crowbar application relation between A andJI in (3) is validated experimentally and results are detailedin section V.
(a)
(b)
Fig. 2. Simplified equivalent circuit for (a) discharge current of dc outputcapacitor (b) follow-on current from input supply.
III. DC FAULT CURRENT MODEL FOR CROWBARAPPLICATION
A. Operation of conventional high voltage power supply
In high energy high voltage plasma application HV is builtusing 12 pulse diode bridge rectifier to meet the requiredpower level and to have smaller dc voltage ripple where dcside of rectifiers are parallel connected as shown in Fig. 2(b).The dc fault current initiated due to the internal arc of MWTconsists of two components (i) follow-on current from theinput supply due to the delay in opening CB, if,model(t) (ii)discharge current of dc output capacitor Cdc, ic,model(t) shownin Fig. 1(a). To minimize the energy accumulation into theMWT during internal arc, HV power supplies are characterizedby lower Cdc and higher X/R ratio of transformer. With atransformer of short circuit power factor angle close to π/2,dc fault current peak occurs approximately at 10ms for agrid frequency of 50Hz, where as the maximum dc capacitordischarge time constant during dc fault is less than 1ms [10].Hence these two components of fault current can be analysedindependently before superimposing to obtain the total dcfault current idc,model(t). The equivalent circuit relating toic,model(t) and if,model(t) are shown in Figs. 2(a) and (b)respectively. Since the objective of the analysis is to find themodel for idc,model(t) due to the internal arc of MWT, crowbaris not considered in the analysis in the fault duration before itis triggered and hence RL = R1 +R2.
B. Model for ic,model(t)
Since discharge current of Cdc is only limited by RL,this component decides the peak of idc,model(t). If Cdc isprecharged to Vc then the model for capacitor discharge currentis,
ic,model(t) =VcRL
e− tRLCdc (4)
C. Model for if,model(t) based on energy
The principle of modelling of the follow-on fault current isbased on the joules integral JI . The maximum error in JI by

the proposed model and simulated fault current if,sim(t) isexpected to be within 5% for engineering accuracy. The errorin JI is defined as,
∆JI% =
t∫0
i2f,sim(t)dt−t∫
0
i2f,model(t)dt
t∫0
i2f,sim(t)dt
100 (5)
The transformer considered for the HV power supply is hav-ing dual secondary where winding configuration is ∆/Y/∆with turns ratio of N1 : N2 and
√3N1 : N2 between
primary and delta secondary as well as primary and starsecondary respectively as shown in Fig. 2(b). The windingresistance and leakage reactance of star and delta secondaryreferred to primary are assumed to equal and are given by Rspand Xl,sp respectively where as Rp∆, Xl,p∆ are the windingresistance and leakage reactance of primary respectively. Theinput source impedance Xs referred as part of primary leakagereactance can be found by using reactive power equality. Thenthe equivalent resistance and reactance referred to primary fora secondary paralleled transformer by incorporating Xs is,
R′
p = Rp∆ +Rsp2
and X′
lp = Xl,p∆ +Xl,sp
2+ 3Xs (6)
For a zero fault impedance at dc (RL = 0) and primary lineto line r.m.s. voltage of E, the steady state dc fault currentwhich also chosen as the base value for current is,
If,base =
√2E√
R′2p +X
′2lp
√3N1
N2k12 (7)
where, k12 is equal to 0.9886 represents the ratio of averageto peak value for 12 pulse waveform [10].
If X Rtrx is the ratio of equivalent reactance X′
lp toequivalent resistance R
′
p, which includes transformer and inputsource impedance, then from simulation Fig. 3(a) gives thenormalized follow-on dc fault current ifN,sim(t) for RL = 0and X Rtrx = 10. For maximum fault current peak the faultinitiation time is selected based on the power factor angle ofthe transformer [10]. ifN,sim(t) given in Fig. 3(a) resemblesto the unit step response of a second order system and hencethe normalized model for if,model(t) is chosen as,
ifN,model(t) = 1− e−δt(
cosωdt+δ
ωdsinωdt
)(8)
where, ωd and δ are the damped frequency of the oscillationand reciprocal of time constant for exponential decay respec-tively. If tp and Mp are the time to reach its first peak andmaximum overshoot respectively, they can be expressed interms of ωd and δ as,
tp =π
ωdand Mp = e
− πδωd (9)
The parameters ωd and δ are chosen such that ∆JI%computed with the model in (8) and the follow-on currentfrom simulation has maximum error less than ±5%. Fig. 3(a)compares ifN,model(t) and ifN,sim(t) for ωd = 334 rad/s
(a)
ifN,sim(t)
ifN,model(t)
(b)
JI by simulation
←JI by model
2
4
6
8
10
ΔJ I%(%)
-2
0
2
tp (ms)
X_Rtrx=15X_Rtrx=12.5X_Rtrx=10X_Rtrx=7.5X_Rtrx=5X_Rtrx=2.5
(c)
Fig. 3. (a) ∆JI% with equivalent power dissipation (b) correction factor kcfor different X Rsystem plotted for various X Rtrx (c) ∆JI% for differentX Rsystem plotted for various X Rtrx after including kc factor.
and δ = 14.8 s−1. Fig. 3(b) shows that JI due to the empiricalmodel in (8) as well as the time domain simulated follow-ondc fault current are within 5% error. The follow-on dc faultcurrent from its normalized model in (8) is given by,
if,model(t) = If,base ifN,model(t) (10)
In practice the dc side fault impedance are not zero due toresistances R1 and R2 and the X/R ratio of transformer variesbased on the power rating of the application. The influenceof X/R ratio of transformer and RL on JI are analysed inSection IV.
IV. PRACTICAL CONSIDERATION
A. Effect of transformer X Rtrx on if,model(t)
Depends on the energy level of plasma required for theapplication, MWT of different ratings are used which decidesthe rating of HV power supply and the transformer ratingthat are used to built these HV power supplies. Hence inpractice different X/R ratio of transformer are found. Theparameters ωd and δ have dimensions of frequency and in thisanalysis they are influenced by X
′
lp/R′
p for a given operationalfrequency ω. The transients that appear in the if,sim(t) in Fig.3(a) are due the transients in the transformer input current and
-25
-20
-15
-10
-5
0
5
10ΔJ I%(%)
X_Rsystem
X_Rtrx=15X_Rtrx=12.5X_Rtrx=10X_Rtrx=7.5X_Rtrx=5X_Rtrx=2.5
(a)
0.8
1
1.2
1.4
1.6
1.8
0.1 1 10
corr
ectio
n fa
ctor
, kc
X_Rsystem
X_Rtrx=15X_Rtrx=12.5X_Rtrx=10X_Rtrx=7.5X_Rtrx=5X_Rtrx=2.5
(b)
ΔJ I%(%)
X_Rtrx=15X Rtrx=12 5
X_Rsystem
X_Rtrx=12.5X_Rtrx=10X_Rtrx=7.5X_Rtrx=5X_Rtrx=2.5
(c)
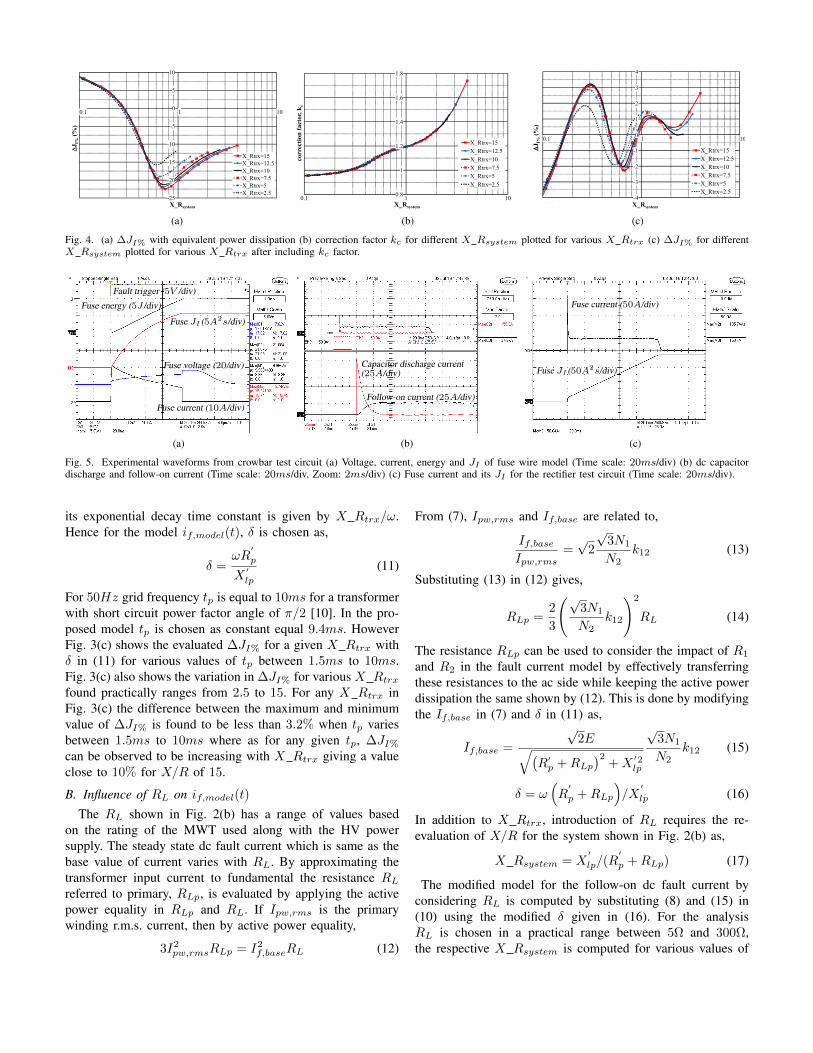
Fig. 4. (a) ∆JI% with equivalent power dissipation (b) correction factor kc for different X Rsystem plotted for various X Rtrx (c) ∆JI% for differentX Rsystem plotted for various X Rtrx after including kc factor.
(a)
Fault trigger (5V /div)
Fuse energy (5J /div)
Fuse JI (5A2s/div)
Fuse voltage (20/div)
Fuse current (10A/div)
(b)
Capacitor discharge current(25A/div)
Follow-on current (25A/div)
(c)
Fuse current (50A/div)
Fuse JI (50A2s/div)
Fig. 5. Experimental waveforms from crowbar test circuit (a) Voltage, current, energy and JI of fuse wire model (Time scale: 20ms/div) (b) dc capacitordischarge and follow-on current (Time scale: 20ms/div, Zoom: 2ms/div) (c) Fuse current and its JI for the rectifier test circuit (Time scale: 20ms/div).
its exponential decay time constant is given by X Rtrx/ω.Hence for the model if,model(t), δ is chosen as,
δ =ωR
′
p
X′lp
(11)
For 50Hz grid frequency tp is equal to 10ms for a transformerwith short circuit power factor angle of π/2 [10]. In the pro-posed model tp is chosen as constant equal 9.4ms. HoweverFig. 3(c) shows the evaluated ∆JI% for a given X Rtrx withδ in (11) for various values of tp between 1.5ms to 10ms.Fig. 3(c) also shows the variation in ∆JI% for various X Rtrxfound practically ranges from 2.5 to 15. For any X Rtrx inFig. 3(c) the difference between the maximum and minimumvalue of ∆JI% is found to be less than 3.2% when tp variesbetween 1.5ms to 10ms where as for any given tp, ∆JI%can be observed to be increasing with X Rtrx giving a valueclose to 10% for X/R of 15.
B. Influence of RL on if,model(t)The RL shown in Fig. 2(b) has a range of values based
on the rating of the MWT used along with the HV powersupply. The steady state dc fault current which is same as thebase value of current varies with RL. By approximating thetransformer input current to fundamental the resistance RLreferred to primary, RLp, is evaluated by applying the activepower equality in RLp and RL. If Ipw,rms is the primarywinding r.m.s. current, then by active power equality,
3I2pw,rmsRLp = I2
f,baseRL (12)
From (7), Ipw,rms and If,base are related to,
If,baseIpw,rms
=√
2
√3N1
N2k12 (13)
Substituting (13) in (12) gives,
RLp =2
3
(√3N1
N2k12
)2
RL (14)
The resistance RLp can be used to consider the impact of R1
and R2 in the fault current model by effectively transferringthese resistances to the ac side while keeping the active powerdissipation the same shown by (12). This is done by modifyingthe If,base in (7) and δ in (11) as,
If,base =
√2E√(
R′p +RLp
)2+X
′2lp
√3N1
N2k12 (15)
δ = ω(R
′
p +RLp
)/X
′
lp (16)
In addition to X Rtrx, introduction of RL requires the re-evaluation of X/R for the system shown in Fig. 2(b) as,
X Rsystem = X′
lp/(R′
p +RLp) (17)
The modified model for the follow-on dc fault current byconsidering RL is computed by substituting (8) and (15) in(10) using the modified δ given in (16). For the analysisRL is chosen in a practical range between 5Ω and 300Ω,the respective X Rsystem is computed for various values of
(a)
(b)
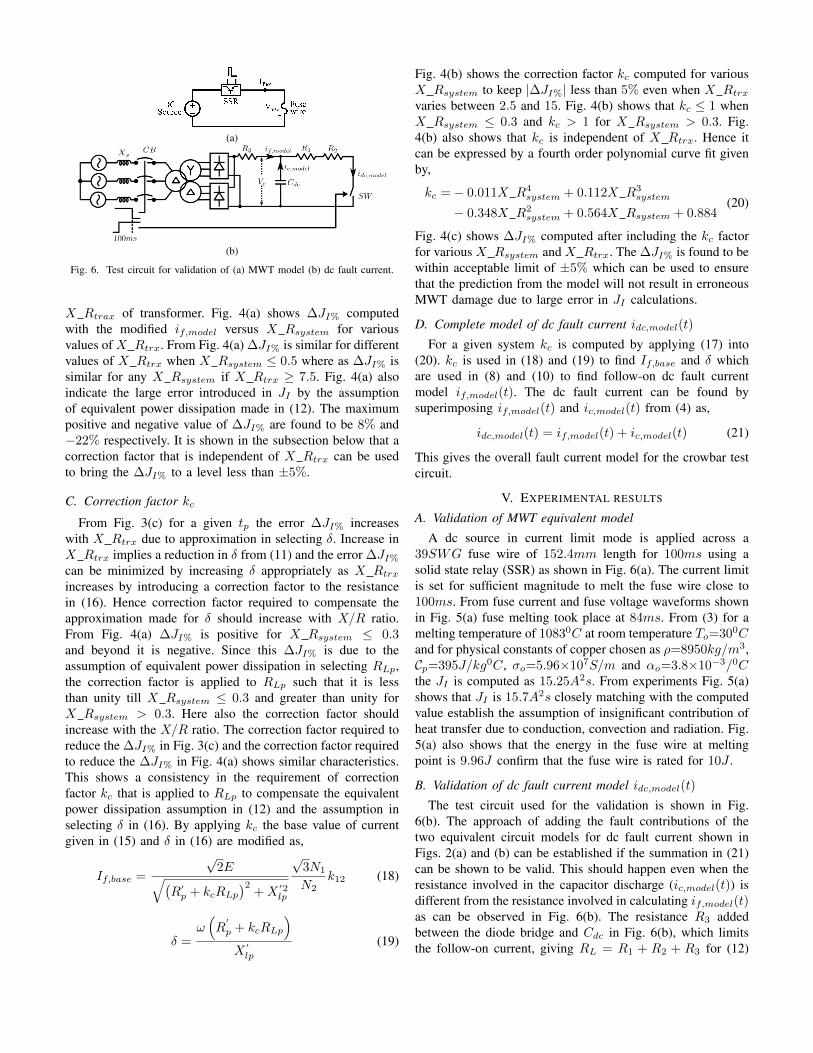
Fig. 6. Test circuit for validation of (a) MWT model (b) dc fault current.
X Rtrax of transformer. Fig. 4(a) shows ∆JI% computedwith the modified if,model versus X Rsystem for variousvalues of X Rtrx. From Fig. 4(a) ∆JI% is similar for differentvalues of X Rtrx when X Rsystem ≤ 0.5 where as ∆JI% issimilar for any X Rsystem if X Rtrx ≥ 7.5. Fig. 4(a) alsoindicate the large error introduced in JI by the assumptionof equivalent power dissipation made in (12). The maximumpositive and negative value of ∆JI% are found to be 8% and−22% respectively. It is shown in the subsection below that acorrection factor that is independent of X Rtrx can be usedto bring the ∆JI% to a level less than ±5%.
C. Correction factor kc
From Fig. 3(c) for a given tp the error ∆JI% increaseswith X Rtrx due to approximation in selecting δ. Increase inX Rtrx implies a reduction in δ from (11) and the error ∆JI%can be minimized by increasing δ appropriately as X Rtrxincreases by introducing a correction factor to the resistancein (16). Hence correction factor required to compensate theapproximation made for δ should increase with X/R ratio.From Fig. 4(a) ∆JI% is positive for X Rsystem ≤ 0.3and beyond it is negative. Since this ∆JI% is due to theassumption of equivalent power dissipation in selecting RLp,the correction factor is applied to RLp such that it is lessthan unity till X Rsystem ≤ 0.3 and greater than unity forX Rsystem > 0.3. Here also the correction factor shouldincrease with the X/R ratio. The correction factor required toreduce the ∆JI% in Fig. 3(c) and the correction factor requiredto reduce the ∆JI% in Fig. 4(a) shows similar characteristics.This shows a consistency in the requirement of correctionfactor kc that is applied to RLp to compensate the equivalentpower dissipation assumption in (12) and the assumption inselecting δ in (16). By applying kc the base value of currentgiven in (15) and δ in (16) are modified as,
If,base =
√2E√(
R′p + kcRLp
)2+X
′2lp
√3N1
N2k12 (18)
δ =ω(R
′
p + kcRLp
)X
′lp
(19)
Fig. 4(b) shows the correction factor kc computed for variousX Rsystem to keep |∆JI%| less than 5% even when X Rtrxvaries between 2.5 and 15. Fig. 4(b) shows that kc ≤ 1 whenX Rsystem ≤ 0.3 and kc > 1 for X Rsystem > 0.3. Fig.4(b) also shows that kc is independent of X Rtrx. Hence itcan be expressed by a fourth order polynomial curve fit givenby,
kc =− 0.011X R4system + 0.112X R3
system
− 0.348X R2system + 0.564X Rsystem + 0.884
(20)
Fig. 4(c) shows ∆JI% computed after including the kc factorfor various X Rsystem and X Rtrx. The ∆JI% is found to bewithin acceptable limit of ±5% which can be used to ensurethat the prediction from the model will not result in erroneousMWT damage due to large error in JI calculations.
D. Complete model of dc fault current idc,model(t)
For a given system kc is computed by applying (17) into(20). kc is used in (18) and (19) to find If,base and δ whichare used in (8) and (10) to find follow-on dc fault currentmodel if,model(t). The dc fault current can be found bysuperimposing if,model(t) and ic,model(t) from (4) as,
idc,model(t) = if,model(t) + ic,model(t) (21)
This gives the overall fault current model for the crowbar testcircuit.
V. EXPERIMENTAL RESULTS
A. Validation of MWT equivalent model
A dc source in current limit mode is applied across a39SWG fuse wire of 152.4mm length for 100ms using asolid state relay (SSR) as shown in Fig. 6(a). The current limitis set for sufficient magnitude to melt the fuse wire close to100ms. From fuse current and fuse voltage waveforms shownin Fig. 5(a) fuse melting took place at 84ms. From (3) for amelting temperature of 10830C at room temperature To=300Cand for physical constants of copper chosen as ρ=8950kg/m3,Cp=395J/kg0C, σo=5.96×10⁷S/m and αo=3.8×10⁻³/0Cthe JI is computed as 15.25A2s. From experiments Fig. 5(a)shows that JI is 15.7A2s closely matching with the computedvalue establish the assumption of insignificant contribution ofheat transfer due to conduction, convection and radiation. Fig.5(a) also shows that the energy in the fuse wire at meltingpoint is 9.96J confirm that the fuse wire is rated for 10J .
B. Validation of dc fault current model idc,model(t)
The test circuit used for the validation is shown in Fig.6(b). The approach of adding the fault contributions of thetwo equivalent circuit models for dc fault current shown inFigs. 2(a) and (b) can be established if the summation in (21)can be shown to be valid. This should happen even when theresistance involved in the capacitor discharge (ic,model(t)) isdifferent from the resistance involved in calculating if,model(t)as can be observed in Fig. 6(b). The resistance R3 addedbetween the diode bridge and Cdc in Fig. 6(b), which limitsthe follow-on current, giving RL = R1 + R2 + R3 for (12)
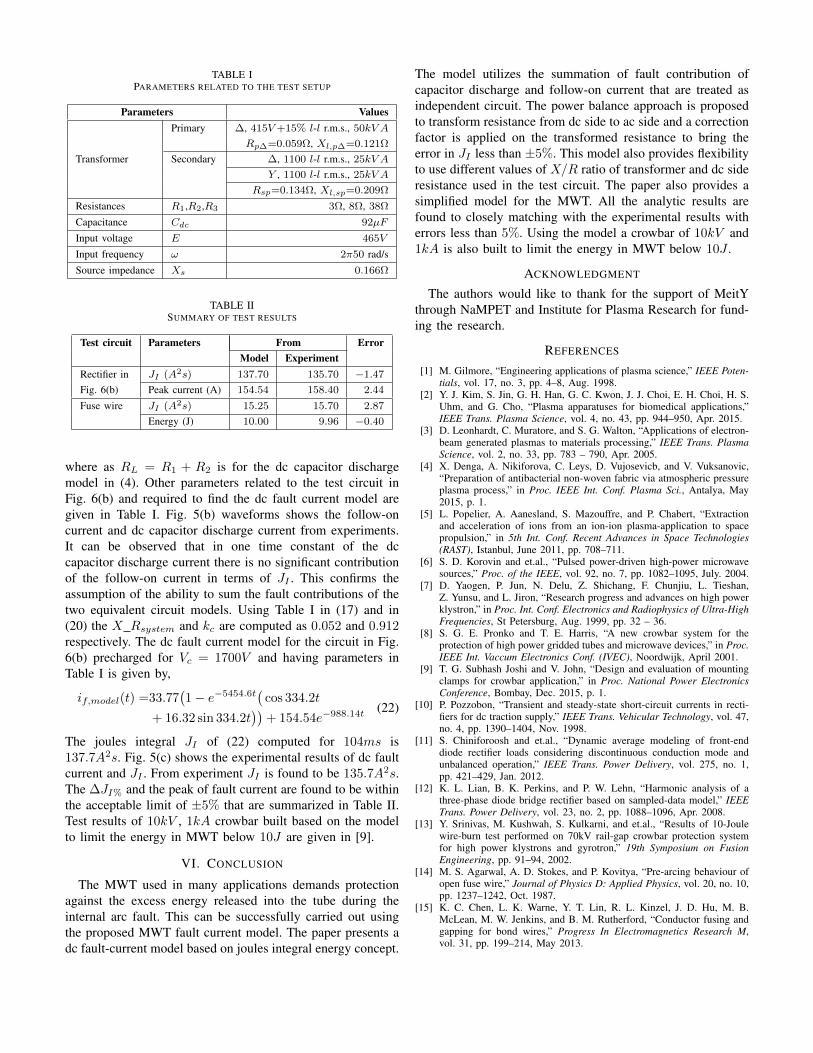
TABLE IPARAMETERS RELATED TO THE TEST SETUP
Parameters ValuesPrimary ∆, 415V+15% l-l r.m.s., 50kV A
Rp∆=0.059Ω, Xl,p∆=0.121Ω
Transformer Secondary ∆, 1100 l-l r.m.s., 25kV A
Y , 1100 l-l r.m.s., 25kV A
Rsp=0.134Ω, Xl,sp=0.209Ω
Resistances R1,R2,R3 3Ω, 8Ω, 38Ω
Capacitance Cdc 92µF
Input voltage E 465V
Input frequency ω 2π50 rad/s
Source impedance Xs 0.166Ω
TABLE IISUMMARY OF TEST RESULTS
Test circuit Parameters From ErrorModel Experiment
Rectifier in JI (A2s) 137.70 135.70 −1.47
Fig. 6(b) Peak current (A) 154.54 158.40 2.44
Fuse wire JI (A2s) 15.25 15.70 2.87
Energy (J) 10.00 9.96 −0.40
where as RL = R1 + R2 is for the dc capacitor dischargemodel in (4). Other parameters related to the test circuit inFig. 6(b) and required to find the dc fault current model aregiven in Table I. Fig. 5(b) waveforms shows the follow-oncurrent and dc capacitor discharge current from experiments.It can be observed that in one time constant of the dccapacitor discharge current there is no significant contributionof the follow-on current in terms of JI . This confirms theassumption of the ability to sum the fault contributions of thetwo equivalent circuit models. Using Table I in (17) and in(20) the X Rsystem and kc are computed as 0.052 and 0.912respectively. The dc fault current model for the circuit in Fig.6(b) precharged for Vc = 1700V and having parameters inTable I is given by,
if,model(t) =33.77(1− e−5454.6t
(cos 334.2t
+ 16.32 sin 334.2t))
+ 154.54e−988.14t(22)
The joules integral JI of (22) computed for 104ms is137.7A2s. Fig. 5(c) shows the experimental results of dc faultcurrent and JI . From experiment JI is found to be 135.7A2s.The ∆JI% and the peak of fault current are found to be withinthe acceptable limit of ±5% that are summarized in Table II.Test results of 10kV , 1kA crowbar built based on the modelto limit the energy in MWT below 10J are given in [9].
VI. CONCLUSION
The MWT used in many applications demands protectionagainst the excess energy released into the tube during theinternal arc fault. This can be successfully carried out usingthe proposed MWT fault current model. The paper presents adc fault-current model based on joules integral energy concept.
The model utilizes the summation of fault contribution ofcapacitor discharge and follow-on current that are treated asindependent circuit. The power balance approach is proposedto transform resistance from dc side to ac side and a correctionfactor is applied on the transformed resistance to bring theerror in JI less than ±5%. This model also provides flexibilityto use different values of X/R ratio of transformer and dc sideresistance used in the test circuit. The paper also provides asimplified model for the MWT. All the analytic results arefound to closely matching with the experimental results witherrors less than 5%. Using the model a crowbar of 10kV and1kA is also built to limit the energy in MWT below 10J .
ACKNOWLEDGMENT
The authors would like to thank for the support of MeitYthrough NaMPET and Institute for Plasma Research for fund-ing the research.
REFERENCES
[1] M. Gilmore, “Engineering applications of plasma science,” IEEE Poten-tials, vol. 17, no. 3, pp. 4–8, Aug. 1998.
[2] Y. J. Kim, S. Jin, G. H. Han, G. C. Kwon, J. J. Choi, E. H. Choi, H. S.Uhm, and G. Cho, “Plasma apparatuses for biomedical applications,”IEEE Trans. Plasma Science, vol. 4, no. 43, pp. 944–950, Apr. 2015.
[3] D. Leonhardt, C. Muratore, and S. G. Walton, “Applications of electron-beam generated plasmas to materials processing,” IEEE Trans. PlasmaScience, vol. 2, no. 33, pp. 783 – 790, Apr. 2005.
[4] X. Denga, A. Nikiforova, C. Leys, D. Vujosevicb, and V. Vuksanovic,“Preparation of antibacterial non-woven fabric via atmospheric pressureplasma process,” in Proc. IEEE Int. Conf. Plasma Sci., Antalya, May2015, p. 1.
[5] L. Popelier, A. Aanesland, S. Mazouffre, and P. Chabert, “Extractionand acceleration of ions from an ion-ion plasma-application to spacepropulsion,” in 5th Int. Conf. Recent Advances in Space Technologies(RAST), Istanbul, June 2011, pp. 708–711.
[6] S. D. Korovin and et.al., “Pulsed power-driven high-power microwavesources,” Proc. of the IEEE, vol. 92, no. 7, pp. 1082–1095, July. 2004.
[7] D. Yaogen, P. Jun, N. Delu, Z. Shichang, F. Chunjiu, L. Tieshan,Z. Yunsu, and L. Jiron, “Research progress and advances on high powerklystron,” in Proc. Int. Conf. Electronics and Radiophysics of Ultra-HighFrequencies, St Petersburg, Aug. 1999, pp. 32 – 36.
[8] S. G. E. Pronko and T. E. Harris, “A new crowbar system for theprotection of high power gridded tubes and microwave devices,” in Proc.IEEE Int. Vaccum Electronics Conf. (IVEC), Noordwijk, April 2001.
[9] T. G. Subhash Joshi and V. John, “Design and evaluation of mountingclamps for crowbar application,” in Proc. National Power ElectronicsConference, Bombay, Dec. 2015, p. 1.
[10] P. Pozzobon, “Transient and steady-state short-circuit currents in recti-fiers for dc traction supply,” IEEE Trans. Vehicular Technology, vol. 47,no. 4, pp. 1390–1404, Nov. 1998.
[11] S. Chiniforoosh and et.al., “Dynamic average modeling of front-enddiode rectifier loads considering discontinuous conduction mode andunbalanced operation,” IEEE Trans. Power Delivery, vol. 275, no. 1,pp. 421–429, Jan. 2012.
[12] K. L. Lian, B. K. Perkins, and P. W. Lehn, “Harmonic analysis of athree-phase diode bridge rectifier based on sampled-data model,” IEEETrans. Power Delivery, vol. 23, no. 2, pp. 1088–1096, Apr. 2008.
[13] Y. Srinivas, M. Kushwah, S. Kulkarni, and et.al., “Results of 10-Joulewire-burn test performed on 70kV rail-gap crowbar protection systemfor high power klystrons and gyrotron,” 19th Symposium on FusionEngineering, pp. 91–94, 2002.
[14] M. S. Agarwal, A. D. Stokes, and P. Kovitya, “Pre-arcing behaviour ofopen fuse wire,” Journal of Physics D: Applied Physics, vol. 20, no. 10,pp. 1237–1242, Oct. 1987.
[15] K. C. Chen, L. K. Warne, Y. T. Lin, R. L. Kinzel, J. D. Hu, M. B.McLean, M. W. Jenkins, and B. M. Rutherford, “Conductor fusing andgapping for bond wires,” Progress In Electromagnetics Research M,vol. 31, pp. 199–214, May 2013.


![Impact of DFIG based Wind Energy Conversion System on Fault … · The crowbar resistance is employed to limit the RSC current during grid faults [8]. The crow bar is switched on](https://img.dokumen.tips/doc/110x75/5c5e4dd709d3f28e758befc1/impact-of-dfig-based-wind-energy-conversion-system-on-fault-the-crowbar-resistance.jpg)


![High-Voltage Fully Isolated 2 Package, Surface-Mount, High … · Crowbar is a fault energy-diverting element [1] [2] built with series connected thyristors, connected at the output](https://img.dokumen.tips/doc/110x75/5c5e4dd809d3f28e758befc7/high-voltage-fully-isolated-2-package-surface-mount-high-crowbar-is-a-fault.jpg)