Embed Size (px)
Citation preview

full paperswww.MaterialsViews.com
3358 www.small-journal.com © 2015 Wiley-VCH Verlag GmbH & Co. KGaA, Weinheim
Microwave Enabled One-Pot, One-Step Fabrication and Nitrogen Doping of Holey Graphene Oxide for Catalytic Applications
Mehulkumar Patel , Wenchun Feng , Keerthi Savaram , M. Reza Khoshi , Ruiming Huang , Jing Sun , Emann Rabie , Carol Flach , Richard Mendelsohn , Eric Garfunkel , and Huixin He *
1. Introduction
The ever-increasing global depletion of fossil resources
and their environmental impacts stimulate intense research
activities in the development of alternative green and sus-
tainable energy resources. Fuel cells and metal–air batteries
are the most attractive clean and high-effi ciency devices for
power generation and energy storage. [ 1–3 ] However, their
large-scale practical application will be diffi cult to realize if
the expensive platinum-based electrocatalysts for oxygen
reduction reaction (ORR) cannot be replaced by effi cient,
stable, low-cost, and sustainable catalysts in their electrodes.
Recent efforts in reducing/replacing expensive platinum-
based electrodes have led to the development of new ORR DOI: 10.1002/smll.201403402
The unique properties of a holey graphene sheet, referred to as a graphene sheet with nanoholes in its basal plane, lead to wide range of applications that cannot be achieved by its nonporous counterpart. However, the large-scale solution-based production requires graphene oxide (GO) or reduced GO (rGO) as the starting materials, which take hours to days for fabrication. Here, an unexpected discovery that GO with or without holes can be controllably, directly, and rapidly (tens of seconds) fabricated from graphite powder via a one-step-one-pot microwave assisted reaction with a production yield of 120 wt% of graphite is reported. Furthermore, a fast and low temperature approach is developed for simultaneous nitrogen (N) doping and reduction of GO sheets. The N-doped holey rGO sheets demonstrate remarkable electrocatalytic capabilities for the electrochemical oxygen reduction reaction. The existence of the nanoholes provides a “short cut” for effi cient mass transport and dramatically increases edges and surface area, therefore, creates more catalytic centers. The capability of rapid fabrication and N-doping as well as reduction of holey GO can lead to development of an effi cient catalyst that can replace previous coin metals for energy generation and storage, such as fuel cells and metal–air batteries.
Graphene
M. Patel, K. Savaram, M. Reza Khoshi, R. Huang, J. Sun, E. Rabie, Dr. C. Flach, Prof. R. Mendelsohn, Prof. H. He Chemistry Department Rutgers University 73 Warren Street , Newark , NJ 07102 , USA E-mail: [email protected]
Dr. W. Feng Department of Chemical Engineering University of Michigan 2800 Plymouth Road , Ann Arbor , MI 48109 , USA
Prof. E. Garfunkel Department of Chemistry and Chemical Biology Rutgers University 610 Taylor Rd , Piscataway , NJ 08854 , USA
small 2015, 11, No. 27, 3358–3368

www.MaterialsViews.com
3359© 2015 Wiley-VCH Verlag GmbH & Co. KGaA, Weinheim www.small-journal.com
electrocatalysts. [ 4–9 ] Among them, graphene, especially the
heteroatom doped graphene shows outstanding potentials
as metal free catalysts. However, practical application of
the graphene based metal free catalyst is hampered due to
its remarkable impermeability. [ 10 ] Hence, the reactants and
products cannot access/leave the inner catalytic sites easily,
which results in unsatisfactory performance and non-effi cient
mass transport. In contrast, holey graphene, referred to gra-
phene sheets with nanoholes in its basal plane, not only pro-
vides “short cut” for effi cient mass transport, but also possess
signifi cantly more catalytic centers due to the increased edges
associated with the existence of holes. Several approaches
have been reported for the production of holey graphene
sheets. Bottom-up approaches based on chemical vapor dep-
osition method, [ 11–13 ] and top-down approaches via photo, [ 14 ]
electron, [ 15 ] or plasma [ 11 ] etching utilize various templates,
which provide good control over the sizes and shapes of the
holes/pores. However, all these strategies suffer from diffi cul-
ties in scaling up for large quantity production and high cost.
On the other hand, chemical etching based processes, such as
KOH etching, [ 16 ] H 3 PO 4 activation, [ 17 ] HNO 3 oxidation, [ 18,19 ]
hot steam etching, [ 20 ] and oxidative etching with catalytic
nanoparticle such as Fe 2 O 3 , [ 21 ] Ag, [ 22 ] or other metal oxide
nanoparticles [ 23 ] have advantages for large scale and cost
effective synthesis. However, these chemical etching based
approaches require graphene oxide (GO) or reduced gra-
phene oxide (rGO) as a starting material, which takes hours
to days for their fabrication, depending on the oxidation
method applied. There is no approach that has been reported
yet to rapidly fabricate holey graphene directly from graphite
particles. Herein, we report our unexpected discovery that
by replacing traditional heating with microwave heating,
holey graphene oxide (HGO) sheets are directly and rapidly
(40 s) fabricated from graphite particles via a one-step-one-
pot reaction. Furthermore, by slightly shortening the micro-
wave heating time, graphene oxide (GO) sheets without
holes can be rapidly fabricated. This approach has the similar
chemical recipe as the widely used Hummers method, but
dramatically shortened the reaction time from days to tens
of seconds with high production yield (120 wt% of graphite).
Heteroatom (N, P, B, and S) doping in graphene can
effectively tailor its electronic properties and thus have a
great impact on its wide range of applications in electronics,
energy storage, and metal free catalysts applications. [ 24–35 ]
There are quite a few methods available for nitrogen (N)
doping. [ 32,36–43 ] However, all of these approaches require long
time and/or high annealing temperature with various N con-
taining molecules. Again, by taking advantage of the unique
heating mechanism of microwave, we developed a fast and
low temperature approach to simultaneously reduce and
dope graphene oxide sheets with nitrogen. The N-doping
type can be controlled simply by changing the microwave
time. With 10 min of microwave irradiation, pyridinic N and
pyrrolic N reach the highest percentage in holey graphene
sheets, which show the best catalytic activity toward elec-
trochemical ORR. These N-doped holey rGO(N-HrGO-10)
sheets not only offer the lower overpotential and peak poten-
tial but also provide more than 4 times higher kinetic current
density than nonporous N-doped rGO(N-rGO-10). It is likely
due to the existence of nanoholes, which provides “short cut”
for effi cient mass transport and also creates more catalytic
centers due to the increased surface area and edges associ-
ated with the nanoholes in the N-HrGO-10. For the fi rst time,
we experimentally determined the effective diffusion coeffi -
cient constant of O 2 for the N-HrGO-10, which is indeed sig-
nifi cantly higher than that of the N-rGO-10. Even though the
onset potential is slightly higher than the Pt/C (0.09 V), the
N-HrGO-10 shows much higher catalytic current, better sta-
bility, and durability against methanol poisoning. The capa-
bility to rapid fabrication and N-doping of HGO can lead us
to develop effi cient catalysts which can replace previous coin
metals for energy generation and storage, such as fuel cells
and metal-air batteries.
2. Results and Discussion
Recently, we developed a fast, scalable, and low-energy
approach to directly produce graphene nanosheets (GNs)
from graphite powder. [ 44 ] These graphene nanosheets are
highly uniform in size and largely retain their intrinsic gra-
phitic structures without any post-reduction treatment. The
key is to exclude KMnO 4 (as used in Hummers or Modifi ed
Hummers methods) and exploit pure nitronium ion oxida-
tion and the unique thermal and kinetic effects induced by
microwave heating. Due to the unique effects of microwave
heating, it is very likely that consumption/etching of defec-
tive carbons (already oxidized carbon or sp 3 carbon) was
selectively enhanced more than that of the continuing oxida-
tion of intact graphene domains (generation of more oxygen
containing groups). As a result, the graphene sheets rapidly
breakdown to small pieces with the intrinsic structures of gra-
phene largely intact. In this work, we found that by including
KMnO 4 in the reaction system, and by adjusting microwave
irradiation time and amount of KMnO 4 , the etching/con-
sumption of the generated defective carbons can be con-
trolled, so that graphene oxide sheets with controlled hole
structures can be directly fabricated from graphite powder in
one step.
In a typical experiment, the mixture of graphite powder,
acids (concentrated H 2 SO 4 : HNO 3 , 4:1) and KMnO 4
(500 wt% of graphite) was subjected to microwave irra-
diation at 300 W for different times (30 s for GO or 40 s
for HGO). The resulting products, after cleaning, are easy
to disperse in water by simple bath sonication. Their dis-
persions in water have brown color (inset of Figure 1 c and
Figure S1b, Supporting Information), independent of micro-
wave irradiation time. They all exhibit the typical ≈230 nm
peak in UV–vis spectrum (Figure 1 c and Figure S1b, Sup-
porting Information, respectively) due to π → π* transi-
tion of C=C and shoulder around 300nm due to the n → π*
transition of carbonyl functional group. X-ray photoelectron
spectroscopy (XPS) measurements were performed to care-
fully study their oxidation level and chemical functionalities.
Interestingly, high resolution C1s (Figure 2 a and Figure S2a,
Supporting Information) and O1s peak (Figure S3b, Sup-
porting Information) analysis of GO and HGO shows that
the C:O atomic ratio is ≈2.38, similar in both GO (Table S1,
small 2015, 11, No. 27, 3358–3368

full paperswww.MaterialsViews.com
3360 www.small-journal.com © 2015 Wiley-VCH Verlag GmbH & Co. KGaA, Weinheim
Figure 1. a) AFM of GO sheets obtained via 30 s of microwave irradiation. b) AFM and d) STEM images of HGO sheets obtained via 40 s of microwave irradiation. c) UV–vis-NIR spectra of HGO and N-HrGO-10 in water. Inset in (c) is a digital picture of an aqueous dispersion of HGO (left), N-HrGO-10 (right) shows different color, indicating their different oxidation states. The red arrows in (b,d) show hole on HGO sheet.
Figure 2. XPS high resolution C1s peak analysis of HGO (a) and N-HrGO-10 (b). XPS high resolution N1s peak analysis of N-HrGO-10 (c) and N-HrGO-30 (d), where 10 and 30 denotes microwave treatment time (in minutes) of HGO with NH 4 OH at 120 °C.
small 2015, 11, No. 27, 3358–3368
www.MaterialsViews.com
3361© 2015 Wiley-VCH Verlag GmbH & Co. KGaA, Weinheim www.small-journal.com
Supporting Information), which indicates that both GOs
have similar extent of oxidation in spite of different micro-
wave time.
However, we found that microwave irradiation time dra-
matically changed their geometric structures. For instance,
30 s of microwave irradiation resulted in GO sheets with
nanoholes seldom being observed in the basal planes. The
atomic force microscopy (AFM) and scanning transmission
electron microscopy (STEM) (Figure 1 a and Figure S1a, Sup-
porting Information) images show that most of the sheets
are single layered and nonporous. Similar to the GO sheets
produced via modifi ed Hummer's method, these sheets have
straight edges, indicating the dominant linear unzipping effect
of KMnO 4. [ 45 ] While, with a 40 s of microwave irradiation, the
lateral size of the GO sheets obtained is slightly decreased
and their edges are not straight anymore from their AFM and
STEM images (Figure 1 b, d, Figure S4, Supporting Informa-
tion). More importantly, holes (from several nanometers to
a few hundred nanometers) are randomly distributed across
the entire sheets, demonstrating that holey GO (HGO) is
directly fabricated from graphite powder via a fast, one-step-
one-pot reaction. Further, the surface area of GO and HGO,
after vacuum dry, was measured by methylene blue (MB) dye
adsoprtion approach (Table S2, Supporting Information). [ 46 ]
We found that the surface area of HGO (1424.16 m 2 g −1 ) is
≈1.5 times higher than that of GO (947.55 m 2 g −1 ), possibly
due to the existence of the holes in HGO. To our knowledge,
this is the fi rst report that solution phase GO with controlled
hole structures can be rapidly fabricated directly from
graphite powder (Table S3, Supporting Information).
Beside the difference in their edge morphology and hole
structure of the GO and HGO, the color of the fi ltrate (waste),
collected during cleaning via fi ltration, is also different.
While the one obtained from GO cleaning is colorless, the
one from HGO cleaning is light yellow (Figure S6c-II, Sup-
porting Information). The color of the fi ltrate (Figure S6c-III,
Supporting Information) becomes darker upon fur-
ther increase in microwave irradiation time (45 s) of the
reaction mixture. We noticed that the resultant GO is
still highly oxidized and porous from the UV–vis spec-
troscopy and AFM measurement (Figure S6ab, Sup-
porting Information), respectively, but the product yield
is dramatically decreased to ≈50 wt%, in comparison to
120 wt% product yield of HGO with 40 s of microwave
irradiation. The yellow colored fi ltrates are fl uorescent
and the fl uorescent intensity increases with the microwave
time as shown in Figure S6d (Supporting Information). In
contrast, by excluding the KMnO 4 in reaction mixture, a
similar dark yellow fi ltrate was also obtained within 30 s of
microwave irradiation (Figure S6c-IV, Supporting Informa-
tion), suggesting that KMnO 4 plays an important role in
slowing down the carbon gasifi cation/etching processes. [ 44 ]
The large amount of carbon lost in the form of small organic
compounds and/or gasifi cation to CO 2 /CO is related to the
molecular mechanisms of graphite oxidation. [ 47 ]
For an effi cient approach to fabricate graphene sheets
with controlled structures from graphite particles, the fi rst
requirement is to access the internal surfaces of graphite par-
ticles by an oxidant. However, due to the strong interaction
and close distance between the sheets, only the edges of
graphite particles and the exposed graphene surface are
readily accessible; the rest of the graphene is physically
blocked from interaction with the oxidant molecules. [ 48 ]
The oxidation of each layer of graphene includes several
steps: First, oxidation is initiated to create oxygen containing
groups, such as –OH and/or epoxy groups, on the basal plane
and edges of graphene sheets. Further oxidation includes two
simultaneous and competing processes: (i) continuing initia-
tion of oxidation in the intrinsic graphene domains resulting
in generation of more –OH and/or epoxy groups, referred
as defect generation; and/or (ii) further oxidation of the
already oxidized carbon atoms, ultimately leading to gasifi ca-
tion of the carbon atoms (mostly CO or CO 2 ) and genera-
tion of small organic carbon species (which are separated
during fi ltration), resulting in vacancies and holes throughout
the graphene basal planes. This process is also called defect
consumption or etching. [ 20,49 ] Continuing etching eventually
leads to fracture/cutting of graphene sheets to small pieces.
The relative reaction rates of these processes determine the
overall speed of the graphene fabrication as well as the oxi-
dation level, the lateral size, and holey structures of the fabri-
cated graphene sheets.
The exact mechanism of hole generation in the gra-
phene oxide is not fully understood, which is worthy to
further study. Based on our results, additional control
experiments (see the Supporting Information for more
detail) and combined with previous experimental and theo-
retical studies, [ 45,49–54 ] we hypothesize the following scenario
might have occurred: It is known that KMnO 4 preferably
oxidizes existing defects, [ 45 ] while nitronium ions have the
power to oxidize both existing defects and intact graphene
domains. [ 45,50,51 ] It is very likely that the nitronium ions effi -
ciently intercalate to the inner sites of graphite particles
and initiate oxidation of graphene sheets and generates
defects (functional groups such as –OH and epoxy groups)
across the entire sheets. In the following steps, if KMnO 4
was not included, these defects were quickly etched away
by losing small organic molecules and/or releasing CO 2 /
CO gases. As a result, holes are generated on the graphene
sheets. However, this etching step is so fast that the gen-
erated holey graphene were rapidly and uncontrollably
fractured to small pieces. [ 44 ] With KMnO 4 in the reaction
system, MnO 4 − may bind to some of the epoxy/hydroxyl
groups (defects), generated in the fi rst step of oxidation by
the nitronium ions, protects them from further oxidation
and slows down the defect consumption/etching step. On
the other hand, KMnO 4 starts its own unzipping like oxida-
tive cutting mechanism. [ 45 ] At short microwave time (30 s),
highly oxidized nonporous GO sheets were generated with
straight edges and few holes/pores in their basal plane, sim-
ilar to those fabricated with Hummers or modifi ed Hum-
mers methods. However with further slightly increasing the
microwave time to 40 s, the temperature was signifi cantly
increased (see Figure S1c, Supporting Information). Noted
that the temperature was measured outsites of the reaction
vessel, the true temperature inside should be much higher
than the measured ones. At the largely increased tempera-
tures, the KMnO 4 could not protect the defects effi ciently
small 2015, 11, No. 27, 3358–3368

full paperswww.MaterialsViews.com
3362 www.small-journal.com © 2015 Wiley-VCH Verlag GmbH & Co. KGaA, Weinheim
anymore, so etching occurs both in the basal plane and at
the edges of GO, resulting in holey GO with irregular edges
as shown in Scheme 1 .
Heteroatom doping of graphene, especially N-doping, can
effectively tailor and fi ne tune its electronic structures, thus
has great impacts on is applications in electronics, energy
storage and metal free catalysts. [ 24,28–31 ] There are quiet a
few strategies have been reported for N-doping of graphene,
however all of them require high temperature (500–1000 °C)
and/or long reaction time for N-doping (Table S4, Supporting
Information). Recently, Tang et al. exploited microwave
heating to reach high temperature and to shorten the doping
time. [ 55 ] However, due to the low microwave absorption
capability of GO, the microwave assisted N-doping could be
achieved only for pre-pyrolytic graphene oxide dry powder,
which obtained by preheating of GO at ≈250 °C before micro-
wave treatment. Furthermore, the product is not easy for
solution processible applications. Here in, again by taking an
advantage of microwave heating, we report that solution pro-
cessible N doped and concurrently reduced GO is achieved
at low temperatures and with short reaction time. Specifi cally,
a mixture of GO sheets and concentrated NH 4 OH is heated
in a closed glass vessel via microwave irradiation. In ≈40 s,
the apparent temperature reaches to 120 °C possibly due
to dielectric and/or ionic heating mechanism. With a closed
looped confi guration of the microwave heating system, we
held this temperature for 10 min. From UV–vis spectroscopy,
FT-IR, and XPS characterization, we found that this process
results in simultaneous N-doping and reduction of GO/HGO.
We refer the N-doped holey reduced GO as N-HrGO-10 and
N-doped nonporous reduced GO as N-rGO-10, 10 denotes
10 min of microwave reaction time for N-doping.
Figure 1 c and Figure S1b (Supporting Information) show
that the UV absorption peak of N-HrGO-10 and N-rGO-10
red shifted to ≈260 nm along with enhanced NIR absorption,
indicating the aromatic conjugation of graphene was partially
restored. The FT-IR spectrum analysis of GO, HGO, N-rGO-
10, and N-HrGO-10 (Figure S8, Supporting Information) also
shows that the peaks at ≈3400 cm −1 (O–H
stretching), 1735 cm −1 (C=O stretching),
1625 cm −1 (adsorbed water bending), and
1048 cm −1 (C–O stretching vibrations),
were initially present in the spectrum of
GO and HGO, disappeared in N-rGO-10
and N-HrGO-10. This result soundly
demonstrates the removal of oxygen con-
taining functional groups from GO sheets
and the GO sheets were reduced during
the microwave reaction with NH 4 OH.
Meanwhile a new strong band near
1200–1240 cm −1 appears in N-rGO-10
and N-HrGO-10, which can be identifi ed
and assigned to C–N stretching vibrations,
indicating N was successfully incorporated
into the carbon matrix of the GO sheets.
Furthermore, the successful N-doping is
also proved by the appearance of strong
N1s along with C1s and O1s peak in the
XPS survey spectrum (Figure S3a, Sup-
porting Information) of N-rGO-10 and N-HrGO-10. Detailed
quantitative study of the C1s and O1s peak (Table S1, Sup-
porting Information) shows an increased C:O atomic ratio
and a decreased relative O1s peak intensity in N-rGO-10 and
N-HrGO-10 compared to that of GO and HGO, suggesting
that the oxygen functional groups are extensively removed
after the microwave reaction of GO with NH 4 OH, consistent
with the FTIR results (Figure S8, Supporting Information). It
was reported that NH 4 OH can either serve as an epoxide ring
opening agent and/or as a Lewis/Bronsted acid which reacts
with epoxy/carboxyl groups of the GO, resulting in the intro-
duction of N into graphitic structure along with the reduction
of graphene oxide. [ 43 ] Indeed, the –OH/epoxy and –COOH
peak intensity in the C1s spectra of N-rGO-10 (Figure S2b,
Supporting Information) and N-HrGO-10 (Figure 2 b) are
greatly decreased as compared to GO and HGO (Table S5,
Supporting Information). However, the relative ratio of C=O
remained unaltered, showing that carbonyl moiety is not
reactive in this reaction. Raman spectroscopy was also used
to characterize the HGO sheets before and after N-doping.
As expected, the Raman spectra (Figure S9, Supporting Infor-
mation) of all the samples show D band (≈1315 cm −1 ) and G
band (≈1590 cm −1 ) and the ratio intensities ( I D / I G ) of D and
G band does not changed upon simultaneous N-doping and
reduction. These results are consistent with previous reports
that incorporation of heterogeneous N-dopants breads the
hexagonal symmetry of the graphene. [ 56 ] Therefore even the
GO was reduced during N-doping, the I D / I G ratio would not
decrease, which is in contrast to the scenario of reduction of
GO to rGO without introducing any heterogeneous dopants.
The surface area of the N-HrGO-10 and N-rGO-10 was also
measured via methylene blue absorption method. We found
that the surface area of N-rGO-10 dramatically decreased
from 947 to 560 m 2 g −1 after simultaneous reduction and
N-doping process (Table S2, Supporting Information). In
highly contract, the high surface area of N-HrGO-10 is largely
maintained (1424 to 1194 m 2 g −1 for HGO and N-HrGO-10,
respectively). From the SEM (scanning electron microscopy)
Scheme 1. Schematic drawing of proposed mechanism of HGO synthesis.
small 2015, 11, No. 27, 3358–3368

www.MaterialsViews.com
3363© 2015 Wiley-VCH Verlag GmbH & Co. KGaA, Weinheim www.small-journal.com
image of N-HrGO-10 (Figure S10, Supporting Information),
we can see that its holey structure is nicely preserved during
the simultaneous reduction and N-doping process.
It is well documented that the incorporated N in gra-
phene can be in different forms, which would infl uence the
electronic structure and therefore the catalytic performance
of the doped graphene. [ 34,57,58 ] For example, pyridinic and
pyrrolic N refers to N atoms bonded to two carbon atoms
and donates one and two p -electron to the aromatic pi (π)
system, respectively. Quaternary N atoms are incorporated
into the graphene via substituting some carbon atoms within
the graphene plane. The pyridinic N and pyrrolic N are
always located at the graphitic edge, whereas quaternary N
can be both “edge-N” and “bulk-like-N”. To evaluate the
type and level of N-doping by this microwave approach, we
deconvoluted high resolution XPS N1s peak and summarize
the relative ratio of each type of N species. The relative ratios
of pyridinic N (398.5 eV), amine N (399.6 eV), pyrrolic N
(400.7 eV), quaternary N (402.0 eV), and N-oxides (like NO
at 403.4 eV, NO 2 at 405.2 eV, and NO 3 at 406.6 eV) are listed
in Table S6 (Supporting Information). From this careful anal-
ysis, we found that the microwave approach results in similar
N-types as traditional heating approaches, [ 24,59 ] even though
the total N content is slightly higher (8.5 atomic%). In addi-
tion, the relative ratio of each N-type varies depending on
the initial GO structures. With HGO, more pyridinic N and
pyrrolic N were generated in comparison to the nonporous
GO, possibly due to the difference in the amount of edges
(Table S6, Supporting Information).
N-doped carbon nanomaterials exhibited good catalytic
activity for a wide range of catalytic reactions. [ 6,31,35,60,61 ] Their
performance depends on the level and type of N-doping for the
specifi c catalytic reaction of interest. [ 60,61 ] It has been already
reported that N-doped graphene/CNT shows better electrocat-
alytic activity for ORR, [ 6,62 ] however the detailed electrocata-
lytic mechanisms of these N-doped carbon materials remains
unclear. Several research groups have reported that enhanced
ORR activity of N-doped carbon nanomaterials is due to the
presence of pyridinic N at the edges [ 63,64 ] or a combined effect
from pyrrolic and pyridinic N, which introduces an asymmetric
spin density and atomic charge density in the graphene plane,
making it possible for high ORR catalytic activity. [ 65 ]
The electrocatalytic activity of N doped holey rGO
(N-HrGO-10) was evaluated for ORR by cyclic voltammetry
(CV) in a 0.1 m KOH solution saturated with oxygen and
nitrogen (Figure 3 a). A large reduction peak was observed
in the O 2 saturated electrolyte solution, but not in the N 2
saturated solution, suggesting that O 2 is electrocatalytically
reduced on the N-HrGO-10 modifi ed electrode. We com-
pared the ORR capability of N-HrGO-10 with bare GC
electrode, commercial Pt/C, N-rGO-10, and electrochemi-
cally reduced holey GO (EC-HrGO), which is obtained by
electrochemical reduction of HGO. [ 66 ] From their CV and
linear sweep voltammetry (LSV) curves obtained in O 2 sat-
urated 0.1 m KOH (Figure 3 b,c and Table 1 ), we can see that
the N-HrGO-10 shows much better ORR catalytic activity
than the bare electrode, EC-HrGO, and N-rGO-10 demon-
strated by its more positive onset potential, peak potential,
and higher current density, which is similar or slight better
than previously reported N-doped graphene, synthesized by
traditional high temperature approaches. [ 6,57,67,68 ] However,
N-HrGO-10 still shows slightly more negative potential and
lower current density at lower potential region compared
to the commercial Pt/C, indicates that the Pt/C catalyst
still shows the best ORR performance. While it is noticed
that at higher potentials (>−0.6 V), N-HrGO-10 shows
higher current density, which indicates that it is possibly
more kinetically facile toward ORR than the Pt/C at high
overpotentials.
To understand the mechanism of oxygen adsorption
on the N-HrGO-10, we drew Tafel plots (Figure S11, Sup-
porting Information) of N-HrGO-10 derived by the mass-
transport correction of corresponding RDE data from
Figure 3 c. The same data treatment was also performed
for Pt/C, N-rGO-10, EC-HrGO, and bare electrode for
comparison. The Tafel slopes from the plots were sum-
marized in Table 1 . The commercial Pt/C electrocatalyst
shows two different Tafel slopes (75.22 and 121.10 mV per
decade at lower and higher current density region, respec-
tively), which indicates a Langmuir adsorption and Temkin
adsorption of oxygen. [ 56 ] Similar to Pt/C, the Tafel plots of
N-HrGO-10 also shows two slopes (Table 1 ) but they are
much lower from that of the Pt/C catalysts, indicates a pos-
sible different oxygen adsorption mechanism. Moreover, the
N-HrGO-10 and EC-HrGO shows smaller Tafel slopes than
the N-rGO-10, demonstrating that the existence of nano-
holes and/or the large surface area could improve the cata-
lytic activities of carbon-based catalysts. Furthermore, we
Figure 3. a) CVs of N-HrGO-10 in N 2 and O 2 saturated 0.1 M KOH electrolyte at a scan rate of 50 mV s −1 . b,c) CV and LSV curves of Pt/C, EC-HrGO, N-HrGO-10, N-rGO-10, and bare electrode in O 2 saturated 0.1 M KOH electrolyte at a scan rate of 50 and 10 mV s −1 , respectively. Inset c) is zoomed in LSV curve of bare electrode, N-rGO-10, and N-HrGO-10. All potentials are measured using Ag/AgCl as a reference electrode.
small 2015, 11, No. 27, 3358–3368

full paperswww.MaterialsViews.com
3364 www.small-journal.com © 2015 Wiley-VCH Verlag GmbH & Co. KGaA, Weinheim
also found that ORR activity of N-HrGO depends on the
microwave reaction time of HGO with NH 4 OH. At longer
reaction time, the relative ratios of N-types (Table S6,
Supporting Information) were changed, which largely infl u-
enced their ORR catalytic activity. From the CV curves
(Figure S12, Supporting Information), the onset potential
and peak potential were negatively shifted and the kinetic
current decreased on N-HrGO-30, which is obtained via
30 min of microwave reaction time. Among all the gra-
phene modifi ed electrodes, N-HrGO-10 modifi ed electrodes
exhibits the lowest onset potential and peak potential, and
highest ORR current.
ORR can occur either via a direct four electron reduc-
tion pathway or a two electron pathway. In the four electron
pathway, oxygen is directly reduced to water, while in the
two electron pathway, oxygen is reduced to peroxide. In fuel
cell, the direct four electron pathway is preferred to achieve
better energy conversion effi ciency and prevent corrosion
of cell components due to the hazardous peroxides. LSV
of EC-HrGO (Figure 3 c) clearly shows a two-step reaction
pathways for ORR (−0.2 to −0.4 V and −0.7 to −1.0 V), which
indicates the two-electron pathway mechanism while LSV of
N-HrGO-10 shows almost one-step reaction pathway, indi-
cates four-electron pathway for ORR.
To carefully quantify the electron transfer numbers and
the formation of peroxide species (HO 2 − ) during the ORR
process, we performed rotating ring disk electrode (RRDE)
measurements. The %HO 2 − and the electron transfer number
were determined by the following equations:
( )( )=
×
×−%HO
200N
N
2
r
dr
I
I I
(1)
nI
I I4
N
d
dr )()(=
×
+
(2)
where I d and I r is the current measured from the disc and
ring electrode, respectively, and N is current collection effi -
ciency of the Pt ring electrode. N was determined to be 0.424
from the redox reaction of K 3 Fe(CN) 6. Figure 4 a shows the
disk and ring currents from N-HrGO-10, N-HrGO-30, EC-
HrGO, N-rGO-10, and Pt/C modifi ed electrodes, respectively.
Notably, the N-HrGO-10 and Pt/C modifi ed electrodes exhib-
ited the lowest ring current among these graphene modifi ed
electrodes. The ring current increased on the N-HrGO-30 and
EC-HrGO modifi ed electrode shows the highest ring current.
Based on the ring and disk currents, the electron transfer
numbers ( n ) and %HO 2 − were calculated (Figure 4 b,c).
The EC-HrGO modifi ed electrode demonstrated the lowest
electron transfer number of 2.5–2.6, and it also generates the
highest percentage of peroxide (75%). The electron transfer
number for the N-HrGO-30 and N-rGO-10 are similar,
slightly increased to about 3 and the amount of peroxide
generated decreased to 45%–70% depending on the poten-
tials applied during the ORR. In sharp contrast, the n = 3.5
to 3.8 for the N-HrGO-10 modifi ed electrode over the whole
Table 1. Electrochemical parameters (onset potential, peak potential, current density at −0.4 V and Tafel slopes-b1 and -b2 calculated at low and high current density region, respectively) of different catalysts for ORR estimated from CV and RDE polarization curves in 0.1 M KOH solution. All potential are measured using Ag/AgCl as a reference electrode.
Catalyst Onset potential [V]
Peak potential [V]
Current density [mA cm 2 ] at −0.4 V
Tafel slope [mV/decade]
b1 b2
Bare electrode −0.18 −0.40 0.74 57.28 143.93
EC-HrGO −0.15 −0.36 2.08 58.58 107.11
N-rGO-10 −0.14 −0.36 1.04 87.46 152.57
N-HrGO-10 −0.11 −0.28 2.41 58.37 104.78
Pt/C −0.02 −0.21 3.05 75.22 121.10
Figure 4. a) RRDE voltammogram of N-HrGO-10, N-HrGO-30, EC-HrGO, N-rGO-10, and Pt/C modifi ed electrode in oxygen saturated 0.1 M KOH at a scan rate of 10 mV s −1 and 1600 rpm rotation speed. b,c) The number of electron transfer and relative peroxide %, respectively, for all catalyst calculated from RRDE voltammogram. All potentials are measured using Ag/AgCl as a reference electrode.
small 2015, 11, No. 27, 3358–3368

www.MaterialsViews.com
3365© 2015 Wiley-VCH Verlag GmbH & Co. KGaA, Weinheim www.small-journal.com
potential range, emphasizing that the ORR proceeds mainly
via a direct four-electron pathway. In consistent to the elec-
tron transfer number, the % of peroxide is as low as 12%.
The much better performance of N-HrGO-10 over N-rGO-10
is possibly due to its relatively high concentration of pyri-
dinic and pyrrolic N and the existence of holes and edges,
which also provide higher surface area, largely facilitate the
mass transport of O 2 and the electrolyte. On the other hand,
EC-HrGO should have the same or similar amount edges,
holes, and surface area compared to the N-HrGO-10, its
poor performance is very likely due to the lack of N doped
catalytic centers. Moreover, N-HrGO-30 also shows lower
electron transfer number and higher %HO 2 − , possibly due
to the change in N-type upon prolonged microwave irradia-
tion time. From XPS N1s peak analysis of N-HrGO-10 and
N-HrGO-30 (Figure 2 c,d), we summarized N-type and rela-
tive ratio in Tables S1 and S6 (Supporting Information). Even
though the atomic N% is not dramatically changed at dif-
ferent microwave reaction time, but the pyridinic N, pyrrolic
N is decreased at longer microwave time (30 min), which can
be the possible reason for decreased ORR catalysis.
To further study how the hole structures on the
N-HrGO-10 infl uence their electron transfer kinetics
involved in ORR, rotating disc electrode (RDE) meas-
urements (Figure S13, Supporting Information) were per-
formed in O 2 saturated 0.1 m KOH solutions under various
electrode rotating rates. The same study also performed
on the N-rGO-10 and Pt/C for comparison. As shown in
Figure S13 (Supporting Information), the current density is
increased with rotation speed from 250 to 2500 rpm due to
the enhanced diffusion of the electrolytes and O 2 . The kinetic
parameters, such as kinetic current density ( J K ), and the
effective diffusion coeffi cient of O 2 ( D 0 ) in ORR is then ana-
lyzed using the Koutecky–Levich (K–L) equation. [ 69 ]
J J J B JL K K1 / 1 / 1 / 1 / 1 /0.5ω= + = + (3)
where B = 0.62 nF C 0 ( D 0 ) 2/3 v −1/6 and J K = nFkC 0 .
Here, J is the measured current density, J L and J K are
the diffusion limiting and kinetic limiting current densities,
ω is the angular rotation rate of the disc electrode (rad/s), B
is Levich constant, n is the number of electrons transferred
in the oxygen reduction reaction (mol −1 ), F is the Faraday
constant ( F = 96485 C mol −1 ), D 0 is the effective diffu-
sion coeffi cient of O 2 (cm 2 s −1 ), ν is the kinematic viscosity
of the electrolyte (cm 2 s −1 ), C 0 is the oxygen concentration
(mol cm −3 ), and k is the electron transfer rate constant.
We plotted the K–L plot ( J −1 vs ω −1/2 ) for N-HrGO-
10, N-rGO-10, and Pt/C at various electrode potentials
( Figure 5 a,b and Figure S13d, Supporting Information). From
the linearity and parallelism of the plot at various electrode
potentials, we consider that the ORR is a typical fi rst order
reaction kinetics with respect to the dissolved oxygen con-
centration. The slope and intercept of the K–L plot gives the
Levich constant ( B ) and J K . , which then are used to calcu-
late the effective diffusion coeffi cient constant of O 2 ( D 0 )
and electrochemical rate constant k , respectively, by using
Figure 5. a,b) K–L plot of N-HrGO-10 and N-rGO-10, obtained based on the LSV curves at different rotating speeds (Figure S13, Supporting Information), respectively. c) Calculated oxygen diffusion coeffi cient and d calculated rate constant for ORR, using slope and intercept from K–L plot of N-HrGO-10, N-rGO-10, and Pt/C. All potentials are measured using Ag/AgCl as a reference electrode.
small 2015, 11, No. 27, 3358–3368
full paperswww.MaterialsViews.com
3366 www.small-journal.com © 2015 Wiley-VCH Verlag GmbH & Co. KGaA, Weinheim
electron transfer number n calculated from RRDE meas-
urement. From Figure 5 d, the N-HrGO-10 has more than
4 times higher k than the N-rGO-10. Here, for the fi rst time,
we found that the effective diffusion coeffi cient of O 2 is also
much higher (Figure 5 c) in N-HrGO-10, which quantitatively
demonstrates that the holey structures on the basal plane of
graphene indeed contributed to the enhanced diffusion of
oxygen. The calculated kinetic current density ( J k ) and rate
constant ( k ) from Equation ( 3) for N-HrGO-10 is found to
be 462.38 mA cm −2 and 0.015 cm s −1 , respectively, which is
much higher than other reported values for heteroatom
doped graphene catalyst. [ 70,71 ] The relatively higher kinetic
and diffusion current density, along with the 4e − pathway of
the N-HrGO-10 demonstrates its great potential to replace
the commercial Pt/C catalyst for ORR.
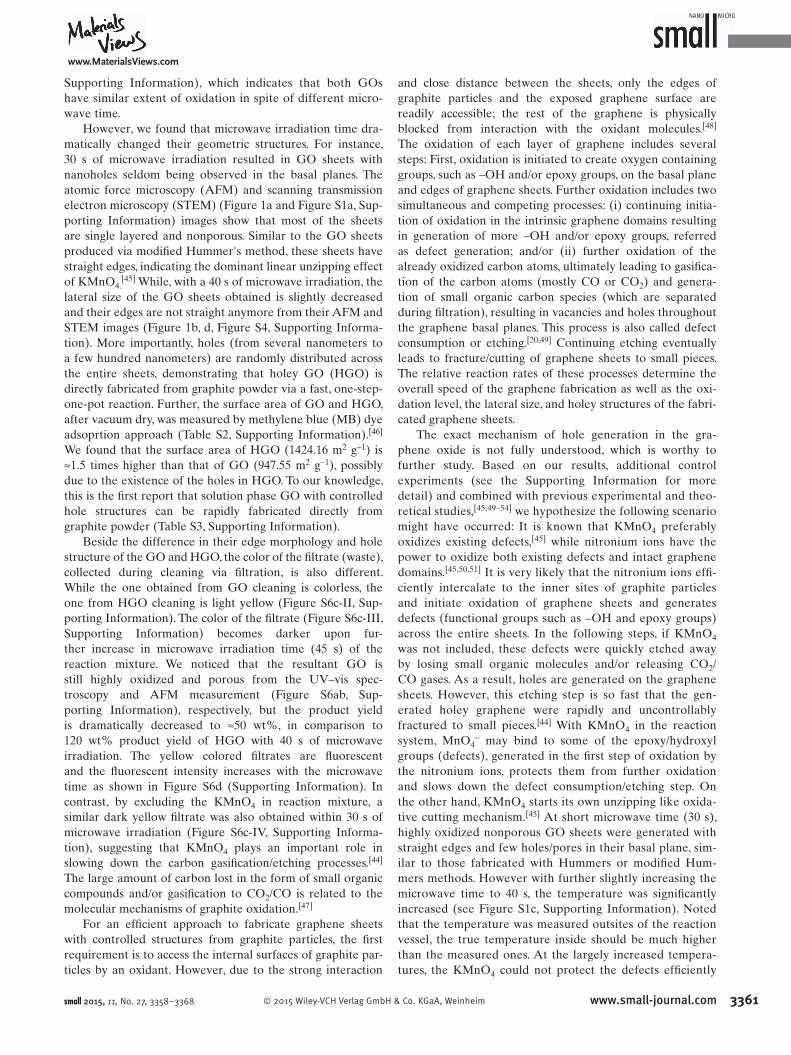
Electrochemical impedance spectroscopy (EIS) studies
were performed for N-HrGO-10, N-rGO-10, EC-HrGO, and
Pt/C modifi ed electrodes, respectively, to understand the
underlying physics associated with their electroreduction
catalytic activity. It is reported that the high frequency part in
an EIS ( Figure 6 a), is attributed to the interfacial resistance
at the surface of the active electrode, middle frequency part
corresponds to the charge transfer resistance, and the low
frequency part is related to the impedance from the diffu-
sion of electrolyte and O 2 through the catalysts. [ 43 ] The fi tting
of the EIS using a modifi ed randles equivalent circuit shows
that N-HrGO-10 has a similar charge transfer resistance,
interfacial resistance, and oxygen/electrolyte diffusion resist-
ance to the Pt/C electrodes. The nonporous N-rGO-10 shows
much higher diffusion resistance, further demonstrating that
the hole structures of graphene promotes better oxygen dif-
fusion to the surface of electrode so that the redox reaction
can be performed more effi ciently. Based on these results
we can conclude that the porous structure and N-doping
in N-HrGO-10 attribute for better electrocatalytic activity
toward ORR.
For practical applications, the catalyst must have good
catalytic activity along with good stability and durability. The
durability of N-HrGO-10 with respect to commercial Pt/C
was assessed through chronoamperometric measurements
at −0.38 V (vs Ag/AgCl) in an O 2 saturated 0.1 m KOH at
a rotation rate of 1600 rpm. From the Figure 6 b we can see
that, while more than 50% of the original activity of the
Pt/C is lost within 4 h, the N-HrGO-10 loses only ≈7% of its
original activity after 7 h, demonstrating that the N-HrGO-10
have far better durability. We also performed methanol cross
over test to check stability of N-HrGO-10 and Pt/C against
methanol. From Figure 6 c, we can see that Pt/C loses its
≈35% of its original activity in the presence of methanol due
to blockage of the active sites on Pt nanoparticle by meth-
anol adsorption, [ 72 ] while the introduction of methanol does
not affect the ORR activity of N-HrGO-10, shows better sta-
bility against methanol cross over effect and great potential
to replace Pt/C as a metal free catalysts.
3. Conclusion
In summary, by replacing traditional heating to microwave
irradiation, holey graphene oxide sheets or graphene oxide
sheets without holes can be controllably, directly, and rap-
idly (tens of seconds) fabricated from graphite powder
via a one-step-one-pot reaction with a production yield of
120 wt% of graphite. Again by taking advantage of the
unique heating mechanism of microwave irradiation, a fast
and low temperature approach to fabricate solution proces-
sible N doped graphene is developed. The N-doped holey
graphene sheets (N-HrGO-10) demonstrated remarkable
electro-catalytic capabilities for the electrochemical ORR.
The existence of the nanoholes not only provides a “short
cut” for effi cient mass transport, but also creates more
catalytic centers due to the increased surface area and
edges associated with the nanoholes. For the fi rst time, we
experimentally measure the effective diffusion constant of
O 2 for N-HrGO-10 and N-rGO-10, which quantitatively
demonstrates that the hole structures on the basal plane
of graphene indeed contributed to the enhanced diffusion
of oxygen in N-HrGO-10. Although the onset potential of
N-HrGO-10 for ORR is slight negative in comparison to
that of commercial Pt/C catalysts, the N-HrGO-10 shows
much better stability and durability against methanol poi-
soning. The capability for rapid fabrication and N-doping of
holey GO can lead us to develop effi cient catalysts which
can replace precious coin metals for energy generation and
storage, such as fuel cells and metal–air batteries.
4. Experimental Section
Synthesis of GO and HGO : Graphite powder (20 mg, Sigma-Aldrich, ≤20 µm lateral size) was mixed with concentrated sulfuric acid (8 mL, 98%, ACS grade) in a round bottom fl ask. The mixture
Figure 6. a) Nyquist plot of EIS for the oxygen reduction on the bare electrode, EC-HrGO, N-rGO-10, N-HrGO-10, and Pt/C. b) Durability testing of the Pt/C and N-HrGO-10 electrode for ≈7 h at −0.38 V and 1000 rpm speed. c) Chronoamperometric response of the N-HrGO-10 and Pt/C modifi ed electrode for ORR upon addition of methanol after about ≈300 s at −0.38 V. All potentials are measured using Ag/AgCl as a reference electrode.
small 2015, 11, No. 27, 3358–3368

www.MaterialsViews.com
3367© 2015 Wiley-VCH Verlag GmbH & Co. KGaA, Weinheim www.small-journal.comsmall 2015, 11, No. 27, 3358–3368
is then swirled and cooled in an ice bath for approximately 5 min. Then concentrated nitric acid (2 mL, 70%, ACS grade) was added and again cooled in ice bath for approximately 5 min. After that KMnO 4 (100 mg, ACS grade) was added to the ice cooled acid mixture. The entire mixture was swirled and mixed for another 30 s and placed into a microwave reactor chamber (CEM Discover-SP). The reaction mixture was subjected to microwave irradiation (300 W) for different time to produce GO and HGO. 30 s of micro-wave results in GO, while 40 s of microwave results in HGO. Sub-sequently, after microwave irradiation, the mixture is transferred to 200 mL of ice containing 5 mL of 35% H 2 O 2 to quench the reac-tion and then fi ltered through polycarbonate fi lter paper (0.2 µm pore size) follow by washing with diluted hydrochloric acid (≈4%) and deionized (DI) water. A colloidal graphene oxide (HGO and GO) solution is obtained by mild bath sonication (≈30 min). The dis-persion obtained is then left undisturbed for seven days to let the unexfoliated graphite particles precipitate out. The supernatant was carefully decanted and this solution is stable for months in water without signifi cant precipitation.
N Doping of GO and HGO : HGO or GO (3 mL, 0.55 mg mL −1 ) was mixed with concentrated ammonium hydroxide (3 mL, 29.2%, ACS plus grade) in pyrex tube and sealed with Tefl on cap. This mix-ture is heated in microwave at 120 °C for different time (5, 10, 15, 30 min) with the pressure limit set to 15 bars, which resulted into nitrogen doping and simultaneously reduction of GO and HGO to form N-rGO- x and N-HrGO- x , respectively, where x denotes micro-wave reaction time. After the reaction, the mixture is cooled down to 50 °C and neutralized with sulfuric acid in order to precipitate out the product and then dialyzed with 12 kD membrane dialysis tube with DI water to remove any salt residues. Finally, the product was centrifuged and bath-sonicated to redisperse in water to achieve desired concentration.
Material Characterization : The morphology of the graphene samples were studied by using Tapping mode AFM Nanoscope-IIIa Multimode scanning probe microscope system (Digital Instruments, Bruker) with a J scanner and STEM/SEM (Hitachi S-4800). The sample for AFM and SEM was prepared by simple drop casting of sample on freshly cleaved mica surface and Cu tape, respectively, and allowed it for air dry. The sample for STEM was also prepared by drop casting a sample (2 µL) on carbon sup-ported Cu grid (400 meshes, type or company) and allowed it to dry in air. X-ray photoelectron spectroscopy (XPS) characteriza-tion was performed after depositing a layer of all kinds of cata-lysts onto a gold fi lm (a 100 nm gold layer was sputter-coated on silicon with a 10 nm Ti adhesion layer). The thickness of the fi lm on the gold substrates was roughly 30–50 nm. XPS spectra were acquired using a Thermo Scientifi c K-Alpha system with a mono-chromatic Al Kα x-ray source (hν = 1486.7 eV). For data analysis, Shirley background subtraction was performed, and the spectra were fi t with Gaussian/Lorentzian peaks using a minimum devia-tion curvefi tting method (part of the Avantage software package). The surface composition of each species was determined by the integrated peak areas and the Scofi eld sensitivity factor provided by the Avantage software. Absorption spectra were recorded on a Cary 5000 UV–vis-NIR spectrophotometer in the double beam mode using a 1 cm quartz cuvette. Raman spectra of the samples (deposited on anodisc membrane) were collected using Raman Microscope (Confocal) – Wi-Tec, Alpha 300-M+ with an excitation laser at 785 nm. FT-IR spectra of the samples (deposited on CaF 2
windows) were acquired with a Perkin Elmer Spotlight 300 system using the transmission mode. The surface area of GO, HGO, N-rGO-10, and N-HrGO-10 is measured by methylene blue (MB) adsop-tion method and descried in detail in the Supporting Information.
Electrochemical Measurements : All the ORR experiments were conducted by using a computer-controlled potentiostat (CHI 760C, CH Instrument, USA) with a typical three-electrode cell. A platinum wire and saturated Ag/AgCl electrode is used as the counter-elec-trode and the reference electrode, respectively, in all measure-ment. A glassy carbon electrode was used as a working electrode and was polished each time prior to use with alumina slurry. All of the catalysts (≈2 mg) were dispersed in 25% ethanol (1 mL) containing nafi on (0.5 wt%) by bath sonication. Then 2 µL of this dispersion was loaded on glassy carbon electrode and allowed to dry in vacuum. Before each testing, the electrolyte (0.1 M KOH) was saturated with oxygen (O 2 ) by bubbling O 2 for 30 min. Cyclic vol-tammogram experiments were typically performed at the scan rate of 50 mV s −1 in O 2 saturated 0.1 M KOH. For control experiments in (nitrogen) N 2 saturated KOH, N 2 was bubbled in 0.1 M KOH for 30 min, while other conditions remain unchanged. RDE experi-ments were performed using glassy carbon disc electrode (3 mm diameter) in O 2 saturated 0.1 M KOH with different rotation speed varying from 250 to 2500 rpm and 10 mV s −1 scan rate. For a com-parison, the commercially available Johnson Matthey (JM) Pt/C 40 wt% (Johnson Matthey Corp., Pt loading: 40 wt% Pt on carbon) electrode was also prepared similarly to other catalyst as above mentioned. For the RRDE measurement, catalyst and electrodes are prepared by the same method as RDE measurement, except using RRDE electrode (GC disc and Pt ring electrode). The chrono-amperometry experiment was conducted by measuring current for 25 000 s at −0.38 V potential and at 1000 rpm rotation speed with continues maintaining oxygen fl ow to avoid any oxygen concentra-tion effect. For methanol cross over effect, we conducted another amperometric experiment for 700 s with same experiment condi-tion as above, except 2 mL of methanol was added at 300 s during the experiment. The electrochemical impedance spectra (ESI) for ORR on the catalyst electrodes are measured in O 2 -saturated 0.1 M KOH solution at −0.31 V versus Ag/AgCl.
Supporting Information
Supporting Information is available from the Wiley Online Library or from the author.
Acknowledgements
This material is based upon work supported by the National Science Foundation under Grant Nos. STTR 1346496 and CBET 1438493.
[1] H. S. Chen , T. N. Cong , W. Yang , C. Q. Tan , Y. L. Li , Y. L. Ding , Prog. Nat. Sci. 2009 , 19 , 291 .
[2] S. Chu , A. Majumdar , Nature 2012 , 488 , 294 . [3] D. Linden , Handbook of Batteries and Fuel Cells , McGraw Hill
Higher Education , New York 1984 .

full paperswww.MaterialsViews.com
3368 www.small-journal.com © 2015 Wiley-VCH Verlag GmbH & Co. KGaA, Weinheim
[4] D. S. Yu , E. Nagelli , F. Du , L. M. Dai , J. Phys. Chem. Lett. 2010 , 1 , 2165 . [5] R. L. Liu , D. Q. Wu , X. L. Feng , K. Mullen , Angew. Chem., Int.
Ed. 2010 , 49 , 2565 . [6] L. T. Qu , Y. Liu , J. B. Baek , L. M. Dai , ACS Nano 2010 , 4 , 1321 . [7] K. P. Gong , F. Du , Z. H. Xia , M. Durstock , L. M. Dai , Science 2009 ,
323 , 760 . [8] R. I. Jafri , N. Rajalakshmi , S. Ramaprabhu , J. Power Sources 2010 ,
195 , 8080 . [9] T. C. Nagaiah , S. Kundu , M. Bron , M. Muhler , W. Schuhmann ,
Electrochem. Commun. 2010 , 12 , 338 . [10] R. K. Joshi , P. Carbone , F. C. Wang , V. G. Kravets , Y. Su , I. V. Grigorieva ,
H. A. Wu , A. K. Geim , R. R. Nair , Science 2014 , 343 , 752 . [11] J. Bai , X. Zhong , S. Jiang , Y. Huang , X. Duan , Nat. Nano-
technol. 2010 , 5 , 190 . [12] P. Kuhn , A. Forget , D. Su , A. Thomas , M. Antonietti , J. Am. Chem.
Soc. 2008 , 130 , 13333 . [13] M. Bieri , M. Treier , J. Cai , K. Ait-Mansour , P. Ruffi eux , O. Groning ,
P. Groning , M. Kastler , R. Rieger , X. Feng , K. Mullen , R. Fasel , Chem. Commun. 2009 , 45 , 6919 .
[14] O. Akhavan , ACS Nano 2010 , 4 , 4174 . [15] M. D. Fischbein , M. Drndic , Appl. Phys. Lett. 2008 , 93 , 113107 . [16] Y. Zhu , S. Murali , M. D. Stoller , K. J. Ganesh , W. Cai , P. J. Ferreira ,
A. Pirkle , R. M. Wallace , K. A. Cychosz , M. Thommes , D. Su , E. A. Stach , R. S. Ruoff , Science 2011 , 332 , 1537 .
[17] S. Wang , F. Tristan , D. Minami , T. Fujimori , R. Cruz-Silva , M. Terrones , K. Takeuchi , K. Teshima , F. Rodríguez-Reinoso , M. Endo , Carbon 2014 , 76 , 220 .
[18] X. Zhao , C. M. Hayner , M. C. Kung , H. H. Kung , ACS Nano 2011 , 5 , 8739 . [19] X. Wang , L. Jiao , K. Sheng , C. Li , L. Dai , G. Shi , Sci. Rep. 2013 , 3 , 1996 . [20] T. H. Han , Y. K. Huang , A. T. Tan , V. P. Dravid , J. Huang , J. Am.
Chem. Soc. 2011 , 133 , 15264 . [21] Y. Zhao , C. Hu , L. Song , L. Wang , G. Shi , L. Dai , L. Qu , Energy
Environ. Sci. 2014 , 7 , 1913 . [22] Y. Lin , K. A. Watson , J.-W. Kim , D. W. Baggett , D. C. Working ,
J. W. Connell , Nanoscale 2013 , 5 , 7814 . [23] D. Zhou , Y. Cui , P.-W. Xiao , M.-Y. Jiang , B.-H. Han , Nat.
Commun. 2014 , 5 , 4716 . [24] X. Li , H. Wang , J. T. Robinson , H. Sanchez , G. Diankov , H. Dai ,
J. Am. Chem. Soc. 2009 , 131 , 15939 . [25] Y. Xue , D. Yu , L. Dai , R. Wang , D. Li , A. Roy , F. Lu , H. Chen , Y. Liu ,
J. Qu , Phys. Chem. Chem. Phys. 2013 , 15 , 12220 . [26] C. Zhang , N. Mahmood , H. Yin , F. Liu , Y. Hou , Adv. Mater. 2013 ,
25 , 4932 . [27] H. Wang , Y. Zhou , D. Wu , L. Liao , S. Zhao , H. Peng , Z. Liu ,
Small 2013 , 9 , 1316 . [28] H. B. Wang , M. S. Xie , L. Thia , A. Fisher , X. Wang , J. Phys. Chem.
Lett. 2014 , 5 , 119 . [29] H. B. Wang , T. Maiyalagan , X. Wang , ACS Catal. 2012 , 2 , 781 . [30] T. Hu , X. Sun , H. Sun , G. Xin , D. Shao , C. Liu , J. Lian , Phys. Chem.
Chem. Phys. 2014 , 16 , 1060 . [31] D. W. Chang , E. K. Lee , E. Y. Park , H. Yu , H. J. Choi , I. Y. Jeon ,
G. J. Sohn , D. Shin , N. Park , J. H. Oh , L. Dai , J. B. Baek , J. Am. Chem. Soc. 2013 , 135 , 8981 .
[32] Y. Y. Shao , S. Zhang , M. H. Engelhard , G. S. Li , G. C. Shao , Y. Wang , J. Liu , I. A. Aksay , Y. H. Lin , J. Mater. Chem. 2010 , 20 , 7491 .
[33] Z. Yang , Z. Yao , G. Li , G. Fang , H. Nie , Z. Liu , X. Zhou , X. a. Chen , S. Huang , ACS Nano 2011 , 6 , 205 .
[34] B. Zhang , Z. Wen , S. Ci , S. Mao , J. Chen , Z. He , ACS Appl. Mater. Interfaces 2014 , 6 , 7464 .
[35] L. Chen , R. Du , J. Zhu , Y. Mao , C. Xue , N. Zhang , Y. Hou , J. Zhang , T. Yi , Small , DOI 10.1002/smll.201402472 .
[36] Z. S. Wu , W. C. Ren , L. Xu , F. Li , H. M. Cheng , ACS Nano 2011 , 5 , 5463 . [37] L. Panchakarla , K. Subrahmanyam , S. Saha , A. Govindaraj ,
H. Krishnamurthy , U. Waghmare , C. Rao , Adv. Mater. 2009 , 21 , 4726 .
[38] A. L. Reddy , A. Srivastava , S. R. Gowda , H. Gullapalli , M. Dubey , P. M. Ajayan , ACS Nano 2010 , 4 , 6337 .
[39] D. H. Deng , X. L. Pan , L. A. Yu , Y. Cui , Y. P. Jiang , J. Qi , W. X. Li , Q. A. Fu , X. C. Ma , Q. K. Xue , G. Q. Sun , X. H. Bao , Chem. Mater. 2011 , 23 , 1188 .
[40] X. R. Wang , X. L. Li , L. Zhang , Y. Yoon , P. K. Weber , H. L. Wang , J. Guo , H. J. Dai , Science 2009 , 324 , 768 .
[41] H. L. Guo , P. Su , X. F. Kang , S. K. Ning , J. Mater. Chem. A 2013 , 1 , 2248 . [42] Z. H. Sheng , L. Shao , J. J. Chen , W. J. Bao , F. B. Wang , X. H. Xia ,
ACS Nano 2011 , 5 , 4350 . [43] Z. Q. Jiang , Z. J. Jiang , X. N. Tian , W. H. Chen , J. Mater. Chem.
A 2014 , 2 , 441 . [44] M. A. Patel , H. Yang , P. L. Chiu , D. D. Mastrogiovanni ,
C. R. Flach , K. Savaram , L. Gomez , A. Hemnarine , R. Mendelsohn , E. Garfunkel , H. Jiang , H. He , ACS Nano 2013 , 7 , 8147 .
[45] D. V. Kosynkin , A. L. Higginbotham , A. Sinitskii , J. R. Lomeda , A. Dimiev , B. K. Price , J. M. Tour , Nature 2009 , 458 , 872 .
[46] S. H. Aboutalebi , R. Jalili , D. Esrafi lzadeh , M. Salari , Z. Gholamvand , S. Aminorroaya Yamini , K. Konstantinov , R. L. Shepherd , J. Chen , S. E. Moulton , ACS Nano 2014 , 8 , 2456 .
[47] A. Bagri , C. Mattevi , M. Acik , Y. J. Chabal , M. Chhowalla , V. B. Shenoy , Nat. Chem. 2010 , 2 , 581 .
[48] A. M. Dimiev , J. M. Tour , ACS Nano 2014 , 8 , 3060 . [49] K. J. Ziegler , Z. Gu , H. Peng , E. L. Flor , R. H. Hauge , R. E. Smalley ,
J. Am. Chem. Soc. 2005 , 127 , 1541 . [50] J. Liu , A. G. Rinzler , H. J. Dai , J. H. Hafner , R. K. Bradley , P. J. Boul ,
A. Lu , T. Iverson , K. Shelimov , C. B. Huffman , F. Rodriguez-Macias , Y. S. Shon , T. R. Lee , D. T. Colbert , R. E. Smalley , Science 1998 , 280 , 1253 .
[51] Z. Y. Chen , K. Kobashi , U. Rauwald , R. Booker , H. Fan , W. F. Hwang , J. M. Tour , J. Am. Chem. Soc. 2006 , 128 , 10568 .
[52] J.-L. Li , K. N. Kudin , M. J. McAllister , R. K. Prud’homme , I. A. Aksay , R. Car , Phys. Rev. Lett. 2006 , 96 , 176101 .
[53] T. Sun , S. Fabris , Nano Lett. 2012 , 12 , 17 . [54] Z. Y. Li , W. H. Zhang , Y. Luo , J. L. Yang , J. G. Hou , J. Am. Chem.
Soc. 2009 , 131 , 6320 . [55] P. Tang , G. Hu , Y. Gao , W. Li , S. Yao , Z. Liu , D. Ma , Sci. Rep. 2014 ,
4 , 5901 . [56] Y. Zhang , K. Fugane , T. Mori , L. Niu , J. Ye , J. Mater. Chem. 2012 ,
22 , 6575 . [57] L. F. Lai , J. R. Potts , D. Zhan , L. Wang , C. K. Poh , C. H. Tang ,
H. Gong , Z. X. Shen , L. Y. Jianyi , R. S. Ruoff , Energy Environ. Sci. 2012 , 5 , 7936 .
[58] Y. Jiao , Y. Zheng , M. Jaroniec , S. Z. Qiao , J. Am. Chem. Soc. 2014 , 136 , 4394 .
[59] Y. Sun , C. Li , G. Shi , J. Mater. Chem. 2012 , 22 , 12810 . [60] X.-K. Kong , C. L. Chen , Q. W. Chen , Chem. Soc. Rev. 2014 , 43 , 2841 . [61] S. Navalon , A. Dhakshinamoorthy , M. Alvaro , H. Garcia , Chem.
Rev. 2014 , 114 , 6179 . [62] K. Gong , F. Du , Z. Xia , M. Durstock , L. Dai , Science 2009 , 323 , 760 . [63] K. A. Kurak , A. B. Anderson , J. Phys. Chem. C 2009 , 113 , 6730 . [64] C. V. Rao , C. R. Cabrera , Y. Ishikawa , J. Phys. Chem. Lett. 2010 , 1 , 2622 . [65] L. P. Zhang , Z. H. Xia , J. Phys. Chem. C 2011 , 115 , 11170 . [66] X. Y. Peng , X. X. Liu , D. Diamond , K. T. Lau , Carbon 2011 , 49 , 3488 . [67] S. Y. Wang , D. S. Yu , L. M. Dai , D. W. Chang , J. B. Baek , ACS
Nano 2011 , 5 , 6202 . [68] Z. Lin , G. Waller , Y. Liu , M. Liu , C. P. Wong , Adv. Energy
Mater. 2012 , 2 , 884 . [69] R. Liu , D. Wu , X. Feng , K. Mullen , Angew. Chem. 2010 , 49 , 2565 . [70] K. Moses , V. Kiran , S. Sampath , C. N. Rao , Chem. Asian J. 2014 , 9 ,
838 . [71] Y. Zheng , Y. Jiao , L. Ge , M. Jaroniec , S. Z. Qiao , Angew.
Chem. 2013 , 52 , 3110 . [72] Y. Zhang , Q. H. Huang , Z. Q. Zou , J. F. Yang , W. Vogel , H. Yang ,
J. Phys. Chem. C 2010 , 114 , 6860 .
Received: November 14, 2014 Revised: December 27, 2014 Published online: February 12, 2015
small 2015, 11, No. 27, 3358–3368


![Research Article A Novel One-Pot and One-Step Microwave ...zolidin--ones under microwave irradiation [ ]. First, the , -o xazolidin--one derived from racemic -amino--propanol was prepared](https://img.dokumen.tips/doc/110x75/60bbb0718628f8592a606876/research-article-a-novel-one-pot-and-one-step-microwave-zolidin-ones-under.jpg)