Embed Size (px)
Citation preview
Microwave-assisted Production of Activated Carbon from
Pulp Mill Sludge with White Liquor
By
Azadeh Bagherzadeh Namazi
A thesis submitted in conformity with the requirements
for the degree of Doctor of Philosophy
Graduate Department of Chemical Engineering and Applied Chemistry
University of Toronto
© Copyright by Azadeh Bagherzadeh Namazi 2014
ii
Microwave-assisted Production of Activated Carbon from Pulp
Mill Sludge with White Liquor
Azadeh Bagherzadeh Namazi
Chemical Engineering and Applied Chemistry
University of Toronto
2014
Abstract
This work establishes the technical feasibility of producing a value added product,
activated carbon, from a waste stream, pulp mill sludge, using white liquor as the activating
agent and microwaves as the energy source. The work also demonstrates the potential of the
sludge-derived activated carbon in removing bioactive compounds in pulp mill effluents that
affect fish production. Readily available at kraft mills, white liquor is able to convert sludge into
activated carbon with a specific surface area (SSA) of 650 m2/g. While NaOH in white liquor
creates pores in the carbon from sludge, other two components of white liquor, Na2S and
Na2CO3, inhibit the activation process. Porosities of activated carbon produced with microwave
oven and conventional furnace are comparable. The use of microwaves reduces the activation
time from hours to minutes. However, strong microwave absorbers, such as NaOH and KOH,
are needed for pyrolysis and activation, since pulp mill sludge and wood polymers are weak
microwave absorbers with tan δ < 0.1. Adding 1 wt% of KOH to the dried sludge enables a
uniform and complete pyrolysis. With microwaves, however, the retained carbon is 20% lower
than that with conventional heating, likely due to the higher heating rate with microwaves.
iii
NaOH is more effective than KOH in creating porosity in the carbon from pulp mill sludge. The
SSA achieved from NaOH activation in both microwave oven and conventional furnace is
consistently over 2000 m2/g. Secondary sludge is more suitable than primary sludge as the raw
material for activated carbon. A pressure-based temperature probe is designed, constructed and
used to measure sample temperatures during microwave heating. Measured temperatures are in
agreement with temperatures simulated with a 3-D model developed using COMSOL
multiphysics 4.4. The model also reveals that microwave-heated samples lack uniformity in
temperature.
iv
Acknowledgements
I wish to express my sincere gratitude to all those who have helped make this thesis possible.
First and foremost, I would like to thank my supervisors Prof. Charles Jia and Prof. Grant Allen
for their continuous support, motivation, guidance, and knowledge through these years. Special
and sincere thanks are due to my supervisory committee members, Prof. Donald Kirk, Prof. Hongi
Tran, and Prof. Ramin Farnood for their advice, feedback and comments. In addition, I would like
to thank Prof. Ajay K. Dalai for acting as the external examiner in my final defense.
I would like to thanks the former and current members of the Green technology group,
especially Dr. Eric Morris, Jonathon Caguiat, Jocelyn Zuliani, and Prof. Tong for their useful
advice and comments. Also I would like to thank my friends in Prof. Allen’s lab. My special
gratitude goes out to Dr. Yalda Azimi and Rosanna Kronfli. I thank Prof. Sinclair for his
assistance in providing COMSOL software. Special thanks go to Ron Hutcheon and Amr Sobhi
for their advice on microwave experiments. The administrative and technical staffs in the
Department of Chemical Engineering & Applied Chemistry were always there to help me in a
friendly manner. I especially thank Mary Butera and Pauline Martini for their assistance.
I would also like to acknowledge FPInnovations for their support and collaboration. They
supported me through providing the facilities required for operating adsorption experiments on
bioactive effluent. Specifically, I thank Dr. Pierre Martel and Tibor Kovacs for their assistance.
I wish to pay a very special thanks to my family, in particular, my mom, my lovely
daughter, and my brother for their endless inspiration and encouragement. Mom, I cannot thank
you enough for all the support, sacrifices, and love you have given me throughout my life.
Finally, words cannot express the thanks I owe to my best friend, best teacher, and my
husband, Sam, for his endless love, support, and patience through these years. His encouragement
has been a major contribution in starting and achieving the goals of this work. This work is
dedicated to Sam Roshdi, who is the most knowledgeable, patient, and lovable teacher I have ever
had. Azadeh Namazi
July 2014
v
Table of Contents
1 Overview ___________________________________________________________ 1
1.1 Introduction __________________________________________________________ 1
1.2 Objectives ___________________________________________________________ 3
1.3 Hypotheses __________________________________________________________ 3
1.4 Thesis outline ________________________________________________________ 4
2 Literature Review ____________________________________________________ 6
2.1 Pulp mill sludge ______________________________________________________ 6
2.2 Kraft pulp mill process _________________________________________________ 7
2.3 Activated carbon ______________________________________________________ 8
2.3.1 Raw materials for activated carbon production ______________________________ 9
2.4 Pyrolysis ____________________________________________________________9
2.5 Activation reaction ___________________________________________________ 10
2.6 Production of activated carbon from lignocelluosic wastes ____________________ 12
2.6.1 Effect of the raw material characteristics __________________________________ 12
2.6.2 Effect of the activating agents ___________________________________________ 14
2.7 Production of activated carbon by microwave radiation ______________________ 17
2.7.1 Microwave radiation __________________________________________________ 17
2.7.2 Dielectric properties __________________________________________________ 18
2.8 Numerical simulation of the microwave heating process ______________________ 20
2.8.1 Maxwell’s Equations _________________________________________________ 20
2.8.2 Heat transfer in microwaves ____________________________________________ 21
2.9 Advantages and challenges of microwave heating ___________________________ 22
2.10 Microwave pyrolysis __________________________________________________ 25
2.11 Char production from biomass by microwave pyrolysis ______________________ 27
vi
2.12 Production of activated carbon by microwaves _____________________________ 28
2.13 Estimate the cost of production using microwaves and conventional ____________ 29
2.14 Removal of the pulp mill effluent compounds that affect fish reproduction _______ 30
2.15 Significance of the research ____________________________________________ 34
3 Production and Characterization of Lignocellulosic Biomass-derived Activated
carbon_____________________________________________________________ 35
3.1 Introduction _________________________________________________________ 36
3.2 Material and methods _________________________________________________ 38
3.2.1 Materials ___________________________________________________________ 38
3.2.2 Activation procedure __________________________________________________ 39
3.2.3 Analytical techniques _________________________________________________ 40
3.2.4 Adsorption experiments _______________________________________________ 41
3.3 Results and discussion ________________________________________________ 42
3.3.1 Characterization of raw materials ________________________________________ 42
3.3.2 DSC-TGA analyses ___________________________________________________ 43
3.3.3 SEM micrographs ____________________________________________________ 45
3.3.4 Specific surface area and yields of lignocellulosic biomass-derived activated carbon45
3.3.5 Effects of activation conditions on specific surface area (SSA) _________________ 47
3.3.6 Pore size distribution analysis of activated carbon ___________________________ 50
3.3.7 FTIR analysis of the produced activated carbon_____________________________ 51
3.3.8 Adsorption experiments of methylene blue ________________________________ 53
3.3.9 Comparison of physical and chemical activation of lignin waste ________________ 60
3.4 Conclusions _________________________________________________________ 61
4 Microwave-assisted Pyrolysis and Activation of Pulp Mill Sludge Using Alkali
Hydroxides _________________________________________________________ 63
4.1 Introduction _________________________________________________________ 64
vii
4.2 Materials and methods ________________________________________________ 66
4.2.1 Characterization of two sludge samples ___________________________________ 66
4.2.2 Microwave pyrolysis set-up ____________________________________________ 67
4.2.3 Microwave activation set-up ____________________________________________ 69
4.2.4 Specific surface area measurement _______________________________________ 70
4.2.5 Comparison of microwave and furnace activation ___________________________ 70
4.3 Results and discussion ________________________________________________ 70
4.3.1 Characterization of the biomasses _______________________________________ 70
4.3.2 The uniform heating of lignocellulosic biomasses with microwave pyrolysis ______ 71
4.3.3 Effect of the density of the biomass samples on retained carbon content _________ 72
4.3.4 SEM micrograph of microwave pyrolyzed and activated sludge ________________ 76
4.3.5 Effect of microwave oven and furnace pyrolysis on retained carbon of sludge _____ 77
4.3.6 Microwave activation of pulp mill sludge _________________________________ 80
4.3.7 Conventional furnace activation _________________________________________ 86
4.4 Conclusions _________________________________________________________ 93
5 Temperature Distribution in Microwave Heating of Biomass Materials ______ 95
5.1 Introduction _________________________________________________________ 95
5.2 Material and methods _________________________________________________ 97
5.2.1 Materials ___________________________________________________________ 97
5.2.2 Measurement of dielectric constant of biomass materials _____________________ 97
5.2.3 Measurement of temperature inside the microwave oven _____________________ 98
5.2.4 Simulation of temperature profile with COMSOL 4.4 ________________________ 99
5.3 Results and discussion _______________________________________________ 102
5.3.1 Characterization of the biomasses ______________________________________ 102
5.3.2 Measurement of sample temperature during microwave heating with pressure
probe_____________________________________________________________ 105
5.3.3 Simulation of temperature profile during microwave heating _________________ 111
viii
5.4 Conclusions ________________________________________________________ 128
6 Effect of Chemical Components in White Liquor on Carbon Activation _____ 130
6.1 Introduction ________________________________________________________ 131
6.2 Material and methods ________________________________________________ 133
6.2.1 Materials __________________________________________________________ 133
6.2.2 Analytical techniques and procedures ___________________________________ 134
6.2.3 FactSage software for thermodynamic simulation __________________________ 135
6.3 Results and discussion _______________________________________________ 136
6.3.1 Surface area and activation yield (%) analyses_____________________________ 136
6.3.2 Thermodynamic analyses of white liquor-carbon reaction using FactSage and HSC141
6.3.3 Experimental comparison of white liquor, Na2S-NaOH, Na2CO3–NaOH and NaOH as
the activating agent __________________________________________________ 145
6.3.4 NaOH-Na2CO3-Na2S Phase diagram ____________________________________ 145
6.3.5 Elemental analyses of the white liquor-activated carbon _____________________ 146
6.3.6 XRD analyses of activated carbon produced by NaOH and white liquor activation 148
6.4 Conclusions ________________________________________________________ 150
7 Feasibility Study of Utilizing Pulp Mill Sludge-derived Activated Carbon to
Remediate the Effect of Effluent on Fish Reproduction ___________________ 152
7.1 Introduction ________________________________________________________ 152
7.2 Materials and methods _______________________________________________ 155
7.2.1 Production and characterization of pulp mill sludge-derived activated carbon ____ 155
7.2.2 Adsorption of organic compounds from effluent by sludge-derived activated
carbon_____ _______________________________________________________ 156
7.2.3 Fish reproduction tests with activated carbon-treated effluents ________________ 157
7.3 Results and discussions _______________________________________________ 160
7.3.1 Production and characterization of activated carbon from pulp mill sludge ______ 160
7.3.2 Adsorption of dissolved organics from the pulp mill effluent by activated carbon _ 162

ix
7.3.3 Effect of activated carbon treated effluent on fish reproduction _______________ 164
7.4 Conclusions ________________________________________________________ 167
8 Overall Conclusions ________________________________________________ 168
9 Implications and Recommendations ___________________________________ 170
References_______________________________________________________________174
Appendices_ _____________________________________________________________ 191

x
Nomenclature
P Power dissipated
E rms Root mean square of the electrical field
H rms Root mean square of the magnetic field
Dp Penetration depth
C Specific heat capacity
C Carbon
H Hydrogen
O Oxygen
S Sulfur
N Nitrogen
k Thermal conductivity
T Temperature
m Mass
V Volume
t Time
W Watt
P Power
h convection coefficient
Greek letters
ε∗ Complex permittivity
ε′ Dielectric constant
ε″ Electric loss factor
ε0 Electric permittivity of free space
εeff ″ Effective dielectric loss factor
μ0 Magnetic permeability of free space
μeff ″ Effective magnetic loss factor
tan δ Loss tangent
ω Angular frequency
α Attenuation factor
ρ Density
π Mathematical constant
ϕ Porosity
µr Magnetic permeability
σ Electric conductivity
Wave vector in free space
f Frequency
xi
Acronyms
BET Brunauer Emmett Teller
TGA Thermo Gravimetric Analysis
SEM Scanning Electric Microscopy
SSA Specific Surface Area
XRD X-ray Diffraction
HSC Thermodynamic software
FactSage Software for thermodynamic calculations
UV-vis Ultraviolet-visible spectroscopy
GC Gas chromatography
MB Methylene Blue
FTIR Fourier Transform Infrared Spectroscopy
LIN Linerboard recycled sludge
CM Cow manure
NKS News and kraft secondary sludge
NKP News and kraft primary sludge
TMB Tembec sludge
PS 50-50 Mixed sludge (50%primary -50% secondary)
PS 70-30 Mixed sludge (70% primary-30% secondary)
Overall yield (%) Ratio of activated carbon weight to the dried sludge weight
Activation yield (%) Ratio of activated carbon weight to the char weight
Carbonization yield (%) Ratio of char weight to the dried raw material weight
Retained carbon (%) Ratio of carbon percentage in the char to the raw material
xii
List of Tables
Table 2.1. Compositions of pulp mill sludge (Kim et al. 2000) ..................................................... 7
Table 2.2. Elemental analysis of cellulose, hemicellulose, and lignin (Cagnon et al. 2009) ....... 13
Table 2.3. Dielectric loss tangent of carbonaceous materials (Menéndez et al. 2010)................. 19
Table 2.4. Properties of activated carbon produced by microwave chemical activation of
agricultural residues (Hoseinzadeh Hesas et al. 2013b) ............................................................... 28
Table 2.5. Economic analyses of production of activated carbon by conventional method ......... 29
Table 2.6. Organic wood extractive concentrations (µg/L) in the pulp and paper effluent
(Wartman t al. 2009) ..................................................................................................................... 33
Table 3.1. Characteristics of the six raw materials ....................................................................... 43
Table 3.2. MB adsorption isotherm coefficients ........................................................................... 56
Table 3.3. Comparison of MB adsorption by various activated carbons from literature.............. 59
Table 3.4. Properties of the raw materials and produced activated carbon .................................. 60
Table 3.5. Properties of activated carbon produced by CO2- physical activation ........................ 60
Table 3.6. Properties of activated carbon produced by KOH- chemical activation ..................... 61
Table 4.1. Wood polymers contents of the sludge samples .......................................................... 71
Table 4.2. Characteristics of dried pulp mill sludge samples ....................................................... 71
Table 4.3. NaOH and KOH conventional furnace activation comparison with literature values . 92
Table 5.1. Wood polymers contents of the sludge samples ........................................................ 102
Table 5.2. Characteristics of pulp mill sludge samples .............................................................. 102
xiii
Table 5.3. Dielectric properties of the sludge samples and wood polymers ............................... 104
Table 5.4. Comparison of dielectric properties of several biomasses and char .......................... 104
Table 5.5. Properties of the materials used in the model ........................................................... 113
Table 5.6. The properties of wood polymers used for the simulation ........................................ 123
Table 6.1. White liquor composition after recovery process at pulp mills ................................. 132
Table 6.2. Proximate and ultimate analyses of pulp mill sludge ................................................ 133
Table 6.3. Five activating agents used for thermodynamic simulations ..................................... 136
Table 6.4. List of the components considered for FactSage modeling ....................................... 136
Table 6.5. The amount of the compounds at equilibrium predicted by FactSage for five reaction
systems of hydroxide, carbonate and hydroxide, sulfide and hydroxide, carbonate, sulfide and
hydroxide and white liquor-C ..................................................................................................... 142
Table 6.6. Properties of activated carbon produced with three activating agents....................... 145
Table 7.1. Characteristics of two bio-treated thermo-mechanical pulp mill effluents ................ 158
Table 7.2. Characteristics of activated carbon columns ............................................................. 159
Table 7.3. Characteristics of three pulp mill sludges .................................................................. 160
Table 7.4. Yield (%) of carbonization and activation processes ................................................. 161
Table 7.5. Comparison of the yield of KOH activation at 600 °C for 2 h from literature .......... 161
Table 7.6. Specific surface area (SSA) and porosity of activated carbon applied for the removal
of compounds affecting fish reproduction .................................................................................. 162
Table 7.7. GC indices of activated carbon treated effluents and P-value ................................... 163
Table 7.8. Conditions of activated carbon treatments (1-100g/L) .............................................. 165
xiv
List of Figures
Figure 1.1. The relationship of the key elements in this research................................................... 4
Figure 2.3. Interaction of materials with microwave radiation (Yuen & Hameed 2009) ............. 18
Figure 2.4. Comparison of conventional and microwave heating (Kappe et al. 2009) ................ 22
Figure 2.5. Plasma formation during microwave heating of a biomass char: (a) ball lighting and
(b) arc discharge (Fernández et al. 2011) ..................................................................................... 23
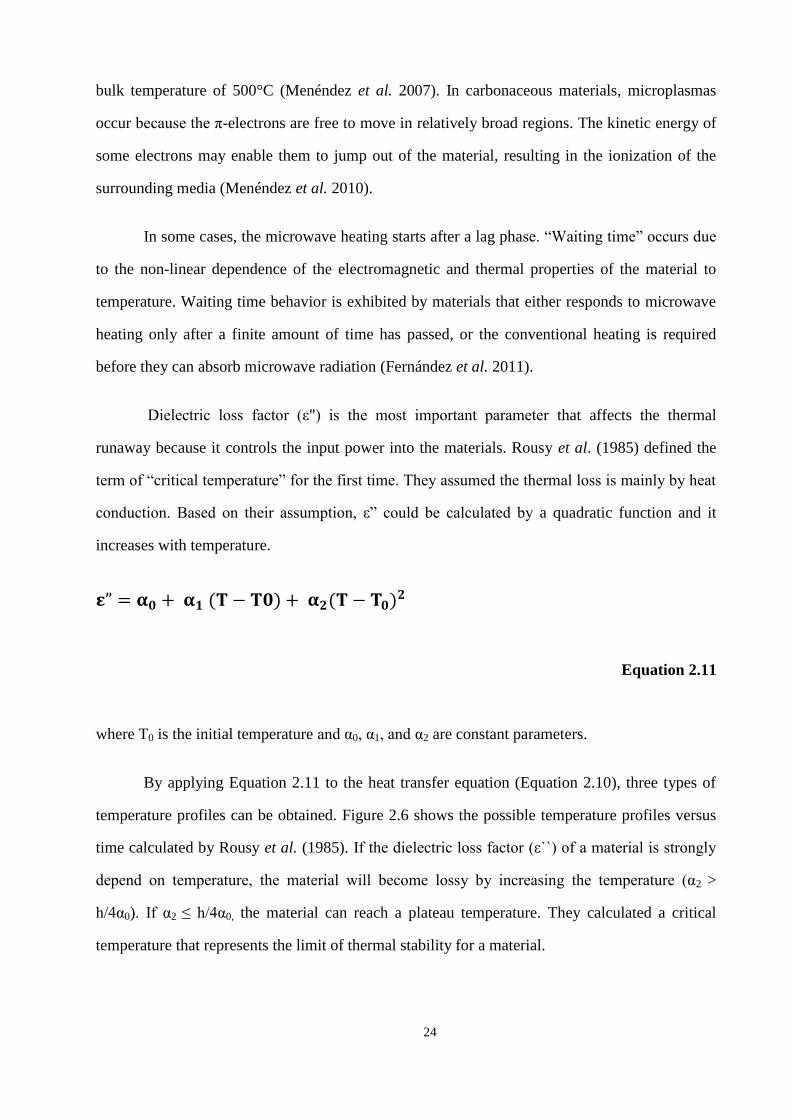
Figure 2.6. Theoretical temperature response of the microwave irradiated granular materials
versus time (Rousy et al. 1985) .................................................................................................... 25
Figure 2.7. Different plant sterols in the pulp mill effluent .......................................................... 31
Figure 3.1. Activated carbon production procedure ..................................................................... 40
Figure 3.3. SEM micrographs of (A) raw secondary sludge, (B) activated carbon produced from
secondary sludge, (C) activated carbon produced from primary sludge and (D) activated carbon
produced from cow manure (600C, 2h, KOH:C=2) .................................................................... 47
Figure 3.4. Effect of activation temperature on SSA .................................................................... 49
Figure 3.5. Effect of KOH:C ratio on SSA ................................................................................... 49
Figure 3.6. Effect of activation time on SSA ................................................................................ 50
Figure 3.7. Effect of activation conditions on pore size distribution (A) Activation temperature
effect, (B) Activating agent ratio effect, (C) Activation time effect ............................................. 51
Figure 3.8. Analysis of FTIR spectra of activated carbon products (A) activation time effect, (B)
activation temperature effect, and (C) KOH:C effect ................................................................... 53
Figure 3.9. Adsorption kinetic of MB by four selected activated carbon. Error bars indicate
plus/minus one standard deviation. ............................................................................................... 55
xv
Figure 3.10. Langmuir isotherm of MB adsorption by Linerboard activated carbon, cow manure
activated carbon, NKS activated carbon, and NKP activated carbon ........................................... 56
Figure 4.1. Microwave pyrolysis set up 1- Microwave cavity 2- Quartz reactor 3- Capillary
column 4- brass hole 5- Pressure gauge 6- outlet for gases 7- Magnetron ................................... 68
Figure 4.2. Microwave activation set-up 1- Microwave cavity 2- Pyrex shield 3- Crucible 4-
Nitrogen inlet 5- Brass hole 6- Gases outlet 7- Magnetron .......................................................... 69
Figure 4.3. Pellet (A) and powder (B) of the pulp mill sludge after addition of KOH and three
min microwave pyrolysis .............................................................................................................. 72
Figure 4.4. Effect of (A) the sludge, (B) lignin and (C) cellulose density on retained carbon (%)
in microwave pyrolysis ................................................................................................................. 74
Figure 4.5. Effect of temperature on retained carbon content of the (A) sludge, (B) lignin and (C)
cellulose in conventional furnace.................................................................................................. 76
Figure 4.6. SEM micrographs of (A) the pyrolysed pulp mill sludge (B) KOH- activated carbon
using microwaves.......................................................................................................................... 77
Figure 4.7. Effect of pyrolysis time on retained carbon (%) for PS50-50 and sludge PS70-30
(error bars are standard deviation) ................................................................................................ 78
Figure 4.8. Effect of conventional pyrolysis time on the retained carbon (%) of PS50-50 and
PS70-30 ......................................................................................................................................... 79
Figure 4.9. Effect of added KOH (%) on retained carbon (%) ..................................................... 80
Figure 4.10. Effect of activation time on the surface area of activated carbon produced by one
step activation (activation without prior pyrolysis) for 5 gr dried sludge..................................... 81
xvi
Figure 4.11. Effect of (A) KOH:C mass ratio, (B) activation time and (C) power level on the
activation yield (%) (gray bars) and SSA (black bars) of the produced activated carbon using
microwaves (5 gr char was used for each experiment) ................................................................. 83
Figure 4.12. Effect of (A) NaOH:C mass ratio, (B) activation time and (C) power level on the
activation yield (gray bars) and SSA (black bars) of the produced activated carbon with
microwaves (5 gr char was used in each experiment) .................................................................. 85
Figure 4.13. Effect of activation conditions (activation time, KOH ratio and temperature) on the
activation yield (%) (gray bars) and SSA (black bars) of the produced activated carbon with
furnace........................................................................................................................................... 88
Figure 4.14. Effect of activation conditions (NaOH:C mass ratio, activation time and activation
temperature) on activation yield (%) (gray bars) and SSA (black bars) of the produced activated
carbon with furnace....................................................................................................................... 90
Figure 5.2. The position of the capillaries inside the microwave oven and the quartz reactor ..... 99
Figure 5.3. Relationship between temperature and pressure in conventional furnace measured
with three pressure probes (calibration curves) for 20 gr dried sludge....................................... 105
Figure 5.4. Temperature profiles of sludge pyrolysis in microwave oven measured by three
pressure probes (no bulb, small bulb, and large bulb capillaries were used with medium power
and 5 wt% KOH added for 20 gr dried sludge) .......................................................................... 106
Figure 5.5. Effect of capillary type on the plateau temperature measured with the three pressure
probes for 20 gr dried sludge ...................................................................................................... 107
Figure 5.6. Temperature profile of sludge pyrolysis in microwave with on and off after 6, 8, and
18 minutes for 20 gr dried sludge ............................................................................................... 108
Figure 5.7. Temperature profiles of PS 50-50 for the power level of medium (600 W) and high
(1200 W) during pyrolysis (5% KOH, 20 gr dried sludge) ........................................................ 109
xvii
Figure 5.8. Temperature profiles of PS 50-50 by adding 1 wt.%, 5 wt.% and 10 wt.% KOH
during pyrolysis (medium power,20 gr dried sludge) ................................................................. 110
Figure 5.9. Temperature profiles of the PS 50-50 (solid line) and PS 70-30 (dash line) during
heating with a microwave for 8 min (5% KOH, 20 gr dried sludge) .......................................... 110
Figure 5.10. (A) The electric field norm distribution inside microwave P=1200 W (B) The
electric field norm on the yz surface of the reactor center .......................................................... 112
Figure 5.12. Predicted temperature profiles of carbon, PS50-50, and PS70-30 at the center of the
samples ........................................................................................................................................ 115
Figure 5.13. Effect of the three boundary conditions on the predicted temperature profiles at the
center of the sludge ..................................................................................................................... 116
Figure 5.14. Effect of the carbon volume on the predicted temperature profiles at the center of
the samples with volumes of 235 cm3 and 117.5 cm
3................................................................. 117
Figure 5.15. Effect of the sludge thermal conductivity on the predicted temperatures at the center
of the sample (with thermal conductivity of 0.1 and 0.8 w/m.K) ............................................... 118
Figure 5.16. Effect of the sludge heat capacity on the predicted temperatures at the center of the
sample (with the heat capacity of 0.5 and 1 kJ/kg.K) ................................................................. 119
Figure 5.17. Effect of the sludge porosity on the predicted temperature profiles at the center of
the sample (with the 15 and 50% porosity when the top surface is in contact with the air) ....... 120
Figure 5.18. Predicted temperature distributions of sludge and carbon along the reactor center
line and center diameter after 8 min of heating .......................................................................... 122
Figure 5.20. The electric field distribution inside microwave oven for a vertical reactor .......... 125
Figure 5.21. Effect of reactor orientation on temperature distributions of sludge, the vertical and
horizontal reactor after 8 min of heating ..................................................................................... 126
xviii
Figure 5.22. Temperature distribution in the furnace (A) 3-D temperature distribution after 7 min
of heating (B) 2-D temperature distribution in the center diameter of the reactor during 1 to 20
min (60-1200 s) of heating .......................................................................................................... 128
Figure 6.1. Production of activated carbon process ................................................................... 134
Figure 6.2. Effect of activation conditions (A) activation time (B) activation temperature, and
(C) NaOH:C mass ratio on SSA (black bars) of activated carbon and activation yield (%) (grey
bars)............................................................................................................................................. 138
Figure 6.3. Effect of activation conditions (A) activation time (B) activation temperature, and
(C) white liquor:C mass ratio on the SSA (black bars) and activation yield (%) (grey bars) of
white liquor derived activated carbon ......................................................................................... 140
Figure 6.6. Effect of the activation temperature (A) and activation time (B) on the elemental
contents of activated carbon before and after washing (in legend %C: Carbon, %S: Sulfur, %N:
Nitrogen, %R: other compounds) ............................................................................................... 148
Figure 6.7. XRD analysis of unwashed activated carbon with NaOH:C mass ratio of 2:1, 1000
°C ................................................................................................................................................ 149
Figure 6.8. XRD analysis of the unwashed activated carbon white liquor: C mass ratio of 4:1,
1000°C ........................................................................................................................................ 149
Figure 6.9. XRD analysis of the unwashed activated carbon white liquor:C mass ratio of 4:1,600
°C ................................................................................................................................................ 150
Figure 7.1. GC profiles and GC indices of effluent and activated carbon treated effluents ....... 163
Figure 7.2. Fish reproduction test results- control I and II showed the reproduction in water. For
each test the carbon dosage and contact time are :A 1g/L and 0.05 min, B 5g/L and 0.054min, C
10g/L and 0.054min, D 10 g/L and 0.054min, E 50g/L and 3.41min, F 100g/L and 6.27 min . 165
xix
List of Appendices
Appendix A-Power distribution inside microwave oven ___________________________ 191
Appendix B- Mesh for the simulation studies ___________________________________ 193
Appendix C-HSC simulations of four reactions __________________________________ 193
Appendix D- Economic analyses of activated carbon production with microwaves and
conventional furnace _________________________________________________ 196
Appendix E- Statistical tests for microwave activation ____________________________ 200
Appendix F- Pore size distribution and pore volume of KOH and NaOH activation _____ 201
1
1 Overview
1.1 Introduction
Pulp mill sludge is a waste generated by both primary and secondary treatments in the
pulp and paper industry. The Canadian pulp and paper industry produced 7.1 million tonnes of
the dry sludge in 1995 (Mahmood & Elliott 2006) disposed by combustion or landfilling. The
traditional waste disposal systems are no longer desirable and resulted in a demand for effective
and environmental friendly options (Smith et al. 2009). The waste management cost in the pulp
and paper industry is high due to the large quantity of the waste produced every day. Therefore
transformation of the sludge materials into value added products would be a great benefit
(Krigstin & Sain 2006).
Conversion of pulp mill sludge into activated carbon could potentially reduce the
disposable sludge and capture contaminants at the mills with activated carbon. Currently the
sludge is being burned in most pulp mills which causes environmental impacts and greenhouse
gas emissions (GHGs) (Monte et al. 2009). The production of char from industrial or municipal
wastes is possible (Khalili et al. 2000).
The production of activated carbon from wood and coconut shells is well studied;
however, similar research on lignocellulosic wastes such as pulp-mill sludge is rather limited
(Khalili et al. 2000). In particular, no systematic studies investigated the conversion of pulp mill
sludge into activated carbon. In the production process of activated carbon from pulp mill
sludge, the choice of activating agent, activation process, and suitable raw material control the
economics of the process (Hoseinzadeh Hesas et al. 2013b). Among the popular activating
agents, potassium hydroxide (KOH) is very effective in producing activated carbon with the high
surface area (Díaz-Terán et al. 2003; Okada et al. 2003; Otowa et al. 1997)
In recent years, microwave radiation has been applied to many thermal processes because
of its advantages of the shorter processing time and volumetric heating. It is expected that
microwave heating of pulp mill sludge will reduces the processing time. Although the
2
temperature distribution inside the heated material needs to be investigated by experimental
analyses and numerical modeling to improve the understanding of the complex microwave
heating mechanism (Menéndez et al. 2010; Fernandez et al. 2011).
The conventional methods for production of activated carbon are time consuming (Smith
et al. 2009). Production of activated carbon by microwave heating could be beneficial in terms
of processing time. The properties of activated carbon produced with microwaves and a
conventional furnace need to be analyzed and compared. In terms of activating agents, KOH and
NaOH have been widely used for activation of the biomass with conventional heating methods,
although their differences are not clearly understood. More research is needed to elucidate their
effects on carbon activation with conventional furnace and microwaves.
There is a possibility of using white liquor (i.e., the cooking liquor that contains NaOH
and Na2S) as the activating agent for activated carbon production. The recovery process of white
liquor, which is established at kraft pulp mills for many years, can possibly make the activated
carbon production economical, because one of the major costs of activated carbon production is
the cost of activating agent. The recovered white liquor contains Na2CO3, Na2SO4, Na2SO3, and
Na2S2O3 in addition to its main chemicals NaOH and Na2S. No research has been done on the
production of activated carbon with white liquor, but similar pure activating agents (i.e., NaOH
and Na2CO3) have been used for the chemical activation.
Activated carbon has many potential applications in pulp mills. For instance, some of the
pulp mill effluents affect fish reproduction. Studies demonstrated that the hormonal changes in
fish caused the lower egg production capacity, smaller gonad size, delayed sexual maturity, and
expression of secondary sex characteristics (Fentress et al. 2006; Hewitt et al. 2008). Although
considerable effort has been made to address this issue, the sources and responsible compounds
at some pulp mills remain unclear. Pulp mill effluents originating from wood, biodegradation
products, and chemical products have been possibly involved in the endocrine disruption in fish.
Either an additional effluent treatment step or modification in pulp mill processes could possibly
eliminate the disruption effect of these compounds. The sources at the pulp mill are unknown;
3
therefore, the process modification option is not practically feasible. So far, there is not much
work done on removal technologies of the compounds that affect fish reproduction. Activated
carbon seems to be one of the possible options for removal of these compounds.
1.2 Objectives
The overall goal of this research is to analyze the technical feasibility of producing
activated carbon from pulp mill sludge with microwaves as the energy source and white liquor
as the activating agent. Specifically the objectives are as follow:
Investigate the feasibility of activated carbon production from various pulp mill sludge
samples by KOH-chemical activation;
Analyze the feasibility of microwave pyrolysis and activation with KOH and NaOH;
Compare the properties of char and activated carbon produced with the microwave oven and
conventional furnace;
Compare the temperature distribution of samples heated in a microwave oven and a
conventional furnace;
Analyze the activation of pulp mill sludge with white liquor and compare it with NaOH-
activation; and
Test the removal of the effluent compounds that affect fish reproduction.
1.3 Hypotheses
The four main hypotheses of this research are:
1. Pulp mill sludge can be converted into activated carbon by chemical activation.
2. Microwave radiation is more efficient than the conventional furnace in the production
of activated carbon.
4
3. White liquor can be used as an activating agent for the production of activated carbon
from pulp mill sludge and the properties of white liquor-activated carbon are comparable with
that of NaOH-activated carbon.
4. Sludge-derived activated carbon can be used for removal of the effluent compounds
that affect fish reproduction.
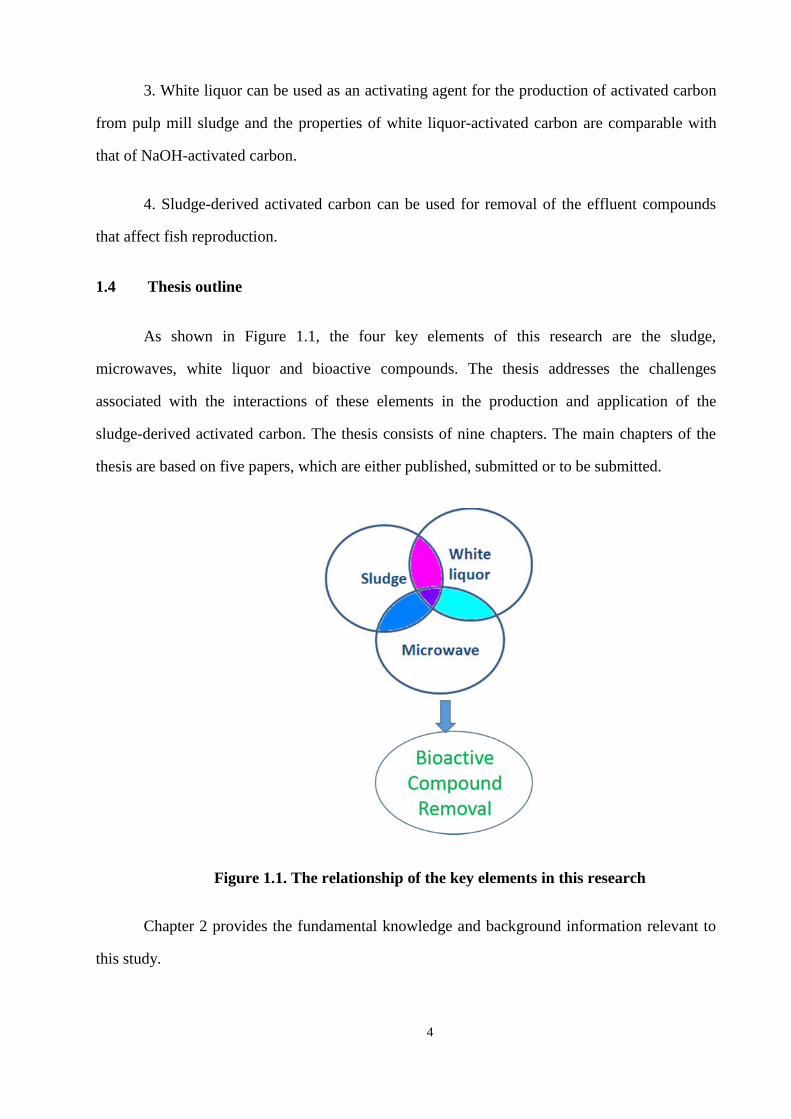
1.4 Thesis outline
As shown in Figure 1.1, the four key elements of this research are the sludge,
microwaves, white liquor and bioactive compounds. The thesis addresses the challenges
associated with the interactions of these elements in the production and application of the
sludge-derived activated carbon. The thesis consists of nine chapters. The main chapters of the
thesis are based on five papers, which are either published, submitted or to be submitted.
Figure 1.1. The relationship of the key elements in this research
Chapter 2 provides the fundamental knowledge and background information relevant to
this study.
5
Chapter 3 includes the technical feasibility of activated carbon production from various
pulp mill sludge samples and compares the quality of activated products.
Chapter 4 analyzes the char and activated carbon from microwave pyrolysis and
activation and compares them with that of conventional furnace.
Chapter 5 investigates the temperature distribution of samples in microwave oven and
conventional furnace with experiments and numerical modeling using COMSOL Multiphysics
4.4.
Chapter 6 describes the activation of pulp mill sludge using white liquor as the activating
agent and compares it with NaOH-activation.
Chapter 7 discusses the utilization of produced activated carbon for the removal of the
compounds that affect fish reproduction in pulp mill effluents.
Chapter 8 presents the overall conclusions and major findings.
Chapter 9 summarizes the recommendations for the future work, and implications of this
research.
6
2 Literature Review
2.1 Pulp mill sludge
Generally, 35% of the raw materials that enter paper mills turn into residue (Scott &
Smith 1995). There are two types of residues, the primary sludge and secondary sludge. Primary
sludge, which is mainly composed of cellulose, hemicellulose and fillers, is the collected
residues from the screens and filters of the primary settling tanks employed in wastewater
treatment. Secondary sludge is generated in the secondary wastewater treatment process, where
wastewater organic matter is broken down by means of the biodegradation. The main component
of primary and secondary sludge is water. Sludge dewatering is often required prior to
landfilling or incineration, hence dewatering is of utmost importance for pulp mills. The high
woody organic material content of primary sludge makes the dewatering process easier
compared to secondary sludge. Some pulp mills mix primary and secondary sludges together to
improve the mechanical dewatering process; however, the high ratios of secondary sludge to
primary one make the dewatering process challenging and expensive (Mahmood & Elliott 2006).
The four major types of sludge at the pulp mills are: (1) primary sludge, produced in the process
of extracting virgin wood fiber; (2) de-inking paper sludge, produced in the process of removing
inks from recycled paper; (3) secondary sludge, produced in the secondary biological wastewater
treatment process; and (4) combined primary and secondary sludge. The mixed sludge from
primary and secondary treatment is a muddy mass consisting of microorganisms, fibrous
material, lignin, mineral components (limestone and phosphorous), clay, inert solids rejected
during the recovery process, ash, and water (Monte et al. 2009). Table 2.1 shows the two
examples of pulp mill sludge compositions.
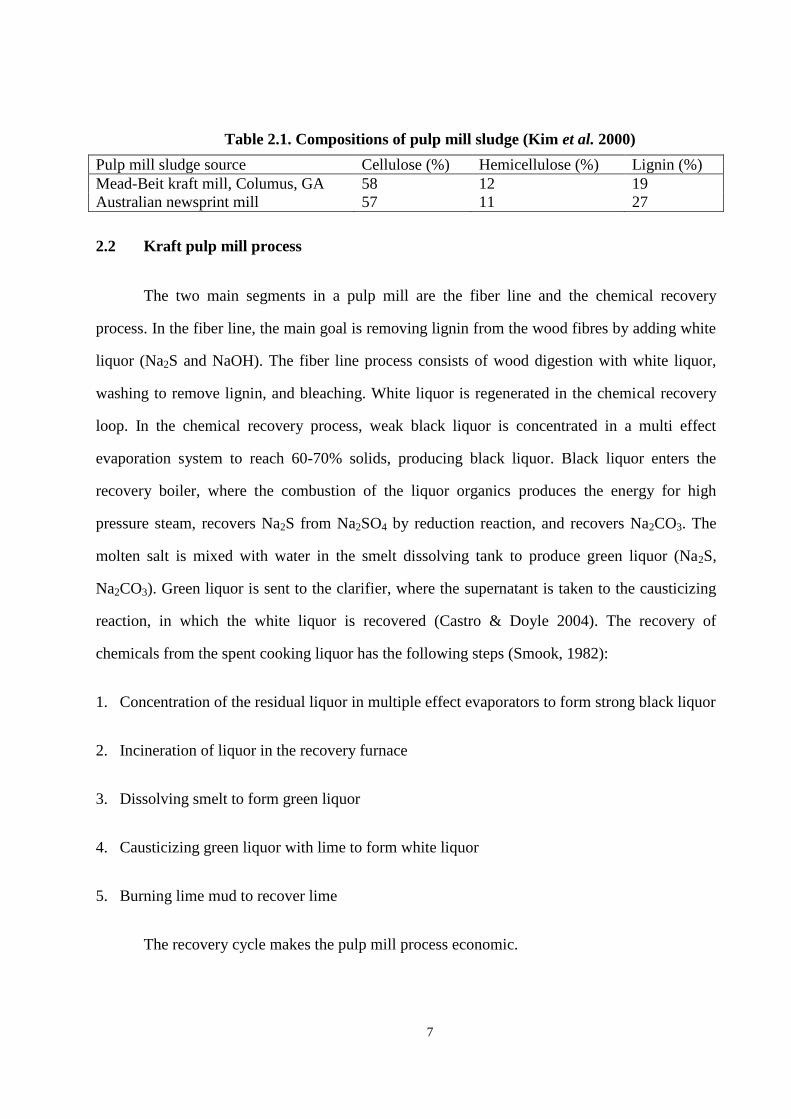
7
Table 2.1. Compositions of pulp mill sludge (Kim et al. 2000)
Pulp mill sludge source Cellulose (%) Hemicellulose (%) Lignin (%)
Mead-Beit kraft mill, Columus, GA 58 12 19
Australian newsprint mill 57 11 27
2.2 Kraft pulp mill process
The two main segments in a pulp mill are the fiber line and the chemical recovery
process. In the fiber line, the main goal is removing lignin from the wood fibres by adding white
liquor (Na2S and NaOH). The fiber line process consists of wood digestion with white liquor,
washing to remove lignin, and bleaching. White liquor is regenerated in the chemical recovery
loop. In the chemical recovery process, weak black liquor is concentrated in a multi effect
evaporation system to reach 60-70% solids, producing black liquor. Black liquor enters the
recovery boiler, where the combustion of the liquor organics produces the energy for high
pressure steam, recovers Na2S from Na2SO4 by reduction reaction, and recovers Na2CO3. The
molten salt is mixed with water in the smelt dissolving tank to produce green liquor (Na2S,
Na2CO3). Green liquor is sent to the clarifier, where the supernatant is taken to the causticizing
reaction, in which the white liquor is recovered (Castro & Doyle 2004). The recovery of
chemicals from the spent cooking liquor has the following steps (Smook, 1982):
1. Concentration of the residual liquor in multiple effect evaporators to form strong black liquor
2. Incineration of liquor in the recovery furnace
3. Dissolving smelt to form green liquor
4. Causticizing green liquor with lime to form white liquor
5. Burning lime mud to recover lime
The recovery cycle makes the pulp mill process economic.
8
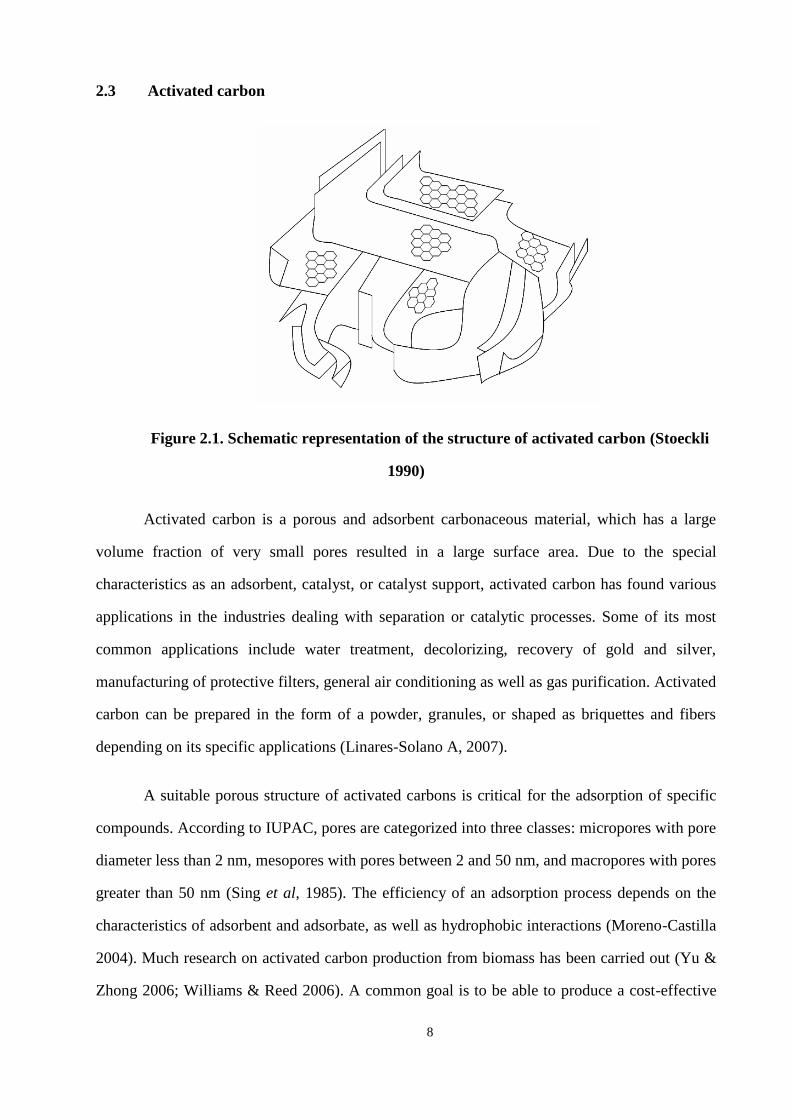
2.3 Activated carbon
Figure 2.1. Schematic representation of the structure of activated carbon (Stoeckli
1990)
Activated carbon is a porous and adsorbent carbonaceous material, which has a large
volume fraction of very small pores resulted in a large surface area. Due to the special
characteristics as an adsorbent, catalyst, or catalyst support, activated carbon has found various
applications in the industries dealing with separation or catalytic processes. Some of its most
common applications include water treatment, decolorizing, recovery of gold and silver,
manufacturing of protective filters, general air conditioning as well as gas purification. Activated
carbon can be prepared in the form of a powder, granules, or shaped as briquettes and fibers
depending on its specific applications (Linares-Solano A, 2007).
A suitable porous structure of activated carbons is critical for the adsorption of specific
compounds. According to IUPAC, pores are categorized into three classes: micropores with pore
diameter less than 2 nm, mesopores with pores between 2 and 50 nm, and macropores with pores
greater than 50 nm (Sing et al, 1985). The efficiency of an adsorption process depends on the
characteristics of adsorbent and adsorbate, as well as hydrophobic interactions (Moreno-Castilla
2004). Much research on activated carbon production from biomass has been carried out (Yu &
Zhong 2006; Williams & Reed 2006). A common goal is to be able to produce a cost-effective
9
adsorbent for the removal of toxic substances from air or water. It has been shown that enhanced
adsorption capacity toward specific pollutants depends on porous structure and surface
chemistry of activated carbon (Tsang et al. 2007; Yeganeh et al. 2006). These characteristics are
determined mainly by the raw material and activation conditions (Guo & Lua 1999; Lozano-
Castello et al. 2001).
2.3.1 Raw materials for activated carbon production
Activated carbon can be produced from variety of biomass sources such as coconut shell,
agricultural wastes (Girods et al. 2009; Yeganeh et al. 2006), coffee crops, etc. (Ahmad et al.
2007; Aci et al. 2008; Tay et al. 2009). In the past, available carbon sources such as wood, peat,
and vegetable waste were used as the raw material. Today, many industrial and agricultural
residues are investigated to be used as the raw material for activated carbon production. The
most important factors in choosing a biomass as a precursor for activated carbon production are
the availability, low inorganic content, price and chemical/physical properties (Nabais et al.
2008). The physical and chemical properties of activated carbon, such as surface area and bulk
density, vary with the nature of the precursors and the production process (Bansal et al. 1988).
2.4 Pyrolysis
Pyrolysis produces bio-oil, gases, and a solid char. The yield of pyrolysis depends on the
operating conditions and the equipment used (Dominguez et al. 2005). Primary and secondary
pyrolysis are two possible stages of pyrolysis process. During primary pyrolysis, the thermal
decomposition of the main components takes place and devolatilizes the material. This step
mainly involves dehydration, dehydrogenation, decarboxylation or decarbonization reactions.
During secondary pyrolysis, reactions between the volatiles release (homogeneous reactions), or
between the volatiles and the carbonaceous residue (heterogeneous reactions) occur. The second
step comprises processes such as cracking (thermal or catalytic). In cracking process, heavy
compounds break into gases, and char is converted into the gases such as CO, CO2, CH4 and H2.
The reaction with gasifying agents, partial oxidation, polymerization and condensation reactions
are involved in the cracking process (Dominguez et al. 2005).
10
Two important pyrolysis processes are: fast pyrolysis that yields high amounts of bio-oil
and carbonization that produce the char. In fast pyrolysis, biomass is subjected to the heat by fast
heating rates of the solid in moderate temperature ranges (500-600˚C) and short residence times
of the vapor-phase products to minimize the char production. The particle size reduction and
pre-drying are necessary since biomass and char are poor heat transfer media and evaporation is
an endothermic process (Conesa et al. 1998; Ciacci et al. 2010).
Pyrolysis is the first process in activated carbon production and involves heating the
material at a high temperature (up to 800°C) in an inert environment, which removes nitrogen,
oxygen, sulphur, and hydrogen in the form of volatile species. The remaining carbon atoms
comprise 85-95% of the material’s mass and group themselves as graphitic crystallites with
irregular forms. Carbonization results in the formation of interstitial voids which may become
filled with tar or disorganized carbon. These pores will be developed during the activation step
and result in a porous structure for an effective adsorption.
2.5 Activation reaction
There are, in principle, two methods for activation: physical and chemical activation. The
physical activation method involves the carbonization of a precursor at elevated temperatures
(500 – 800°C) under an inert atmosphere such as N2, followed by the activation of the resulting
material at high temperatures (800 – 1000°C), which promotes some reactions between the
activating gas (CO2 or steam) and carbon atoms of the char. The activating gas reaction with
carbon is shown in Equation (2.1) and (2.2).
2C + O2 → 2CO
Equation 2.1
C + H2O → CO + H2
Equation 2.2
11
In the chemical activation process, the precursor is impregnated with an activating agent
and the impregnated material is heated under inert atmosphere at lower temperatures (400 –
700°C). In this method, the carbonization step and the activation step can occur simultaneously.
Chemical agents are the dehydrating agents that influence the pyrolytic decomposition and
consequently result in the high yield of activated carbon. Activation is followed by the washing
and drying processes, which remove chemical agents from the final activated carbon.
Several advantages of the chemical activation method over the physical activation
method include the high surface area, relatively higher yield and lower activation temperature.
However, chemical activation methods also incorporate few disadvantages such as the corrosion
and some environmental issues due to the chemicals used in the process.
Chemical activation is widely used to generate activated carbon from carbon-containing
materials. Common chemical reagents for activation include ZnCl2, H2SO4, H3PO4 (Arjmand et
al. 2006; Solaimani & Kaghazchi, 2007), alkali metal hydroxides (KOH and NaOH), and alkali
metal carbonates such as K2CO3 (Linares-Solano et al. 2006). KOH is often the choice for
producing porous activated carbon (Guo & Lua 1999; Kawano et al. 2008). The overall reaction
between a carbon-containing precursor and KOH is often given as follows (Hayashi 2000):
6KOH + 2C —> 2K + 3H2 + 2K2CO3
Equation 2.3
The temperature at which activation begins and the degree of pore development depend
not only on the activating agent but also on the nature of the precursor material (Tseng et al.
2007).
When activating by KOH, the development of surface area occurs through the two
processes. First, the removal of carbon occurs by the reaction between KOH and carbon (Otowa
et al. 1997; Mitani et al. 2004). Second, the removal of elemental K generated from KOH-C
reaction and intercalated into the carbon matrix (Raymundo-Piñero et al. 2005). The weight loss
12
during activation is caused by the carbon removal, while the removal of elemental K does not
significantly affect the weight loss. More pores are created by the removal of K.
2.6 Production of activated carbon from lignocelluosic wastes
Studies on activated carbon production from lignocellulosic wastes have been focused on
various activating agents, carbonization temperature, and the effect of raw material composition
on the produced activated carbon. It is necessary to gain the fundamental understanding of
carbonization and activation process parameters for lignocellulosic materials in order to establish
a suitable process for the conversion of pulp mill sludge into activated carbon (Cagnon et al.
2009).
2.6.1 Effect of the raw material characteristics
Chemical composition (cellulose, hemicellulose, and lignin) of lignocellulosic materials
affect their thermal decomposition behavior. Thermal decomposition of lignocellulosic material
demonstrated similar weight loss at 271 and 350C which is related to hemicellulose and
cellulose decompositions, respectively. Up to 400C, depolymerization and chain scission
through the ether and carbon-carbon bond control the decomposition. Lignin is thermally stable
and decomposes slowly over a broad range of temperatures (150-900C) (Reina et al. 1998).
Lignin contributes to production of char more than cellulose and hemicellulose. Lignin has an
aromatic cross-linked polymeric structure and total carbon atoms in its structure are higher than
cellulose and hemicellulose which leads to a different pattern of weight loss during pyrolysis
(Cagnon et al. 2009). Also its structure is similar to bitumen coal which makes lignin an ideal
candidate for activated carbon production (Suhas et al.2007).
Cagnon et al. (2009) investigated the contribution of lignocellulosic compositions on the
produced activated carbon with steam activation. Their results indicated that high lignin content
of the raw material is effective on the final product. All components, i.e. cellulose,
hemicelluloses, and lignin, contributed to activated carbon porosity. Thermogravimetric analyses
showed that the higher the hemicellulose and cellulose components are, the higher the mass loss
of raw materials during carbonization will be. This could be due to the higher oxygen content of
13
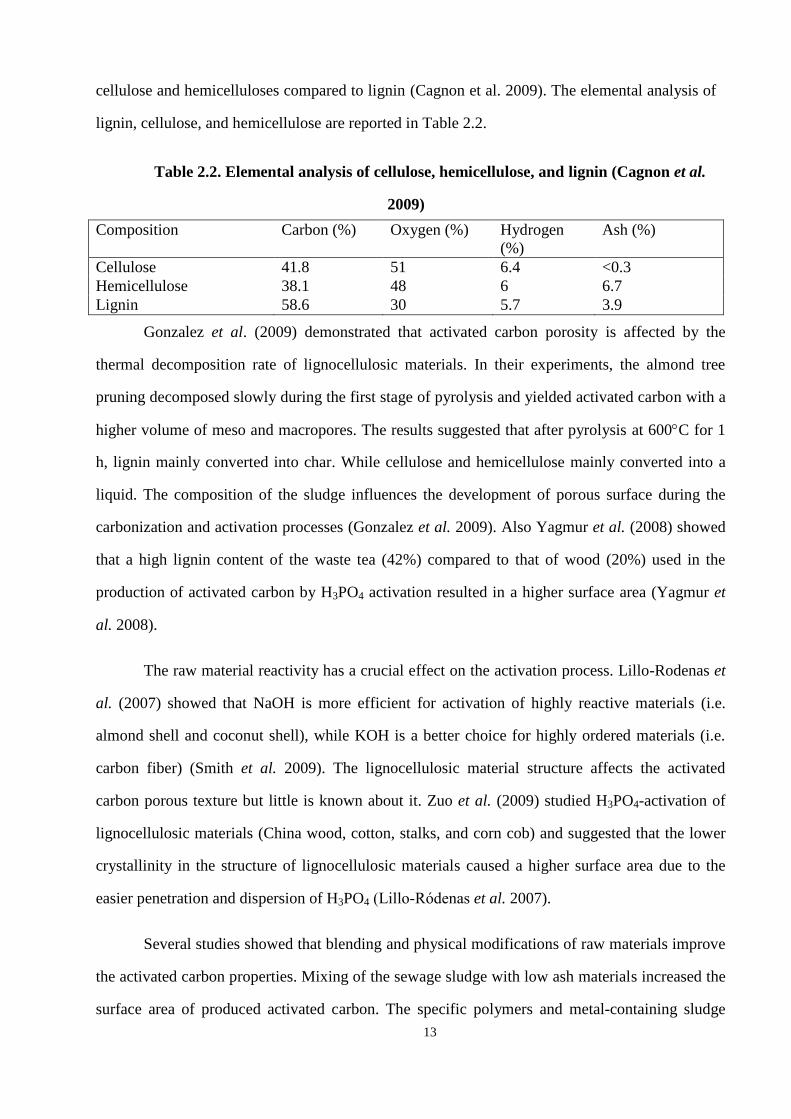
cellulose and hemicelluloses compared to lignin (Cagnon et al. 2009). The elemental analysis of
lignin, cellulose, and hemicellulose are reported in Table 2.2.
Table 2.2. Elemental analysis of cellulose, hemicellulose, and lignin (Cagnon et al.
2009)
Composition Carbon (%) Oxygen (%) Hydrogen
(%)
Ash (%)
Cellulose 41.8 51 6.4 <0.3
Hemicellulose 38.1 48 6 6.7
Lignin 58.6 30 5.7 3.9
Gonzalez et al. (2009) demonstrated that activated carbon porosity is affected by the
thermal decomposition rate of lignocellulosic materials. In their experiments, the almond tree
pruning decomposed slowly during the first stage of pyrolysis and yielded activated carbon with a
higher volume of meso and macropores. The results suggested that after pyrolysis at 600C for 1
h, lignin mainly converted into char. While cellulose and hemicellulose mainly converted into a
liquid. The composition of the sludge influences the development of porous surface during the
carbonization and activation processes (Gonzalez et al. 2009). Also Yagmur et al. (2008) showed
that a high lignin content of the waste tea (42%) compared to that of wood (20%) used in the
production of activated carbon by H3PO4 activation resulted in a higher surface area (Yagmur et
al. 2008).
The raw material reactivity has a crucial effect on the activation process. Lillo-Rodenas et
al. (2007) showed that NaOH is more efficient for activation of highly reactive materials (i.e.
almond shell and coconut shell), while KOH is a better choice for highly ordered materials (i.e.
carbon fiber) (Smith et al. 2009). The lignocellulosic material structure affects the activated
carbon porous texture but little is known about it. Zuo et al. (2009) studied H3PO4-activation of
lignocellulosic materials (China wood, cotton, stalks, and corn cob) and suggested that the lower
crystallinity in the structure of lignocellulosic materials caused a higher surface area due to the
easier penetration and dispersion of H3PO4 illo- denas et al. 2007).
Several studies showed that blending and physical modifications of raw materials improve
the activated carbon properties. Mixing of the sewage sludge with low ash materials increased the
surface area of produced activated carbon. The specific polymers and metal-containing sludge
14
blended with sewage sludge produced activated carbon with up to 10 times higher surface area
compared to pure sewage sludge (Smith et al. 2009a). Several physical modifications such as
washing with acid or water increased the surface area of the produced activated carbon.
Immersing the carbonized char into the water for 72h increased the surface area by 50%. The
possible explanation is that the reaction between the surface oxides in the large pores and water
molecules can create new micropores within large pores. Another possibility is the formation of
new cavities by alkali components.
Another method to produce activated carbon with high surface areas is reducing the
inorganic content of carbonaceous compounds in the raw materials. Ros et al. (2006) reported an
increase in the surface area of a char obtained from sewage sludge from 13 to 188 m2/g by HCl
washing. Also the ash content of the char decreased about 40% by acid washing, which induces a
higher surface area (Ros et al. 2006). Bagreev et al.’s (2001) studies on pyrolysis of sewage
sludge indicated that the acid washing could reduce the surface area of char, if the carbonization
temperature (400°C) is not high enough to fully carbonize the organic matters. Acid washing
increased the surface area of the sample carbonized at 800°C (Bagreev et al. 2001).
2.6.2 Effect of the activating agents
The activating agent is one of the important parameters that control the characteristics of
produced activated carbon. The most popular activating agents are KOH, NaOH, ZnCl2, K2CO3,
and H3PO4. The most effective activating agents in biomass activation are KOH and NaOH. Ros
et al. (2006) compared alkali hydroxides (KOH, NaOH) with H3PO4 and CO2 physical activation
of sewage sludge. The results indicated that H3PO4 and CO2 activation is not very effective for
the production of activated carbon. KOH and NaOH behaved similarly and produced activated
carbon with the SSA of 1686 and 1224 m2/g, respectively, when the activating agent ratio to char
was 3 (Ros et al. 2006). The highest surface area obtained from pulp mill sludge activation with
KOH was 1002 m2/g (with no pretreatment) reported by Kang et al. (2006). The reason for
achieving such a high surface area is that KOH and NaOH react with the carbon atoms while
acidic reagents react with oxygen functional groups (Hsu & Tseng, 2000).
15
H3PO4 has been widely used as an activating agent, although it is not a suitable activating
agent for sewage sludge activation since the highest obtained surface area was 289 m2/g (Zheng
et al. 2005). In the chemical activation of lignocellulosic materials with H3PO4, cross-linked
structure formation reduces volatile matter releases, tar formation, and the formation of small
pores. During pyrolysis, the volatiles derived from the thermal decomposition of lignocellulosic
materials diffused out of the pyrolyzing materials. The volatiles underwent the cracking or
polymerization within the formed char, due to the catalytic dehydration of phosphoric acid (Jibril
et al. 2008). The polymerization of volatiles produced the additional char that is perhaps
deposited on the surface of the char formed previously. Zuo et al. (2009) concluded that the
mesoporous structure and the high char yield during phosphoric acid activation can be explained
by the carbonization of volatiles.
For activation of pulp mill sludge, ZnCl2 chemical activation combined with physical
activation was used in several studies. They obtained a high surface area of 1294 m2/g when
using activating agent ratio of 2.5 (Littrell et al. 2002). Higher concentrations of ZnCl2 blocked
the micropores and resulted in the lower surface area. One of the limiting factors of using ZnCl2
is its boiling point of 732C. Pores mainly formed during volatilization of ZnCl2 and applying
temperatures higher than the boiling point is beneficial. In the activation of pulp mill sludge, K2S
has been more effective than ZnCl2 in terms of producing a higher SSA (Cho & Suzuki, 1980).
The other crucial factor in obtaining a high surface area is applying the two steps of
carbonization and activation. Carbonization generates pores while the pore development occurs
during activation. However, Lillo-Rodenas et al. (2007) studied the effect of coconut shell
pyrolysis prior to activation with KOH and NaOH and indicated that pyrolysis at 350C lowered
the SSA from 2000 to 1300m2/g when using NaOH.
It has been found that KOH is a better activating agent than NaOH due to its greater ionic
radius (0.266 nm for K+ compared to 0.190 nm for Na
+). The sewage sludge and coal tar pitch
were used as precursors for the activation at 800˚C for 1.5 h with the activating agent
concentration of 1 mol/L. The SSA, total pore volume, and pore size distribution of the products
16
from KOH and NaOH activation processes were 450 and 381 m2/g, 0.394 and 0.37 cm
3/g, and
38.72 and 36.72 Ǻ, respectively (Hwang et al. 2008). Macia-Agullo et al. (2007) found that Na
and K reduced metals can be removed from the carbon matrix by evaporation, but they may
partially intercalate in the carbon matrix, during the activation reaction. Moreover, Compared to
Na, K metals produce more intercalation compounds. Therefore, during the hydroxide
activation, K is more effective than Na. NaOH is reported to be more reactive with carbon
causing a lower yield, while KOH generated a more selective porosity of microspores (Maciá-
Agulló et al. 2007).
Jibril et al. (2008) investigated the effect of H3PO4 and KOH on the activated carbon
produced from lignocellulosic material (stem of date palm). While using KOH, the oxidation
occurred by increasing the temperature and resulted in a carbon layer separation and pore
development. The highest surface area and pore volume obtained from H3PO4 activation were at
500C, while the average pore diameter was higher for KOH activation. The KOH activation
reaction consists of dehydration, dehydroxylation, and alkalide formation. When the activation
temperature increases from 400 to 600C, different pore sizes will be developed at different sites
(Jibril et al. 2008).
One study found that K2CO3 is more effective than KOH as a chemical reagent at 800°C,
in terms of both pore volume and yield of activated carbon. Tay et al. (2009) studied activated
carbon production from the soybean oil cake with component analyses of 21% cellulose, 2%
lignin, and 58% hemicellulose at 600 and 800 °C by chemical activation with K2CO3 and KOH.
The SSA of K2CO3 activated samples increased from 614 to 1352 m2/g when the activation
temperature increased from 600°C to 800°C, but the SSA of KOH-activated sample did not
change significantly. The ash and sulphur content of the activated carbon obtained with chemical
activation by K2CO3 was lower than those obtained by KOH (Tay et al. 2009).
17
2.7 Production of activated carbon by microwave radiation
2.7.1 Microwave radiation
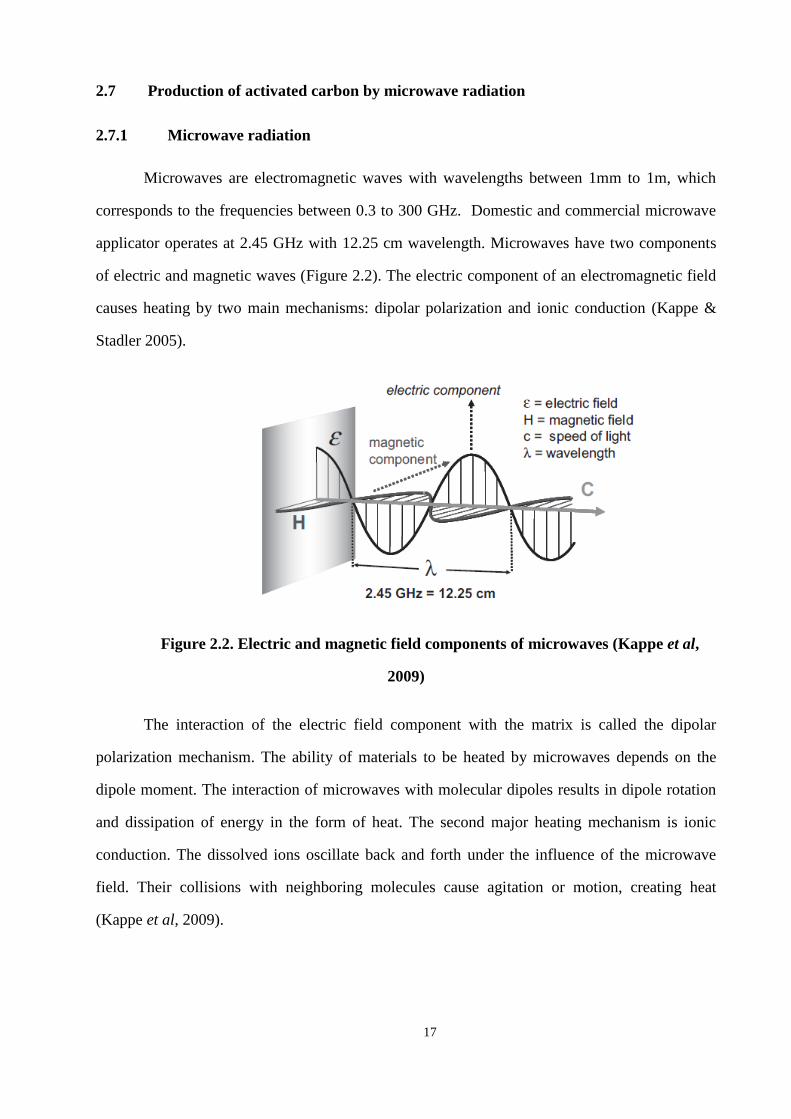
Microwaves are electromagnetic waves with wavelengths between 1mm to 1m, which
corresponds to the frequencies between 0.3 to 300 GHz. Domestic and commercial microwave
applicator operates at 2.45 GHz with 12.25 cm wavelength. Microwaves have two components
of electric and magnetic waves (Figure 2.2). The electric component of an electromagnetic field
causes heating by two main mechanisms: dipolar polarization and ionic conduction (Kappe &
Stadler 2005).
Figure 2.2. Electric and magnetic field components of microwaves (Kappe et al,
2009)
The interaction of the electric field component with the matrix is called the dipolar
polarization mechanism. The ability of materials to be heated by microwaves depends on the
dipole moment. The interaction of microwaves with molecular dipoles results in dipole rotation
and dissipation of energy in the form of heat. The second major heating mechanism is ionic
conduction. The dissolved ions oscillate back and forth under the influence of the microwave
field. Their collisions with neighboring molecules cause agitation or motion, creating heat
(Kappe et al, 2009).
18
2.7.2 Dielectric properties
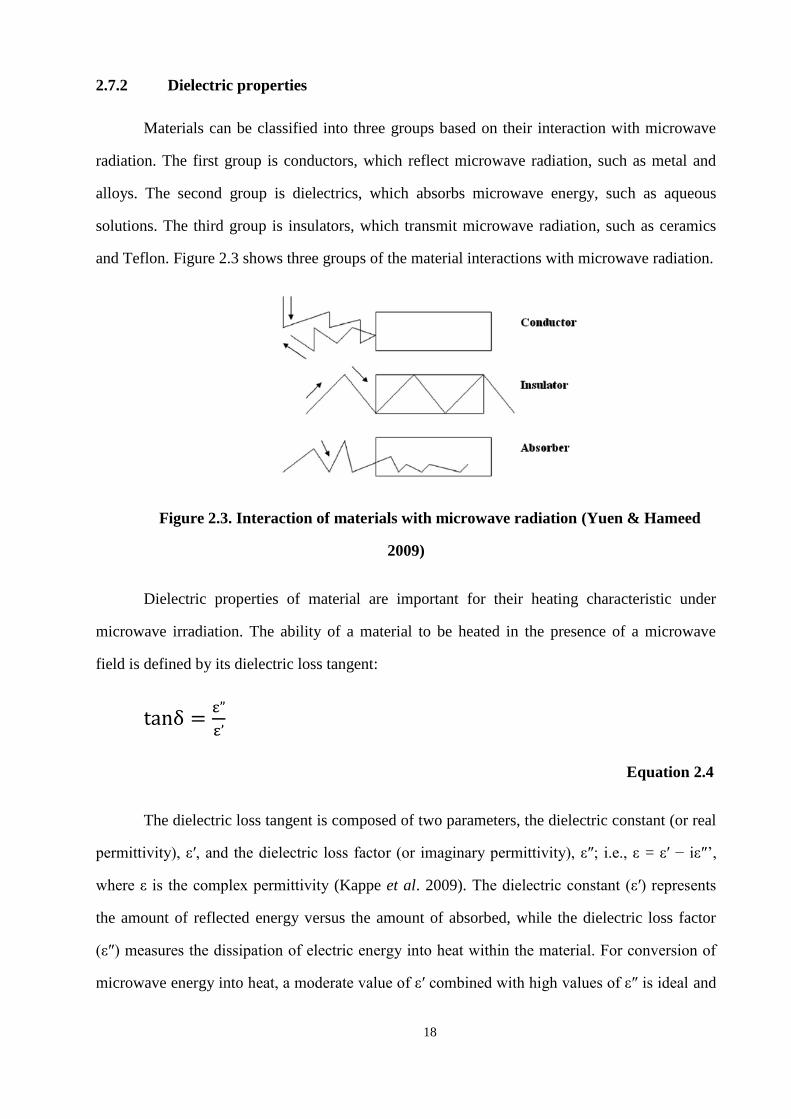
Materials can be classified into three groups based on their interaction with microwave
radiation. The first group is conductors, which reflect microwave radiation, such as metal and
alloys. The second group is dielectrics, which absorbs microwave energy, such as aqueous
solutions. The third group is insulators, which transmit microwave radiation, such as ceramics
and Teflon. Figure 2.3 shows three groups of the material interactions with microwave radiation.
Figure 2.3. Interaction of materials with microwave radiation (Yuen & Hameed
2009)
Dielectric properties of material are important for their heating characteristic under
microwave irradiation. The ability of a material to be heated in the presence of a microwave
field is defined by its dielectric loss tangent:
Equation 2.4
The dielectric loss tangent is composed of two parameters, the dielectric constant (or real
permittivity), ε′, and the dielectric loss factor or imaginary permittivity), ε″; i.e., ε = ε′ − iε″’,
where ε is the complex permittivity (Kappe et al. 2009). The dielectric constant ε′) represents
the amount of reflected energy versus the amount of absorbed, while the dielectric loss factor
ε″) measures the dissipation of electric energy into heat within the material. For conversion of
microwave energy into heat, a moderate value of ε′ combined with high values of ε″ is ideal and
19
consequently the high value of tan δ e.g. 0.1-20. Some materials are transparent to microwaves
meaning that they do not have a sufficiently high loss factor to allow the dielectric heating.
Other materials, such as some inorganic oxides and most carbon materials are good microwave
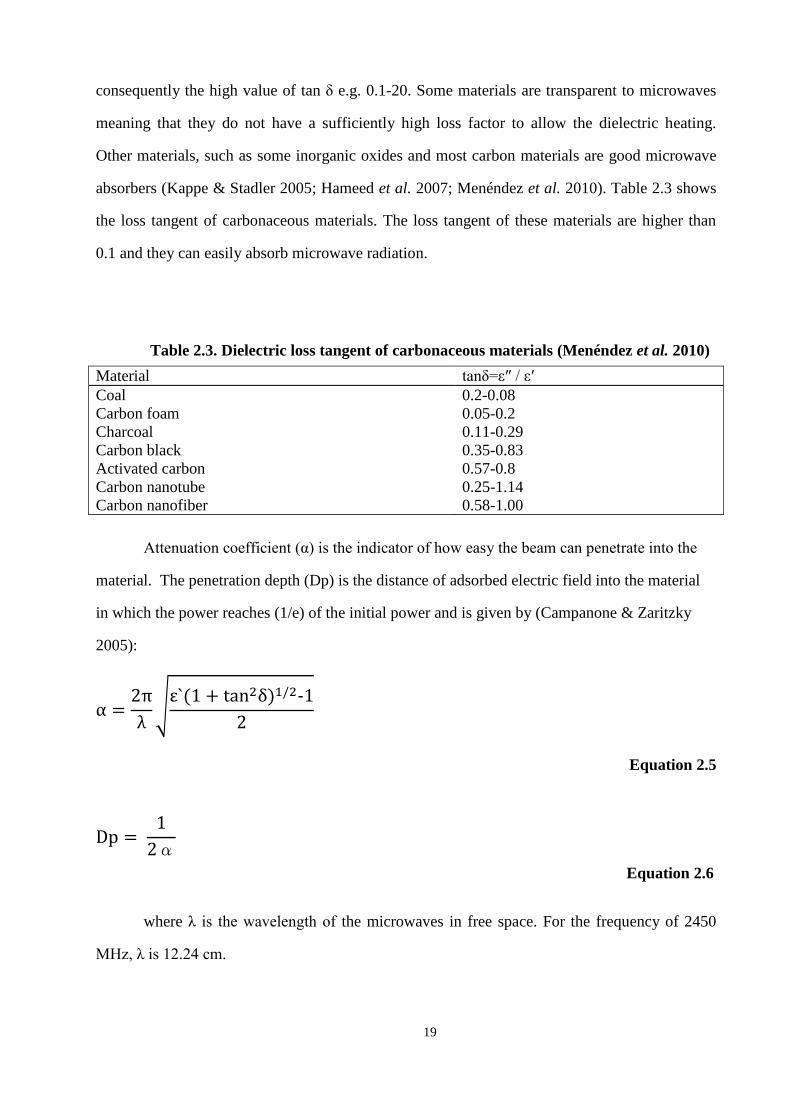
absorbers (Kappe & Stadler 2005; Hameed et al. 2007; Menéndez et al. 2010). Table 2.3 shows
the loss tangent of carbonaceous materials. The loss tangent of these materials are higher than
0.1 and they can easily absorb microwave radiation.
Table 2.3. Dielectric loss tangent of carbonaceous materials (Menéndez et al. 2010)
Material tanδ=ε″ / ε′
Coal
Carbon foam
Charcoal
Carbon black
Activated carbon
Carbon nanotube
Carbon nanofiber
0.2-0.08
0.05-0.2
0.11-0.29
0.35-0.83
0.57-0.8
0.25-1.14
0.58-1.00
Attenuation coefficient α) is the indicator of how easy the beam can penetrate into the
material. The penetration depth (Dp) is the distance of adsorbed electric field into the material
in which the power reaches (1/e) of the initial power and is given by (Campanone & Zaritzky
2005):
√
Equation 2.5
Equation 2.6
where λ is the wavelength of the microwaves in free space. For the frequency of 2450
MHz, λ is 12.24 cm.
20
The power inside microwave heated samples can be explained by both ambart’s law
and Maxwell’s equations. ambart’s law indicates that the power penetrates through the material
with an exponential decay (Campanone & Zaritzky 2005).
-
Equation 2.7
Efficiency of electricity conversion into microwave energy is around 95% and the
conversion of the microwave energy into the heat inside the material is up to 85% if the material
is a good microwave absorber (Thostenson & Chou 1999; Kappe & Stadler 2005).
2.8 Numerical simulation of the microwave heating process
2.8.1 Maxwell’s Equations
The governing equation of the electromagnetic field is based on Maxwell’s equation.
Microwaves penetrate and propagate inside the dielectric materials. They generate an internal
electric field (E) that induces polarization and movement of charges. The resistance to the
induced motions due to internal, elastic and frictional forces attenuates the electric field. These
losses result in volumetric heating. The resulting electromagnetic power absorbed per unit
volume (PEM) [Wm-3
] by a material is given by (Shukla et al. 2010):
PEM ω { o r′′ T |Erms|2 μo μr′′ T |Hrms|2}
Equation 2.8
where, ω is the frequency of the microwave radiation 2.45 GHz), ε0 is absolute permittivity in
free space (8.85×10⁻¹² C2N
-1m
-2), εr′′ is the relative imaginary component of the dielectric
constant, μ0 is absolute permeability of free space 4π×10-7
NA-2). μr ′′ is relative imaginary
component of permeability constant. Erms and Hrms are root mean square values of electric and
magnetic field, respectively.
21
At steady state and time harmonic electromagnetic field, the total volumetric power
generation of microwave is (Thostenson & Chou 1999; Robinson et al. 2010):
Equation 2.9
f is the microwave frequency, ε0 is the permittivity of free space, ε” is the dielectric loss
factor and E is the magnitude of the dielectric field.
2.8.2 Heat transfer in microwaves
The heat transfer equation describes the space and time behavior of the temperature field:
Equation 2.10
where ρd, Cp, and show the material’s density, specific heat capacity and thermal conductivity,
respectively. For solving the above equation ρd, Cp, and are usually considered to be
independent of position, time and temperature. T = T (x,y,z,t) and P = P(x,y,z,t) in the
electromagnetic power dissipated per unit volume. The mathematical model consists of the
electromagnetic field equation and the heat transfer equation. P is determined by the
electromagnetic power density calculation. The calculated power is used for temperature
calculations in the heat transfer equation.
There are several numerical methods used for solving the Partial Differential Equation
(PDE) such as Finite Differential Time Domain (FDTD) method, the Finite Element Method
(FEM), and the Transmission Line Matrix (TLM) method, etc.
22
2.9 Advantages and challenges of microwave heating
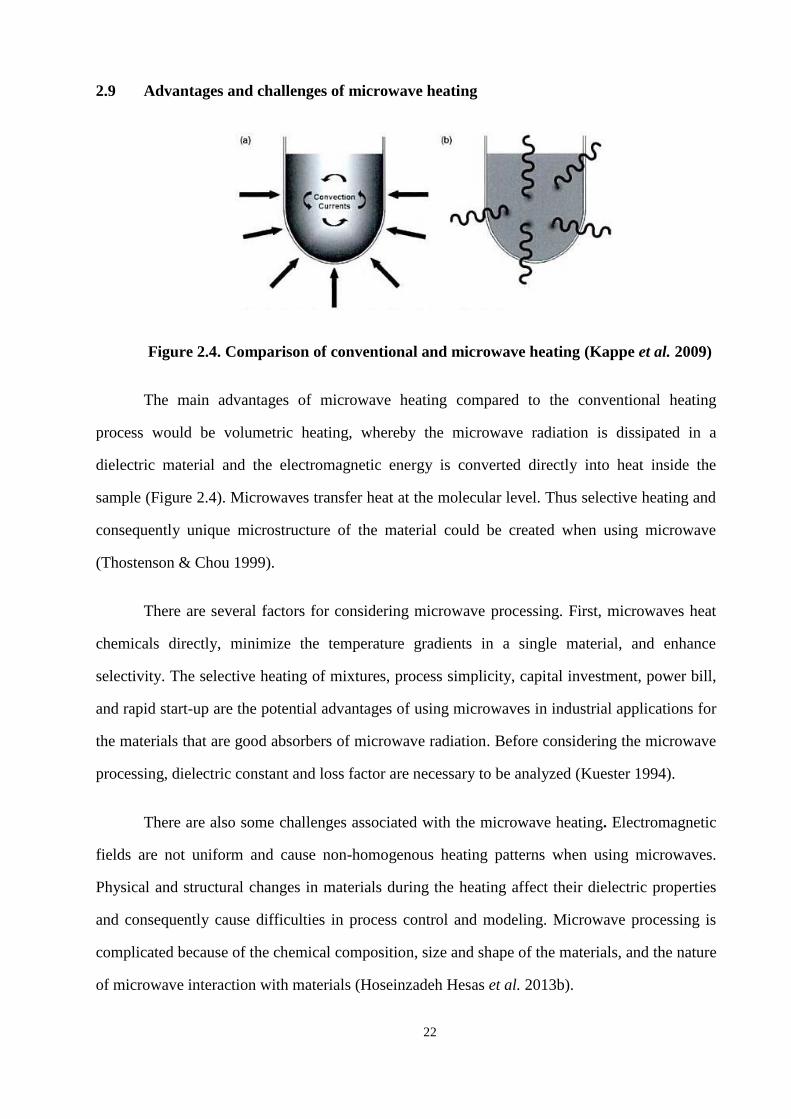
Figure 2.4. Comparison of conventional and microwave heating (Kappe et al. 2009)
The main advantages of microwave heating compared to the conventional heating
process would be volumetric heating, whereby the microwave radiation is dissipated in a
dielectric material and the electromagnetic energy is converted directly into heat inside the
sample (Figure 2.4). Microwaves transfer heat at the molecular level. Thus selective heating and
consequently unique microstructure of the material could be created when using microwave
(Thostenson & Chou 1999).
There are several factors for considering microwave processing. First, microwaves heat
chemicals directly, minimize the temperature gradients in a single material, and enhance
selectivity. The selective heating of mixtures, process simplicity, capital investment, power bill,
and rapid start-up are the potential advantages of using microwaves in industrial applications for
the materials that are good absorbers of microwave radiation. Before considering the microwave
processing, dielectric constant and loss factor are necessary to be analyzed (Kuester 1994).
There are also some challenges associated with the microwave heating. Electromagnetic
fields are not uniform and cause non-homogenous heating patterns when using microwaves.
Physical and structural changes in materials during the heating affect their dielectric properties
and consequently cause difficulties in process control and modeling. Microwave processing is
complicated because of the chemical composition, size and shape of the materials, and the nature
of microwave interaction with materials (Hoseinzadeh Hesas et al. 2013b).
23
“Thermal runaway” is the concentration of microwave energy in the microwave receptor,
which leads to an exponential increase in heating rate due to high thermal adsorption of these
materials. Thermal runaway is the result of the thermal instability inside the materials when they
are heated with microwaves. This phenomenon happens because of the interaction between the
material and electromagnetic waves. During thermal runaway, the temperature of the material
continues to increase until the material is destroyed (Fernández et al. 2011).
Hotspots have been observed when heating with microwaves. The hot-spot phenomenon
is the thermal instability due to nonlinear dependence of the electromagnetic and thermal
properties of the material. The formation of standing waves in microwave cavity causes
exposure of some regions to a higher energy level than others (Appleton et al. 2005).
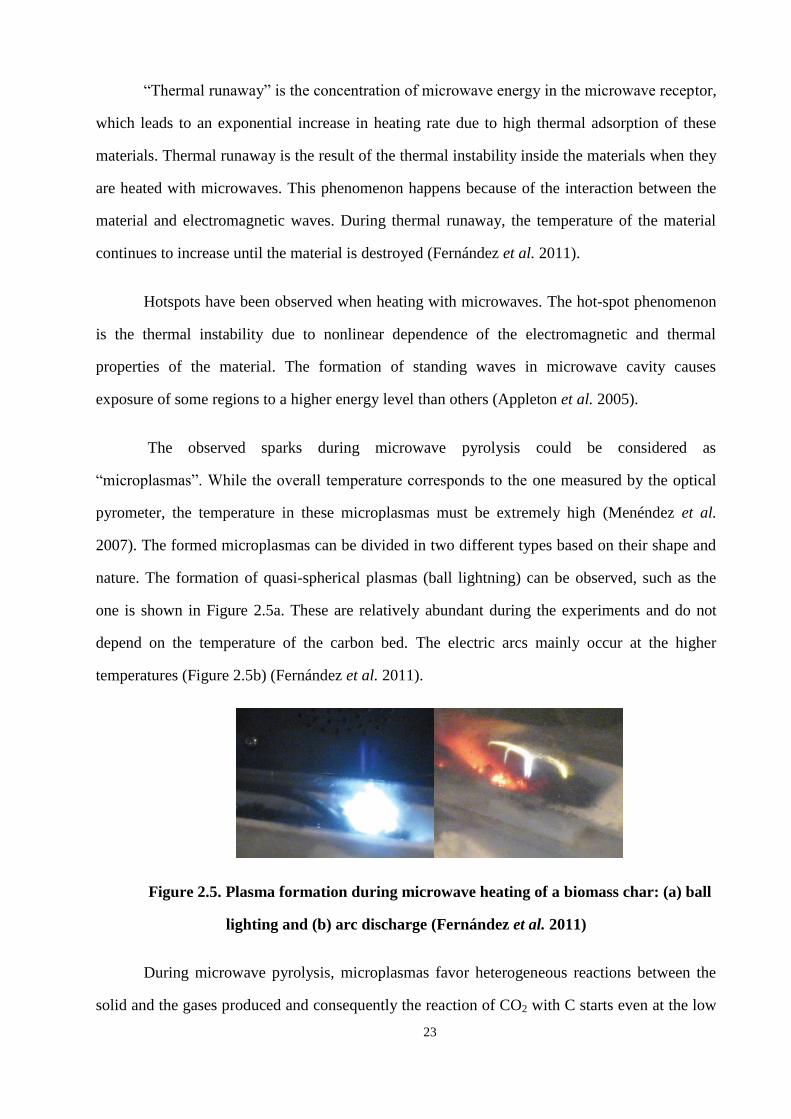
The observed sparks during microwave pyrolysis could be considered as
“microplasmas”. While the overall temperature corresponds to the one measured by the optical
pyrometer, the temperature in these microplasmas must be extremely high (Menéndez et al.
2007). The formed microplasmas can be divided in two different types based on their shape and
nature. The formation of quasi-spherical plasmas (ball lightning) can be observed, such as the
one is shown in Figure 2.5a. These are relatively abundant during the experiments and do not
depend on the temperature of the carbon bed. The electric arcs mainly occur at the higher
temperatures (Figure 2.5b) (Fernández et al. 2011).
Figure 2.5. Plasma formation during microwave heating of a biomass char: (a) ball
lighting and (b) arc discharge (Fernández et al. 2011)
During microwave pyrolysis, microplasmas favor heterogeneous reactions between the
solid and the gases produced and consequently the reaction of CO2 with C starts even at the low
24
bulk temperature of 500°C (Menéndez et al. 2007). In carbonaceous materials, microplasmas
occur because the π-electrons are free to move in relatively broad regions. The kinetic energy of
some electrons may enable them to jump out of the material, resulting in the ionization of the
surrounding media (Menéndez et al. 2010).
In some cases, the microwave heating starts after a lag phase. “Waiting time” occurs due
to the non-linear dependence of the electromagnetic and thermal properties of the material to
temperature. Waiting time behavior is exhibited by materials that either responds to microwave
heating only after a finite amount of time has passed, or the conventional heating is required
before they can absorb microwave radiation (Fernández et al. 2011).
Dielectric loss factor ε") is the most important parameter that affects the thermal
runaway because it controls the input power into the materials. Rousy et al. (1985) defined the
term of “critical temperature” for the first time. They assumed the thermal loss is mainly by heat
conduction. Based on their assumption, ε” could be calculated by a quadratic function and it
increases with temperature.
Equation 2.11
where T0 is the initial temperature and α0, α1, and α2 are constant parameters.
By applying Equation 2.11 to the heat transfer equation (Equation 2.10), three types of
temperature profiles can be obtained. Figure 2.6 shows the possible temperature profiles versus
time calculated by Rousy et al. (1985). If the dielectric loss factor ε``) of a material is strongly
depend on temperature, the material will become lossy by increasing the temperature α2 >
h/4α0). If α2 ≤ h/4α0, the material can reach a plateau temperature. They calculated a critical
temperature that represents the limit of thermal stability for a material.
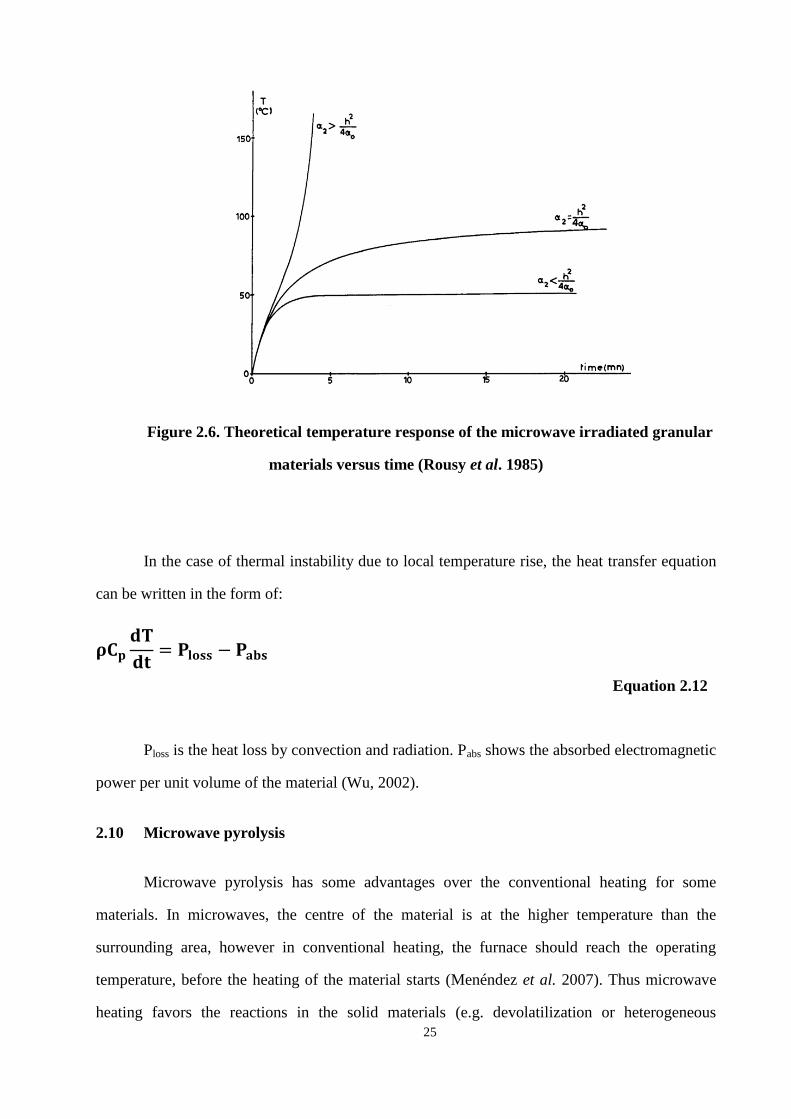
25
Figure 2.6. Theoretical temperature response of the microwave irradiated granular
materials versus time (Rousy et al. 1985)
In the case of thermal instability due to local temperature rise, the heat transfer equation
can be written in the form of:
Equation 2.12
Ploss is the heat loss by convection and radiation. Pabs shows the absorbed electromagnetic
power per unit volume of the material (Wu, 2002).
2.10 Microwave pyrolysis
Microwave pyrolysis has some advantages over the conventional heating for some
materials. In microwaves, the centre of the material is at the higher temperature than the
surrounding area, however in conventional heating, the furnace should reach the operating
temperature, before the heating of the material starts (Menéndez et al. 2007). Thus microwave
heating favors the reactions in the solid materials (e.g. devolatilization or heterogeneous
26
reactions) and the conventional heating is appropriate for the reactions in surroundings, such as
homogeneous reactions in the gas-phase. The lower temperature in the microwave cavity can be
useful to prevent undesirable reactions and condensation of the final pyrolysis vapors in this area
(Fernández et al. 2011, Zhang & Hayward 2006).
The highest temperature of a biomass in microwave heating depends on the dielectric
properties of the receptor, while the heating rate is a function of the chemical composition of
material and is slightly affected by the physical structure. The choice of microwave receptor
affects the conductivity and permittivity of the biomass as well as the strength of the electric
fields in the biomass and the power dissipated in it.
The efficiency of microwave processing depends on the properties of the material, e.g. its
physical properties, such as structural arrangements, thermal conductivity, and specific heat and
its chemical characteristics, such as organic and inorganic composition. In the primary phase, the
microwave receptor components absorb microwaves and generate heat; gradually nearby
particles of the materials are heated by the conventional methods (convection, conduction and
radiation). By the time the volatiles have escaped, the remaining char bed is a good absorber of
the microwave radiation. The uniform distribution of microwave receptor components in
precursor improves the temperature uniformity and provides faster heating rates during pyrolysis
(Fernández et al. 2011).
Several studies investigated the microwave pyrolysis of biomasses and divided it into
four stages. First, the dielectric relaxation phenomenon of water molecules governs the heating
of the biomass. Second, the temperature reaches a constant level before the pyrolysis
temperature. The addition of the microwave receptor affects the temperature significantly. Third,
the temperature rises rapidly corresponding to an acute loss of mass. Forth, thermal equilibrium
is achieved (Zhao et al. 2010).
During microwave pyrolysis, the dielectric properties of the biomass change and make
this process more complicated. Robinson et al. (2010) studied microwave pyrolysis of wood
pellets. Their dielectric measurement results indicated that the dielectric loss factor is around
27
0.05 at 100°C for dried wood pellet and the only microwave absorbing phase is water up to
500˚C. Above 500ºC, wood is decomposed into the hydrocarbons and char, consequently, the
dielectric loss factor increases to 1.2 at 700ºC. The produced char had a higher loss tangent
compared to the wood pellet due to the graphitization process.
2.11 Char production from biomass by microwave pyrolysis
Char is the product of both primary and secondary pyrolysis reactions. By increasing the
temperature, the char yield initially decreased, due to the competition between the primary
reaction of the char and the formation of volatiles. At the higher temperatures, the temperature
gradient becomes small and consequently the char yield remains constant. Through the
secondary pyrolysis reaction, the temperature controls the char yield by affecting residence time
of the volatiles and volatiles release rate. The high external pressure and low heating rate helps
in the creation of the secondary char on the primary char surface (Di Blasi 2009).
During secondary reactions, organic vapors decompose on the carbonaceous solids and
create additional char. Tar compounds (organic vapors) decompose faster under pressure.
Generally pressure and flow rate are the major parameters affecting the microwave pyrolysis.
The high reaction temperature (>773K) cause the activity of secondary reactions for tar cracking.
Therefore there is a linear relationship between the heat of pyrolysis reactions and char yields
(Di Blasi 2008).
Several studies indicated that the formation of char depends on the exothermicity of
pyrolysis. The main components of the forest residues are lignin and cellulose. Their
decompositions are exothermic and endothermic, respectively. Studies showed that the char
yield of lignin is higher than cellulose. During fast pyrolysis (under high heating rate)
holocellulose (hemicelluloses and cellulose) convert into liquid while lignin produce char. On
the contrary, at low temperature ranges, char and liquid formation are competing (Di Blasi
2008).
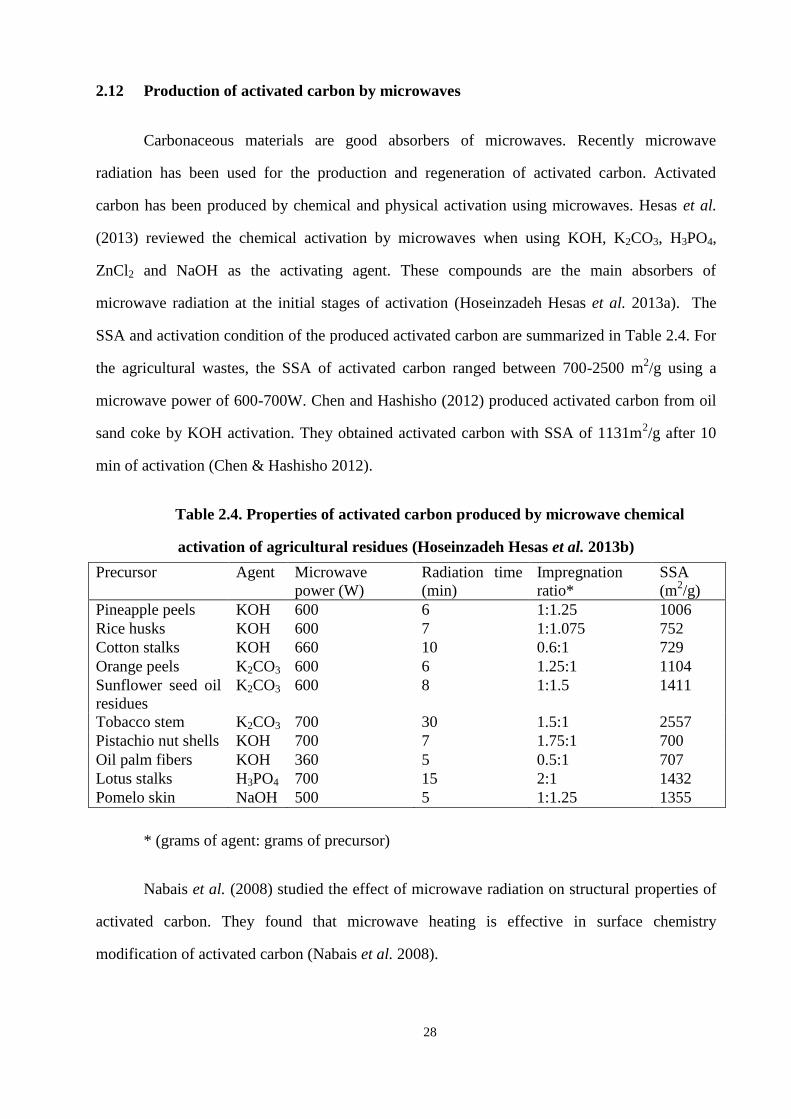
28
2.12 Production of activated carbon by microwaves
Carbonaceous materials are good absorbers of microwaves. Recently microwave
radiation has been used for the production and regeneration of activated carbon. Activated
carbon has been produced by chemical and physical activation using microwaves. Hesas et al.
(2013) reviewed the chemical activation by microwaves when using KOH, K2CO3, H3PO4,
ZnCl2 and NaOH as the activating agent. These compounds are the main absorbers of
microwave radiation at the initial stages of activation (Hoseinzadeh Hesas et al. 2013a). The
SSA and activation condition of the produced activated carbon are summarized in Table 2.4. For
the agricultural wastes, the SSA of activated carbon ranged between 700-2500 m2/g using a
microwave power of 600-700W. Chen and Hashisho (2012) produced activated carbon from oil
sand coke by KOH activation. They obtained activated carbon with SSA of 1131m2/g after 10
min of activation (Chen & Hashisho 2012).
Table 2.4. Properties of activated carbon produced by microwave chemical
activation of agricultural residues (Hoseinzadeh Hesas et al. 2013b)
Precursor Agent Microwave
power (W)
Radiation time
(min)
Impregnation
ratio*
SSA
(m2/g)
Pineapple peels KOH 600 6 1:1.25 1006
Rice husks KOH 600 7 1:1.075 752
Cotton stalks KOH 660 10 0.6:1 729
Orange peels K2CO3 600 6 1.25:1 1104
Sunflower seed oil
residues
K2CO3 600 8 1:1.5 1411
Tobacco stem K2CO3 700 30 1.5:1 2557
Pistachio nut shells KOH 700 7 1.75:1 700
Oil palm fibers KOH 360 5 0.5:1 707
Lotus stalks H3PO4 700 15 2:1 1432
Pomelo skin NaOH 500 5 1:1.25 1355
* (grams of agent: grams of precursor)
Nabais et al. (2008) studied the effect of microwave radiation on structural properties of
activated carbon. They found that microwave heating is effective in surface chemistry
modification of activated carbon (Nabais et al. 2008).
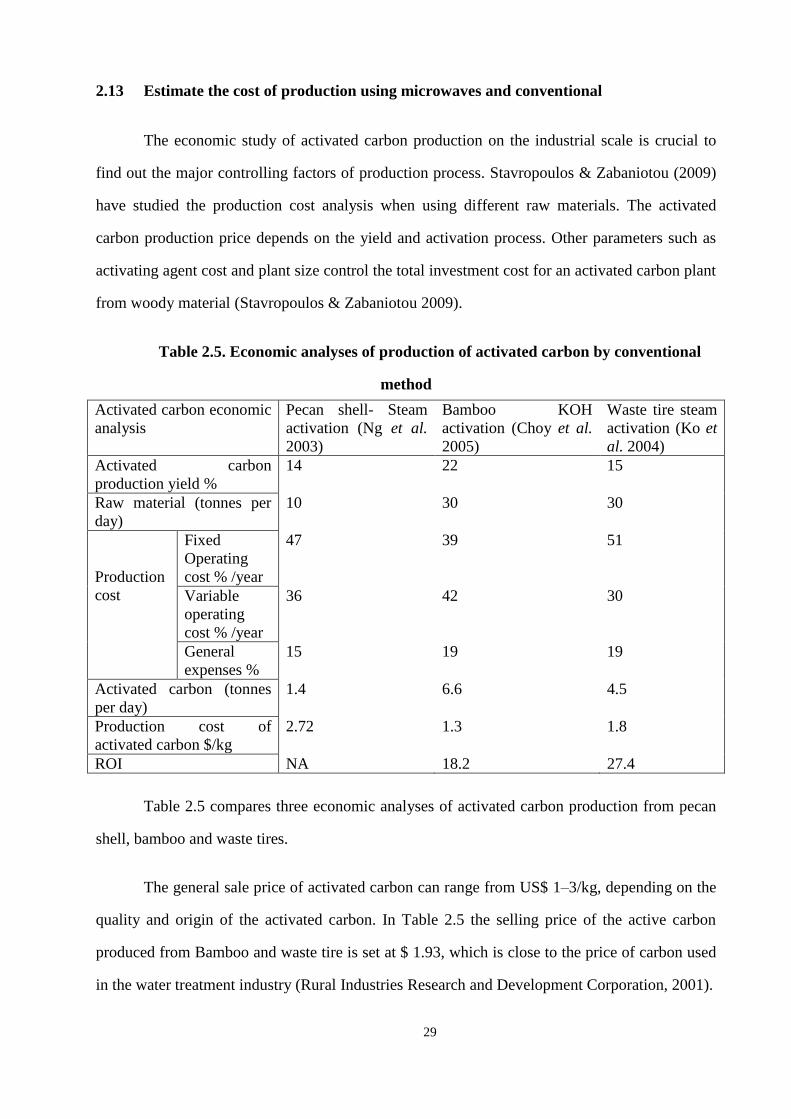
29
2.13 Estimate the cost of production using microwaves and conventional
The economic study of activated carbon production on the industrial scale is crucial to
find out the major controlling factors of production process. Stavropoulos & Zabaniotou (2009)
have studied the production cost analysis when using different raw materials. The activated
carbon production price depends on the yield and activation process. Other parameters such as
activating agent cost and plant size control the total investment cost for an activated carbon plant
from woody material (Stavropoulos & Zabaniotou 2009).
Table 2.5. Economic analyses of production of activated carbon by conventional
method
Activated carbon economic
analysis
Pecan shell- Steam
activation (Ng et al.
2003)
Bamboo KOH
activation (Choy et al.
2005)
Waste tire steam
activation (Ko et
al. 2004)
Activated carbon
production yield %
14 22 15
Raw material (tonnes per
day)
10 30 30
Production
cost
Fixed
Operating
cost % /year
47 39 51
Variable
operating
cost % /year
36 42 30
General
expenses %
15 19 19
Activated carbon (tonnes
per day)
1.4 6.6 4.5
Production cost of
activated carbon $/kg
2.72 1.3 1.8
ROI NA 18.2 27.4
Table 2.5 compares three economic analyses of activated carbon production from pecan
shell, bamboo and waste tires.
The general sale price of activated carbon can range from US$ 1–3/kg, depending on the
quality and origin of the activated carbon. In Table 2.5 the selling price of the active carbon
produced from Bamboo and waste tire is set at $ 1.93, which is close to the price of carbon used
in the water treatment industry (Rural Industries Research and Development Corporation, 2001).
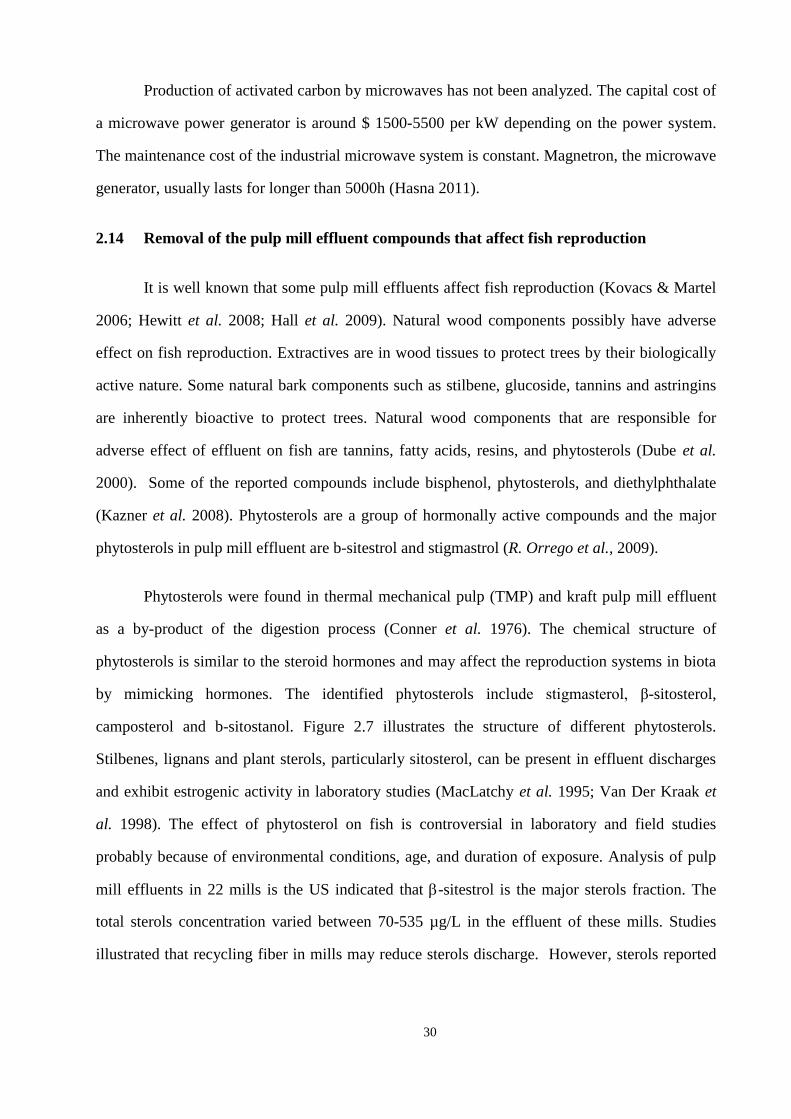
30
Production of activated carbon by microwaves has not been analyzed. The capital cost of
a microwave power generator is around $ 1500-5500 per kW depending on the power system.
The maintenance cost of the industrial microwave system is constant. Magnetron, the microwave
generator, usually lasts for longer than 5000h (Hasna 2011).
2.14 Removal of the pulp mill effluent compounds that affect fish reproduction
It is well known that some pulp mill effluents affect fish reproduction (Kovacs & Martel
2006; Hewitt et al. 2008; Hall et al. 2009). Natural wood components possibly have adverse
effect on fish reproduction. Extractives are in wood tissues to protect trees by their biologically
active nature. Some natural bark components such as stilbene, glucoside, tannins and astringins
are inherently bioactive to protect trees. Natural wood components that are responsible for
adverse effect of effluent on fish are tannins, fatty acids, resins, and phytosterols (Dube et al.
2000). Some of the reported compounds include bisphenol, phytosterols, and diethylphthalate
(Kazner et al. 2008). Phytosterols are a group of hormonally active compounds and the major
phytosterols in pulp mill effluent are b-sitestrol and stigmastrol (R. Orrego et al., 2009).
Phytosterols were found in thermal mechanical pulp (TMP) and kraft pulp mill effluent
as a by-product of the digestion process (Conner et al. 1976). The chemical structure of
phytosterols is similar to the steroid hormones and may affect the reproduction systems in biota
by mimicking hormones. The identified phytosterols include stigmasterol, β-sitosterol,
camposterol and b-sitostanol. Figure 2.7 illustrates the structure of different phytosterols.
Stilbenes, lignans and plant sterols, particularly sitosterol, can be present in effluent discharges
and exhibit estrogenic activity in laboratory studies (MacLatchy et al. 1995; Van Der Kraak et
al. 1998). The effect of phytosterol on fish is controversial in laboratory and field studies
probably because of environmental conditions, age, and duration of exposure. Analysis of pulp
mill effluents in 22 mills is the US indicated that -sitestrol is the major sterols fraction. The
total sterols concentration varied between 70-535 µg/L in the effluent of these mills. Studies
illustrated that recycling fiber in mills may reduce sterols discharge. However, sterols reported
31
to be biodegradable; products of sterols degradation and transformation by aerobic micro-
organisms disrupt the endocrine system and cause morphological problems (Conner et al. 1976).
Figure 2.7. Different plant sterols in the pulp mill effluent
The analyses on the suspected compounds were necessary to identify the sources at pulp
mills. Burnison et al. (1996) studied the active substances in the HPLC isolations of pulp mill
effluent. The results indicated that these compounds were present in a relatively non-polar region
of the chromatographic separation, with a logarithmic octanol/water partition coefficient (Kow)
of 4.6–5.1. Effluent constituents such as -sitosterol (MacLatchy & Van Der Kraak, 1995;
Tremblay & Van Der Kraak, 1999), abietic acid, pinosylvin, and betulin (Mellanen et al. 1996)
have the potential to affect fish reproduction when tested individually, but the cause and effect
relationships is not well understood due to the differences in species response patterns between
laboratory tests and wild fish, the mechanisms of action uncertainties (Van Der Kraak et al.
1998), and the complexity of effluent.
To identify the suspected stream at the mill, a reverse osmosis (RO) treatment was
installed in a mill in Saint John to remove the condensates stream from evaporators, used to
concentrate the black liquor. The results indicated that RO could remove the potential of the
condensate to depress plasma testosterone in Mummichog fish. The responsible compounds in
the condensate for steroid depression were identified to be diterpenoids, sesquiterpenoids, and
32
stilbenes. Similar experiments on different mill extracts support the hypothesis that similar
chemicals may produce hormonal effects, in spite of the different wood furnished (Belknap et al.
2006 Hewitt et al. 2008). Based on their results, handling of condensates, spill control, and
appropriate biotreatment can improve the effluent quality. However, the effect of specific
modification (RO) for removal of suspected compounds is difficult to analyze, because mills
apply multiple process changes at a time (Orrego et al. 2009). Dube and MacLatchy (2001)
exposed Mummichog fish to the condensates with the concentration of (1% v/v) for 21 days and
their experiments support that the recovery condensate stream is the major contributor of the
hormonally active waste stream.
After the identification of the condensate as a source of the compounds that affect fish
reproduction, solid phase extraction (SPE) was applied to isolate the condensate components in
the Saint John mill. GC/MS analyses demonstrated that the sources of these compounds are in
the kraft lignin processes (Hewitt et al. 2002). This hypothesis was supported by other studies
that showed that lignin degradation products were the main source of the bioactivity in the digest
wood, black liquor, and bleaching stream (Dube & McLatchy, 2001).
Individual effluent extractives such as resin acids (e.g. abietic acid), pinosylvin, betulin
genistein, isoflavonoid, and phytosterols (sitosterol and stigmasterol) may interfere in the natural
fish reproductive system, because they are similar to endogenous steroids in fish (mellanen et al.
1996; Kiparissis et al. 2001). Figure 2.7 illustrates the chemical structure of the bioactive
compounds in pulp mill effluent. In another study, 68 wood extractives from monoterpenes,
phenolics, fatty acids, resin acids, resin acid neutrals and sterols were identified by GC-MS
analysis of a pulp mill effluent in Canada, Qubec (Wartman et al. 2009). Table 2.6 shows the
compound name and concentrations.
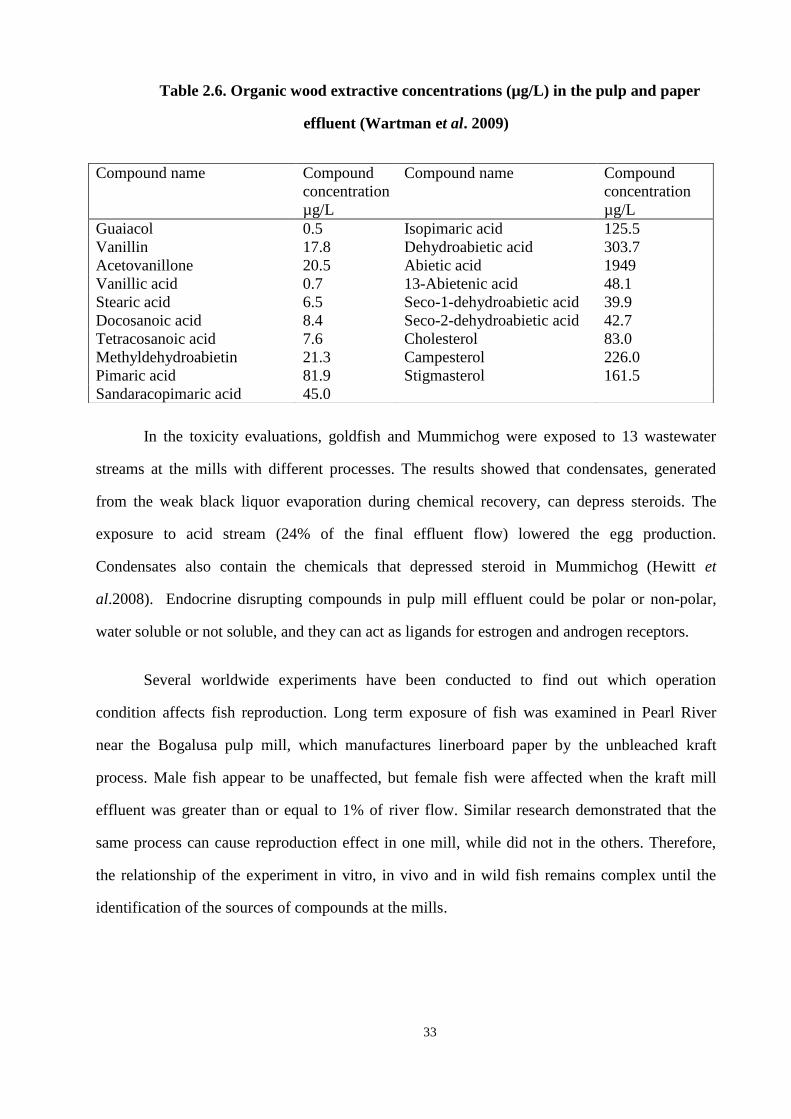
33
Table 2.6. Organic wood extractive concentrations (µg/L) in the pulp and paper
effluent (Wartman et al. 2009)
In the toxicity evaluations, goldfish and Mummichog were exposed to 13 wastewater
streams at the mills with different processes. The results showed that condensates, generated
from the weak black liquor evaporation during chemical recovery, can depress steroids. The
exposure to acid stream (24% of the final effluent flow) lowered the egg production.
Condensates also contain the chemicals that depressed steroid in Mummichog (Hewitt et
al.2008). Endocrine disrupting compounds in pulp mill effluent could be polar or non-polar,
water soluble or not soluble, and they can act as ligands for estrogen and androgen receptors.
Several worldwide experiments have been conducted to find out which operation
condition affects fish reproduction. Long term exposure of fish was examined in Pearl River
near the Bogalusa pulp mill, which manufactures linerboard paper by the unbleached kraft
process. Male fish appear to be unaffected, but female fish were affected when the kraft mill
effluent was greater than or equal to 1% of river flow. Similar research demonstrated that the
same process can cause reproduction effect in one mill, while did not in the others. Therefore,
the relationship of the experiment in vitro, in vivo and in wild fish remains complex until the
identification of the sources of compounds at the mills.
Compound name Compound
concentration
µg/L
Compound name Compound
concentration
µg/L
Guaiacol 0.5 Isopimaric acid 125.5
Vanillin 17.8 Dehydroabietic acid 303.7
Acetovanillone 20.5 Abietic acid 1949
Vanillic acid 0.7 13-Abietenic acid 48.1
Stearic acid 6.5 Seco-1-dehydroabietic acid 39.9
Docosanoic acid 8.4 Seco-2-dehydroabietic acid 42.7
Tetracosanoic acid 7.6 Cholesterol 83.0
Methyldehydroabietin 21.3 Campesterol 226.0
Pimaric acid 81.9 Stigmasterol 161.5
Sandaracopimaric acid 45.0
34
2.15 Significance of the research
Currently the disposal of pulp mill sludge is an issue, economically and environmentally.
The best potential approach to solve this problem is the conversion of sludge into the value
added products. This work aims to develop a process for the production of activated carbon from
pulp mill sludge. KOH has been widely used for the production of activated carbon. KOH-
activation of pulp mill sludge will be studied to understand the feasibility of activated carbon
production and to analyze the effect of operating parameters i.e. KOH:C ratio, activation time,
and temperature on the activated carbon properties.
In recent years, applying microwave radiation has been reported to improve many
chemical processes. There are possible benefits in using microwaves for pyrolysis and
activation. Literature on the microwave activation of biomass is scarce. This work will
investigate the effect of microwave pyrolysis and activation of pulp mill sludge.
Many researches indicated that non-uniformity of the heating inside microwave oven
causes non-homogenous products. One of the challenges of this work is to study the temperature
distribution when heating with microwaves.
With the purpose of using available resources at the pulp mills for activation of the
sludge, white liquor will be used as the activating agent. White liquor is mainly composed of
NaOH, Na2CO3 and Na2S. NaOH is reported as a good activating agent. Using white liquor
might improve the process of activated carbon production economically, because the recycling
process of white liquor is available at the pulp mills.
The applicability of activated carbon will be tested with the treatment of pulp mill
effluents. A group of compounds in the pulp mill effluent affect fish reproduction for many
years. The removal of these compounds became complicated because of the unknown nature of
these compounds. To address this issue, the produced activated carbon will be used for removal
of these compounds.
35
3 Production and Characterization of Lignocellulosic Biomass-derived
Activated carbon1
Abstract
The goal of this chapter is to establish the technical feasibility of producing activated
carbon from pulp mill sludges. KOH chemical activation of six lignocellulosic biomass
materials, four sludges from pulp mills, one sludge for a linerboard mill, and cow manure, were
investigated experimentally, with a focus on the effects of KOH:C ratio (1:1, 1.5:1 and 2:1),
activation temperature (400- 600°C) and activation time (1 to 2 h) on the development of
porosity. The activation products were characterized for their physical and chemical properties
using a surface area analyzer, scanning electron microscopy and Fourier transform infrared
spectroscopy. Experiments were carried out to establish the effectiveness of the lignocellulosic
biomass-derived activated carbon in removing methylene blue (MB), a surrogate of large
organic molecules. The results show that the activated carbon is highly porous with specific
surface area greater than 500 m2/g. The yield of activated carbon was greater than the percent of
fixed carbon in the dry sludge, suggesting that the activation process was able to capture a
substantial amount of carbon from the organic matter in the sludge. While 400°C was too low,
600°C was high enough to sustain a substantial rate of activation for linerboard sludge. The
KOH:C ratio, activation temperature and time all play important roles in pore development and
yield control, allowing optimization of the activation process. Methylene blue adsorption
followed a Langmuir isotherm for all four activated carbon, although the adsorption capacity of
news and kraft primary sludge-derived activated carbon was considerably lower than the rest,
consistent with its lower specific surface area.
1 Based on the following article:
A. Namazi, C.Q. Jia, D.G. Allen (2010) “Production and Characterization of Lignocellulosic Biomass-
Derived Activated carbon” Water Science and Technology, Vol 62 No 11 pp 2637–2646
36
3.1 Introduction
Activated carbon is versatile adsorbent that can be used in many applications such as the
removal of contaminants from air and water. It can be produced from variety of biomass sources
such as coconut shell, agricultural wastes (Yeganeh et al. 2006), coffee crops (Schröder, 2007).
Today, many industrial and agricultural residues are used as raw material for activated carbon
production. The most important factors in choosing a biomass as a precursor for activated carbon
production is its availability, price and chemical/physical properties (Nabais et al. 2008; Girod et
al. 2009).
As one of North America’s largest industries, pulp and paper mills produce considerable
amounts of lignocellulosic biomass such as sludge which requires disposal (Pokhrel &
Viraraghavan 2004; Lacorte et al. 2003). In comparison to burning the lignocellulosic biomass
as fuel, producing activated carbon from the lignocellulosic biomass could potentially add value
to the waste and benefit the environment via waste abatement, water/air purification and
greenhouse gas emission reduction.
Chemical activation is widely used to generate activated carbon from carbon-containing
materials. Common chemical reagents for activation include ZnCl2, H2SO4, H3PO4 (Arimand et
al. 2006; Solaimani & Kaghazchi 2007), alkali metal hydroxides (KOH and NaOH), and alkali
metal carbonates such as K2CO3 and Na2CO3 (Linares-Solano et al. 2006). KOH is often the
choice for producing highly porous activated carbon (Guo & Lua 1999; Kawano et al. 2008).
The overall reaction between a carbon-containing precursor and KOH is often given as (Hayashi
2000):
6KOH + 2C —> 2K + 3H2 + 2K2CO3
Equation 3.1
Upon reacting with KOH, some carbon is oxidized and converted to carbonate. Since
potassium carbonate is water soluble and reacts with acid, during the washing step much of the
carbonate is dissolved in water. HCl will then react with dissolved carbonate and produce CO2.
37
During activation, the formation of CO and CO2 is also possible. The temperature at which
activation begins and the degree of pore development depend not only on the activating agent
but also the nature of the precursor material (Tseng et al. 2007). In order to determine the
optimum conditions for the best porous structure and surface area, a set of experiments should be
conducted on each specific raw material since activated carbon properties depend on the
activation conditions and raw material characteristics.
A suitable porous structure of activated carbon is critical to the efficiency of a process in
which the rate limiting step is mass transfer within the porous media. According to IUPAC,
pores are catagorized into three classes: micropores with pore diameter less than 2 nm,
mesopores with pores between 2 and 50 nm, and macropores with pores greater than 50 nm (Zhu
et al. 2007). The efficiency of an adsorption process depends on the characteristics of adsorbent
and adsorbate, as well as hydrophobic interactions (Moreno-Castilla, 2004). Much research on
activated carbon production from biomass has been carried out (Yu & Zhong 2006; Williams &
Reed 2006).
A common goal is to be able to produce a cost-effective adsorbent for removal of toxic
substances from air or water. It has been shown that enhanced adsorption capacity toward
specific pollutants depends on activated carbon porous structure and surface chemistry (Tsang et
al. 2007; Yeganeh et al. 2006). These characteristic are determined mainly by the raw material
and activation conditions (Guo & Lua 1999; Lozano-Castello et al. 2001). The production of
activated carbon from wood and coconut shells is well studied (Lozano-Castello et al. 2001);
similar research on other lignocellulosic biomass materials, such as pulp-mill sludge, is rather
limited. In particular, there is a lack of information on the effects of activation conditions on
final product characteristics.
In this work, chemical activation of pulp-mill sludge and another lignocellulosic
biomass-cow manure was investigated. The activation process, consisting of pyrolysis and KOH
activation, was investigated under different conditions. The goal was to study the technical
38
feasibility of activated carbon production from these lignocellulosic biomass materials and their
characterization for environmental applications.
3.2 Material and methods
3.2.1 Materials
All six raw materials used in this research were biomass wastes. The first one is a mixed
sludge produced by a recycled linerboard mill in Ontario, Canada; the second and third ones are
primary and secondary sludges from a pulp mill in Ontario, Canada, while the fourth raw
material is the mixture of 70% secondary and 30% primary sludge from a mill in Northern
Ontario. The fifth biomass waste is the residue of the bioprocessed wood chips provided by
FPInnovations research center. This residue was from the hardwood and contains 54% lignin and
1% protein. Lignin has been reported as the major component that contributes to the char
production. Therefore, high lignin content raw materials are expected to be a good option for
production of activated carbon. The sixth raw material was cow manure from a farm in Ontario.
The cow manure was chosen since it is a large waste biomass stream that is available locally. It
is inherently different from the other three and adds another dimension in understanding the
effect of raw materials on activated carbon. All of the pulp mill sludges were collected from
daily discharges of the mills, transferred to the lab, and stored at -4C prior to experiments.
The total ash, volatile matter, and fixed carbon of the raw materials were measured
according to ASTM methods (ASTM D3174-04 for ash analysis and ASTM D3175-89a for
volatiles). To measure ash content, the dry sludge samples were heated in a muffle furnace to
800°C, which took 3 hours, and kept at the same temperature for 12 hours. Volatile matter
content was measured by pyrolyzing dry samples at 850°C for 8 min without oxygen. Total
fixed carbon was the dry sludge weight subtracting ash and volatile matter contents.
Differential Scanning Calorimetric- Thermogravimetric Analysis (DSC-TGA) was
conducted by a thermogravimetric analyzer SDT Q600. Approximately 20 mg of sample was
heated from room temperature to 800˚C in nitrogen atmosphere. The instrument was set to
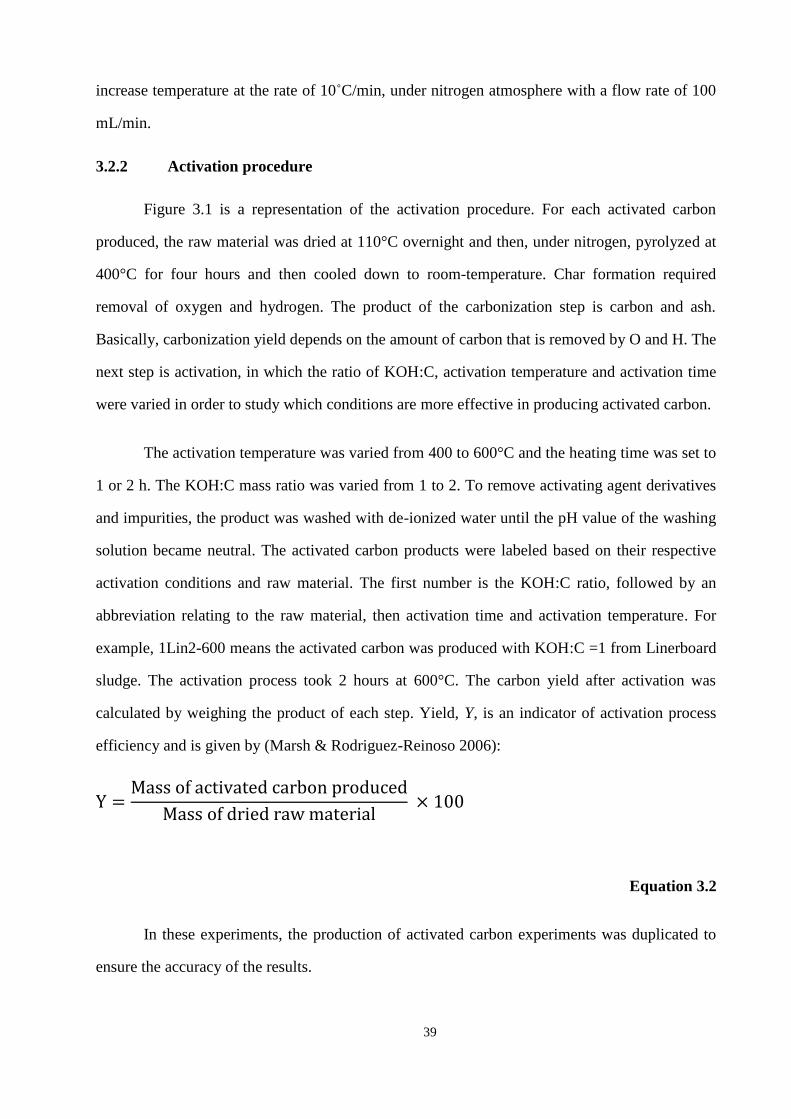
39
increase temperature at the rate of 10˚C/min, under nitrogen atmosphere with a flow rate of 100
mL/min.
3.2.2 Activation procedure
Figure 3.1 is a representation of the activation procedure. For each activated carbon
produced, the raw material was dried at 110°C overnight and then, under nitrogen, pyrolyzed at
400°C for four hours and then cooled down to room-temperature. Char formation required
removal of oxygen and hydrogen. The product of the carbonization step is carbon and ash.
Basically, carbonization yield depends on the amount of carbon that is removed by O and H. The
next step is activation, in which the ratio of KOH:C, activation temperature and activation time
were varied in order to study which conditions are more effective in producing activated carbon.
The activation temperature was varied from 400 to 600°C and the heating time was set to
1 or 2 h. The KOH:C mass ratio was varied from 1 to 2. To remove activating agent derivatives
and impurities, the product was washed with de-ionized water until the pH value of the washing
solution became neutral. The activated carbon products were labeled based on their respective
activation conditions and raw material. The first number is the KOH:C ratio, followed by an
abbreviation relating to the raw material, then activation time and activation temperature. For
example, 1Lin2-600 means the activated carbon was produced with KOH:C =1 from Linerboard
sludge. The activation process took 2 hours at 600°C. The carbon yield after activation was
calculated by weighing the product of each step. Yield, Y, is an indicator of activation process
efficiency and is given by (Marsh & Rodriguez-Reinoso 2006):
Equation 3.2
In these experiments, the production of activated carbon experiments was duplicated to
ensure the accuracy of the results.
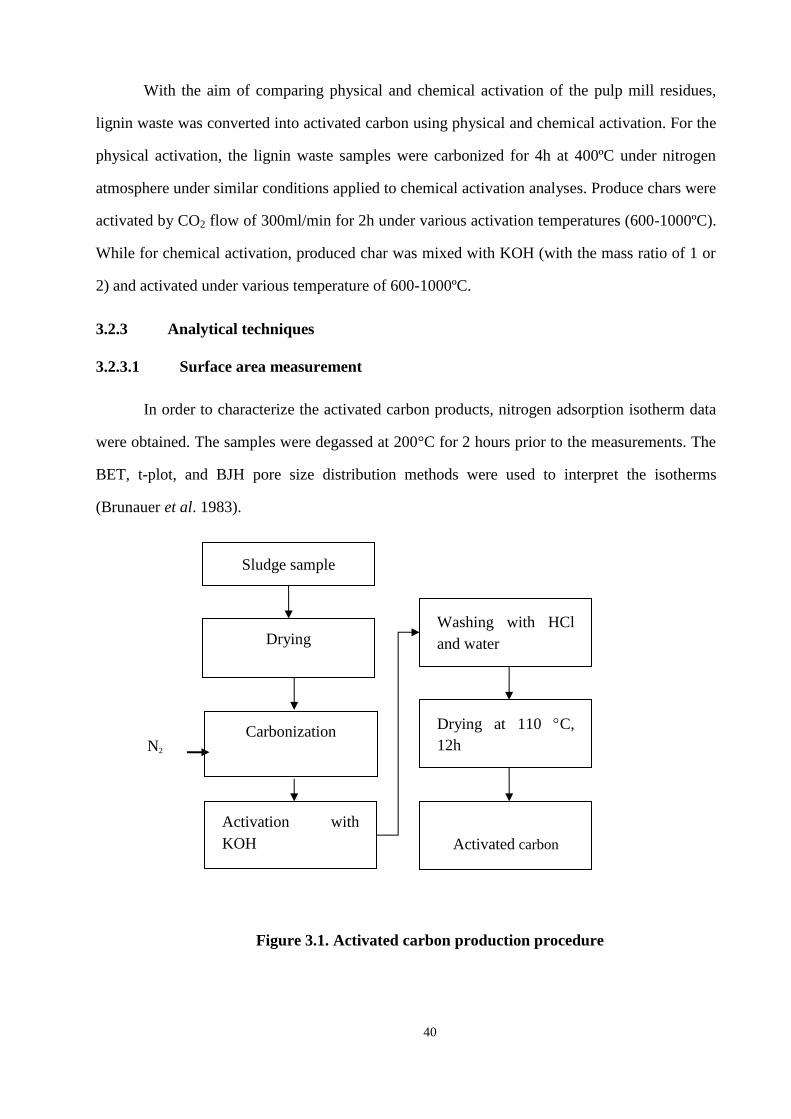
40
With the aim of comparing physical and chemical activation of the pulp mill residues,
lignin waste was converted into activated carbon using physical and chemical activation. For the
physical activation, the lignin waste samples were carbonized for 4h at 400ºC under nitrogen
atmosphere under similar conditions applied to chemical activation analyses. Produce chars were
activated by CO2 flow of 300ml/min for 2h under various activation temperatures (600-1000ºC).
While for chemical activation, produced char was mixed with KOH (with the mass ratio of 1 or
2) and activated under various temperature of 600-1000ºC.
3.2.3 Analytical techniques
3.2.3.1 Surface area measurement
In order to characterize the activated carbon products, nitrogen adsorption isotherm data
were obtained. The samples were degassed at 200°C for 2 hours prior to the measurements. The
BET, t-plot, and BJH pore size distribution methods were used to interpret the isotherms
(Brunauer et al. 1983).
Figure 3.1. Activated carbon production procedure
Activation with
KOH
Carbonization
4h, 400 C
Drying at 110 C,
12h
Washing with HCl
and water
Sludge sample
Drying
Activated carbon
N2
41
3.2.3.2 FTIR Spectroscopy analysis
The surface functional groups on the activated carbon from the different activation
conditions were detected by Fourier transform infrared (FTIR) spectroscopy (FTIR-2000,
PerkinElmer). This technique was used to obtain quantitative information about the surface
functional groups, thus helping to understand the effect of activation conditions. The frequency
range used was from 400 to 4000 cm-1
. Spectra of activated carbon were obtained using finely
powdered KBr as reference in a KBr/AC mixture (200:1 mass ratio).
3.2.4 Adsorption experiments
Methylene blue (MB) was chosen as the adsorbate in this study as it is widely used to test
large organic molecule adsorption capacity of activated carbon. Adsorption tests were performed
in a set of 250 mL Erlenmeyer flasks in which 100 mL of MB solutions with initial
concentrations of 50–350 mg/l were placed. 0.1g of the activated carbon was added to each flask
and kept in a water bath shaker at 120 rpm for 20 hours to allow the equilibrium to be reached.
All samples were centrifuged prior to analysis in order to separate the activated carbon particles
from the solution. The concentration of MB in the supernatant solution before and after
adsorption were determined using a double beam UV–vis spectrophotometer (UV-1601,
Shimadzu) at 668 nm, which is the maximum wavelength of the MB used. Each experiment was
duplicated under the same conditions.
The amount of MB adsorbed at equilibrium, qe (mg/g), was calculated by:
Equation 3.3
where C0 and Ce (mg/l) are the concentrations of MB at initial and equilibrium point,
respectively, V is the volume of the solution (L) and W is the mass of dry activated carbon used
(g).
42
The kinetics of adsorption was assessed with 0.05 g activated carbon in 250 mL flasks
with 100 mL of MB solution with initial concentration of 100 mg/l. The procedure for the
kinetics tests was similar to that of equilibrium tests. The aqueous samples were taken at
different time intervals and the concentrations of MB were analyzed using the same UV-vis
spectrophotometer. The amount of MB adsorbed at time t, qt (mg/g), was calculated by:
Equation 3.4
where Ct (mg/L) is the concentration of the dye at a given time t.
3.3 Results and discussion
3.3.1 Characterization of raw materials
Table 3.1 shows the ultimate analysis of the six raw materials. All the analyses are
triplicate and similar results obtained. The moisture content (%) of samples was related to their
treatment process. Low moisture content of linerboard sludge was attributed to the recycling
process applied by the mill. The primary sludge mainly contains wood fibers; while the
secondary sludge was undergone the biological treatment. The fixed carbon is the potential of
the sludges to convert into activated carbon. However the volatile matter has carbon content
bonded to other molecules, which can be captured by appropriate activation process. Lignin
waste had the highest carbon content and low ash content which makes it a desirable candidate
for activated carbon production, based on the literature.

43
Table 3.1. Characteristics of the six raw materials
Raw material
Moisture
content
Dry sludge composition
(wt %) Ash
content
(wt %)
Fixed
carbon
(wt %)
Volatile
matter
(wt %)
Linerboard mill sludge 61 18 91 732
News and kraft primary
sludge 541 251 112 64
News and kraft secondary
sludge 562 25 5 701
Mixed sludge 16±1 4±1 18±1 77±2
Cow manure 691 62 721 221
Lignin waste 40±1 2±1 18±2 80±3
3.3.2 DSC-TGA analyses
Figure 3.2 shows the weight loss behavior of the Linerboard sludge, News and kraft
primary and secondary sludges under the heating rate of 10˚C/min in nitrogen atmosphere.
The major weight loss occurs between 200 and 300 ˚C. The remained char for inerboard,
primary and secondary sludges are around 20, 12, and 5% at 700˚C. Based on the obtained
heat flow, the pyrolysis process for sludge is exothermic at 400 ˚C.
The major weight loss for hemicellulose, cellulose and lignin occur at 295,345, and
375 °C, respectively. Lignin has higher carbon content compared to cellulose and
hemicellulose. During pyrolysis, the rate of volatile loss is slower when the lignin and wax
content are higher in the biomass. While a sharper weight loss in the range of 300-350°C is
because of the higher cellulose and hemicellulose contents of a biomass (Suhas et al.2007).
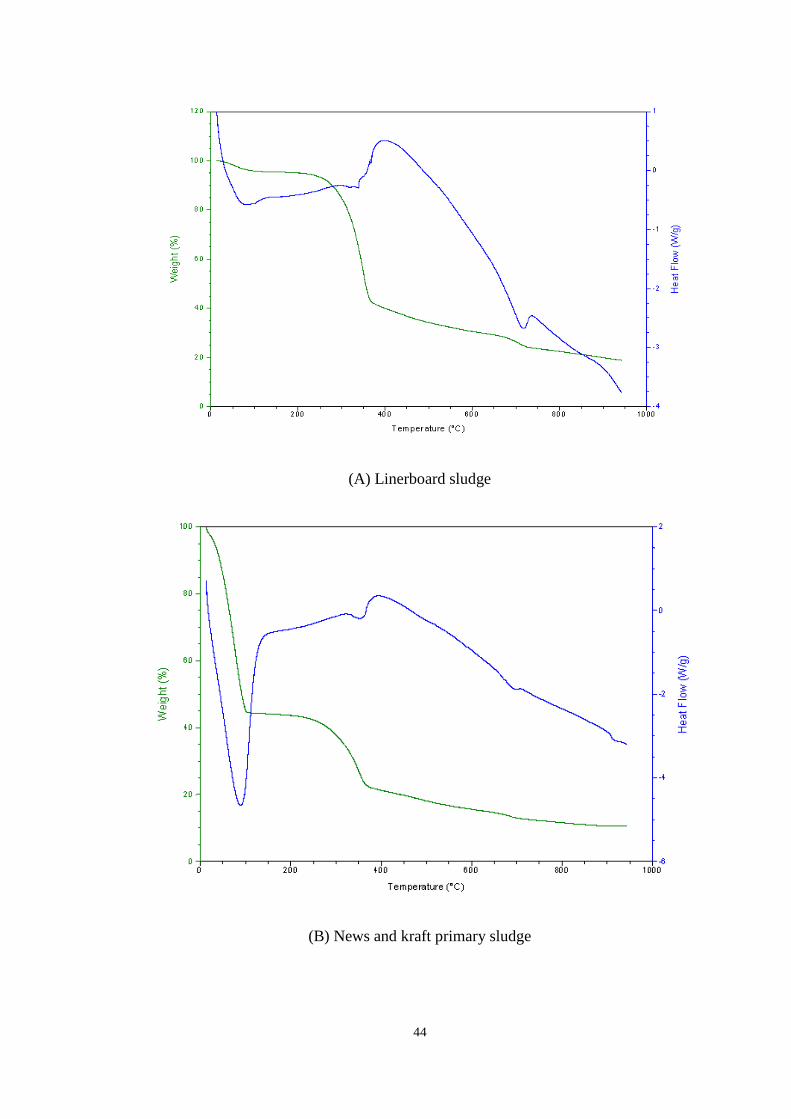
44
(A) Linerboard sludge
(B) News and kraft primary sludge
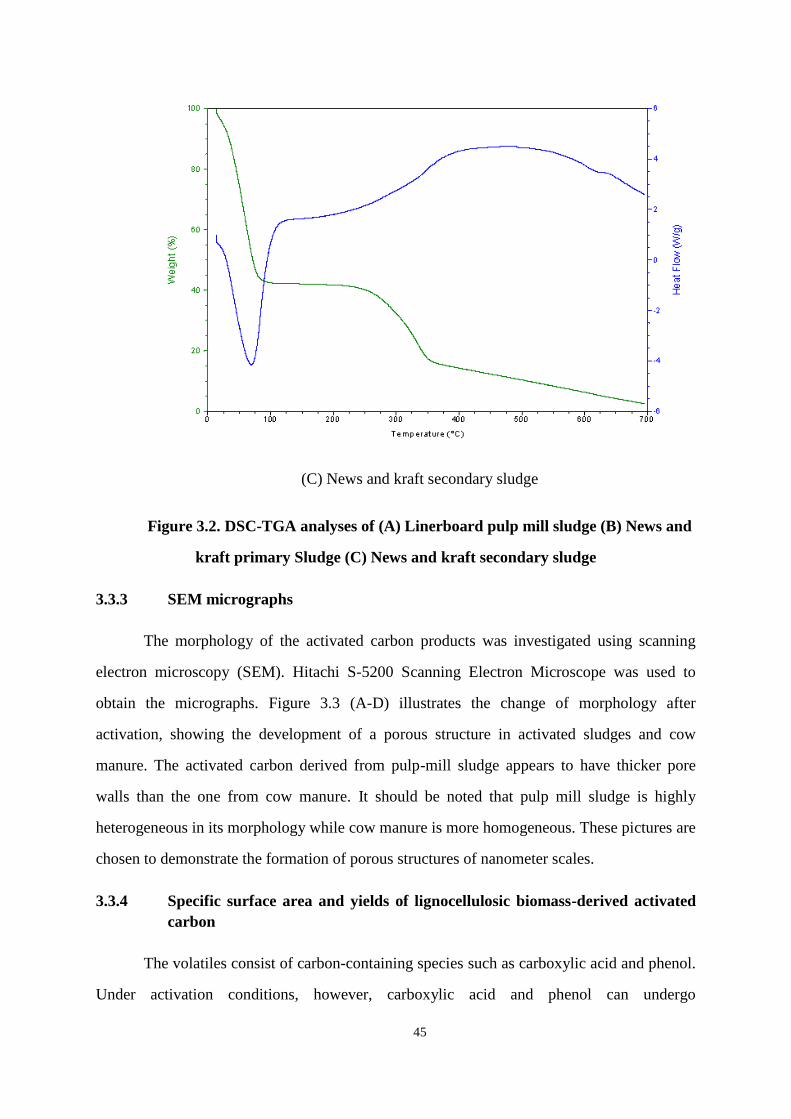
45
(C) News and kraft secondary sludge
Figure 3.2. DSC-TGA analyses of (A) Linerboard pulp mill sludge (B) News and
kraft primary Sludge (C) News and kraft secondary sludge
3.3.3 SEM micrographs
The morphology of the activated carbon products was investigated using scanning
electron microscopy (SEM). Hitachi S-5200 Scanning Electron Microscope was used to
obtain the micrographs. Figure 3.3 (A-D) illustrates the change of morphology after
activation, showing the development of a porous structure in activated sludges and cow
manure. The activated carbon derived from pulp-mill sludge appears to have thicker pore
walls than the one from cow manure. It should be noted that pulp mill sludge is highly
heterogeneous in its morphology while cow manure is more homogeneous. These pictures are
chosen to demonstrate the formation of porous structures of nanometer scales.
3.3.4 Specific surface area and yields of lignocellulosic biomass-derived activated
carbon
The volatiles consist of carbon-containing species such as carboxylic acid and phenol.
Under activation conditions, however, carboxylic acid and phenol can undergo
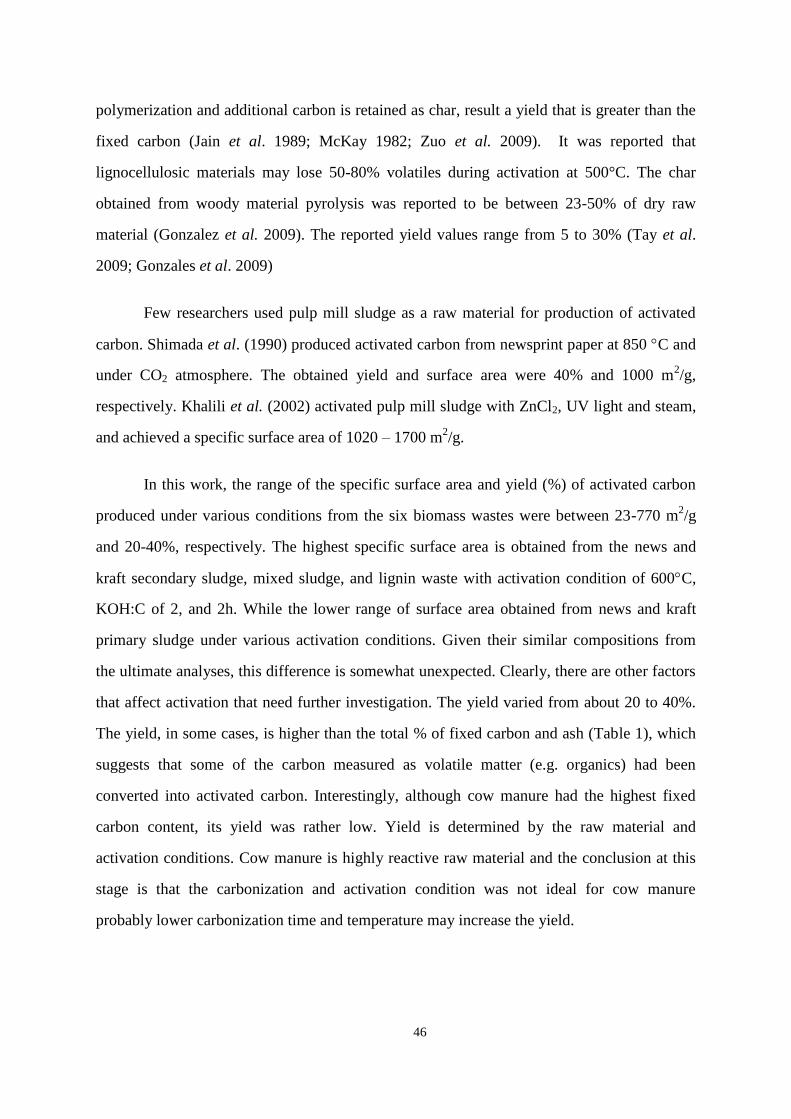
46
polymerization and additional carbon is retained as char, result a yield that is greater than the
fixed carbon (Jain et al. 1989; McKay 1982; Zuo et al. 2009). It was reported that
lignocellulosic materials may lose 50-80% volatiles during activation at 500°C. The char
obtained from woody material pyrolysis was reported to be between 23-50% of dry raw
material (Gonzalez et al. 2009). The reported yield values range from 5 to 30% (Tay et al.
2009; Gonzales et al. 2009)
Few researchers used pulp mill sludge as a raw material for production of activated
carbon. Shimada et al. (1990) produced activated carbon from newsprint paper at 850 C and
under CO2 atmosphere. The obtained yield and surface area were 40% and 1000 m2/g,
respectively. Khalili et al. (2002) activated pulp mill sludge with ZnCl2, UV light and steam,
and achieved a specific surface area of 1020 – 1700 m2/g.
In this work, the range of the specific surface area and yield (%) of activated carbon
produced under various conditions from the six biomass wastes were between 23-770 m2/g
and 20-40%, respectively. The highest specific surface area is obtained from the news and
kraft secondary sludge, mixed sludge, and lignin waste with activation condition of 600C,
KOH:C of 2, and 2h. While the lower range of surface area obtained from news and kraft
primary sludge under various activation conditions. Given their similar compositions from
the ultimate analyses, this difference is somewhat unexpected. Clearly, there are other factors
that affect activation that need further investigation. The yield varied from about 20 to 40%.
The yield, in some cases, is higher than the total % of fixed carbon and ash (Table 1), which
suggests that some of the carbon measured as volatile matter (e.g. organics) had been
converted into activated carbon. Interestingly, although cow manure had the highest fixed
carbon content, its yield was rather low. Yield is determined by the raw material and
activation conditions. Cow manure is highly reactive raw material and the conclusion at this
stage is that the carbonization and activation condition was not ideal for cow manure
probably lower carbonization time and temperature may increase the yield.
47
Figure 3.3. SEM micrographs of (A) raw secondary sludge, (B) activated carbon
produced from secondary sludge, (C) activated carbon produced from primary sludge
and (D) activated carbon produced from cow manure (600C, 2h, KOH:C=2)
3.3.5 Effects of activation conditions on specific surface area (SSA)
The parameters affecting the specific surface area of activated carbon included
activation temperature, KOH:C ratio and activation time, all of which were studied by a set of
experiments on the Linerboard sludge.
Figure 3.4 (A-D) illustrated the effect of temperature on the SSA. The comparison of
A, B,C, and D implied that the rates of activation at 400 and 600C were very different and
that the final SSA achieved at the higher temperature was controlled by the amount of KOH
available (Figure 3.4-A vs. 3.4-B and 3.4-C vs. 3.4-D). This result is expected since the rate
of activation reaction increases with temperature. There should be a minimal temperature at
which the rate of activation reaction becomes substantial. Interestingly, the increase in
activation time from 1 to 2 h did not have much effect on the final SSA (Figure 3.4-C vs. 3.4-
A). Based on figure 3.4-B vs. 3.4-D, with a constant KOH:C ratio of 2, the surface area
48
increased from lower than 50 m2/g to over 500 m
2/g with an increase in activation
temperature from 400 to 600°C.
It appears that an increase in temperature can increase the SSA of activated carbon,
provided that KOH:C is 2 or more. In other words, if the temperature is high enough to
ensure a substantial rate of activation, with enough activation time, the final SSA should be
determined by the amount of KOH available. The high SSA obtained at 400C (Figure 3.4-A)
however it is unexpected.
This dependence of SSA on temperature was also observed when the KOH:C ratio
was 1 but only for the one hour activation (Figure 3.5-A). After two hours, the final SSA at
600°C did not change (Figure 3.5-A vs. 3.5-D), supporting the conclusion that the final SSA
was controlled by the amount of KOH.
Comparison of figure 3.6-A vs. 3.6-B illustrated the effect of activation time on SSA.
Apparently, at 600°C, the rate of activation reaction was high enough for all of the KOH to
be consumed within one hour. Consequently, no additional surface area was created after the
first hour. Similar observations were made for the other three lignocellulosic biomass
materials (data not shown). The yield (%) under all applied activation condition is higher than
fixed carbon of linerboard sludge (9%), suggesting that the carbon of volatiles has been
captured during activation process.
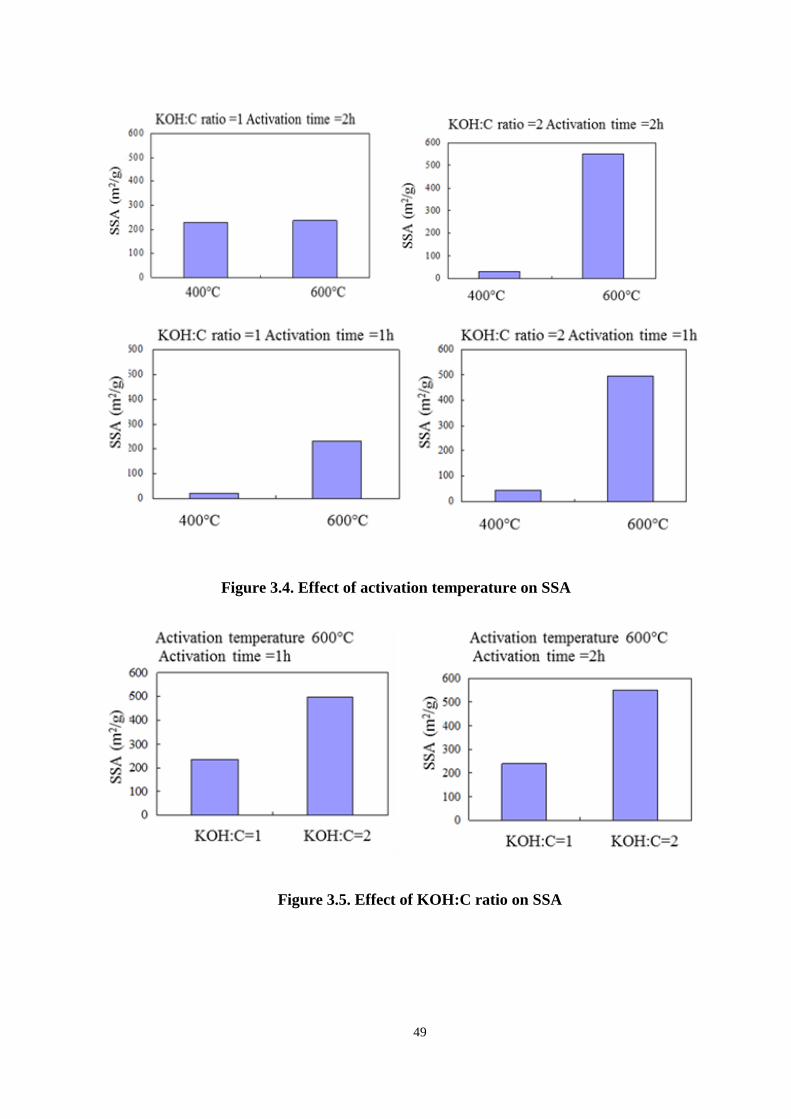
49
Figure 3.4. Effect of activation temperature on SSA
Figure 3.5. Effect of KOH:C ratio on SSA
(
A)
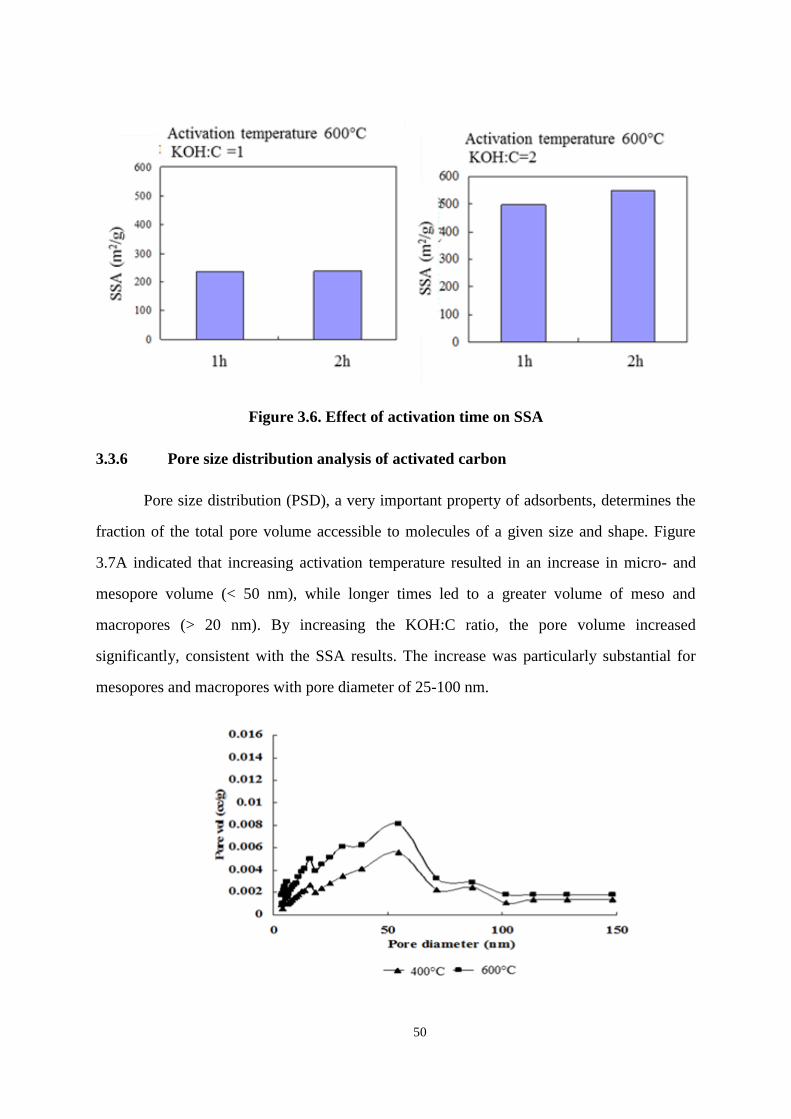
50
Figure 3.6. Effect of activation time on SSA
3.3.6 Pore size distribution analysis of activated carbon
Pore size distribution (PSD), a very important property of adsorbents, determines the
fraction of the total pore volume accessible to molecules of a given size and shape. Figure
3.7A indicated that increasing activation temperature resulted in an increase in micro- and
mesopore volume (< 50 nm), while longer times led to a greater volume of meso and
macropores (> 20 nm). By increasing the KOH:C ratio, the pore volume increased
significantly, consistent with the SSA results. The increase was particularly substantial for
mesopores and macropores with pore diameter of 25-100 nm.
(
A)
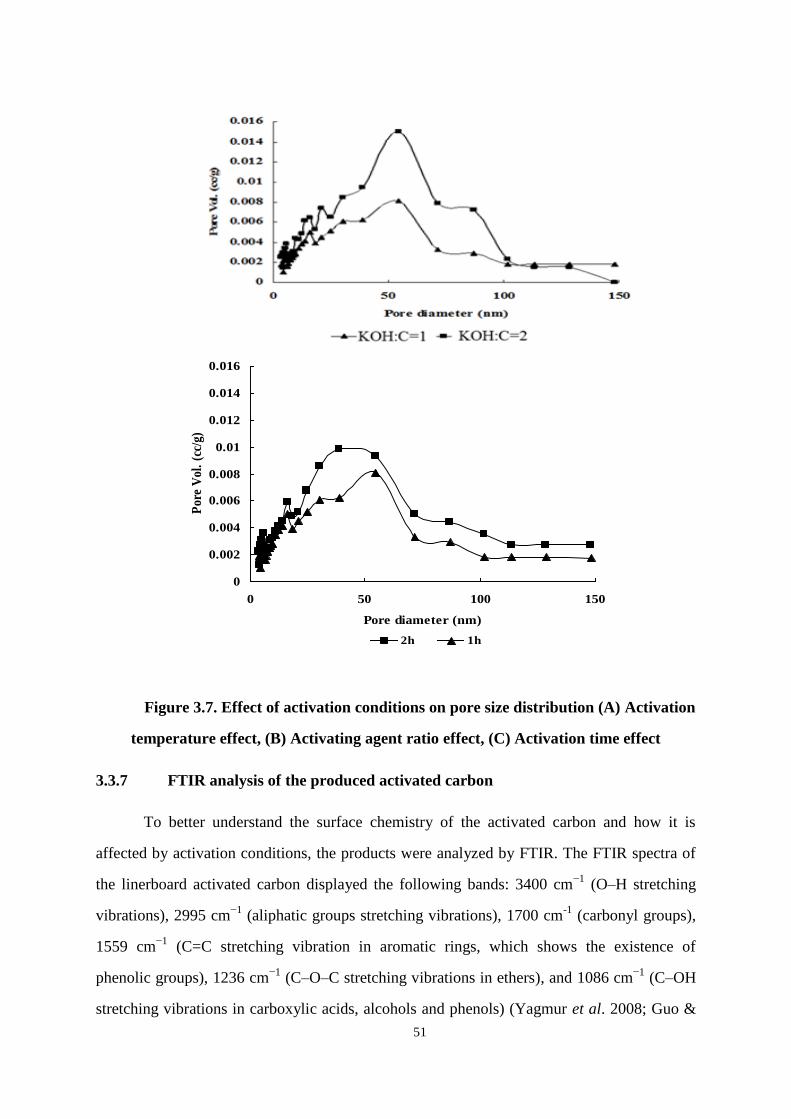
51
Figure 3.7. Effect of activation conditions on pore size distribution (A) Activation
temperature effect, (B) Activating agent ratio effect, (C) Activation time effect
3.3.7 FTIR analysis of the produced activated carbon
To better understand the surface chemistry of the activated carbon and how it is
affected by activation conditions, the products were analyzed by FTIR. The FTIR spectra of
the linerboard activated carbon displayed the following bands: 3400 cm−1
(O–H stretching
vibrations), 2995 cm−1
(aliphatic groups stretching vibrations), 1700 cm-1
(carbonyl groups),
1559 cm−1
(C=C stretching vibration in aromatic rings, which shows the existence of
phenolic groups), 1236 cm−1
(C–O–C stretching vibrations in ethers), and 1086 cm−1
(C–OH
stretching vibrations in carboxylic acids, alcohols and phenols) (Yagmur et al. 2008; Guo &
0
0.002
0.004
0.006
0.008
0.01
0.012
0.014
0.016
0 50 100 150
Pore diameter (nm)
Por
e V
ol.
(cc/
g)
2h 1h
(
B)
(
C)
52
Rockstraw 2007; Jiang et al. 2008). Figure 3.8 shows the changes in the surface chemistry
which resulted from modifying KOH:C ratio, activation temperature, and activation time.
From Figure 3.8 (A), it is evident that longer activation time increases carbonyl and
C-OH groups, while causing no changes in the cyclic groups. This may suggest that the
creation of carbonyl and C-OH groups is closely associated with activation reaction and
requires time. According to Figure 3.8 (B), higher activation temperature breaks cyclic
surface groups and creates more C-OH groups at the surface, likely due to the high thermal
stability of the C-OH group. Based on Figure 3.8 (C), a higher KOH:C ratio in the activation
process breaks cyclic, C-OH and carbonyl groups; this result is in agreement with the results
of other researchers (Yagmur et al. 2008). The main reason for breakage of these bonds is the
capture of carbon from substances measured as volatile matter causing decreases in bands at
the wavelengths of 1086, 1559 and 1700 cm-1
.
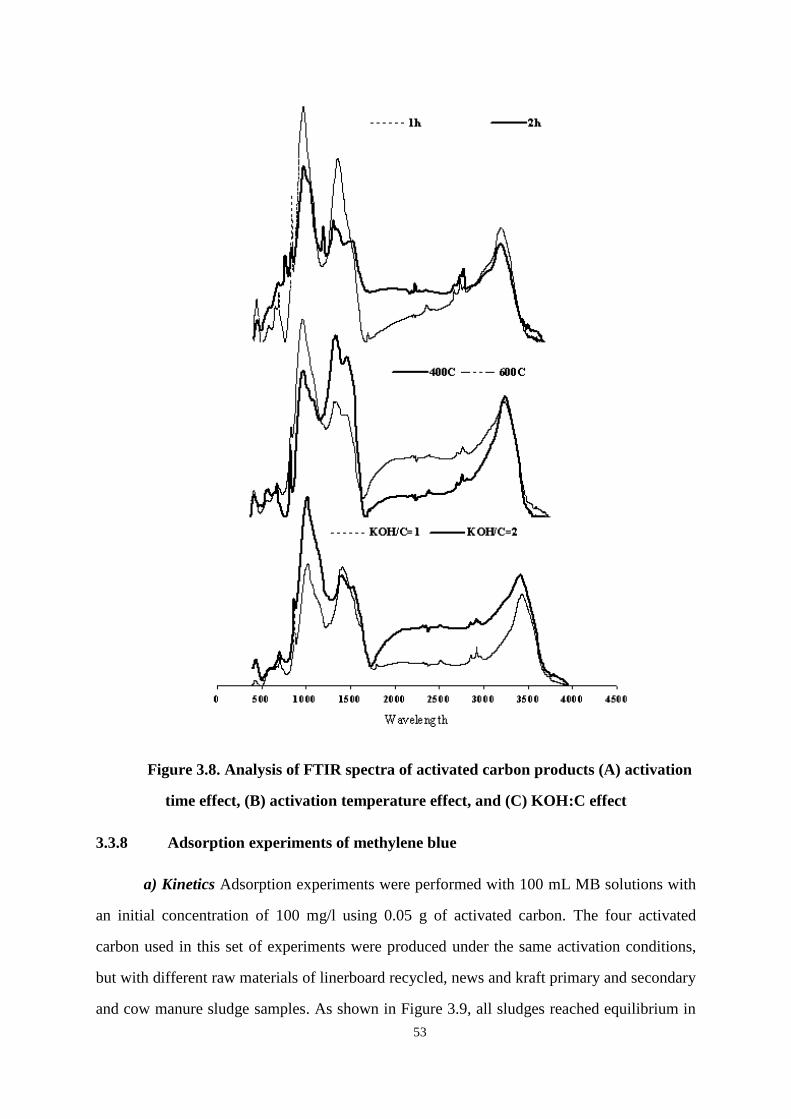
53
Figure 3.8. Analysis of FTIR spectra of activated carbon products (A) activation
time effect, (B) activation temperature effect, and (C) KOH:C effect
3.3.8 Adsorption experiments of methylene blue
a) Kinetics Adsorption experiments were performed with 100 mL MB solutions with
an initial concentration of 100 mg/l using 0.05 g of activated carbon. The four activated
carbon used in this set of experiments were produced under the same activation conditions,
but with different raw materials of linerboard recycled, news and kraft primary and secondary
and cow manure sludge samples. As shown in Figure 3.9, all sludges reached equilibrium in
(
A)
(
B)
(
C)
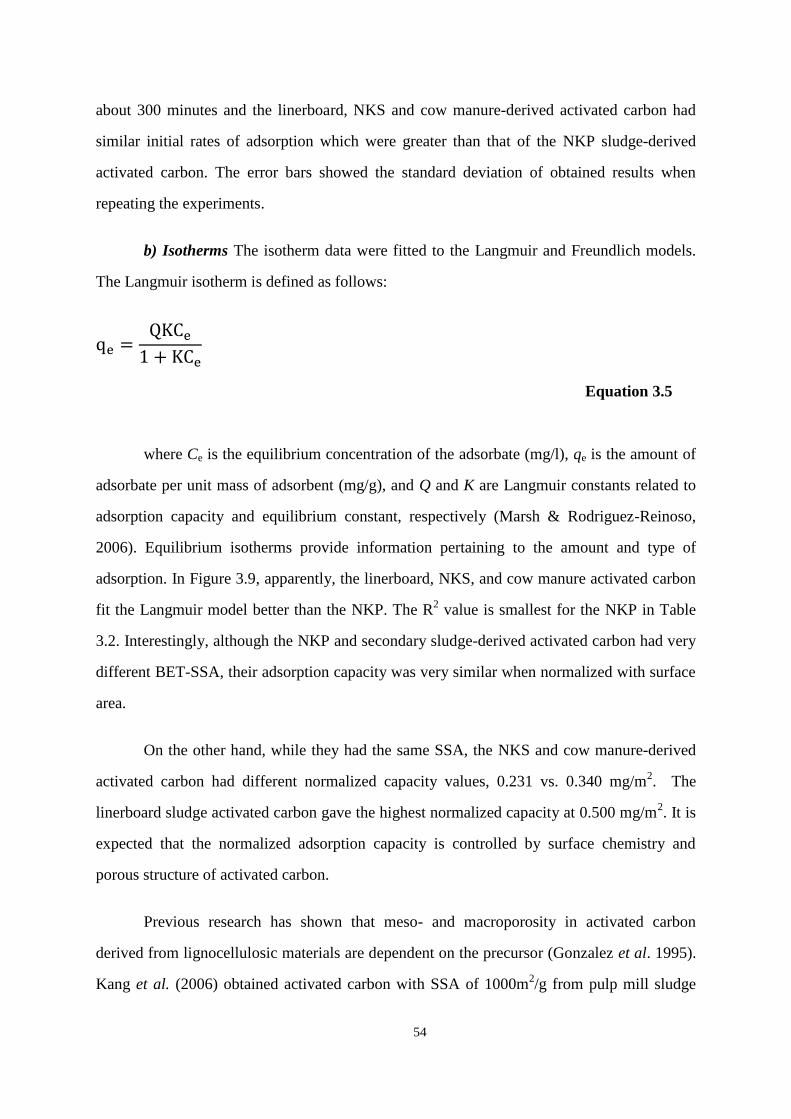
54
about 300 minutes and the linerboard, NKS and cow manure-derived activated carbon had
similar initial rates of adsorption which were greater than that of the NKP sludge-derived
activated carbon. The error bars showed the standard deviation of obtained results when
repeating the experiments.
b) Isotherms The isotherm data were fitted to the Langmuir and Freundlich models.
The Langmuir isotherm is defined as follows:
Equation 3.5
where Ce is the equilibrium concentration of the adsorbate (mg/l), qe is the amount of
adsorbate per unit mass of adsorbent (mg/g), and Q and K are Langmuir constants related to
adsorption capacity and equilibrium constant, respectively (Marsh & Rodriguez-Reinoso,
2006). Equilibrium isotherms provide information pertaining to the amount and type of
adsorption. In Figure 3.9, apparently, the linerboard, NKS, and cow manure activated carbon
fit the Langmuir model better than the NKP. The R2 value is smallest for the NKP in Table
3.2. Interestingly, although the NKP and secondary sludge-derived activated carbon had very
different BET-SSA, their adsorption capacity was very similar when normalized with surface
area.
On the other hand, while they had the same SSA, the NKS and cow manure-derived
activated carbon had different normalized capacity values, 0.231 vs. 0.340 mg/m2. The
linerboard sludge activated carbon gave the highest normalized capacity at 0.500 mg/m2. It is
expected that the normalized adsorption capacity is controlled by surface chemistry and
porous structure of activated carbon.
Previous research has shown that meso- and macroporosity in activated carbon
derived from lignocellulosic materials are dependent on the precursor (Gonzalez et al. 1995).
Kang et al. (2006) obtained activated carbon with SSA of 1000m2/g from pulp mill sludge
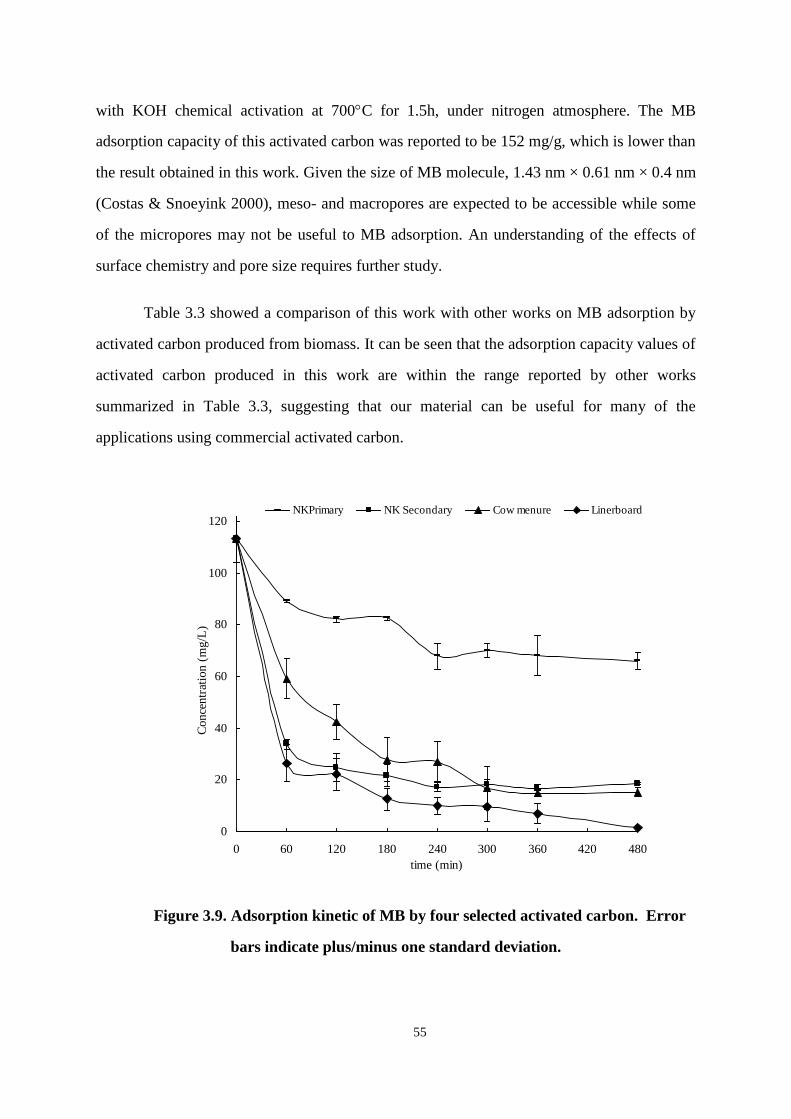
55
with KOH chemical activation at 700C for 1.5h, under nitrogen atmosphere. The MB
adsorption capacity of this activated carbon was reported to be 152 mg/g, which is lower than
the result obtained in this work. Given the size of MB molecule, 1.43 nm × 0.61 nm × 0.4 nm
(Costas & Snoeyink 2000), meso- and macropores are expected to be accessible while some
of the micropores may not be useful to MB adsorption. An understanding of the effects of
surface chemistry and pore size requires further study.
Table 3.3 showed a comparison of this work with other works on MB adsorption by
activated carbon produced from biomass. It can be seen that the adsorption capacity values of
activated carbon produced in this work are within the range reported by other works
summarized in Table 3.3, suggesting that our material can be useful for many of the
applications using commercial activated carbon.
Figure 3.9. Adsorption kinetic of MB by four selected activated carbon. Error
bars indicate plus/minus one standard deviation.
0
20
40
60
80
100
120
0 60 120 180 240 300 360 420 480
time (min)
Co
nce
ntr
atio
n (
mg
/L)
NKPrimary NK Secondary Cow menure Linerboard
56
Figure 3.10. Langmuir isotherm of MB adsorption by Linerboard activated
carbon, cow manure activated carbon, NKS activated carbon, and NKP activated
carbon
Table 3.2. MB adsorption isotherm coefficients
Activated carbon
Surface area
(m2/g)
Langmuir
R2 Q
(mg/g)
Normal Q*
(mg/m2)
K (L/mg)
Linerboard 571 0.99 286 0.500 5
NKP 250 0.94 58 0.232 0.05
NKS 770 0.99 178 0.231 1.84
Cow Manure 770 0.99 262 0.340 2.93
*Normal Q= Q/SSA
0
50
100
150
200
250
300
0 20 40 60 80 100 120 140 Ce (mg/l)
qe (
mg
/g)
Linerboard Cow Menure NK-Secondary
NKPrimary CowManure langmuir NKS langmuir
Linerboard langmuir NKP langmuir
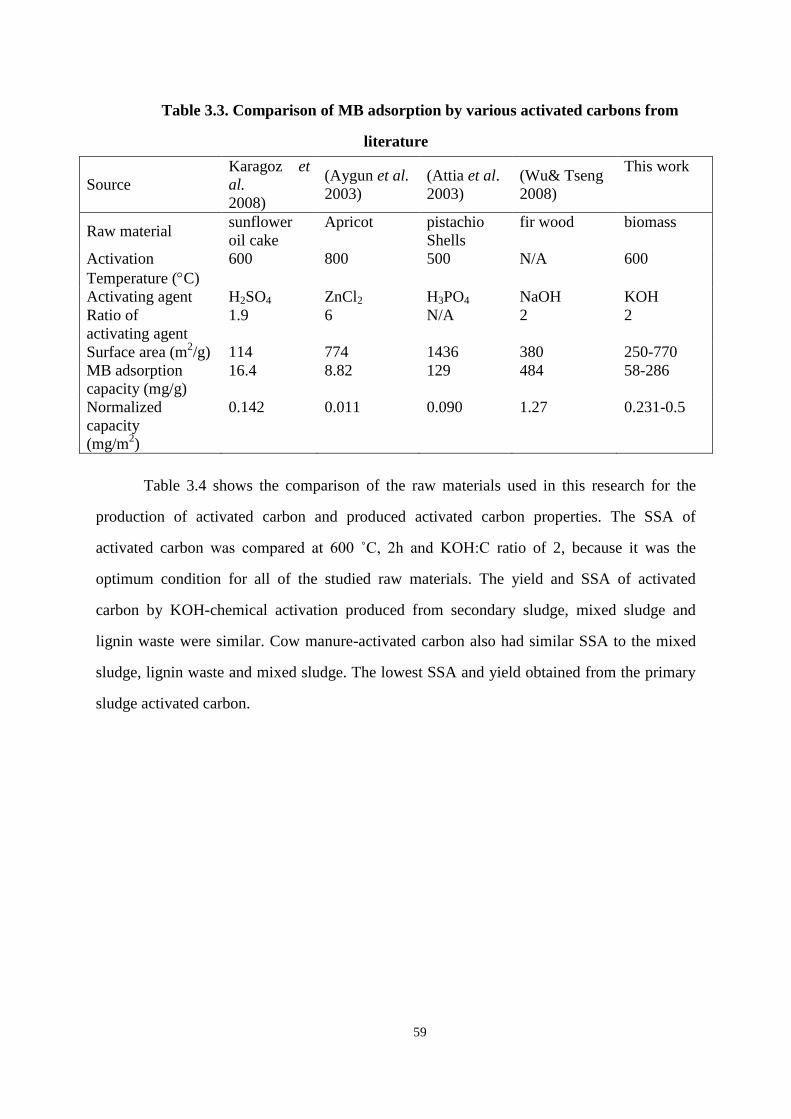
59
Table 3.3. Comparison of MB adsorption by various activated carbons from
literature
Source
Karagoz et
al.
2008)
(Aygun et al.
2003)
(Attia et al.
2003)
(Wu& Tseng
2008)
This work
Raw material sunflower
oil cake
Apricot pistachio
Shells
fir wood biomass
Activation
Temperature (C)
600 800 500 N/A 600
Activating agent H2SO4 ZnCl2 H3PO4 NaOH KOH
Ratio of
activating agent
1.9 6 N/A 2 2
Surface area (m2/g) 114 774 1436 380 250-770
MB adsorption
capacity (mg/g)
16.4 8.82 129 484 58-286
Normalized
capacity
(mg/m2)
0.142 0.011 0.090 1.27 0.231-0.5
Table 3.4 shows the comparison of the raw materials used in this research for the
production of activated carbon and produced activated carbon properties. The SSA of
activated carbon was compared at 600 ˚C, 2h and KOH:C ratio of 2, because it was the
optimum condition for all of the studied raw materials. The yield and SSA of activated
carbon by KOH-chemical activation produced from secondary sludge, mixed sludge and
lignin waste were similar. Cow manure-activated carbon also had similar SSA to the mixed
sludge, lignin waste and mixed sludge. The lowest SSA and yield obtained from the primary
sludge activated carbon.
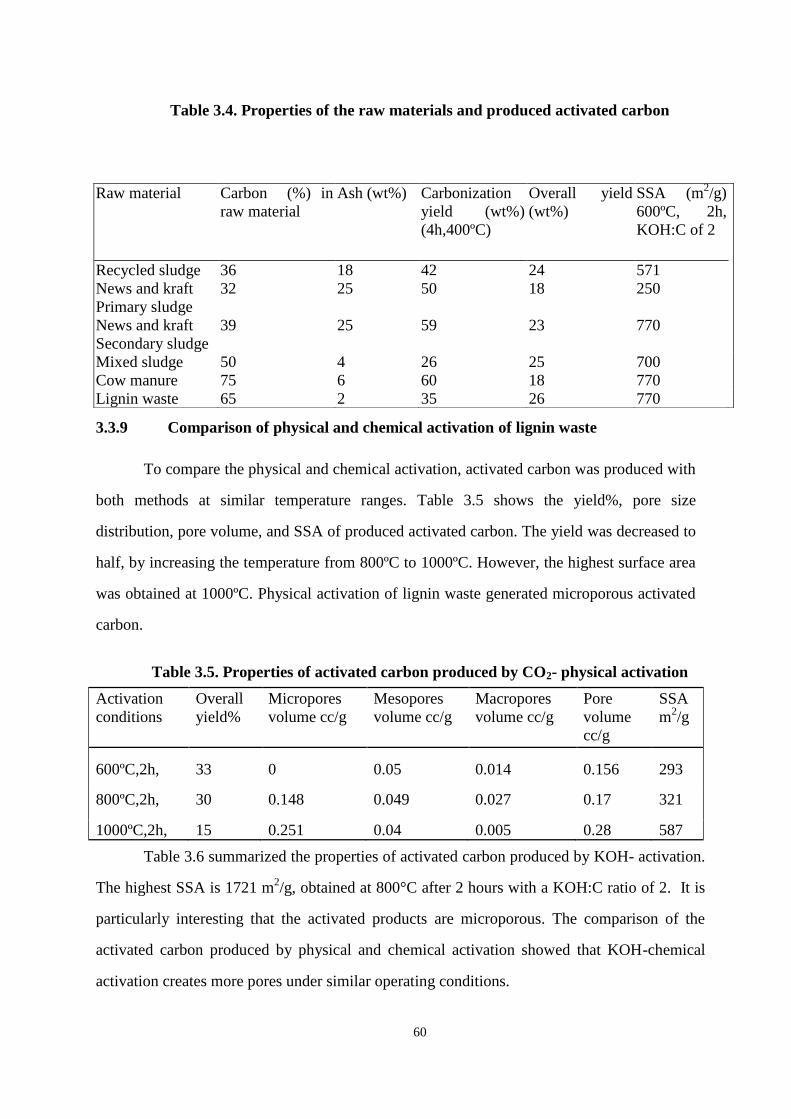
60
Table 3.4. Properties of the raw materials and produced activated carbon
3.3.9 Comparison of physical and chemical activation of lignin waste
To compare the physical and chemical activation, activated carbon was produced with
both methods at similar temperature ranges. Table 3.5 shows the yield%, pore size
distribution, pore volume, and SSA of produced activated carbon. The yield was decreased to
half, by increasing the temperature from 800ºC to 1000ºC. However, the highest surface area
was obtained at 1000ºC. Physical activation of lignin waste generated microporous activated
carbon.
Table 3.5. Properties of activated carbon produced by CO2- physical activation
Activation
conditions
Overall
yield%
Micropores
volume cc/g
Mesopores
volume cc/g
Macropores
volume cc/g
Pore
volume
cc/g
SSA
m2/g
600ºC,2h, 33 0 0.05 0.014 0.156 293
800ºC,2h, 30 0.148 0.049 0.027 0.17 321
1000ºC,2h, 15 0.251 0.04 0.005 0.28 587
Table 3.6 summarized the properties of activated carbon produced by KOH- activation.
The highest SSA is 1721 m2/g, obtained at 800°C after 2 hours with a KOH:C ratio of 2. It is
particularly interesting that the activated products are microporous. The comparison of the
activated carbon produced by physical and chemical activation showed that KOH-chemical
activation creates more pores under similar operating conditions.
Raw material Carbon (%) in
raw material
Ash (wt%) Carbonization
yield (wt%)
(4h,400ºC)
Overall yield
(wt%)
SSA (m2/g)
600ºC, 2h,
KOH:C of 2
Recycled sludge 36 18 42 24 571
News and kraft
Primary sludge
32 25 50 18 250
News and kraft
Secondary sludge
39 25 59 23 770
Mixed sludge 50 4 26 25 700
Cow manure 75 6 60 18 770
Lignin waste 65 2 35 26 770
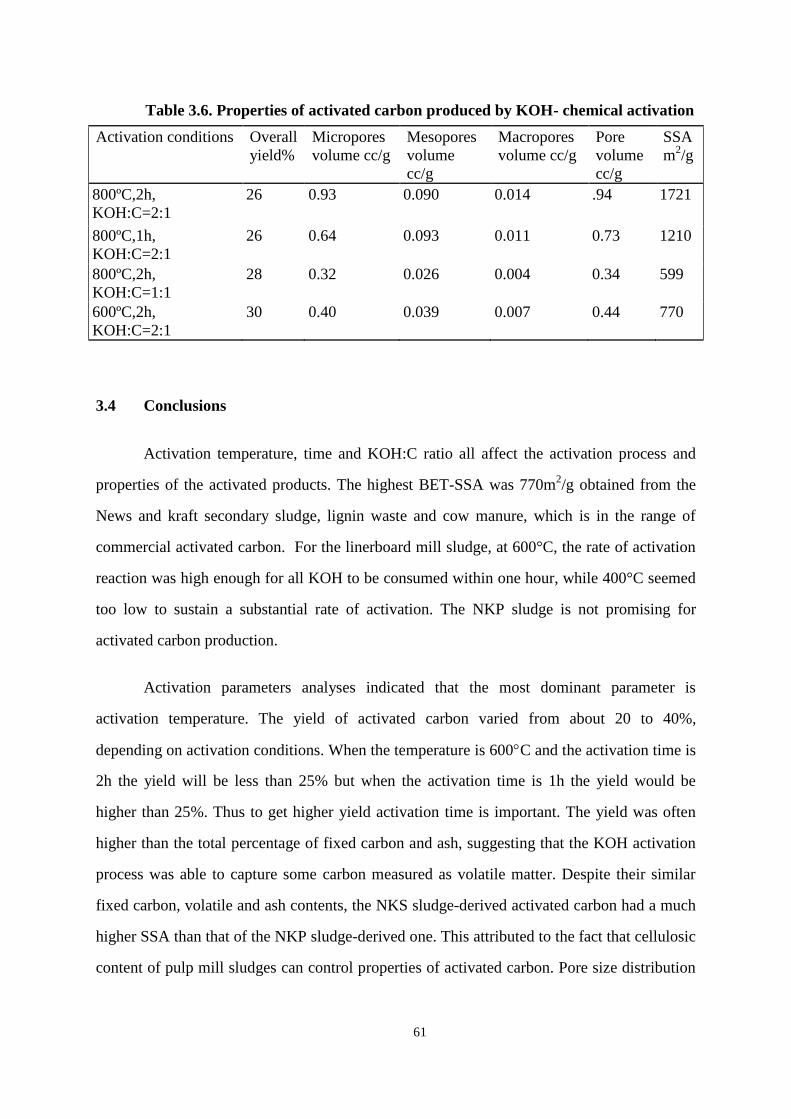
61
Table 3.6. Properties of activated carbon produced by KOH- chemical activation
Activation conditions Overall
yield%
Micropores
volume cc/g
Mesopores
volume
cc/g
Macropores
volume cc/g
Pore
volume
cc/g
SSA
m2/g
800ºC,2h,
KOH:C=2:1
26 0.93 0.090 0.014 .94 1721
800ºC,1h,
KOH:C=2:1
26 0.64 0.093 0.011 0.73 1210
800ºC,2h,
KOH:C=1:1
28 0.32 0.026 0.004 0.34 599
600ºC,2h,
KOH:C=2:1
30 0.40 0.039 0.007 0.44 770
3.4 Conclusions
Activation temperature, time and KOH:C ratio all affect the activation process and
properties of the activated products. The highest BET-SSA was 770m2/g obtained from the
News and kraft secondary sludge, lignin waste and cow manure, which is in the range of
commercial activated carbon. For the linerboard mill sludge, at 600°C, the rate of activation
reaction was high enough for all KOH to be consumed within one hour, while 400°C seemed
too low to sustain a substantial rate of activation. The NKP sludge is not promising for
activated carbon production.
Activation parameters analyses indicated that the most dominant parameter is
activation temperature. The yield of activated carbon varied from about 20 to 40%,
depending on activation conditions. When the temperature is 600C and the activation time is
2h the yield will be less than 25% but when the activation time is 1h the yield would be
higher than 25%. Thus to get higher yield activation time is important. The yield was often
higher than the total percentage of fixed carbon and ash, suggesting that the KOH activation
process was able to capture some carbon measured as volatile matter. Despite their similar
fixed carbon, volatile and ash contents, the NKS sludge-derived activated carbon had a much
higher SSA than that of the NKP sludge-derived one. This attributed to the fact that cellulosic
content of pulp mill sludges can control properties of activated carbon. Pore size distribution
62
analyses indicated that 600C, and 2h activation with KOH:C=2 is a favorable condition to
get high pore volume especially mesopores to increase the adsorption of large molecules.
The results of methylene blue adsorption experiments show a Langmuir isotherm for
all four activated carbon, although the adsorption capacity of NKP sludge-derived activated
carbon was considerably lower than the rest, consistent with its lower SSA value. Overall, the
activated carbon produced in this work from pulp mill solids have properties similar to other
common types of activated carbon in surface area and pore volume. Further research is
needed to better understand the effects of surface chemistry and porous structure on the
adsorption.
In this work, the technological feasibility of producing activated carbon from pulp
mill sludge was established; there is clearly a need to make this process economic. Since
KOH is an expensive chemical for activation, other activating agents should be studied. To
that end, a chemical that is readily available at pulp mill would be a sensible target.
63
4 Microwave-assisted Pyrolysis and Activation of Pulp Mill Sludge
Using Alkali Hydroxides2
Abstract
The aim of this chapter is to understand the effects of microwaves versus
conventional heating on the pyrolysis and activation products from a lignocellulosic biomass.
The pyrolysis and activation of pulp mill sludge samples were carried out in
a microwave oven operating at 2450 MHz with a power input of 1200 W. The properties of
the chars were compared with the ones produced by conventional furnace. The microwave
heating method shortened the pyrolysis time by more than 50%. The primary and secondary
contents of the sludge samples affected the retained carbon of the chars. Addition of a
microwave absorber (i.e. KOH) accelerated the pyrolysis reaction and assisted in the
uniformity of pyrolysis by increasing thermal diffusivity. The effects of alkali activating
agents (NaOH and KOH) on the SSA and yield (%) were studied for both microwave and
conventional activation. In microwave assisted activation, the activation yields for NaOH and
KOH activation were in the range of 40-70 wt% and 60-80 wt%, respectively. The NaOH-
activation takes 1.5 h in furnace to fabricate an activated carbon with the SSA of 2300 m2/g;
however in microwave activation, a five min activation under medium power results in
activated carbon with a similar SSA. The activation yield is mainly controlled by activation
temperature for both furnace and microwave assisted activation. Given the dual roles of the
alkali metal hydroxides as an activating agent and a microwave absorber, the pyrolysis and
activation process can be combined. Although the SSA of the combined pyrolysis and
activation (500m2/g) is lower than that of the two steps process.
2 Based on the following article: A. Namazi, C.Q. Jia, D.G. Allen (2014) Microwave Assisted Pyrolysis
and Activation of Pulp Mill Sludge Using Alkali Hydroxides, to be submitted to biomass and bioenergy journal
64
4.1 Introduction
Pulp mill sludge is a waste generated by both primary and secondary treatments in the
pulp and paper industry. The Canadian pulp and paper industry produced 7.1 million tonnes
of the dry sludge in 1995 disposed by the combustion or landfilling (Mahmood & Elliott
2006). The traditional waste disposal systems are no longer applicable and there is a demand
for effective and environmental friendly alternatives (Smith et al. 2009). The waste
management cost in the pulp and paper industry is an economic issue due to the large
quantity of the waste produced every day. Transformation of the sludge materials into value
added products would be a great benefit in terms of reducing the amount of disposable wastes
(Krigstin & Sain 2006). Pulp mill sludge can be converted into activated carbon through a
process with two steps of pyrolysis and chemical activation. In addition, it can be used at the
pulp mills for the treatment of effluents.
Pyrolysis is a thermo-chemical conversion process of biomass in an oxygen free
environment. Microwave assisted pyrolysis of biomass is an alternative technology that has
received increasing attention in recent years. Research activities have been more focused on
the production of biofuels from biomass pyrolysis and less on the char production. In general,
residues such as organic wastes, sewage sludge, tires (Appleton et al. 2005), and oil shales
are poor absorbers of microwave radiation. Microwave receptors such as carbon and metal
oxides can be mixed with the biomass to achieve the complete pyrolysis (Menéndez et al.
2002). The control of product yield is still the challenging aspects of the process, although
various efforts have been made to improve pyrolysis (Yin 2012). Also, the lack of the
dielectric properties of the biomass, the uncertainty of the actual cost, the need for
establishing the pilot test unit prevented the microwave technology from being widely used
(Fernandez et al. 2011).
Activated carbon was produced from several biomass sources through chemical
activation with the conventional furnace (Mameli et al. 2004; Amaya et al. 2007; Altenor et
al. 2009; Demirbas 2009). The pore development in alkali hydroxide activation occurs
through three steps. First, the disorganized carbon atoms are removed from the carbon matrix.
65
Second, carbon atoms are converted into carbonate Third, the metal atoms created through
the reduction of hydroxide and intercalated between the graphene layers of the char (Linares-
Solano A. et al. 2007). The hydroxide activation reaction occurs through the following
reaction illo- denas et al. 2003).
6MOH + 2C 2M + 3H2 + 2M2CO3 where M=Na, K
Equation 4.1
Many studies reported KOH as a better activating agent compared to NaOH in
the porosity development because of the higher production of intercalation compounds during
activation (Maciá-Agulló et al. 2007; Hwang et al. 2008). However, Lillo-Rodenas et al.
(2004) showed that the reactions between alkali hydroxides and carbon material begin with
the hydrogen evolution that relates to the raw material reactivity. They defined a T20 as the
indicator of the temperature for 20% of the raw material weight loss. The lower the T20 was,
the higher was the reactivity of the raw material in chemical activation reaction (Lillo-
Ródenas et al. 2004). Therefore it is necessary to study the effect of NaOH and KOH on the
activation mechanism of a specific biomass.
Recently, microwave radiation has been used for the production of activated carbon
from the char. KOH, K2CO3, H3PO4, ZnCl2, and NaOH were used as the activating agents for
microwave assisted activation of agricultural wastes. These compounds are the main
absorbers of microwave radiation at the initial stages of activation. The SSA of produced
activated carbon ranges between 700-2500 m2/g using the microwave powers between 600-
700W. KOH chemical activation of rice husk and cotton stalk chars resulted in activated
carbon with SSA of 750 m2/g (Foo & Hameed 2011; Hui et al. 2011). Ji et al. (2007)
produced activated carbon by KOH activation of coal tar pitch char using microwaves. The
produced activated carbon had SSA values between 2500 and 4100 m2/g depending on the
KOH:biomass ratios in the range of 5 to 8. NaOH microwave activation of pomelo skin
produced an activated carbon with SSA value of 1335m2/g (Foo & Hameed 2011).
66
The objectives of this study were to investigate the use of microwave radiation for
pyrolysis and activation of pulp mill sludge and to compare it with the conventional furnace
method. This paper presents the effect of the controlling factors on microwave pyrolysis and
activation of lingocellulosic materials.
4.2 Materials and methods
4.2.1 Characterization of two sludge samples
4.2.1.1 Proximate and ultimate analyses
The total ash, volatile matter, and fixed carbon of the raw materials were measured
according to ASTM methods (ASTM D3174-04 for ash analysis and ASTM D3175-89a for
volatiles). To measure ash content, the dry sludge samples were heated in a muffle furnace to
800°C, which took 3 h, and kept at the same temperature for 12 h. Volatile matter content
was measured with pyrolyzing dry samples at 850°C for 8 min without oxygen. Total fixed
carbon content was calculated by subtracting measured ash and volatile matter contents from
the dry sludge weight.
Total carbon, hydrogen, nitrogen, and oxygen elemental content of the pyrolyzed
sludge were determined using an Exeter Analytical CE-440 Elemental analyzer. Through
quantitative high temperature decomposition, solid substances undergo sublimation to form
gaseous mixtures. A 0.02 g sample was burned at 1000°C and the released gases were
separated into their components. The composition was determined with a precision and
accuracy of up to 0.1%.
4.2.1.2 Extractives, carbohydrates, lignin, and protein measurements
The extractive content was measured based on the procedure presented in the TAPPI
Standard T 264 (TAPPI 1996). Two soxhlet extraction stages using a 1:2 mixture of 95%
ethanol and analytical grade toluene and 95% ethanol were followed by pure water digestion
for 4 h. The residual material was used to determine the percentage of cellulose, hemicellulose
and lignin constituents in the following steps.
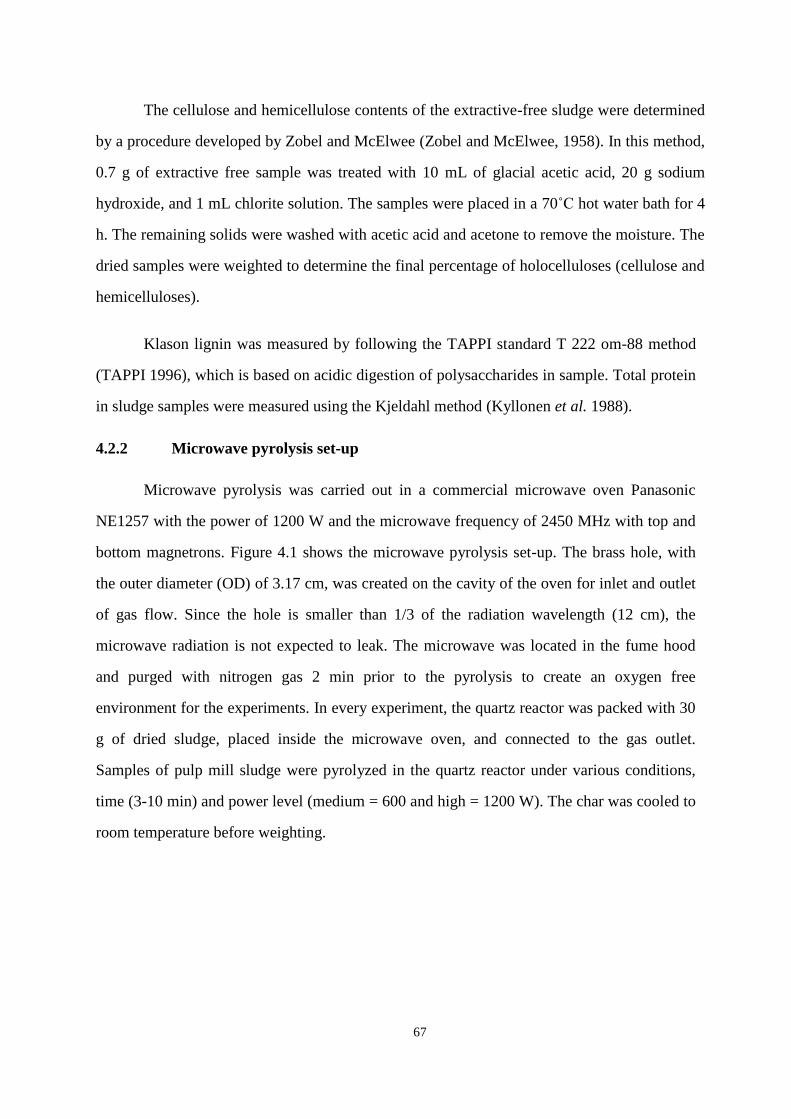
67
The cellulose and hemicellulose contents of the extractive-free sludge were determined
by a procedure developed by Zobel and McElwee (Zobel and McElwee, 1958). In this method,
0.7 g of extractive free sample was treated with 10 mL of glacial acetic acid, 20 g sodium
hydroxide, and 1 mL chlorite solution. The samples were placed in a 70˚C hot water bath for 4
h. The remaining solids were washed with acetic acid and acetone to remove the moisture. The
dried samples were weighted to determine the final percentage of holocelluloses (cellulose and
hemicelluloses).
Klason lignin was measured by following the TAPPI standard T 222 om-88 method
(TAPPI 1996), which is based on acidic digestion of polysaccharides in sample. Total protein
in sludge samples were measured using the Kjeldahl method (Kyllonen et al. 1988).
4.2.2 Microwave pyrolysis set-up
Microwave pyrolysis was carried out in a commercial microwave oven Panasonic
NE1257 with the power of 1200 W and the microwave frequency of 2450 MHz with top and
bottom magnetrons. Figure 4.1 shows the microwave pyrolysis set-up. The brass hole, with
the outer diameter (OD) of 3.17 cm, was created on the cavity of the oven for inlet and outlet
of gas flow. Since the hole is smaller than 1/3 of the radiation wavelength (12 cm), the
microwave radiation is not expected to leak. The microwave was located in the fume hood
and purged with nitrogen gas 2 min prior to the pyrolysis to create an oxygen free
environment for the experiments. In every experiment, the quartz reactor was packed with 30
g of dried sludge, placed inside the microwave oven, and connected to the gas outlet.
Samples of pulp mill sludge were pyrolyzed in the quartz reactor under various conditions,
time (3-10 min) and power level (medium = 600 and high = 1200 W). The char was cooled to
room temperature before weighting.
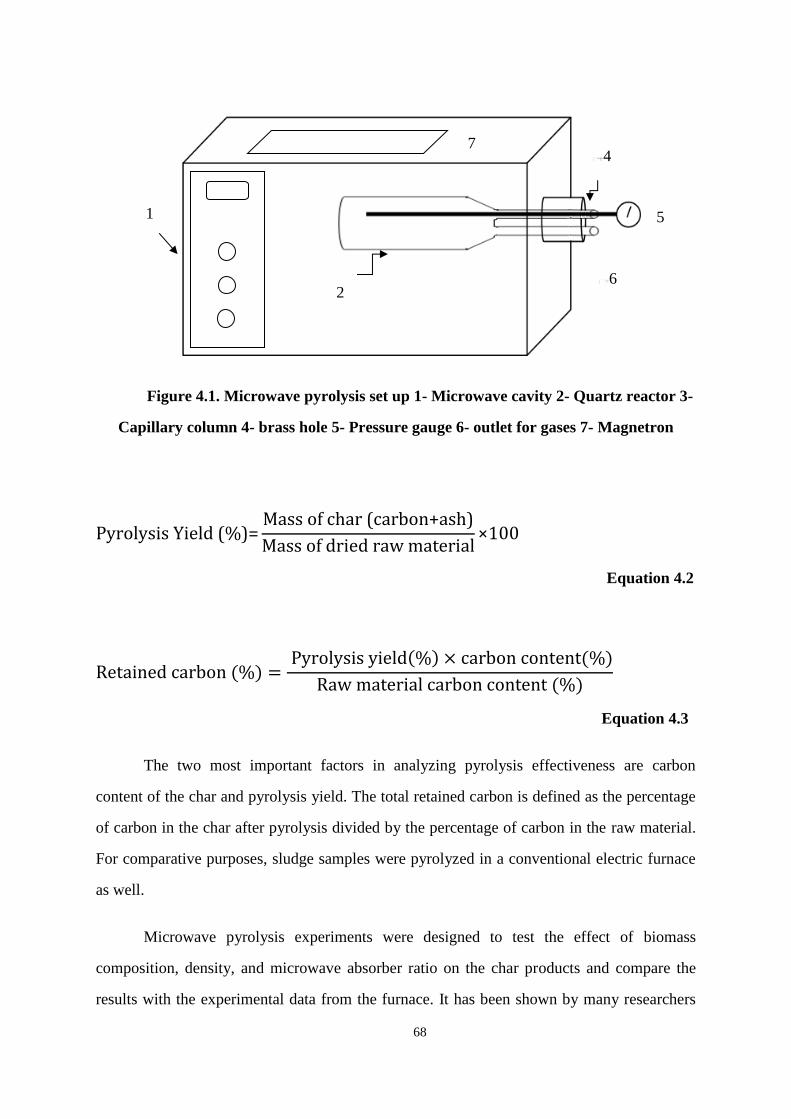
68
Figure 4.1. Microwave pyrolysis set up 1- Microwave cavity 2- Quartz reactor 3-
Capillary column 4- brass hole 5- Pressure gauge 6- outlet for gases 7- Magnetron
Equation 4.2
Equation 4.3
The two most important factors in analyzing pyrolysis effectiveness are carbon
content of the char and pyrolysis yield. The total retained carbon is defined as the percentage
of carbon in the char after pyrolysis divided by the percentage of carbon in the raw material.
For comparative purposes, sludge samples were pyrolyzed in a conventional electric furnace
as well.
Microwave pyrolysis experiments were designed to test the effect of biomass
composition, density, and microwave absorber ratio on the char products and compare the
results with the experimental data from the furnace. It has been shown by many researchers
3
1
2
5
4
6
7
69
that the interior of the sample is hotter than surroundings when heating by microwaves. This
phenomenon causes quenching of the primary volatiles on the surface of biomass samples. To
test this hypothesis, the powdered samples were pressed into small cylindrical pellets. The 2 g
pellets of sludge, lignin and cellulose were made with the diameter of 1 cm and height of 0.4
cm. The retained carbon percentages from the pyrolysis of the pellet and powder forms were
compared.
4.2.3 Microwave activation set-up
Figure 4.2. Microwave activation set-up 1- Microwave cavity 2- Pyrex shield 3-
Crucible 4- Nitrogen inlet 5- Brass hole 6- Gases outlet 7- Magnetron
Figure 4.2 shows the microwave activation set-up. Since the alkali hydroxides caused
breakage of the quartz reactor when heated at high temperatures, the ceramic crucibles were
used for chemical activation. The crucibles were covered by a Pyrex shield that has an inlet
and outlet for Nitrogen and the gases, respectively. A 5 g sample of furnace pyrolysed sludge
was homogenously mixed with ground NaOH and KOH. The activation was performed under
the condition of activating agent mass ratio to carbon of 1, 2, and 3; power levels of medium
= 600 W and high = 1200 W; and activation times of 3 and 5 minutes. The powder mixture of
char and alkali hydroxide was packed into the crucible and placed at the center of the
microwave. To create an oxygen free environment, the crucible was covered by a Pyrex
shield with an inlet for nitrogen and outlet for the activation gases. To avoid thermal runway
inside the sample, the microwave oven was stopped for five seconds after every 30 seconds
6
2
3
5
4
1
7
7
6
70
of heating. After activation and cooling, the produced activated carbon was washed by water
and 10% HCl solution until neutralized and then dried at 110°C. The SSA and activation
yield of the produced activated carbon were measured.
Surface morphology of the sample was studied using an Scanning Electron
Microscopy system Hitachi S570.
4.2.4 Specific surface area measurement
The SSA was measured by N2 adsorption at 77K using a Quantachrome Autosorb-1-
C. The samples were degassed at 200°C for 2 hours prior to the measurements. The BET, t-
plot, and BJH pore size distribution methods were used to interpret the isotherms (Brunauer
et al. 1983).
4.2.5 Comparison of microwave and furnace activation
Activated carbon samples were produced by KOH and NaOH-chemical activation
using conventional furnace, as well. A 5 g sample of the pyrolyzed char was used in each
activation experiment. The chemical activation was investigated with a focus on activating
agent mass ratio to carbon 1, 2, and 3; activation time 1 or 2 h; and activation temperatures of
800 and 1000°C. The chemical activation procedure was explained by Namazi et al. (2010).
The activated carbon samples produced by furnace and microwave assisted activation were
compared.
4.3 Results and discussion
4.3.1 Characterization of the biomasses
Two pulp mill sludge samples from a northern Ontario mill with 50-50% and 70-30%
ratio of primary-secondary sludge were used in this work. The reason for using two sludge
samples was to understand the effect of sludge composition variations on the pyrolysis. Table
4.1 shows the wood polymers contents of two samples named sludge PS50-50 and PS70-30.
The carbohydrates show the hemicelluloses and cellulose contents of the samples. PS50-50
and PS70-30 samples were very similar in their constituents except for their protein content.
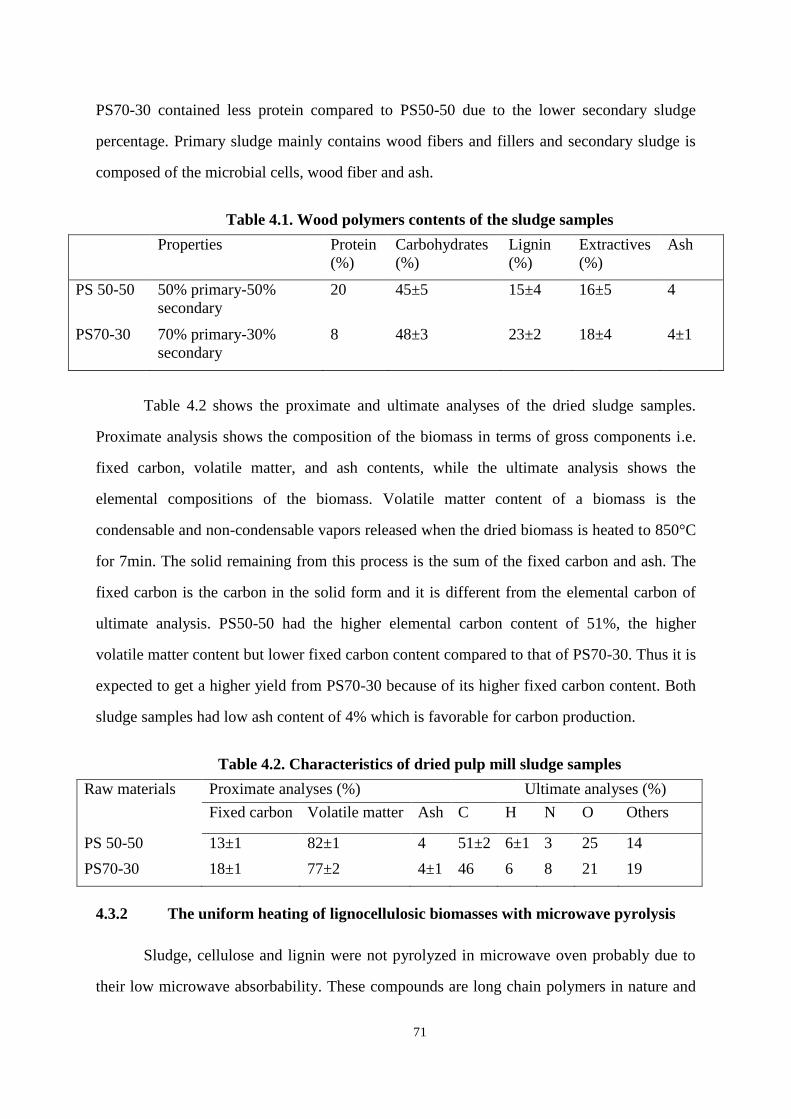
71
PS70-30 contained less protein compared to PS50-50 due to the lower secondary sludge
percentage. Primary sludge mainly contains wood fibers and fillers and secondary sludge is
composed of the microbial cells, wood fiber and ash.
Table 4.1. Wood polymers contents of the sludge samples
Properties Protein
(%)
Carbohydrates
(%)
Lignin
(%)
Extractives
(%)
Ash
PS 50-50 50% primary-50%
secondary 20 45±5 15±4 16±5 4
PS70-30 70% primary-30%
secondary 8 48±3 23±2 18±4 4±1
Table 4.2 shows the proximate and ultimate analyses of the dried sludge samples.
Proximate analysis shows the composition of the biomass in terms of gross components i.e.
fixed carbon, volatile matter, and ash contents, while the ultimate analysis shows the
elemental compositions of the biomass. Volatile matter content of a biomass is the
condensable and non-condensable vapors released when the dried biomass is heated to 850°C
for 7min. The solid remaining from this process is the sum of the fixed carbon and ash. The
fixed carbon is the carbon in the solid form and it is different from the elemental carbon of
ultimate analysis. PS50-50 had the higher elemental carbon content of 51%, the higher
volatile matter content but lower fixed carbon content compared to that of PS70-30. Thus it is
expected to get a higher yield from PS70-30 because of its higher fixed carbon content. Both
sludge samples had low ash content of 4% which is favorable for carbon production.
Table 4.2. Characteristics of dried pulp mill sludge samples
Raw materials Proximate analyses (%) Ultimate analyses (%)
Fixed carbon Volatile matter Ash C H N O Others
PS 50-50 13±1 82±1 4 51±2 6±1 3 25 14
PS70-30 18±1 77±2 4±1 46 6 8 21 19
4.3.2 The uniform heating of lignocellulosic biomasses with microwave pyrolysis
Sludge, cellulose and lignin were not pyrolyzed in microwave oven probably due to
their low microwave absorbability. These compounds are long chain polymers in nature and
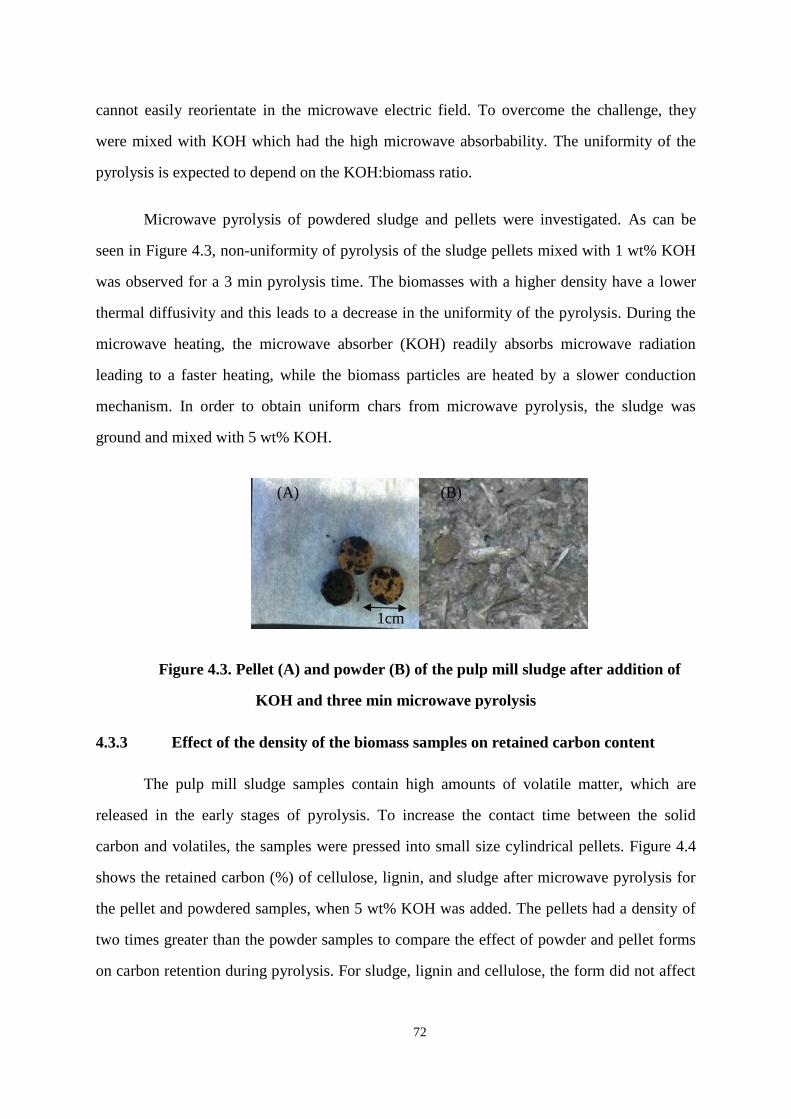
72
cannot easily reorientate in the microwave electric field. To overcome the challenge, they
were mixed with KOH which had the high microwave absorbability. The uniformity of the
pyrolysis is expected to depend on the KOH:biomass ratio.
Microwave pyrolysis of powdered sludge and pellets were investigated. As can be
seen in Figure 4.3, non-uniformity of pyrolysis of the sludge pellets mixed with 1 wt% KOH
was observed for a 3 min pyrolysis time. The biomasses with a higher density have a lower
thermal diffusivity and this leads to a decrease in the uniformity of the pyrolysis. During the
microwave heating, the microwave absorber (KOH) readily absorbs microwave radiation
leading to a faster heating, while the biomass particles are heated by a slower conduction
mechanism. In order to obtain uniform chars from microwave pyrolysis, the sludge was
ground and mixed with 5 wt% KOH.
Figure 4.3. Pellet (A) and powder (B) of the pulp mill sludge after addition of
KOH and three min microwave pyrolysis
4.3.3 Effect of the density of the biomass samples on retained carbon content
The pulp mill sludge samples contain high amounts of volatile matter, which are
released in the early stages of pyrolysis. To increase the contact time between the solid
carbon and volatiles, the samples were pressed into small size cylindrical pellets. Figure 4.4
shows the retained carbon (%) of cellulose, lignin, and sludge after microwave pyrolysis for
the pellet and powdered samples, when 5 wt% KOH was added. The pellets had a density of
two times greater than the powder samples to compare the effect of powder and pellet forms
on carbon retention during pyrolysis. For sludge, lignin and cellulose, the form did not affect
(A) (B)
1cm
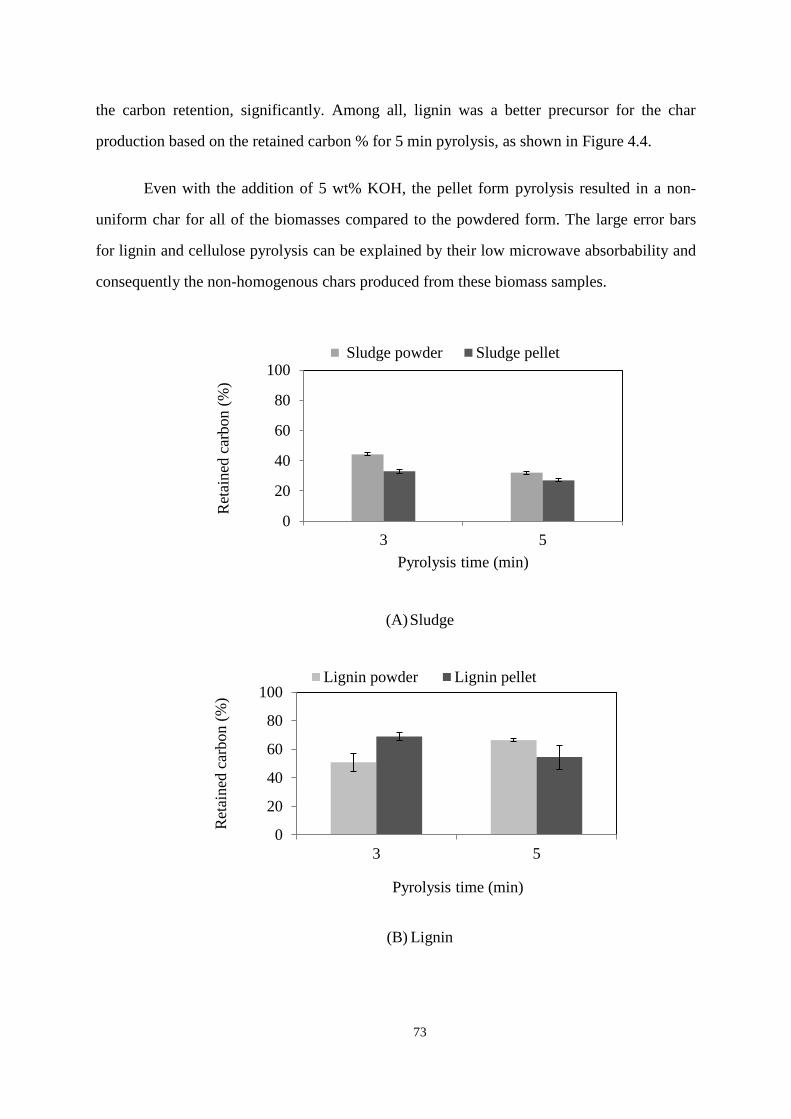
73
the carbon retention, significantly. Among all, lignin was a better precursor for the char
production based on the retained carbon % for 5 min pyrolysis, as shown in Figure 4.4.
Even with the addition of 5 wt% KOH, the pellet form pyrolysis resulted in a non-
uniform char for all of the biomasses compared to the powdered form. The large error bars
for lignin and cellulose pyrolysis can be explained by their low microwave absorbability and
consequently the non-homogenous chars produced from these biomass samples.
(A) Sludge
(B) Lignin
0
20
40
60
80
100
3 5
Ret
ained
car
bon (
%)
Pyrolysis time (min)
Sludge powder Sludge pellet
0
20
40
60
80
100
3 5
Ret
ained
car
bon (
%)
Pyrolysis time (min)
Lignin powder Lignin pellet
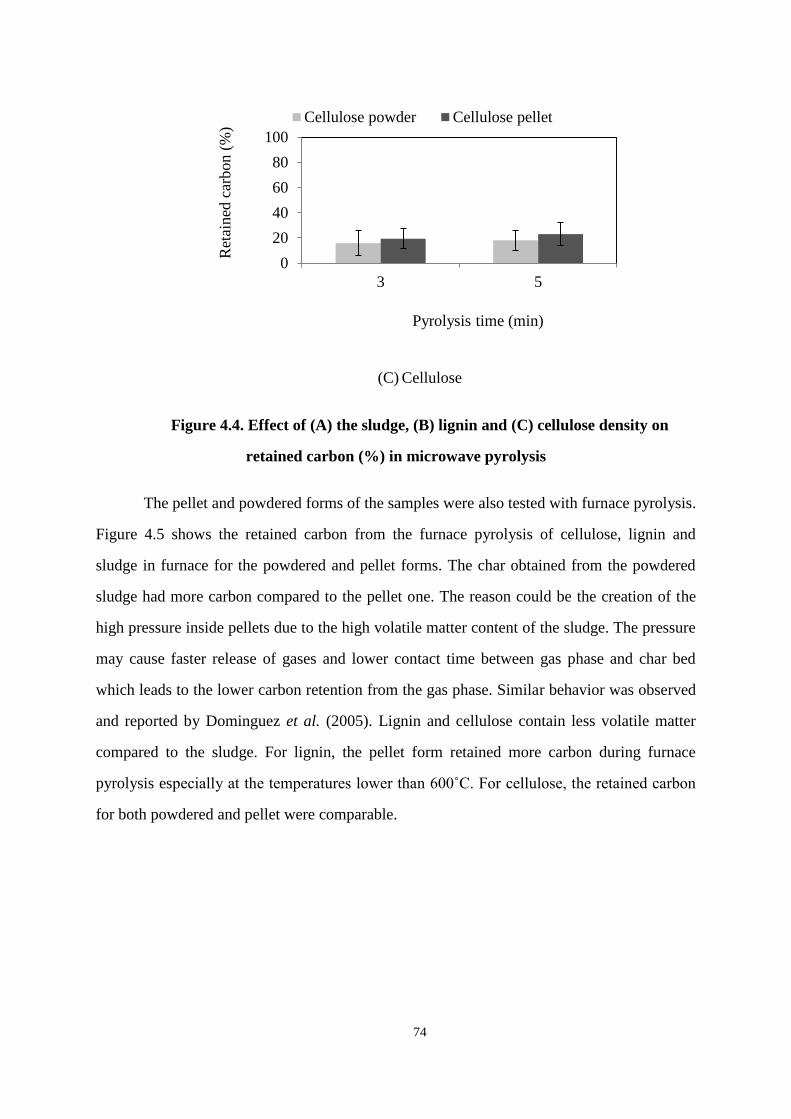
74
(C) Cellulose
Figure 4.4. Effect of (A) the sludge, (B) lignin and (C) cellulose density on
retained carbon (%) in microwave pyrolysis
The pellet and powdered forms of the samples were also tested with furnace pyrolysis.
Figure 4.5 shows the retained carbon from the furnace pyrolysis of cellulose, lignin and
sludge in furnace for the powdered and pellet forms. The char obtained from the powdered
sludge had more carbon compared to the pellet one. The reason could be the creation of the
high pressure inside pellets due to the high volatile matter content of the sludge. The pressure
may cause faster release of gases and lower contact time between gas phase and char bed
which leads to the lower carbon retention from the gas phase. Similar behavior was observed
and reported by Dominguez et al. (2005). Lignin and cellulose contain less volatile matter
compared to the sludge. For lignin, the pellet form retained more carbon during furnace
pyrolysis especially at the temperatures lower than 600˚C. For cellulose, the retained carbon
for both powdered and pellet were comparable.
0
20
40
60
80
100
3 5
Ret
ained
car
bon (
%)
Pyrolysis time (min)
Cellulose powder Cellulose pellet
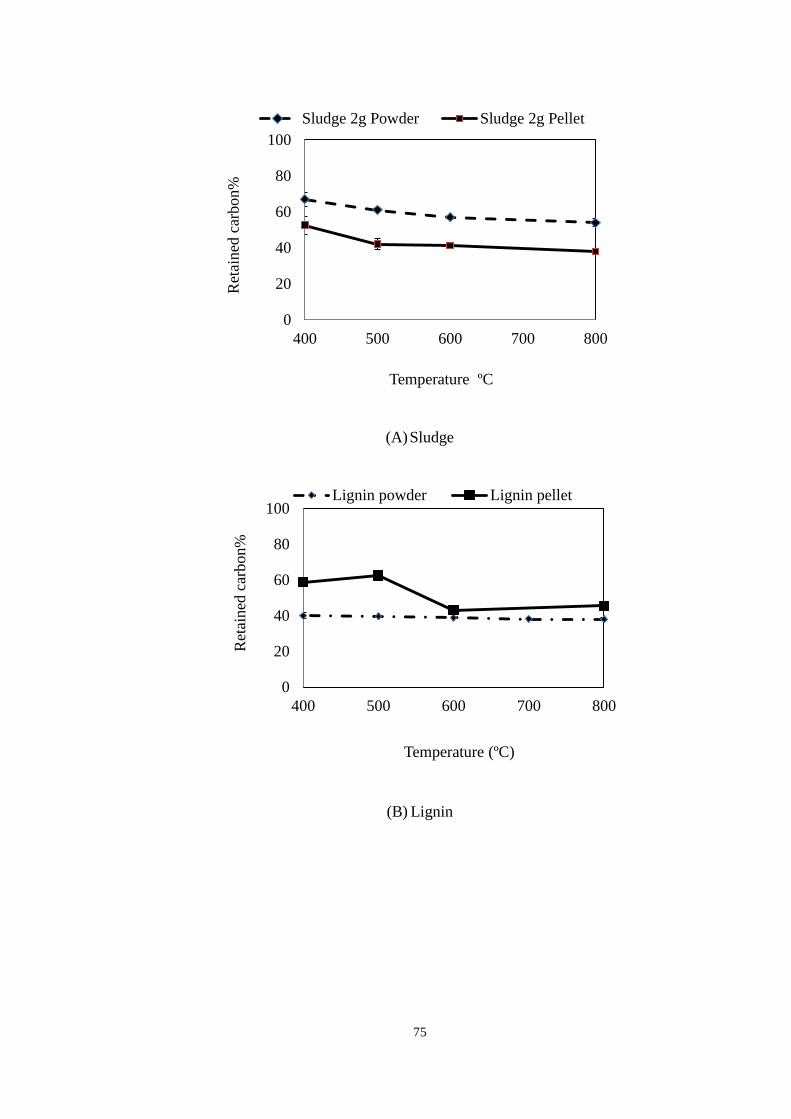
75
(A) Sludge
(B) Lignin
0
20
40
60
80
100
400 500 600 700 800
Ret
ained
car
bon%
Temperature ºC
Sludge 2g Powder Sludge 2g Pellet
0
20
40
60
80
100
400 500 600 700 800
Ret
ained
car
bon%
Temperature (ºC)
Lignin powder Lignin pellet
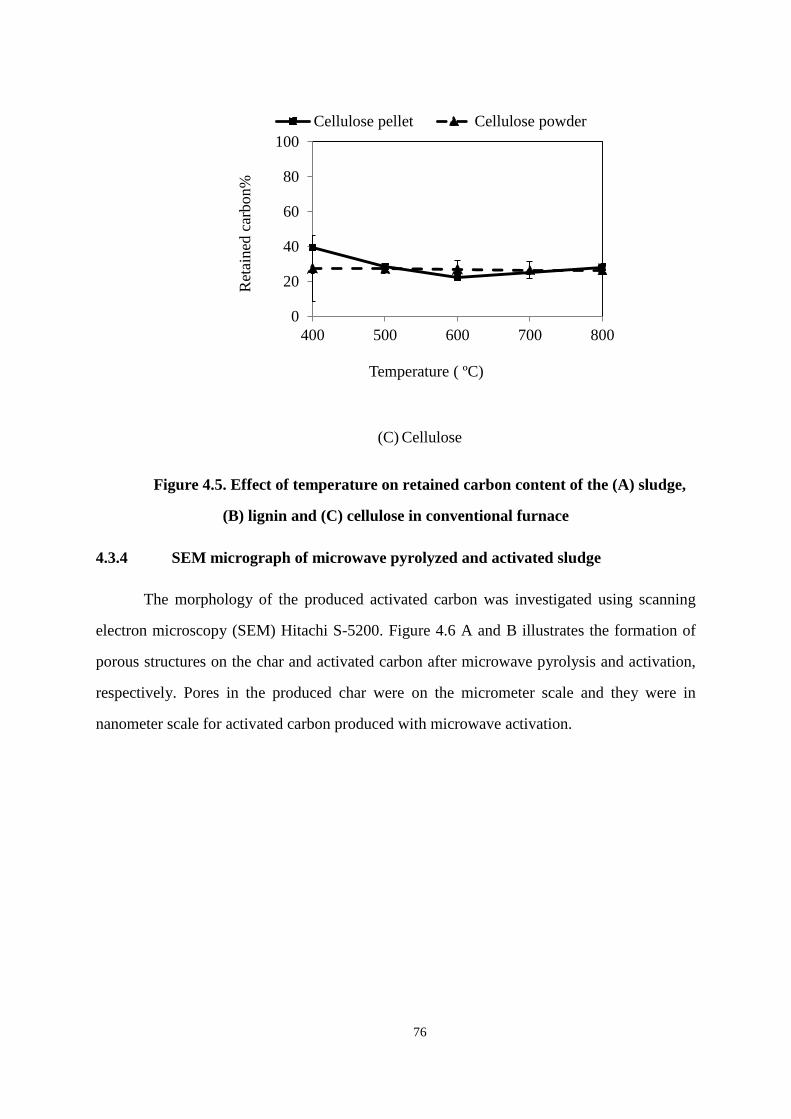
76
(C) Cellulose
Figure 4.5. Effect of temperature on retained carbon content of the (A) sludge,
(B) lignin and (C) cellulose in conventional furnace
4.3.4 SEM micrograph of microwave pyrolyzed and activated sludge
The morphology of the produced activated carbon was investigated using scanning
electron microscopy (SEM) Hitachi S-5200. Figure 4.6 A and B illustrates the formation of
porous structures on the char and activated carbon after microwave pyrolysis and activation,
respectively. Pores in the produced char were on the micrometer scale and they were in
nanometer scale for activated carbon produced with microwave activation.
0
20
40
60
80
100
400 500 600 700 800
Ret
ained
car
bon%
Temperature ( ºC)
Cellulose pellet Cellulose powder
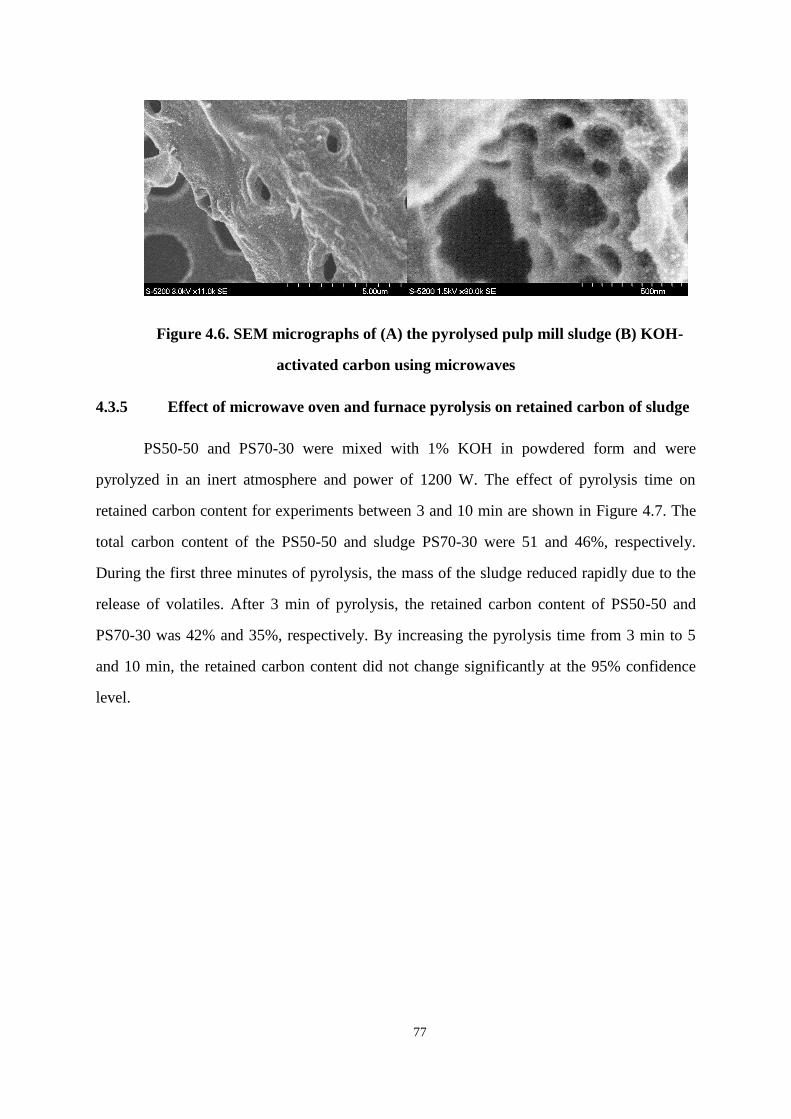
77
Figure 4.6. SEM micrographs of (A) the pyrolysed pulp mill sludge (B) KOH-
activated carbon using microwaves
4.3.5 Effect of microwave oven and furnace pyrolysis on retained carbon of sludge
PS50-50 and PS70-30 were mixed with 1% KOH in powdered form and were
pyrolyzed in an inert atmosphere and power of 1200 W. The effect of pyrolysis time on
retained carbon content for experiments between 3 and 10 min are shown in Figure 4.7. The
total carbon content of the PS50-50 and sludge PS70-30 were 51 and 46%, respectively.
During the first three minutes of pyrolysis, the mass of the sludge reduced rapidly due to the
release of volatiles. After 3 min of pyrolysis, the retained carbon content of PS50-50 and
PS70-30 was 42% and 35%, respectively. By increasing the pyrolysis time from 3 min to 5
and 10 min, the retained carbon content did not change significantly at the 95% confidence
level.
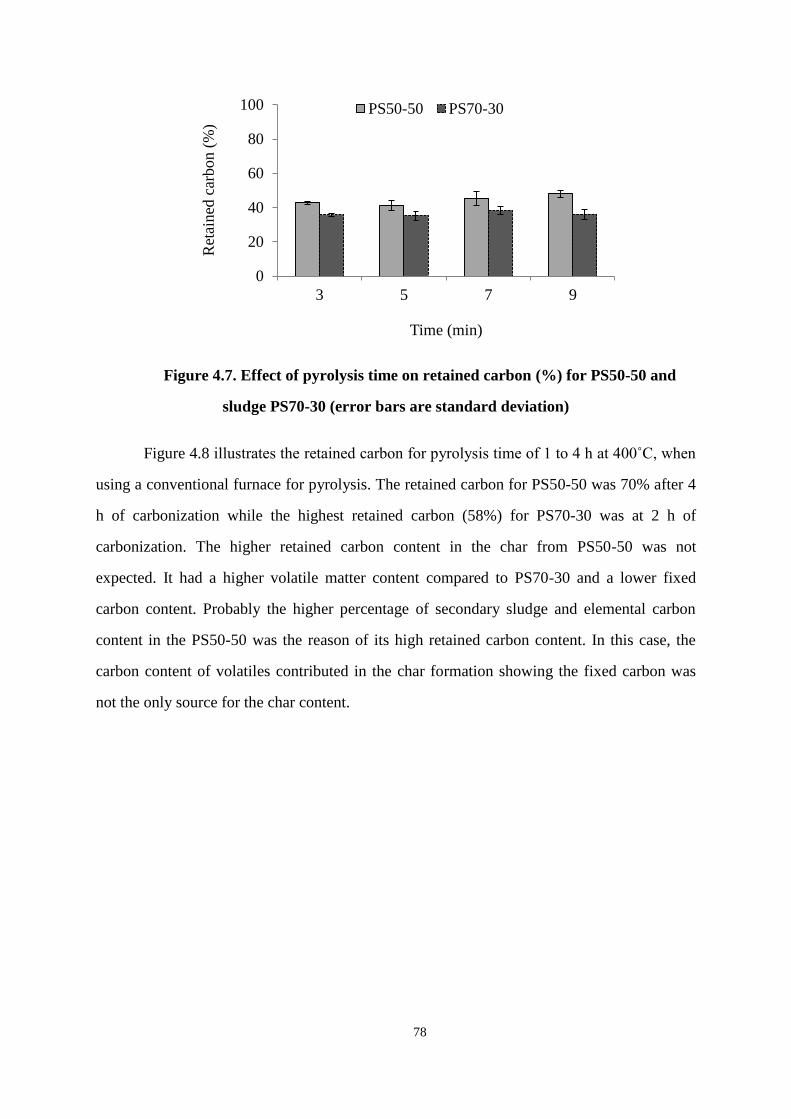
78
Figure 4.7. Effect of pyrolysis time on retained carbon (%) for PS50-50 and
sludge PS70-30 (error bars are standard deviation)
Figure 4.8 illustrates the retained carbon for pyrolysis time of 1 to 4 h at 400˚C, when
using a conventional furnace for pyrolysis. The retained carbon for PS50-50 was 70% after 4
h of carbonization while the highest retained carbon (58%) for PS70-30 was at 2 h of
carbonization. The higher retained carbon content in the char from PS50-50 was not
expected. It had a higher volatile matter content compared to PS70-30 and a lower fixed
carbon content. Probably the higher percentage of secondary sludge and elemental carbon
content in the PS50-50 was the reason of its high retained carbon content. In this case, the
carbon content of volatiles contributed in the char formation showing the fixed carbon was
not the only source for the char content.
0
20
40
60
80
100
3 5 7 9
Ret
ained
car
bon (
%)
Time (min)
PS50-50 PS70-30
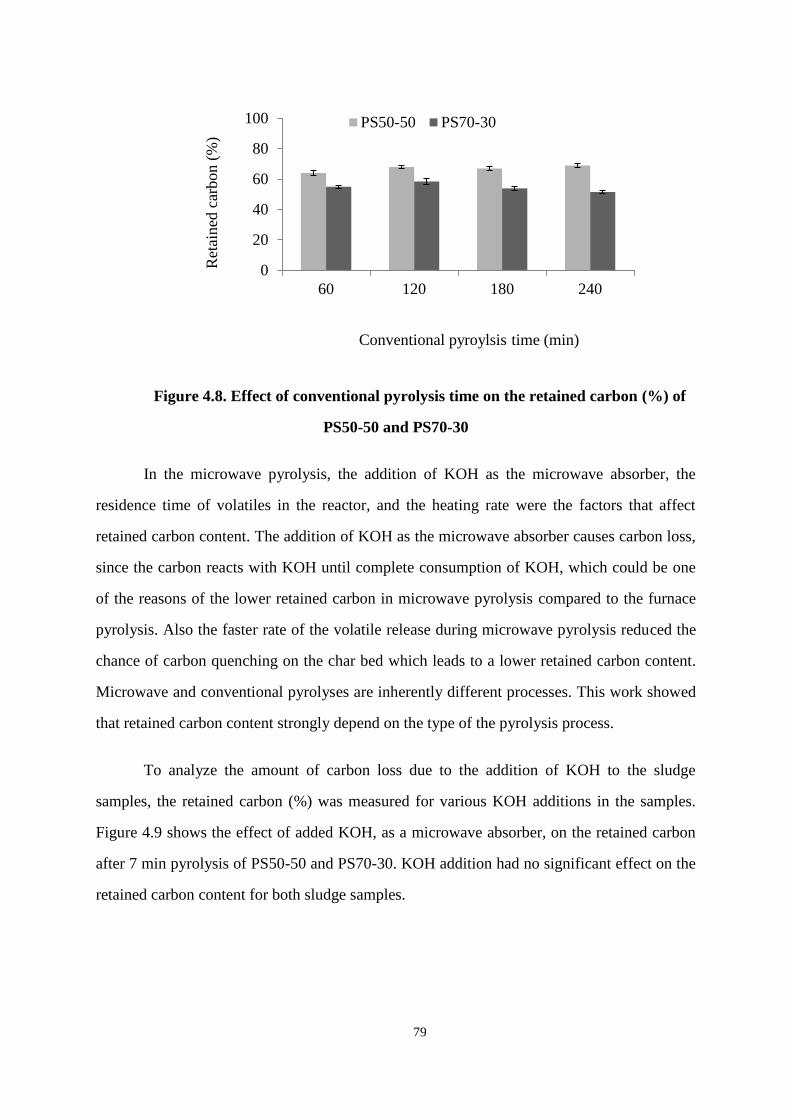
79
Figure 4.8. Effect of conventional pyrolysis time on the retained carbon (%) of
PS50-50 and PS70-30
In the microwave pyrolysis, the addition of KOH as the microwave absorber, the
residence time of volatiles in the reactor, and the heating rate were the factors that affect
retained carbon content. The addition of KOH as the microwave absorber causes carbon loss,
since the carbon reacts with KOH until complete consumption of KOH, which could be one
of the reasons of the lower retained carbon in microwave pyrolysis compared to the furnace
pyrolysis. Also the faster rate of the volatile release during microwave pyrolysis reduced the
chance of carbon quenching on the char bed which leads to a lower retained carbon content.
Microwave and conventional pyrolyses are inherently different processes. This work showed
that retained carbon content strongly depend on the type of the pyrolysis process.
To analyze the amount of carbon loss due to the addition of KOH to the sludge
samples, the retained carbon (%) was measured for various KOH additions in the samples.
Figure 4.9 shows the effect of added KOH, as a microwave absorber, on the retained carbon
after 7 min pyrolysis of PS50-50 and PS70-30. KOH addition had no significant effect on the
retained carbon content for both sludge samples.
0
20
40
60
80
100
60 120 180 240
Ret
ained
car
bon (
%)
Conventional pyroylsis time (min)
PS50-50 PS70-30
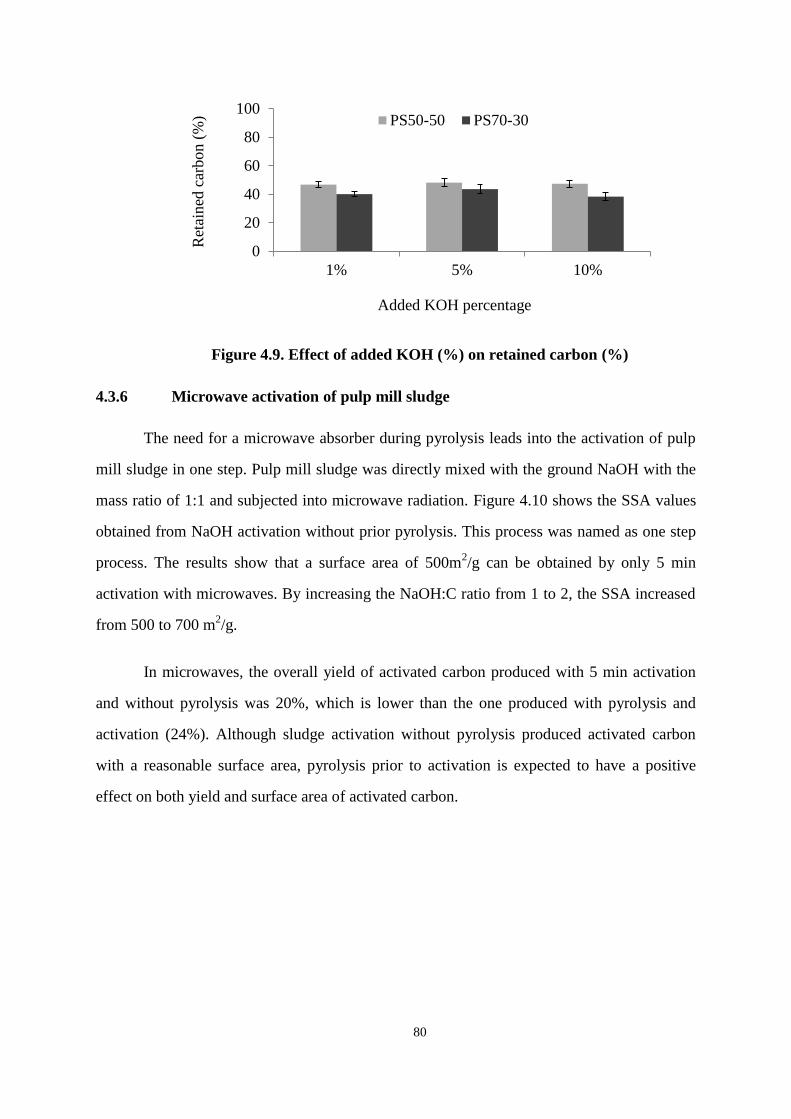
80
Figure 4.9. Effect of added KOH (%) on retained carbon (%)
4.3.6 Microwave activation of pulp mill sludge
The need for a microwave absorber during pyrolysis leads into the activation of pulp
mill sludge in one step. Pulp mill sludge was directly mixed with the ground NaOH with the
mass ratio of 1:1 and subjected into microwave radiation. Figure 4.10 shows the SSA values
obtained from NaOH activation without prior pyrolysis. This process was named as one step
process. The results show that a surface area of 500m2/g can be obtained by only 5 min
activation with microwaves. By increasing the NaOH:C ratio from 1 to 2, the SSA increased
from 500 to 700 m2/g.
In microwaves, the overall yield of activated carbon produced with 5 min activation
and without pyrolysis was 20%, which is lower than the one produced with pyrolysis and
activation (24%). Although sludge activation without pyrolysis produced activated carbon
with a reasonable surface area, pyrolysis prior to activation is expected to have a positive
effect on both yield and surface area of activated carbon.
0
20
40
60
80
100
1% 5% 10%
Ret
ained
car
bon (
%)
Added KOH percentage
PS50-50 PS70-30
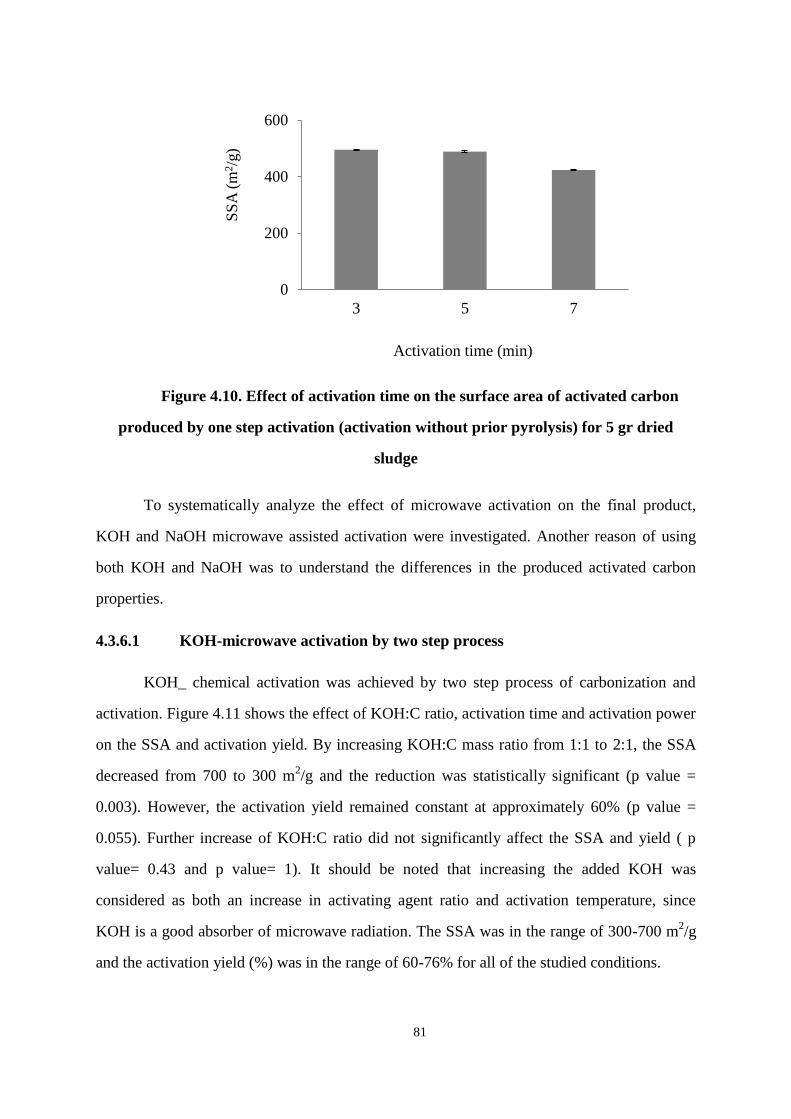
81
Figure 4.10. Effect of activation time on the surface area of activated carbon
produced by one step activation (activation without prior pyrolysis) for 5 gr dried
sludge
To systematically analyze the effect of microwave activation on the final product,
KOH and NaOH microwave assisted activation were investigated. Another reason of using
both KOH and NaOH was to understand the differences in the produced activated carbon
properties.
4.3.6.1 KOH-microwave activation by two step process
KOH_ chemical activation was achieved by two step process of carbonization and
activation. Figure 4.11 shows the effect of KOH:C ratio, activation time and activation power
on the SSA and activation yield. By increasing KOH:C mass ratio from 1:1 to 2:1, the SSA
decreased from 700 to 300 m2/g and the reduction was statistically significant (p value =
0.003). However, the activation yield remained constant at approximately 60% (p value =
0.055). Further increase of KOH:C ratio did not significantly affect the SSA and yield ( p
value= 0.43 and p value= 1). It should be noted that increasing the added KOH was
considered as both an increase in activating agent ratio and activation temperature, since
KOH is a good absorber of microwave radiation. The SSA was in the range of 300-700 m2/g
and the activation yield (%) was in the range of 60-76% for all of the studied conditions.
0
200
400
600
3 5 7
SS
A (
m2/g
)
Activation time (min)
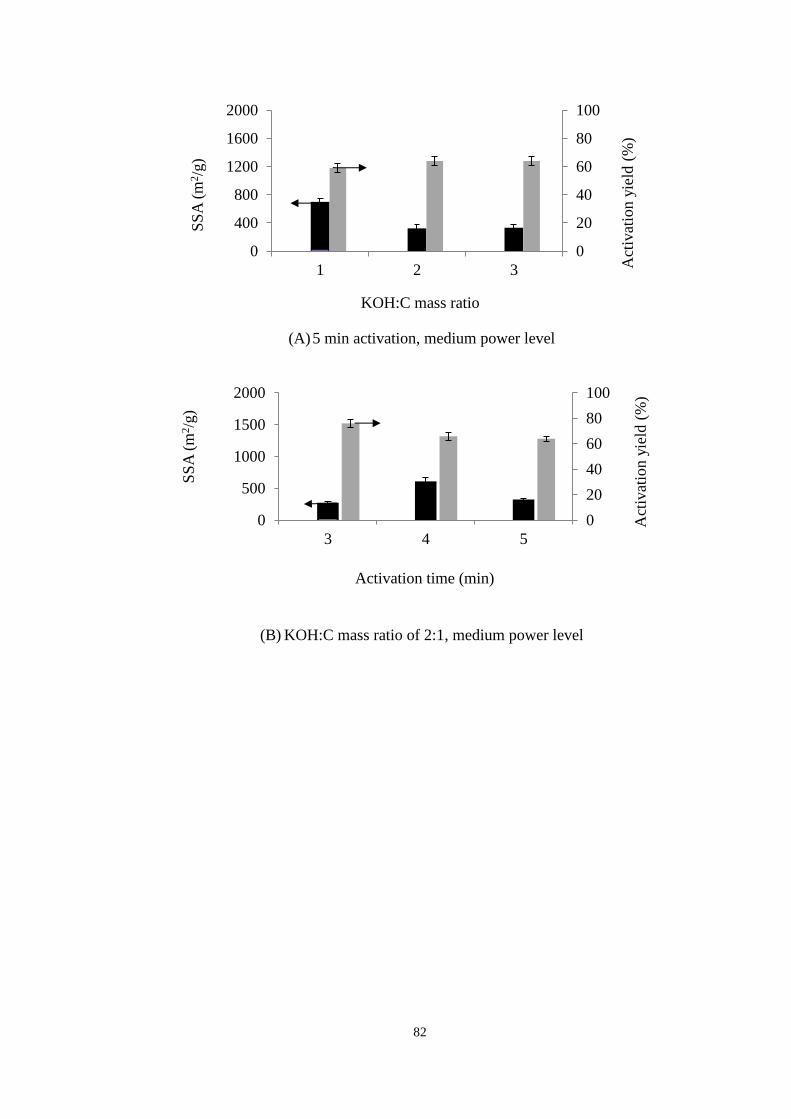
82
(A) 5 min activation, medium power level
(B) KOH:C mass ratio of 2:1, medium power level
0
20
40
60
80
100
0
400
800
1200
1600
2000
1 2 3 Act
ivat
ion y
ield
(%
)
SS
A (
m2/g
)
KOH:C mass ratio
0
20
40
60
80
100
0
500
1000
1500
2000
3 4 5
Act
ivat
ion y
ield
(%
)
SS
A (
m2/g
)
Activation time (min)
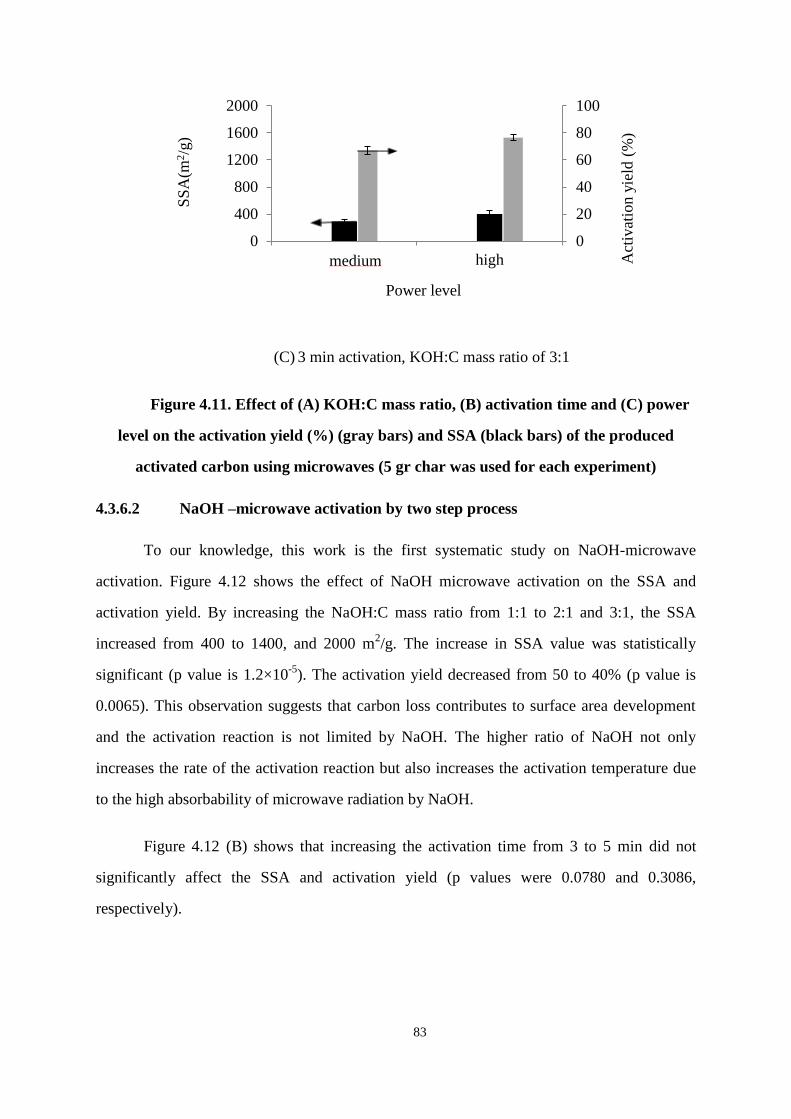
83
(C) 3 min activation, KOH:C mass ratio of 3:1
Figure 4.11. Effect of (A) KOH:C mass ratio, (B) activation time and (C) power
level on the activation yield (%) (gray bars) and SSA (black bars) of the produced
activated carbon using microwaves (5 gr char was used for each experiment)
4.3.6.2 NaOH –microwave activation by two step process
To our knowledge, this work is the first systematic study on NaOH-microwave
activation. Figure 4.12 shows the effect of NaOH microwave activation on the SSA and
activation yield. By increasing the NaOH:C mass ratio from 1:1 to 2:1 and 3:1, the SSA
increased from 400 to 1400, and 2000 m2/g. The increase in SSA value was statistically
significant (p value is 1.2×10⁻⁵
). The activation yield decreased from 50 to 40% (p value is
0.0065). This observation suggests that carbon loss contributes to surface area development
and the activation reaction is not limited by NaOH. The higher ratio of NaOH not only
increases the rate of the activation reaction but also increases the activation temperature due
to the high absorbability of microwave radiation by NaOH.
Figure 4.12 (B) shows that increasing the activation time from 3 to 5 min did not
significantly affect the SSA and activation yield (p values were 0.0780 and 0.3086,
respectively).
0
20
40
60
80
100
0
400
800
1200
1600
2000
med high Act
ivat
ion y
ield
(%
)
SS
A(m
2/g
)
Power level
medium
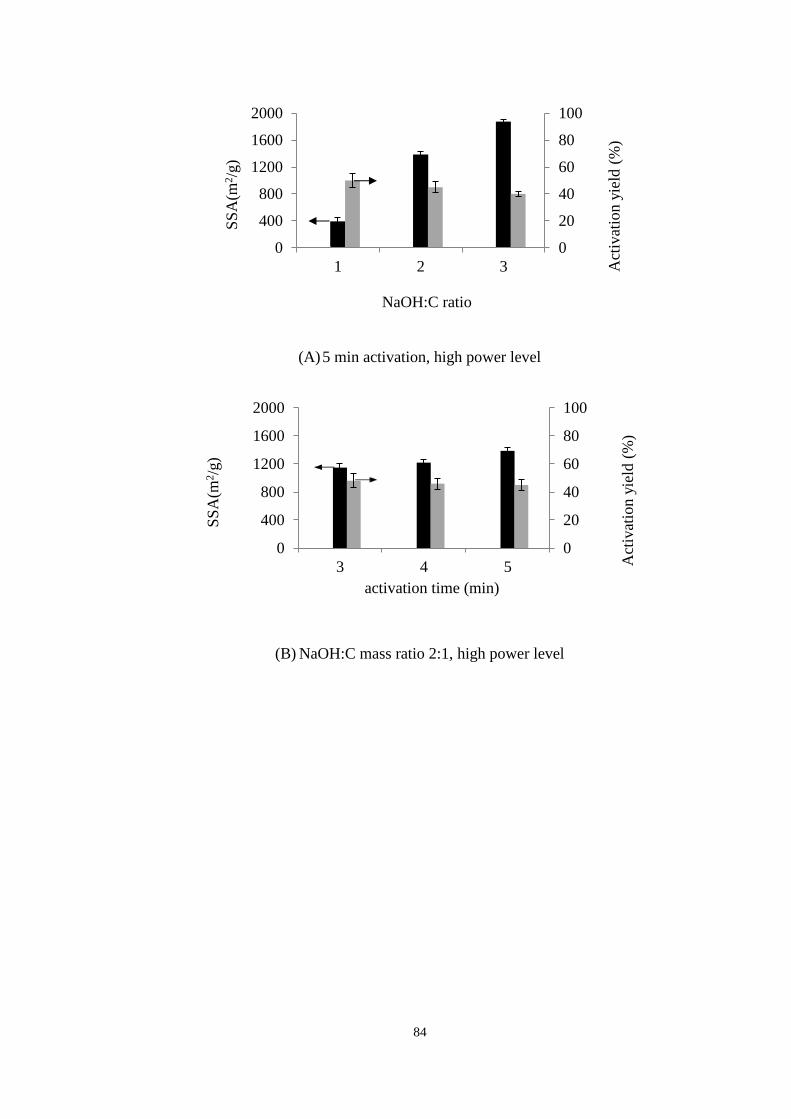
84
(A) 5 min activation, high power level
(B) NaOH:C mass ratio 2:1, high power level
0
20
40
60
80
100
0
400
800
1200
1600
2000
1 2 3 Act
ivat
ion y
ield
(%
)
SS
A(m
2/g
)
NaOH:C ratio
0
20
40
60
80
100
0
400
800
1200
1600
2000
3 4 5 Act
ivat
ion y
ield
(%
)
SS
A(m
2/g
)
activation time (min)
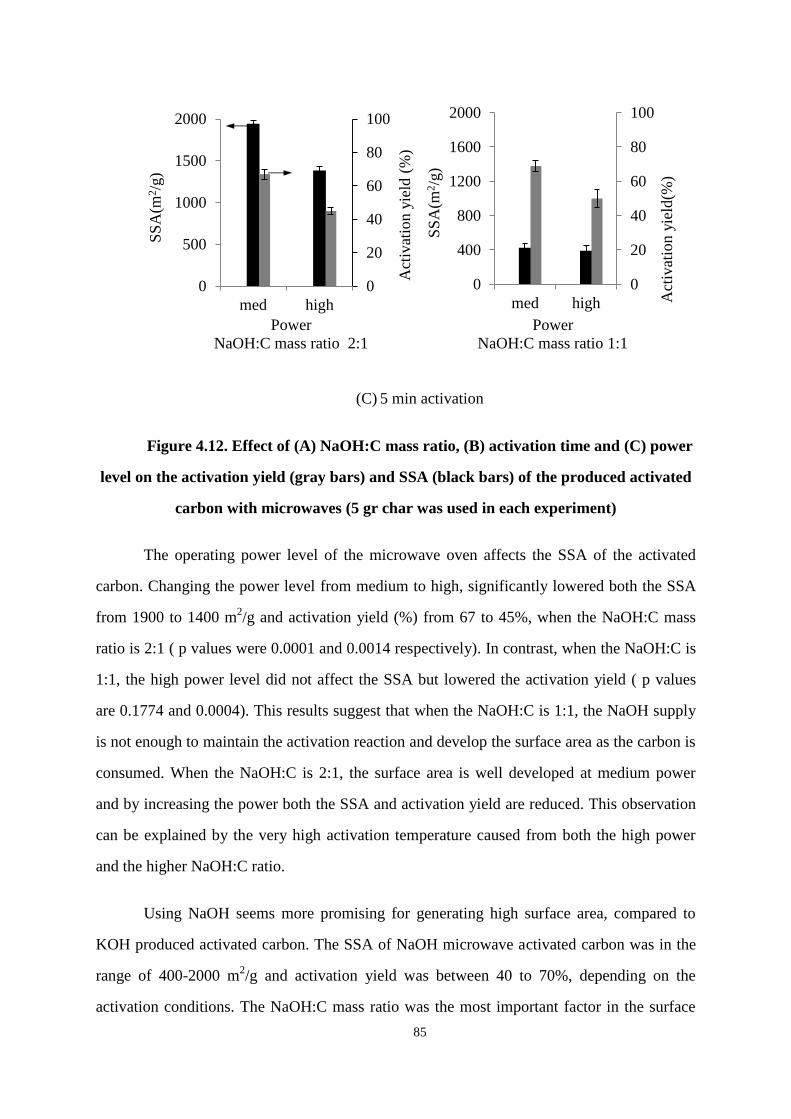
85
(C) 5 min activation
Figure 4.12. Effect of (A) NaOH:C mass ratio, (B) activation time and (C) power
level on the activation yield (gray bars) and SSA (black bars) of the produced activated
carbon with microwaves (5 gr char was used in each experiment)
The operating power level of the microwave oven affects the SSA of the activated
carbon. Changing the power level from medium to high, significantly lowered both the SSA
from 1900 to 1400 m2/g and activation yield (%) from 67 to 45%, when the NaOH:C mass
ratio is 2:1 ( p values were 0.0001 and 0.0014 respectively). In contrast, when the NaOH:C is
1:1, the high power level did not affect the SSA but lowered the activation yield ( p values
are 0.1774 and 0.0004). This results suggest that when the NaOH:C is 1:1, the NaOH supply
is not enough to maintain the activation reaction and develop the surface area as the carbon is
consumed. When the NaOH:C is 2:1, the surface area is well developed at medium power
and by increasing the power both the SSA and activation yield are reduced. This observation
can be explained by the very high activation temperature caused from both the high power
and the higher NaOH:C ratio.
Using NaOH seems more promising for generating high surface area, compared to
KOH produced activated carbon. The SSA of NaOH microwave activated carbon was in the
range of 400-2000 m2/g and activation yield was between 40 to 70%, depending on the
activation conditions. The NaOH:C mass ratio was the most important factor in the surface
0
20
40
60
80
100
0
500
1000
1500
2000
med high
Act
ivat
ion y
ield
(%
)
SS
A(m
2/g
)
Power
NaOH:C mass ratio 2:1
0
20
40
60
80
100
0
400
800
1200
1600
2000
med high Act
ivat
ion
yie
ld(%
)
SS
A(m
2/g
)
Power
NaOH:C mass ratio 1:1
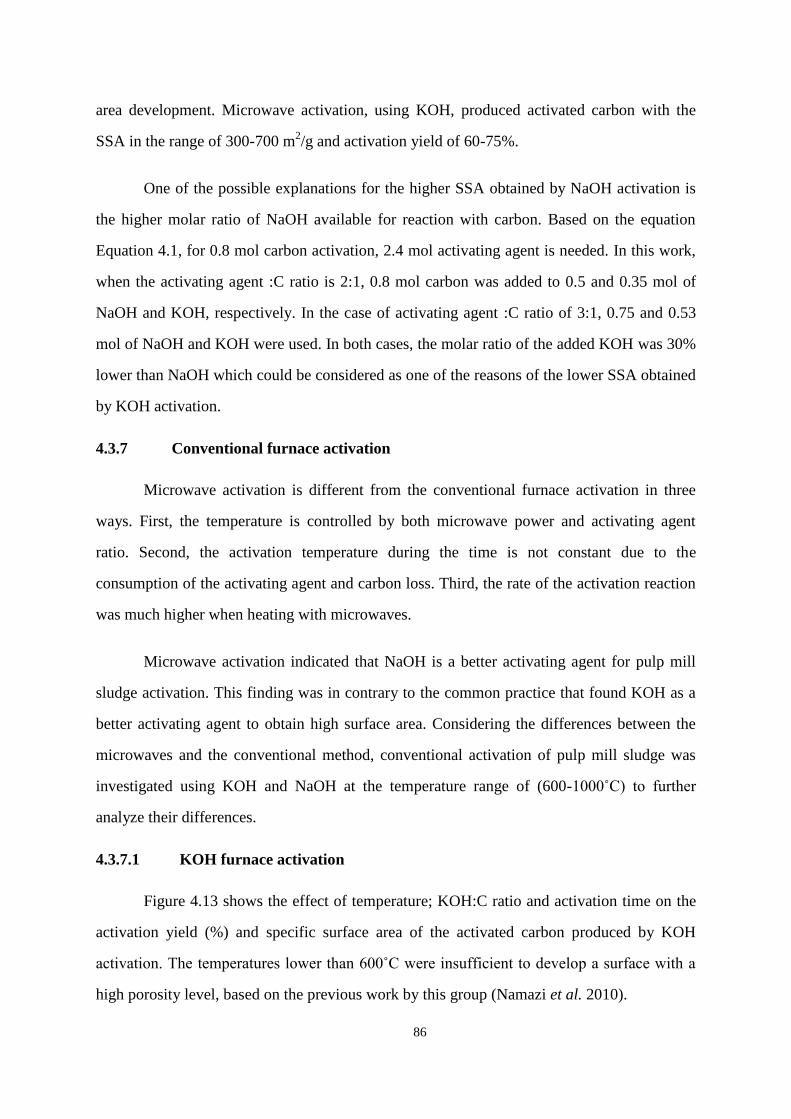
86
area development. Microwave activation, using KOH, produced activated carbon with the
SSA in the range of 300-700 m2/g and activation yield of 60-75%.
One of the possible explanations for the higher SSA obtained by NaOH activation is
the higher molar ratio of NaOH available for reaction with carbon. Based on the equation
Equation 4.1, for 0.8 mol carbon activation, 2.4 mol activating agent is needed. In this work,
when the activating agent :C ratio is 2:1, 0.8 mol carbon was added to 0.5 and 0.35 mol of
NaOH and KOH, respectively. In the case of activating agent :C ratio of 3:1, 0.75 and 0.53
mol of NaOH and KOH were used. In both cases, the molar ratio of the added KOH was 30%
lower than NaOH which could be considered as one of the reasons of the lower SSA obtained
by KOH activation.
4.3.7 Conventional furnace activation
Microwave activation is different from the conventional furnace activation in three
ways. First, the temperature is controlled by both microwave power and activating agent
ratio. Second, the activation temperature during the time is not constant due to the
consumption of the activating agent and carbon loss. Third, the rate of the activation reaction
was much higher when heating with microwaves.
Microwave activation indicated that NaOH is a better activating agent for pulp mill
sludge activation. This finding was in contrary to the common practice that found KOH as a
better activating agent to obtain high surface area. Considering the differences between the
microwaves and the conventional method, conventional activation of pulp mill sludge was
investigated using KOH and NaOH at the temperature range of (600-1000˚C) to further
analyze their differences.
4.3.7.1 KOH furnace activation
Figure 4.13 shows the effect of temperature; KOH:C ratio and activation time on the
activation yield (%) and specific surface area of the activated carbon produced by KOH
activation. The temperatures lower than 600˚C were insufficient to develop a surface with a
high porosity level, based on the previous work by this group (Namazi et al. 2010).
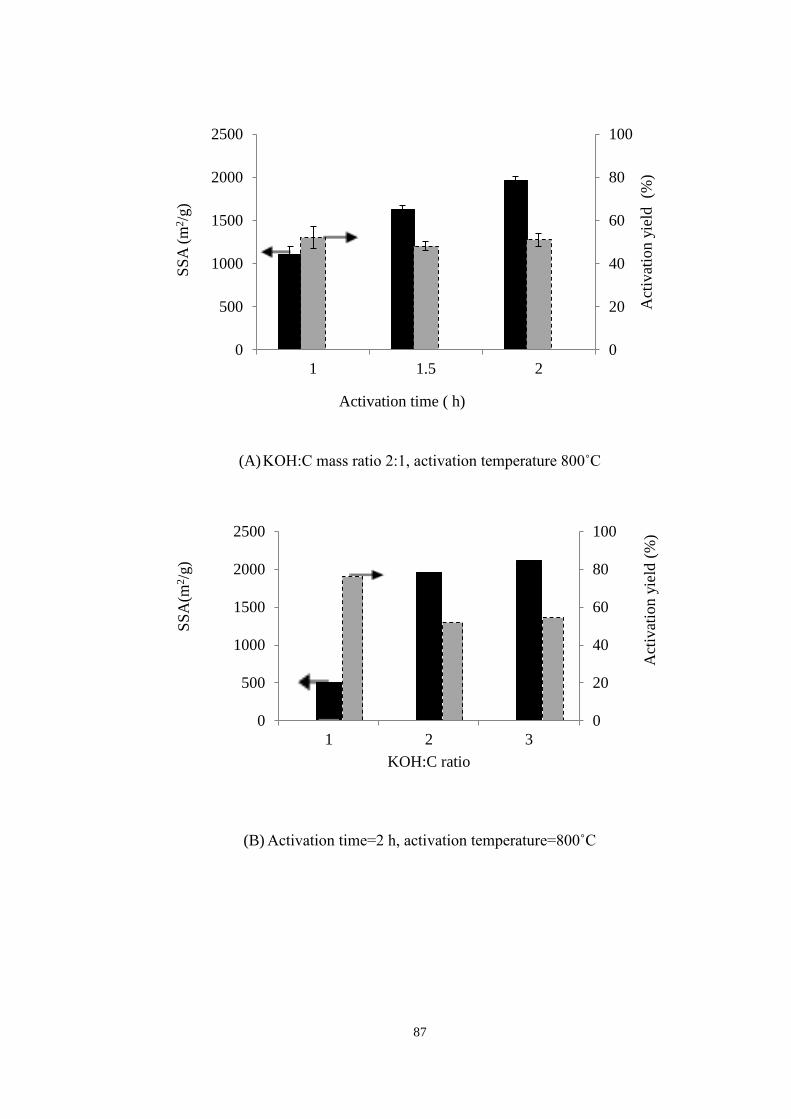
87
(A) KOH:C mass ratio 2:1, activation temperature 800˚C
(B) Activation time=2 h, activation temperature=800˚C
0
20
40
60
80
100
0
500
1000
1500
2000
2500
1 1.5 2
Act
ivat
ion y
ield
(%
)
SS
A (
m2/g
)
Activation time ( h)
0
20
40
60
80
100
0
500
1000
1500
2000
2500
1 2 3
Act
ivat
ion y
ield
(%
)
SS
A(m
2/g
)
KOH:C ratio
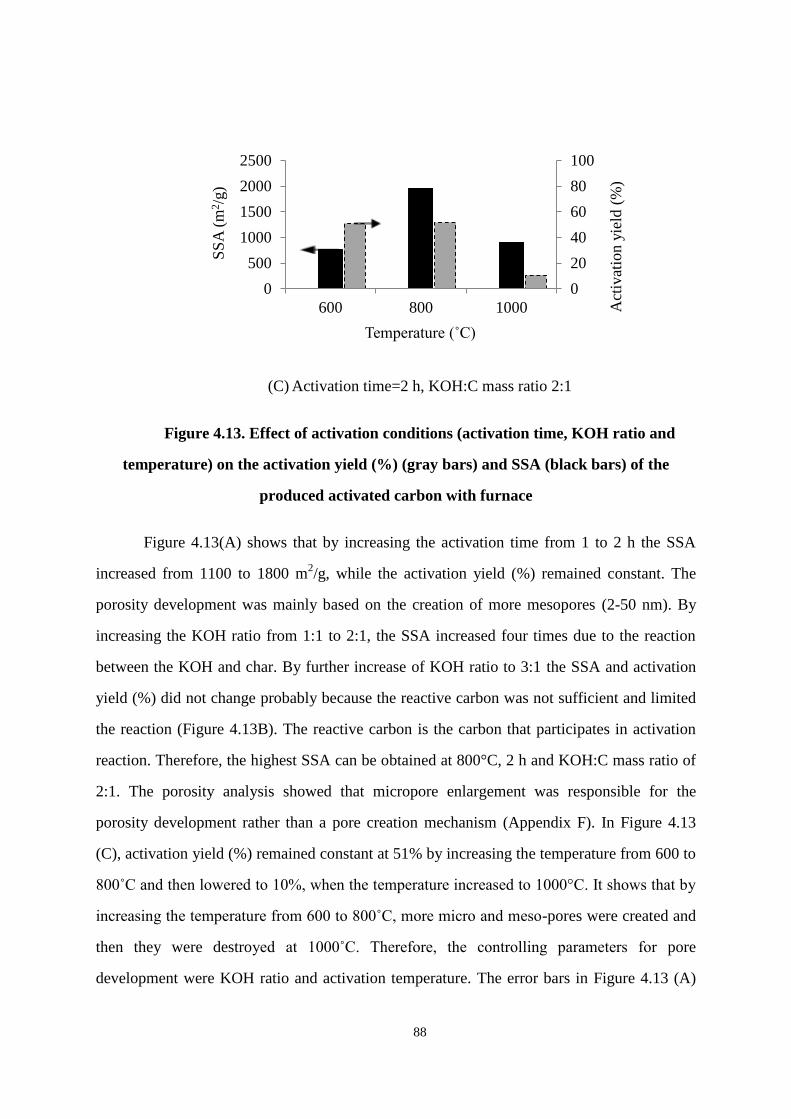
88
(C) Activation time=2 h, KOH:C mass ratio 2:1
Figure 4.13. Effect of activation conditions (activation time, KOH ratio and
temperature) on the activation yield (%) (gray bars) and SSA (black bars) of the
produced activated carbon with furnace
Figure 4.13(A) shows that by increasing the activation time from 1 to 2 h the SSA
increased from 1100 to 1800 m2/g, while the activation yield (%) remained constant. The
porosity development was mainly based on the creation of more mesopores (2-50 nm). By
increasing the KOH ratio from 1:1 to 2:1, the SSA increased four times due to the reaction
between the KOH and char. By further increase of KOH ratio to 3:1 the SSA and activation
yield (%) did not change probably because the reactive carbon was not sufficient and limited
the reaction (Figure 4.13B). The reactive carbon is the carbon that participates in activation
reaction. Therefore, the highest SSA can be obtained at 800°C, 2 h and KOH:C mass ratio of
2:1. The porosity analysis showed that micropore enlargement was responsible for the
porosity development rather than a pore creation mechanism (Appendix F). In Figure 4.13
(C), activation yield (%) remained constant at 51% by increasing the temperature from 600 to
800˚C and then lowered to 10%, when the temperature increased to 1000°C. It shows that by
increasing the temperature from 600 to 800˚C, more micro and meso-pores were created and
then they were destroyed at 1000˚C. Therefore, the controlling parameters for pore
development were KOH ratio and activation temperature. The error bars in Figure 4.13 (A)
0
20
40
60
80
100
0
500
1000
1500
2000
2500
600 800 1000 Act
ivat
ion y
ield
(%
)
SS
A (
m2/g
)
Temperature ˚C)
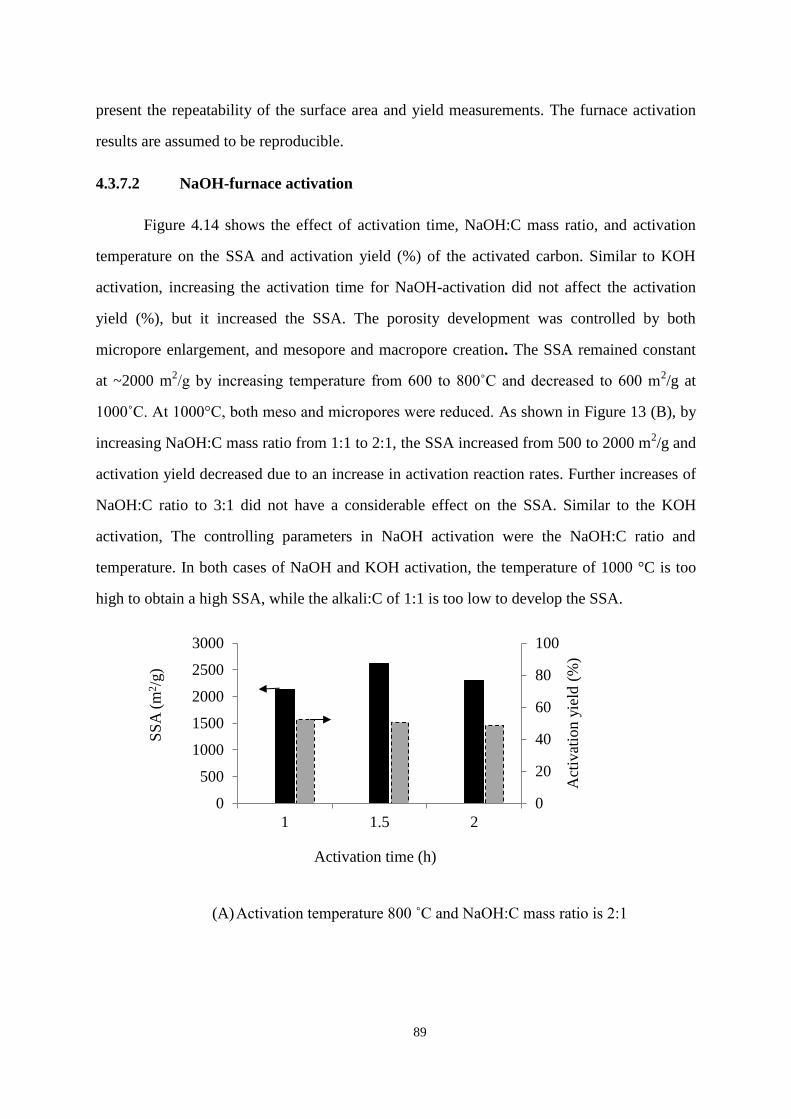
89
present the repeatability of the surface area and yield measurements. The furnace activation
results are assumed to be reproducible.
4.3.7.2 NaOH-furnace activation
Figure 4.14 shows the effect of activation time, NaOH:C mass ratio, and activation
temperature on the SSA and activation yield (%) of the activated carbon. Similar to KOH
activation, increasing the activation time for NaOH-activation did not affect the activation
yield (%), but it increased the SSA. The porosity development was controlled by both
micropore enlargement, and mesopore and macropore creation. The SSA remained constant
at ~2000 m2/g by increasing temperature from 600 to 800˚C and decreased to 600 m
2/g at
1000˚C. At 1000°C, both meso and micropores were reduced. As shown in Figure 13 (B), by
increasing NaOH:C mass ratio from 1:1 to 2:1, the SSA increased from 500 to 2000 m2/g and
activation yield decreased due to an increase in activation reaction rates. Further increases of
NaOH:C ratio to 3:1 did not have a considerable effect on the SSA. Similar to the KOH
activation, The controlling parameters in NaOH activation were the NaOH:C ratio and
temperature. In both cases of NaOH and KOH activation, the temperature of 1000 °C is too
high to obtain a high SSA, while the alkali:C of 1:1 is too low to develop the SSA.
(A) Activation temperature 800 ˚C and NaOH:C mass ratio is 2:1
0
20
40
60
80
100
0
500
1000
1500
2000
2500
3000
1 1.5 2
Act
ivat
ion y
ield
(%
)
SS
A (
m2/g
)
Activation time (h)
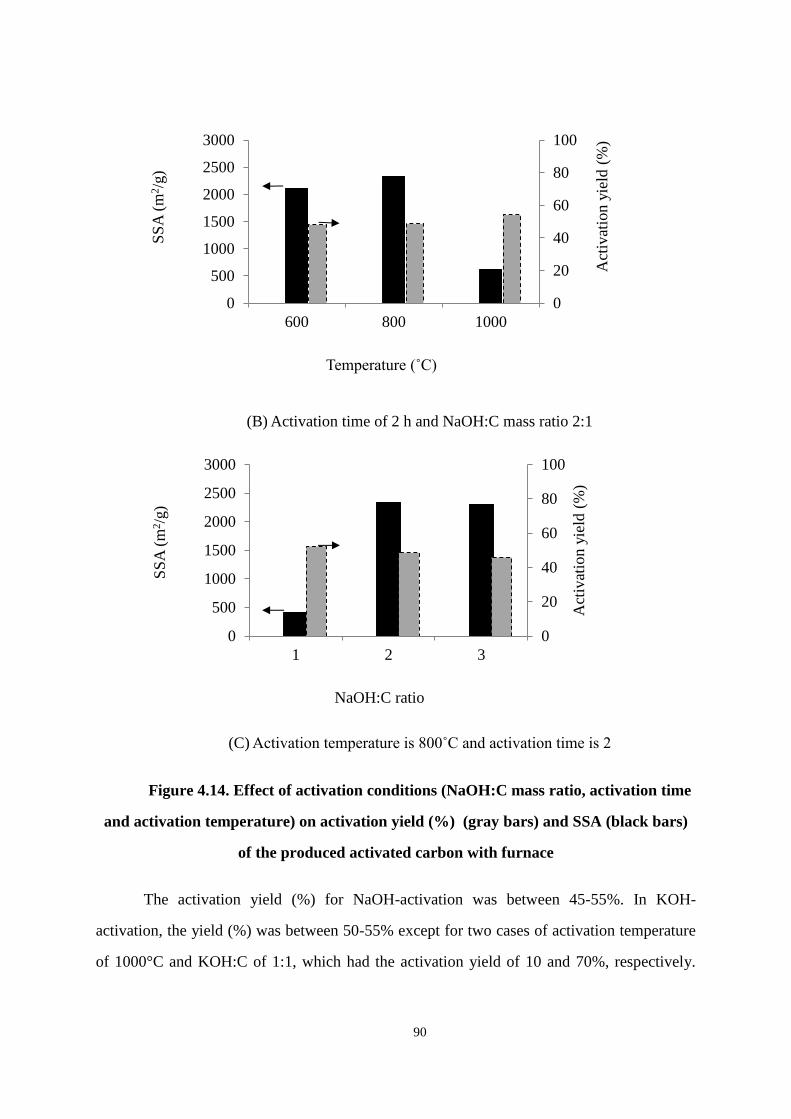
90
(B) Activation time of 2 h and NaOH:C mass ratio 2:1
(C) Activation temperature is 800˚C and activation time is 2
Figure 4.14. Effect of activation conditions (NaOH:C mass ratio, activation time
and activation temperature) on activation yield (%) (gray bars) and SSA (black bars)
of the produced activated carbon with furnace
The activation yield (%) for NaOH-activation was between 45-55%. In KOH-
activation, the yield (%) was between 50-55% except for two cases of activation temperature
of 1000°C and KOH:C of 1:1, which had the activation yield of 10 and 70%, respectively.
0
20
40
60
80
100
0
500
1000
1500
2000
2500
3000
600 800 1000
Act
ivat
ion y
ield
(%
)
SS
A (
m2/g
)
Temperature ˚C)
0
20
40
60
80
100
0
500
1000
1500
2000
2500
3000
1 2 3
Act
ivat
ion y
ield
(%
)
SS
A (
m2/g
)
NaOH:C ratio
91
When the temperature increases to 1000°C, more carbon loss and less mesoporous reduction
occurred in KOH activation compared to NaOH (pore size distribution data in Appendix F).
Comparison of KOH and NaOH furnace activation results showed that NaOH is a
better activating agent for production of activated carbon from pulp mill sludge because it
creates higher SSA of 2000 m2/g and the surface area is well developed even at a moderate
activation temperature of 600°C. When using NaOH, the porous structure was developed in a
shorter period of time (1.5 h) via meso and macropore creation mechanism. In KOH
activation, mesopores were created after 2 h. The activating agent ratio of 2 was sufficient to
obtain high SSA for both NaOH and KOH at 800°C. For both KOH and NaOH activation,
the higher activating agent mass ratio of 3:1 did not cause significant increase in SSA,
because of the moderate carbon content of 60% available for the reaction.
The reason that NaOH is better than KOH cannot be only explained by the addition of
30% higher molar ratio of NaOH in the activation compared to KOH- activation. The results
showed that the activation with a higher molar ratio of KOH did not increase the SSA
significantly. It is possible that the properties of the precursor affect the SSA and yield of
activation by KOH and NaOH. Lillo-Rodenas et al. (2007) demonstrated that as the reactivity
of a precursor increases, NaOH-activated carbon will have a higher surface area compared to
that of KOH–activated carbon illo- denas et al. 2007a; Hoseinzadeh Hesas et al. 2013)
Several researchers have studied the activation of carbon using KOH and NaOH with
results summarized in Table 4.3. Mitani et al. (2004) produced activated carbon from coal by
KOH and NaOH with an activating agent ratio of 4:1 at 800˚C. The KOH-activated carbon
had the SSA of 2300 m2/g, while the NaOH activated carbon had the surface area of 730
m2/g. However, in this work, NaOH- activated carbon had a higher SSA value compared to
that of KOH-activated carbon. It shows that there is a relationship between the reactivity of
the raw material and activating agent.
The comparison of the summarized results in Table 4.3 confirms that the high
reactivity of the precursor is directly linked to the higher SSA of NaOH-activated carbon

92
versus KOH- activated carbon. The major weight loss of the pulp mill sludge, Mango seeds,
Eucaluptus wood and pitch based carbon fiber occurred in the temperature range of 250-
500˚C, which make them reactive precursors.
Table 4.3. NaOH and KOH conventional furnace activation comparison with
literature values
It can be concluded that the SSA values and activation yields for both microwave and
conventional activation are in the similar ranges. However, the microwave activation was
achieved in a very shorter time period. It can be explained by the higher reaction rate which is
a well-known benefit of using microwaves. Some researchers justify it with the "microwave
thermal effect". They suggest that the dielectric heating causes an increase in the temperature
of reaction and kinetic differences are not expected between reactions heated by microwaves
and classical heating. However others believe in “microwave non-thermal effects” originated
from many examples that cannot be explained by microwave thermal effects. They believe
This work (Moreno-
Piraján
&
Giraldo
2012)
(Lillo-
Ródenas
et al.
2001)
illo-
denas et
al. 2007b)
(Maciá-
Agulló et
al. 2007a)
(Mitani et
al. 2004)
Raw
material
Pulp mill
sludge
Seeds
Mango
Spanish
antheracite
Eucaluptus
wood
Pitch base
carbon fibre
coke
Activation
condition
Ratio 2,
800˚C
Ratio
3,850˚C
,8h
soaking
time
Ratio 2,
730˚C, 1h
,
Ratio 3
750°C
Ratio 2,
750˚C,1h
Ratio 4
SSA-
NaOH
(m2/g)
2300 1950 1594 3100 1130 730
Overall
Yield (%)
26 N/A 66 2 71 56
KOH-
SSA
(m2/g)
1960 1500 1938 2000 1090 2320
Overall
Yield (%)
21 N/A 79 4 78 61
93
that microwaves increase the molecular mobility and affect the reaction kinetics.
Consequently, the activation energy is reduced or the pre-exponential factor in the Arrhenius
equation is increased, which leads to a higher activation rate (De La Hoz et al. 2005, Gude et
al. 2012).
In this work, the microwave activation increased the reaction rate by 15 times when
compared to the furnace activation. Considering that the temperature of microwave activation
experiments was in the range of 600-1000°C, the observed results cannot be explained only
by thermal effects. Microwaves are expected to affect the kinetic parameters of activation
reactions by alkali hydroxides. This effect was more evident in the case of NaOH microwave
activation probably because it is a more reactive compound compared to KOH.
4.4 Conclusions
Microwave pyrolysis of pulp mill sludge is not possible without the addition of a
microwave absorber such as KOH. Using a well-dispersed alkali metal hydroxide in the
sludge improves the uniformity of pyrolysis and activation products, due to the improved
thermal diffusivity. Generally, the retained carbon of microwave pyrolysis was lower than
conventional pyrolysis which might be due to the faster release of volatiles.
The sludge PS50-50 with higher protein content had 10% higher retained carbon
from both microwave and conventional pyrolysis. Between the two tested wood polymers,
lignin had 20% higher retained carbon from both microwave and conventional pyrolysis.
A pellet form of the biomasses i.e. sludge, lignin, and cellulose did not improve
carbon retention in microwave and conventional pyrolysis which was not expected. The
pellet form of sludge-KOH mixture resulted in a drop in the product uniformity compared to
the powdered form even with KOH addition probably due to their higher density. The pellets
are not recommended for the microwave pyrolysis.
Given the dual roles of the alkali metal hydroxides as activating agent and microwave
absorber (heat source), the activating agent to carbon ratio can be adjusted according to the
94
desired product properties. Combining pyrolysis with activation is recommended considering
the need to add a microwave absorbing agent during pyrolysis.
Activated carbon was able to be produced from pulp mill sludge using microwaves.
The activation yields for NaOH or KOH activation were in the range of 40-70 wt% or 60-80
wt%, respectively. The lower yields of NaOH activation suggests that the reaction had a
higher rate compared to KOH activation. The highest SSA achieved was 2300 m2/g from
NaOH-microwave activation.
Activated carbon produced with microwave oven and conventional furnace had
similar properties in terms of SSA and yield. NaOH was found to be a more effective
activating agent than KOH for pore development in both microwave oven and conventional
furnace. For both NaOH and KOH activation, the conventional furnace activation yield was
in the range of 40-50 wt% except for the two cases of KOH-activation at 1000°C and
activating agent to carbon ratio of 1:1.
Both microwave pyrolysis and activation were performed in a shorter time with a
higher reaction rate compared to the conventional methods. For example, the NaOH-
activation takes 1.5 h in furnace to fabricate an activated carbon with the SSA of 2300 m2/g;
however in microwave activation 5 min activation under medium power results in activated
carbon with a similar SSA. Microwaves are expected to have "non-thermal effects" on the
kinetic parameters of activation reactions with alkali hydroxides.
95
5 Temperature Distribution in Microwave Heating of Biomass
Materials3
Abstract
This work analyzes the temperature distribution inside the microwave-heated
lignocellulosic samples through experiments and finite element modeling. Dielectric properties
of the samples were measured using a coaxial probe technique. The results showed that the
biomasses were weak absorbers of microwave radiation with a low loss tangent of less than
0.1, suggesting the need of adding strong microwave-absorbing agent. To measure temperature
during microwave heating, pressure-based temperature probes were designed, built, calibrated
and used. With added strong absorber of microwave (KOH), the temperature at the center of
the sample was found to reach a plateau between 600 to 800°C after about 4 minutes. Using
COMSOL multiphysics, a 3-D model was developed to simulate the temperature distribution
in microwave-heated samples and its change with time. The model yielded a time-dependence
of temperature that was similar to one measured with the probe. The model was used to
determine temperature distribution in the sample at a given time. Microwave pyrolysis was
resulted in a non-uniform temperature distribution even after reaching the plateau temperature,
which is different from heating in a conventional furnace. The degree of non-uniformity
changes with thermal properties of samples, such as heat conductivity and capacity, as well as
the sample location in the microwave oven.
5.1 Introduction
Microwave heating has been implemented in many industrial applications in recent
years because of its advantages of volumetric heating, selective heating and low processing
time compared to conventional methods of heating. Two major differences between
microwave and conventional heating are the inverse temperature profile inside microwave-
3 To be submitted to the journal of analytical and applied pyrolysis
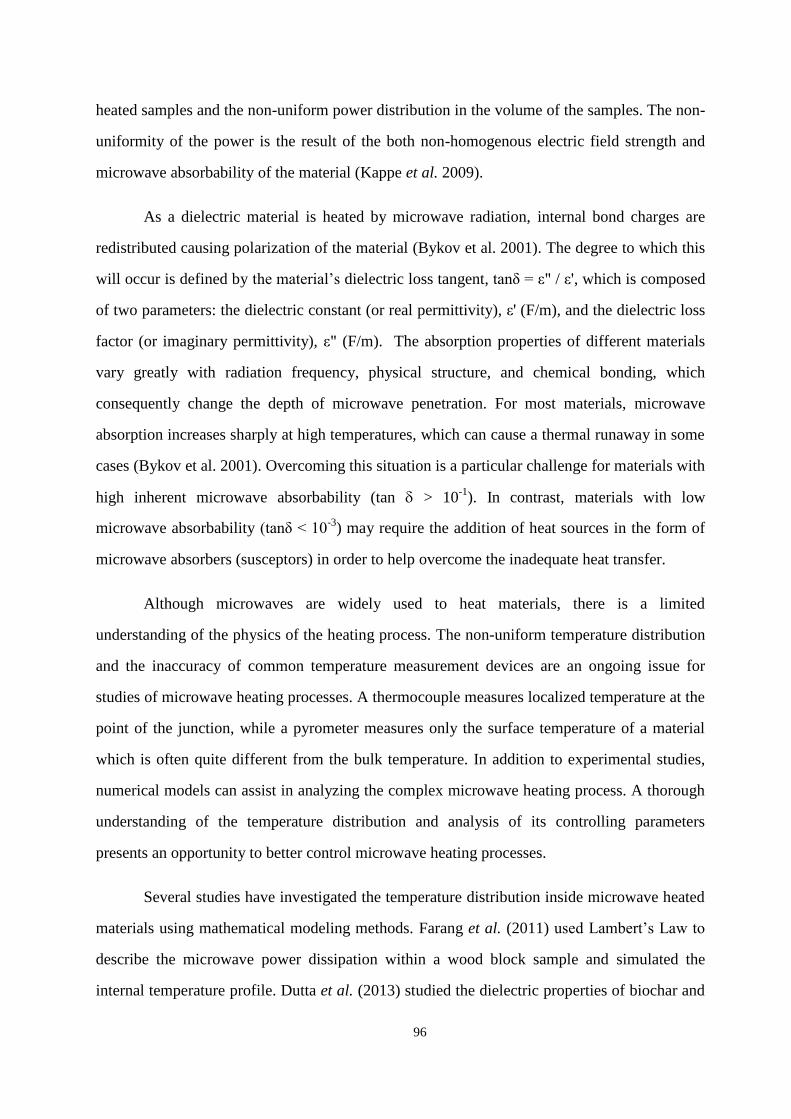
96
heated samples and the non-uniform power distribution in the volume of the samples. The non-
uniformity of the power is the result of the both non-homogenous electric field strength and
microwave absorbability of the material (Kappe et al. 2009).
As a dielectric material is heated by microwave radiation, internal bond charges are
redistributed causing polarization of the material (Bykov et al. 2001). The degree to which this
will occur is defined by the material’s dielectric loss tangent, tanδ = ε" / ε', which is composed
of two parameters: the dielectric constant (or real permittivity), ε' (F/m), and the dielectric loss
factor (or imaginary permittivity), ε" (F/m). The absorption properties of different materials
vary greatly with radiation frequency, physical structure, and chemical bonding, which
consequently change the depth of microwave penetration. For most materials, microwave
absorption increases sharply at high temperatures, which can cause a thermal runaway in some
cases (Bykov et al. 2001). Overcoming this situation is a particular challenge for materials with
high inherent microwave absorbability (tan > 10-1
). In contrast, materials with low
microwave absorbability tanδ < 10-3
) may require the addition of heat sources in the form of
microwave absorbers (susceptors) in order to help overcome the inadequate heat transfer.
Although microwaves are widely used to heat materials, there is a limited
understanding of the physics of the heating process. The non-uniform temperature distribution
and the inaccuracy of common temperature measurement devices are an ongoing issue for
studies of microwave heating processes. A thermocouple measures localized temperature at the
point of the junction, while a pyrometer measures only the surface temperature of a material
which is often quite different from the bulk temperature. In addition to experimental studies,
numerical models can assist in analyzing the complex microwave heating process. A thorough
understanding of the temperature distribution and analysis of its controlling parameters
presents an opportunity to better control microwave heating processes.
Several studies have investigated the temperature distribution inside microwave heated
materials using mathematical modeling methods. Farang et al. (2011) used ambert’s aw to
describe the microwave power dissipation within a wood block sample and simulated the
internal temperature profile. Dutta et al. (2013) studied the dielectric properties of biochar and
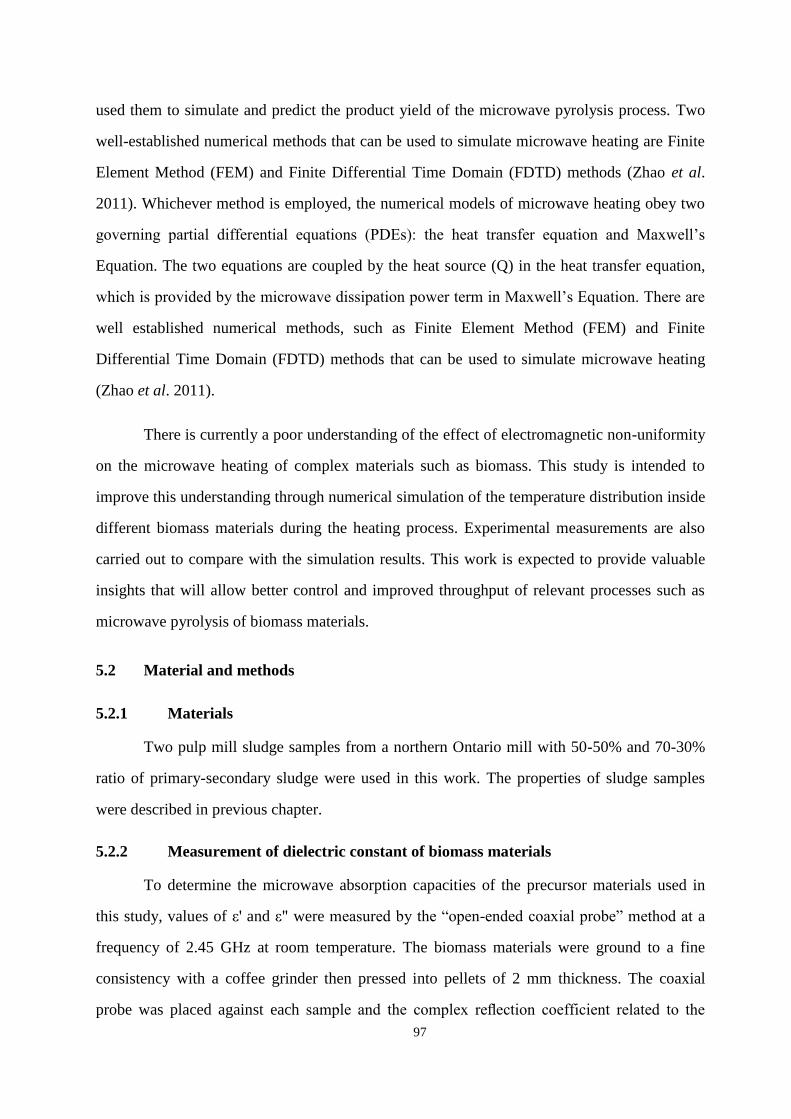
97
used them to simulate and predict the product yield of the microwave pyrolysis process. Two
well-established numerical methods that can be used to simulate microwave heating are Finite
Element Method (FEM) and Finite Differential Time Domain (FDTD) methods (Zhao et al.
2011). Whichever method is employed, the numerical models of microwave heating obey two
governing partial differential equations PDEs): the heat transfer equation and Maxwell’s
Equation. The two equations are coupled by the heat source (Q) in the heat transfer equation,
which is provided by the microwave dissipation power term in Maxwell’s Equation. There are
well established numerical methods, such as Finite Element Method (FEM) and Finite
Differential Time Domain (FDTD) methods that can be used to simulate microwave heating
(Zhao et al. 2011).
There is currently a poor understanding of the effect of electromagnetic non-uniformity
on the microwave heating of complex materials such as biomass. This study is intended to
improve this understanding through numerical simulation of the temperature distribution inside
different biomass materials during the heating process. Experimental measurements are also
carried out to compare with the simulation results. This work is expected to provide valuable
insights that will allow better control and improved throughput of relevant processes such as
microwave pyrolysis of biomass materials.
5.2 Material and methods
5.2.1 Materials
Two pulp mill sludge samples from a northern Ontario mill with 50-50% and 70-30%
ratio of primary-secondary sludge were used in this work. The properties of sludge samples
were described in previous chapter.
5.2.2 Measurement of dielectric constant of biomass materials
To determine the microwave absorption capacities of the precursor materials used in
this study, values of ε' and ε" were measured by the “open-ended coaxial probe” method at a
frequency of 2.45 GHz at room temperature. The biomass materials were ground to a fine
consistency with a coffee grinder then pressed into pellets of 2 mm thickness. The coaxial
probe was placed against each sample and the complex reflection coefficient related to the
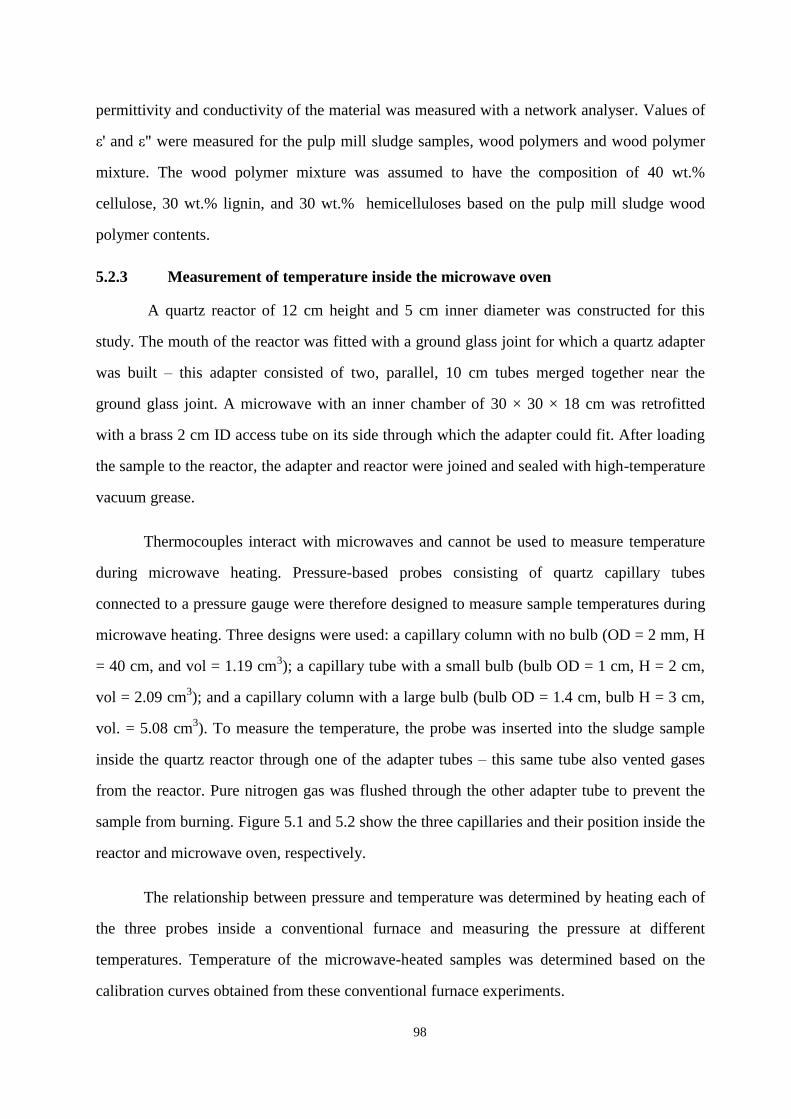
98
permittivity and conductivity of the material was measured with a network analyser. Values of
ε' and ε" were measured for the pulp mill sludge samples, wood polymers and wood polymer
mixture. The wood polymer mixture was assumed to have the composition of 40 wt.%
cellulose, 30 wt.% lignin, and 30 wt.% hemicelluloses based on the pulp mill sludge wood
polymer contents.
5.2.3 Measurement of temperature inside the microwave oven
A quartz reactor of 12 cm height and 5 cm inner diameter was constructed for this
study. The mouth of the reactor was fitted with a ground glass joint for which a quartz adapter
was built – this adapter consisted of two, parallel, 10 cm tubes merged together near the
ground glass joint. A microwave with an inner chamber of 30 × 30 × 18 cm was retrofitted
with a brass 2 cm ID access tube on its side through which the adapter could fit. After loading
the sample to the reactor, the adapter and reactor were joined and sealed with high-temperature
vacuum grease.
Thermocouples interact with microwaves and cannot be used to measure temperature
during microwave heating. Pressure-based probes consisting of quartz capillary tubes
connected to a pressure gauge were therefore designed to measure sample temperatures during
microwave heating. Three designs were used: a capillary column with no bulb (OD = 2 mm, H
= 40 cm, and vol = 1.19 cm3); a capillary tube with a small bulb (bulb OD = 1 cm, H = 2 cm,
vol = 2.09 cm3); and a capillary column with a large bulb (bulb OD = 1.4 cm, bulb H = 3 cm,
vol. = 5.08 cm3). To measure the temperature, the probe was inserted into the sludge sample
inside the quartz reactor through one of the adapter tubes – this same tube also vented gases
from the reactor. Pure nitrogen gas was flushed through the other adapter tube to prevent the
sample from burning. Figure 5.1 and 5.2 show the three capillaries and their position inside the
reactor and microwave oven, respectively.
The relationship between pressure and temperature was determined by heating each of
the three probes inside a conventional furnace and measuring the pressure at different
temperatures. Temperature of the microwave-heated samples was determined based on the
calibration curves obtained from these conventional furnace experiments.
99
Figure 5.1.Three capillaries filled with air and used for the temperature
measurement
Figure 5.2. The position of the capillaries inside the microwave oven and the
quartz reactor
5.2.4 Simulation of temperature profile with COMSOL 4.4
COMSOL multiphysics is a software that can be used to simulate any physic-based
system. In this work, it was used to analyze the temperature distribution in the biomass when
heating with microwaves. The electromagnetic waves and heat transfer equations were applied
for the microwave oven geometry dimensions of 30 × 30 × 18 cm and microwave power of
1200 W. Copper and quartz were selected as the construction materials for the microwave
cavity and reactor, respectively. The quartz reactor was assumed to have the height of 12 cm
and inner diameter of 5 cm and was filled with nitrogen gas. The thickness of the reactor walls
and bottom was assumed to be 2 mm. It was assumed that the microwave oven was filled with
air during heating.
40 cm
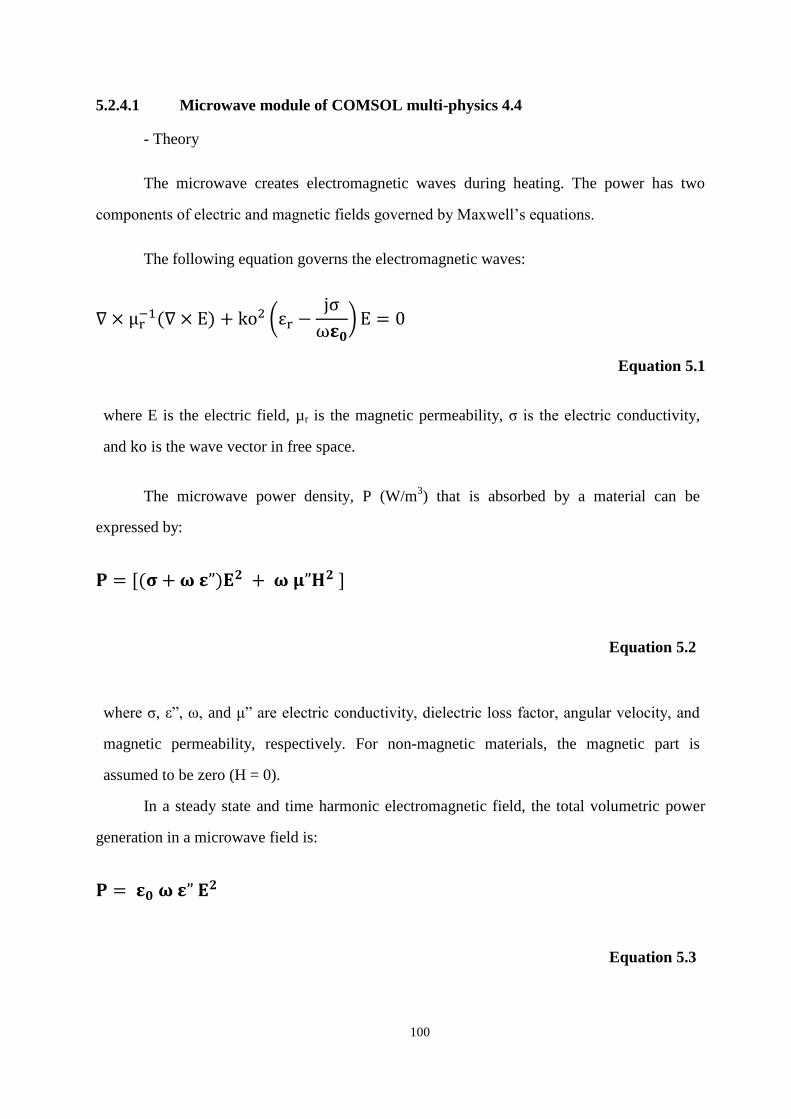
100
5.2.4.1 Microwave module of COMSOL multi-physics 4.4
- Theory
The microwave creates electromagnetic waves during heating. The power has two
components of electric and magnetic fields governed by Maxwell’s equations.
The following equation governs the electromagnetic waves:
μ (
ω )
Equation 5.1
where E is the electric field, µr is the magnetic permeability, σ is the electric conductivity,
and is the wave vector in free space.
The microwave power density, P (W/m3) that is absorbed by a material can be
expressed by:
Equation 5.2
where σ, ε”, ω, and μ” are electric conductivity, dielectric loss factor, angular velocity, and
magnetic permeability, respectively. For non-magnetic materials, the magnetic part is
assumed to be zero (H = 0).
In a steady state and time harmonic electromagnetic field, the total volumetric power
generation in a microwave field is:
Equation 5.3
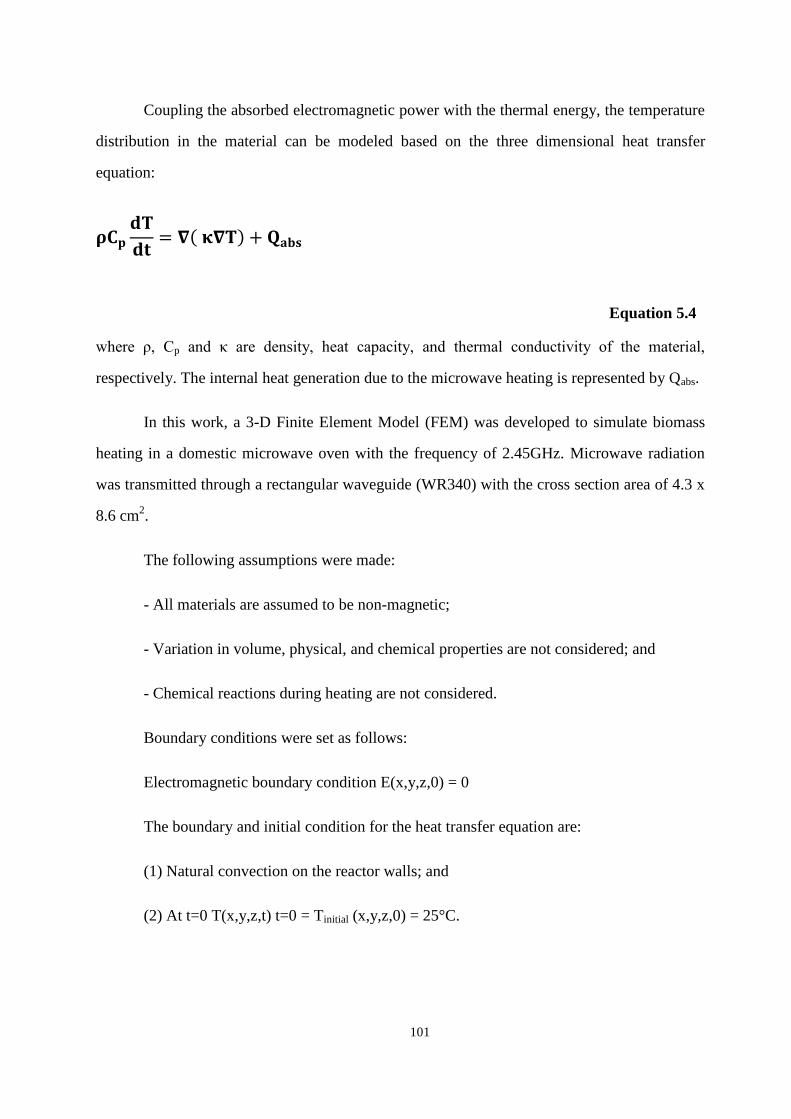
101
Coupling the absorbed electromagnetic power with the thermal energy, the temperature
distribution in the material can be modeled based on the three dimensional heat transfer
equation:
Equation 5.4
where ρ, Cp and are density, heat capacity, and thermal conductivity of the material,
respectively. The internal heat generation due to the microwave heating is represented by Qabs.
In this work, a 3-D Finite Element Model (FEM) was developed to simulate biomass
heating in a domestic microwave oven with the frequency of 2.45GHz. Microwave radiation
was transmitted through a rectangular waveguide (WR340) with the cross section area of 4.3 x
8.6 cm2.
The following assumptions were made:
- All materials are assumed to be non-magnetic;
- Variation in volume, physical, and chemical properties are not considered; and
- Chemical reactions during heating are not considered.
Boundary conditions were set as follows:
Electromagnetic boundary condition E(x,y,z,0) = 0
The boundary and initial condition for the heat transfer equation are:
(1) Natural convection on the reactor walls; and
(2) At t=0 T(x,y,z,t) t=0 = Tinitial (x,y,z,0) = 25°C.
102
5.3 Results and discussion
5.3.1 Characterization of the biomasses
The sludge samples from a pulp mill in Northern Ontario were investigated. They had a
50-50% and 70-30% ratio of primary-secondary sludge, respectively. The wood polymers
contents of the two sludge samples are shown in Table 5.1. They were named as sludge PS50-
50 and PS70-30.
Table 5.1. Wood polymers contents of the sludge samples
Properties Protein
(%)
Carbohydrates
(%)
Lignin
(%)
Extractives
(%)
Ash
PS50-50 50%Primary-
50%Secondary
20 45±5 15±4 16±5 4
PS70-30 70%Primary-
30%Secondary
8 48±3 23±2 18±4 4±1
Sludge PS70-30 contains less protein compared to PS 50-50 due to a lower secondary
sludge percentage. Primary sludge mainly contains wood fibers and fillers and secondary
sludge is composed of microbial cells, wood fiber, and ash.
Table 5.1 shows the proximate and ultimate analyses of the sludge samples. PS 50-50
has a higher elemental carbon content of 51%, a higher volatile matter content but a lower
fixed carbon content compared to that of PS 70-30. Both sludge samples have the low ash
contents of approximately 4% which is desirable for char production.
Table 5.2. Characteristics of pulp mill sludge samples
Raw materials Proximate analyses (%) Ultimate analyses (%)
Fixed
carbon
Volatile
matter
Ash C H N Others
PS 50-50 13±1 82±1 4 51±2 6±1 3 39
PS 70-30 18±1 77±2 4±1 46 6 8 40
Table 5.3 summarizes the dielectric properties, and penetration depth of the two sludge
samples, wood polymers, and a mixture of wood polymers. The wood polymer mixture was
assumed to have the composition of 40 wt.% cellulose, 30 wt.% lignin, and 30 wt.%
hemicelluloses, based on the sludge wood polymer content. Among all wood polymers,
103
hemicelluloses had the highest loss tangent, which is an indicator of high microwave
absorbability.
All of the waste biomasses were poor absorbers of microwave radiation and they had a
tan δ of lower than 0.1. Among all of the samples, PS 50-50 had the highest microwave
absorption capacity. The dielectric properties were related to the composition of the mixture.
PS 50-50 had higher loss tangent compared to that of PS 70-30, the former had 20% protein
while the latter had only 8%. It is likely that protein affected the adsorption of microwaves
radiation because it has the dielectric loss factor of 0.33. It is important to note that the
dielectric properties of the tested biomass materials were not temperature dependent in the
range of 25 to 250 °C.
Microwave penetration depth indicates the adsorbed electric field into the material and
depends on the loss tangent tan δ) and dielectric constant ε'). It is defined as the depth that the
microwave power reaches to the half of the surface dissipated power. The wood polymer
mixture had the highest penetration depth of 1.13 cm, while hemicellulose had the lowest
penetration depth of 0.58 cm (Table 5.3). The penetration depths for PS 70-30 and acid washed
PS 70-30 were the same, because of their similar components and texture. This result suggests
that the ash and minerals do not affect the penetration depth of microwave radiation into the
biomass sample. It was also found that after acid washing, the dielectric constant was not
affected. Therefore, the presence of inorganic compounds does not affect the polarization of
the polymers but it does assist in the dissipation of electric energy in the form of heat inside the
sample. The dielectric properties of mixed wood polymers were not expected, considering that
the sample was the mixture of lignin, cellulose and hemicelluloses.
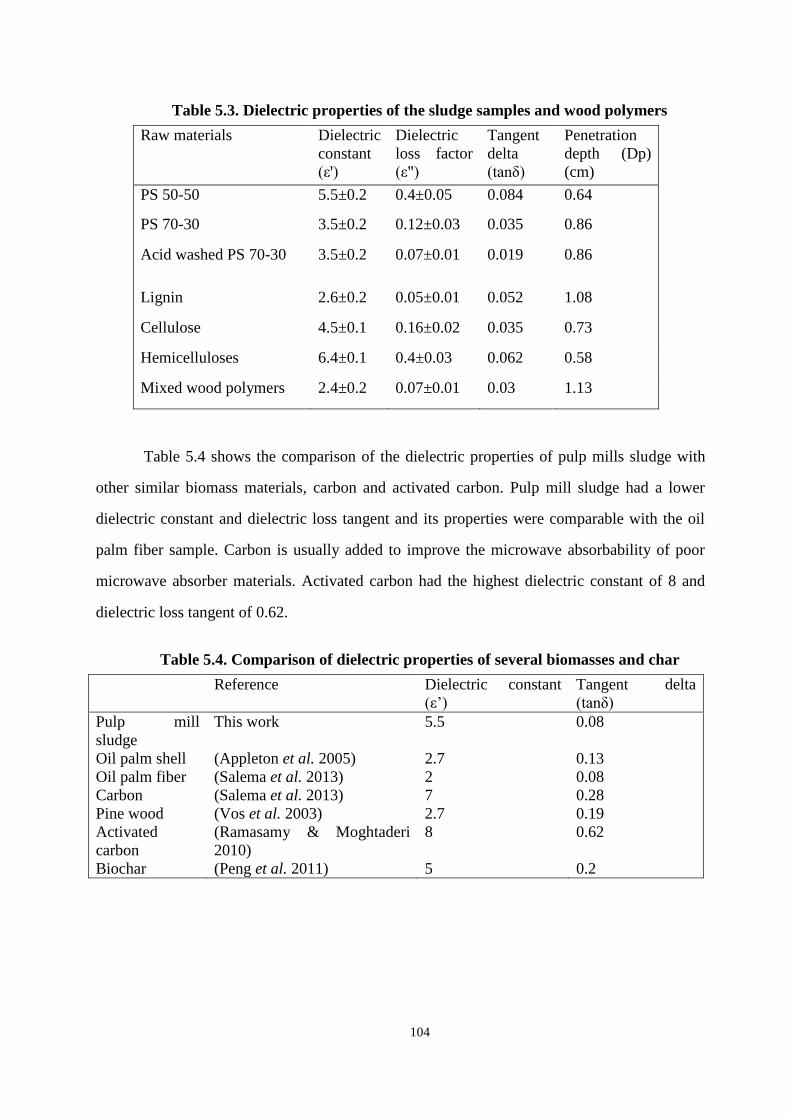
104
Table 5.3. Dielectric properties of the sludge samples and wood polymers
Raw materials Dielectric
constant
ε')
Dielectric
loss factor
ε")
Tangent
delta
tanδ)
Penetration
depth (Dp)
(cm)
PS 50-50 5.5±0.2 0.4±0.05 0.084 0.64
PS 70-30 3.5±0.2 0.12±0.03 0.035 0.86
Acid washed PS 70-30 3.5±0.2 0.07±0.01 0.019 0.86
Lignin 2.6±0.2 0.05±0.01 0.052 1.08
Cellulose 4.5±0.1 0.16±0.02 0.035 0.73
Hemicelluloses 6.4±0.1 0.4±0.03 0.062 0.58
Mixed wood polymers
2.4±0.2 0.07±0.01 0.03 1.13
Table 5.4 shows the comparison of the dielectric properties of pulp mills sludge with
other similar biomass materials, carbon and activated carbon. Pulp mill sludge had a lower
dielectric constant and dielectric loss tangent and its properties were comparable with the oil
palm fiber sample. Carbon is usually added to improve the microwave absorbability of poor
microwave absorber materials. Activated carbon had the highest dielectric constant of 8 and
dielectric loss tangent of 0.62.
Table 5.4. Comparison of dielectric properties of several biomasses and char
Reference Dielectric constant
ε’)
Tangent delta
tanδ)
Pulp mill
sludge
This work 5.5 0.08
Oil palm shell (Appleton et al. 2005) 2.7 0.13
Oil palm fiber (Salema et al. 2013) 2 0.08
Carbon (Salema et al. 2013) 7 0.28
Pine wood (Vos et al. 2003) 2.7 0.19
Activated
carbon
(Ramasamy & Moghtaderi
2010)
8 0.62
Biochar (Peng et al. 2011) 5 0.2
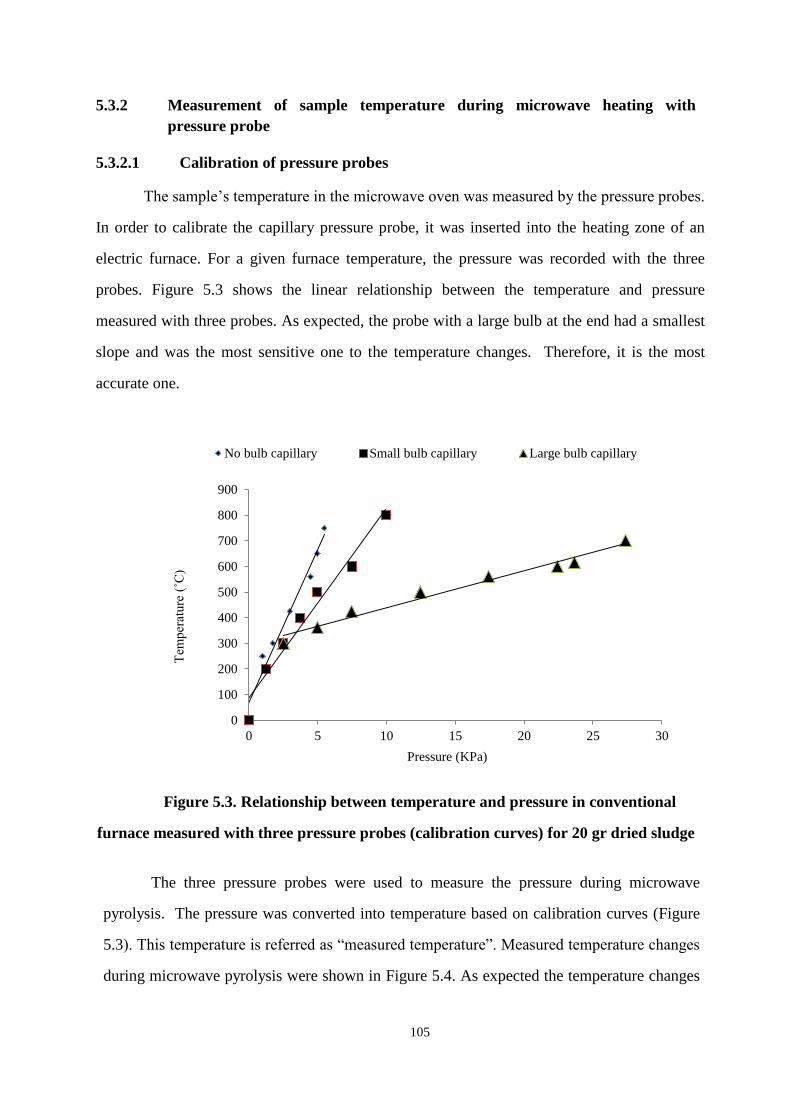
105
5.3.2 Measurement of sample temperature during microwave heating with
pressure probe
5.3.2.1 Calibration of pressure probes
The sample’s temperature in the microwave oven was measured by the pressure probes.
In order to calibrate the capillary pressure probe, it was inserted into the heating zone of an
electric furnace. For a given furnace temperature, the pressure was recorded with the three
probes. Figure 5.3 shows the linear relationship between the temperature and pressure
measured with three probes. As expected, the probe with a large bulb at the end had a smallest
slope and was the most sensitive one to the temperature changes. Therefore, it is the most
accurate one.
Figure 5.3. Relationship between temperature and pressure in conventional
furnace measured with three pressure probes (calibration curves) for 20 gr dried sludge
The three pressure probes were used to measure the pressure during microwave
pyrolysis. The pressure was converted into temperature based on calibration curves (Figure
5.3). This temperature is referred as “measured temperature”. Measured temperature changes
during microwave pyrolysis were shown in Figure 5.4. As expected the temperature changes
0
100
200
300
400
500
600
700
800
900
0 5 10 15 20 25 30
Tem
perature ˚C)
Pressure (KPa)
No bulb capillary Small bulb capillary Large bulb capillary
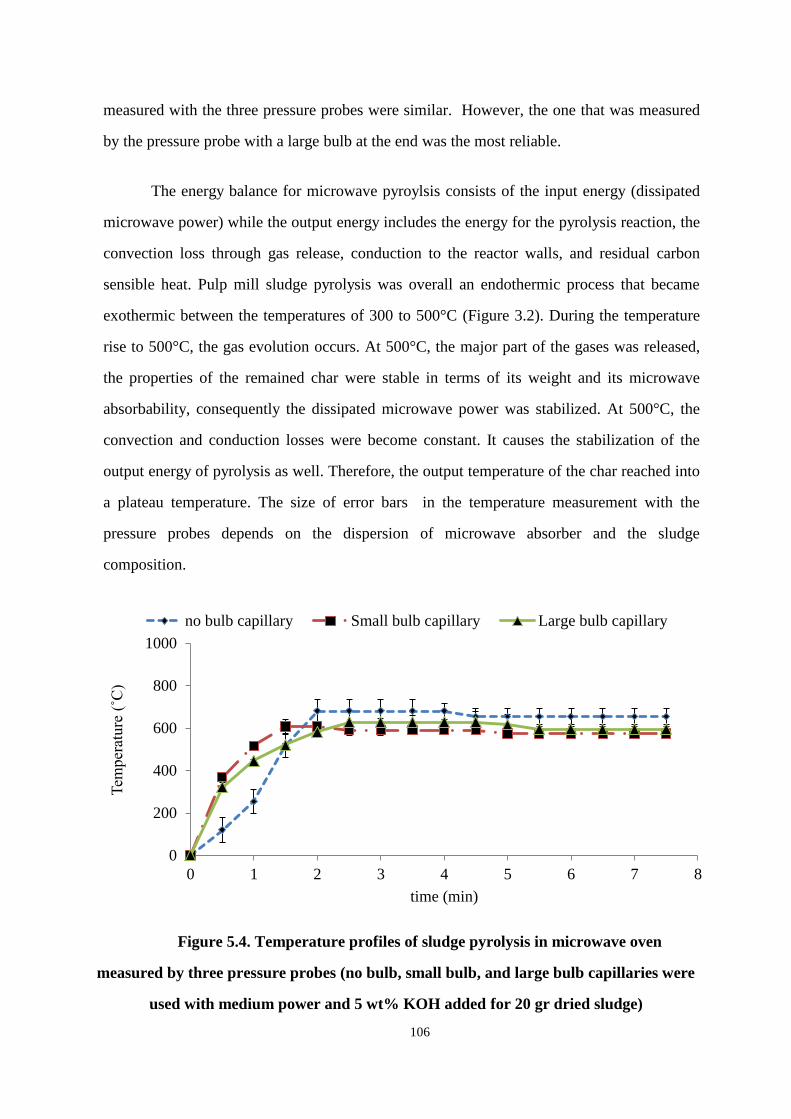
106
measured with the three pressure probes were similar. However, the one that was measured
by the pressure probe with a large bulb at the end was the most reliable.
The energy balance for microwave pyroylsis consists of the input energy (dissipated
microwave power) while the output energy includes the energy for the pyrolysis reaction, the
convection loss through gas release, conduction to the reactor walls, and residual carbon
sensible heat. Pulp mill sludge pyrolysis was overall an endothermic process that became
exothermic between the temperatures of 300 to 500°C (Figure 3.2). During the temperature
rise to 500°C, the gas evolution occurs. At 500°C, the major part of the gases was released,
the properties of the remained char were stable in terms of its weight and its microwave
absorbability, consequently the dissipated microwave power was stabilized. At 500°C, the
convection and conduction losses were become constant. It causes the stabilization of the
output energy of pyrolysis as well. Therefore, the output temperature of the char reached into
a plateau temperature. The size of error bars in the temperature measurement with the
pressure probes depends on the dispersion of microwave absorber and the sludge
composition.
Figure 5.4. Temperature profiles of sludge pyrolysis in microwave oven
measured by three pressure probes (no bulb, small bulb, and large bulb capillaries were
used with medium power and 5 wt% KOH added for 20 gr dried sludge)
0
200
400
600
800
1000
0 1 2 3 4 5 6 7 8
Tem
perature ˚C)
time (min)
no bulb capillary Small bulb capillary Large bulb capillary
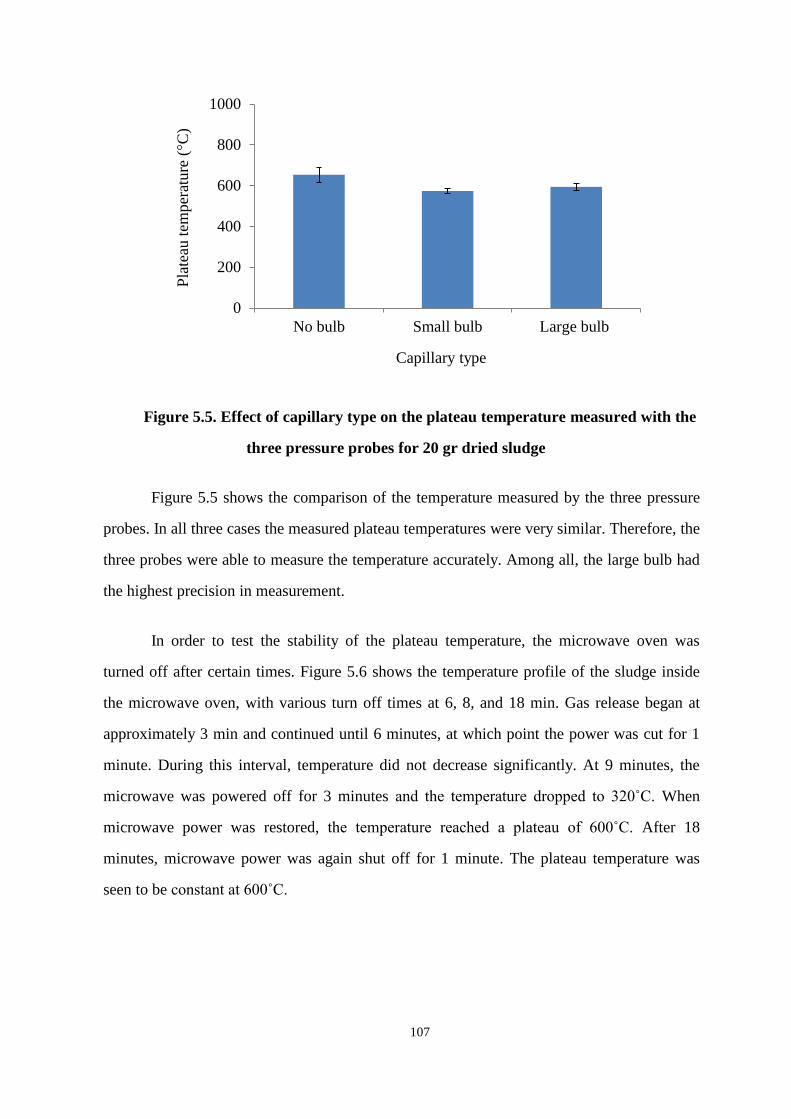
107
Figure 5.5. Effect of capillary type on the plateau temperature measured with the
three pressure probes for 20 gr dried sludge
Figure 5.5 shows the comparison of the temperature measured by the three pressure
probes. In all three cases the measured plateau temperatures were very similar. Therefore, the
three probes were able to measure the temperature accurately. Among all, the large bulb had
the highest precision in measurement.
In order to test the stability of the plateau temperature, the microwave oven was
turned off after certain times. Figure 5.6 shows the temperature profile of the sludge inside
the microwave oven, with various turn off times at 6, 8, and 18 min. Gas release began at
approximately 3 min and continued until 6 minutes, at which point the power was cut for 1
minute. During this interval, temperature did not decrease significantly. At 9 minutes, the
microwave was powered off for 3 minutes and the temperature dropped to 320˚C. When
microwave power was restored, the temperature reached a plateau of 600˚C. After 18
minutes, microwave power was again shut off for 1 minute. The plateau temperature was
seen to be constant at 600˚C.
0
200
400
600
800
1000
No bulb Small bulb Large bulb
Pla
teau
tem
per
ature
(°C
)
Capillary type
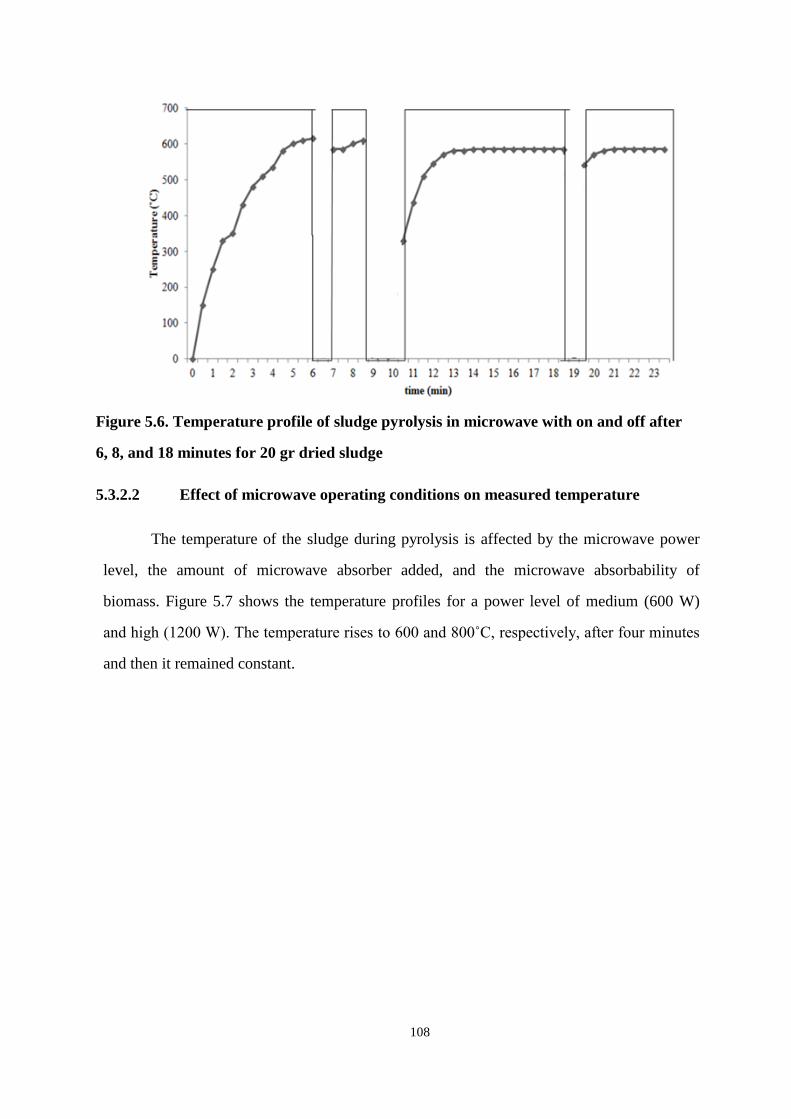
108
Figure 5.6. Temperature profile of sludge pyrolysis in microwave with on and off after
6, 8, and 18 minutes for 20 gr dried sludge
5.3.2.2 Effect of microwave operating conditions on measured temperature
The temperature of the sludge during pyrolysis is affected by the microwave power
level, the amount of microwave absorber added, and the microwave absorbability of
biomass. Figure 5.7 shows the temperature profiles for a power level of medium (600 W)
and high 1200 W). The temperature rises to 600 and 800˚C, respectively, after four minutes
and then it remained constant.
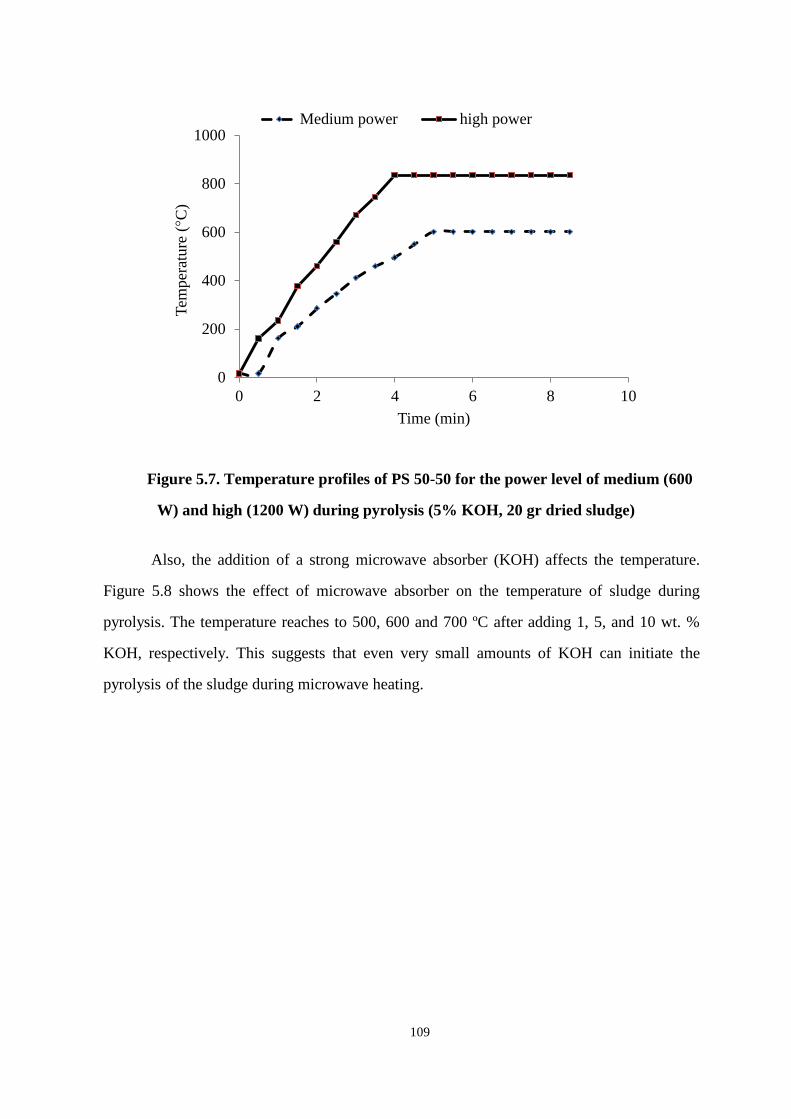
109
Figure 5.7. Temperature profiles of PS 50-50 for the power level of medium (600
W) and high (1200 W) during pyrolysis (5% KOH, 20 gr dried sludge)
Also, the addition of a strong microwave absorber (KOH) affects the temperature.
Figure 5.8 shows the effect of microwave absorber on the temperature of sludge during
pyrolysis. The temperature reaches to 500, 600 and 700 ºC after adding 1, 5, and 10 wt. %
KOH, respectively. This suggests that even very small amounts of KOH can initiate the
pyrolysis of the sludge during microwave heating.
0
200
400
600
800
1000
0 2 4 6 8 10
Tem
per
ature
(°C
)
Time (min)
Medium power high power

110
Figure 5.8. Temperature profiles of PS 50-50 by adding 1 wt.%, 5 wt.% and 10
wt.% KOH during pyrolysis (medium power,20 gr dried sludge)
Figure 5.9. Temperature profiles of the PS 50-50 (solid line) and PS 70-30 (dash
line) during heating with a microwave for 8 min (5% KOH, 20 gr dried sludge)
0
200
400
600
800
1000
0 2 4 6 8 10
Tem
perature ˚C)
Time (min)
10% KOH 5% KOH 1% KOH
0
200
400
600
800
1000
0 2 4 6 8 10
Tem
perature ˚C)
Time (min)
PS50-50 PS 70-30
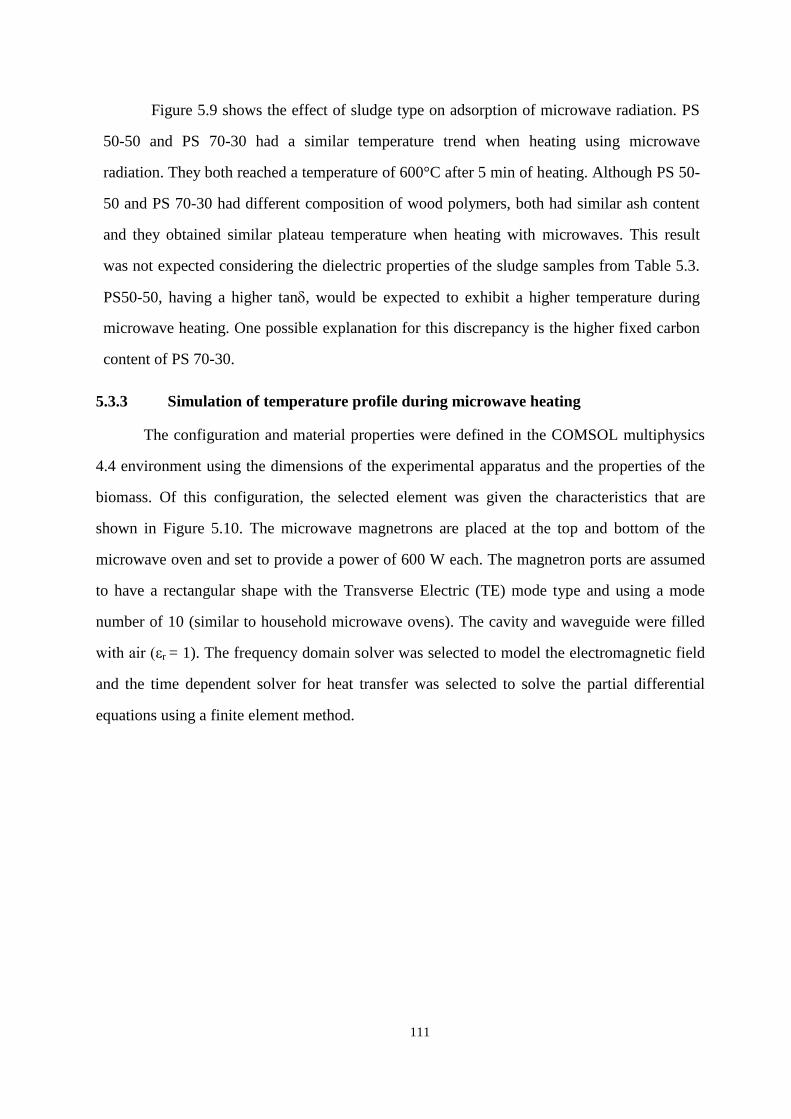
111
Figure 5.9 shows the effect of sludge type on adsorption of microwave radiation. PS
50-50 and PS 70-30 had a similar temperature trend when heating using microwave
radiation. They both reached a temperature of 600°C after 5 min of heating. Although PS 50-
50 and PS 70-30 had different composition of wood polymers, both had similar ash content
and they obtained similar plateau temperature when heating with microwaves. This result
was not expected considering the dielectric properties of the sludge samples from Table 5.3.
PS50-50, having a higher tan, would be expected to exhibit a higher temperature during
microwave heating. One possible explanation for this discrepancy is the higher fixed carbon
content of PS 70-30.
5.3.3 Simulation of temperature profile during microwave heating
The configuration and material properties were defined in the COMSOL multiphysics
4.4 environment using the dimensions of the experimental apparatus and the properties of the
biomass. Of this configuration, the selected element was given the characteristics that are
shown in Figure 5.10. The microwave magnetrons are placed at the top and bottom of the
microwave oven and set to provide a power of 600 W each. The magnetron ports are assumed
to have a rectangular shape with the Transverse Electric (TE) mode type and using a mode
number of 10 (similar to household microwave ovens). The cavity and waveguide were filled
with air εr = 1). The frequency domain solver was selected to model the electromagnetic field
and the time dependent solver for heat transfer was selected to solve the partial differential
equations using a finite element method.
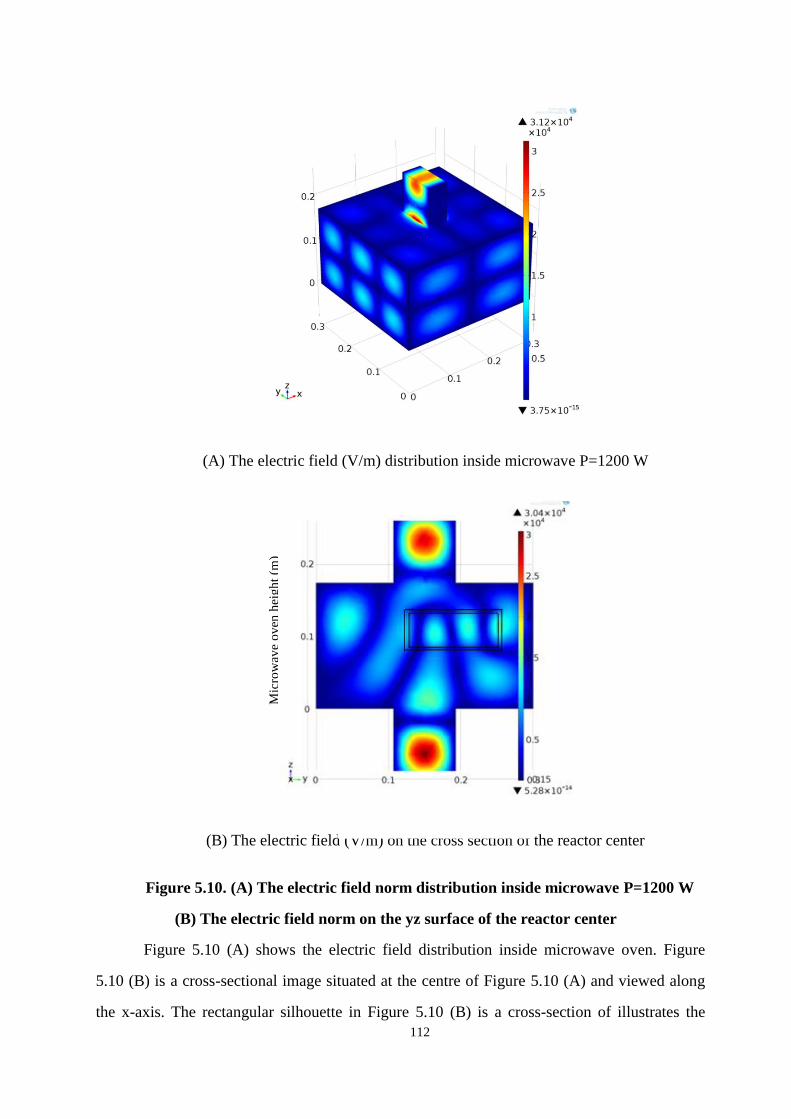
112
(A) The electric field (V/m) distribution inside microwave P=1200 W
(B) The electric field (V/m) on the cross section of the reactor center
Figure 5.10. (A) The electric field norm distribution inside microwave P=1200 W
(B) The electric field norm on the yz surface of the reactor center
Figure 5.10 (A) shows the electric field distribution inside microwave oven. Figure
5.10 (B) is a cross-sectional image situated at the centre of Figure 5.10 (A) and viewed along
the x-axis. The rectangular silhouette in Figure 5.10 (B) is a cross-section of illustrates the
Microwave oven length
(m)
Mic
row
ave
ov
en h
eigh
t (m
)
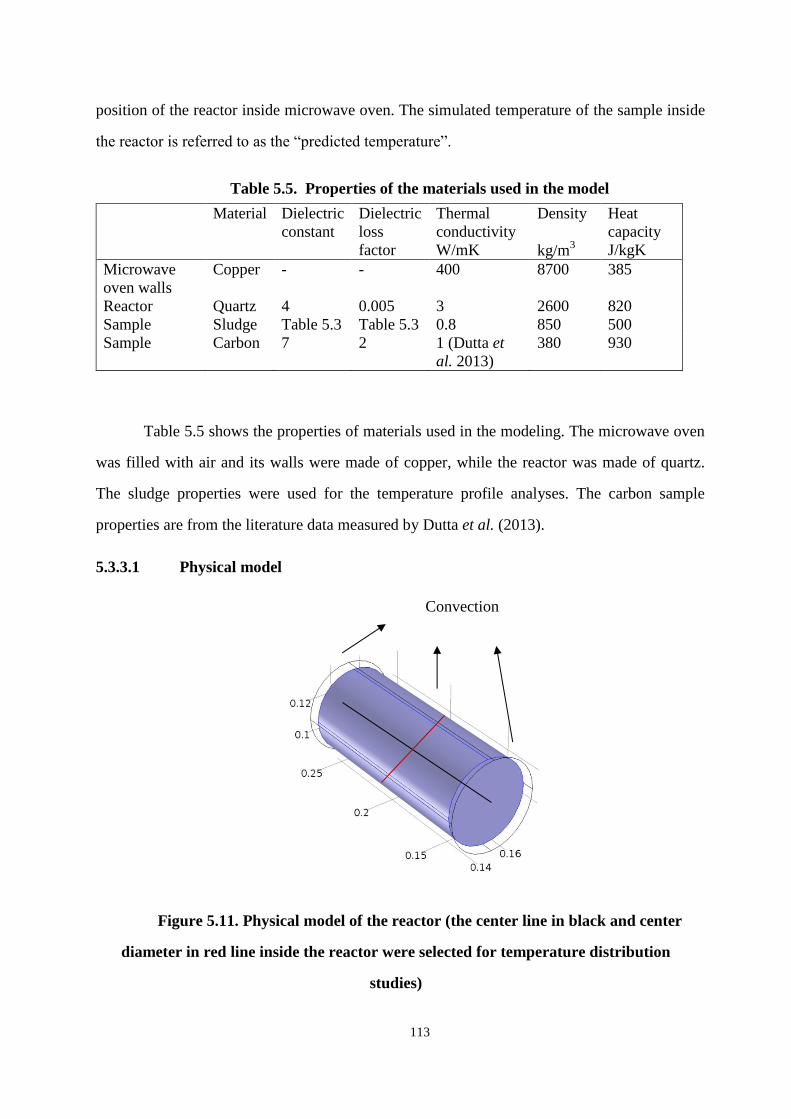
113
position of the reactor inside microwave oven. The simulated temperature of the sample inside
the reactor is referred to as the “predicted temperature”.
Table 5.5. Properties of the materials used in the model
Material Dielectric
constant
Dielectric
loss
factor
Thermal
conductivity
W/mK
Density
kg/m3
Heat
capacity
J/kgK
Microwave
oven walls
Copper - - 400 8700 385
Reactor Quartz 4 0.005 3 2600 820
Sample Sludge Table 5.3 Table 5.3 0.8 850 500
Sample Carbon 7 2 1 (Dutta et
al. 2013)
380 930
Table 5.5 shows the properties of materials used in the modeling. The microwave oven
was filled with air and its walls were made of copper, while the reactor was made of quartz.
The sludge properties were used for the temperature profile analyses. The carbon sample
properties are from the literature data measured by Dutta et al. (2013).
5.3.3.1 Physical model
Figure 5.11. Physical model of the reactor (the center line in black and center
diameter in red line inside the reactor were selected for temperature distribution
studies)
Convection
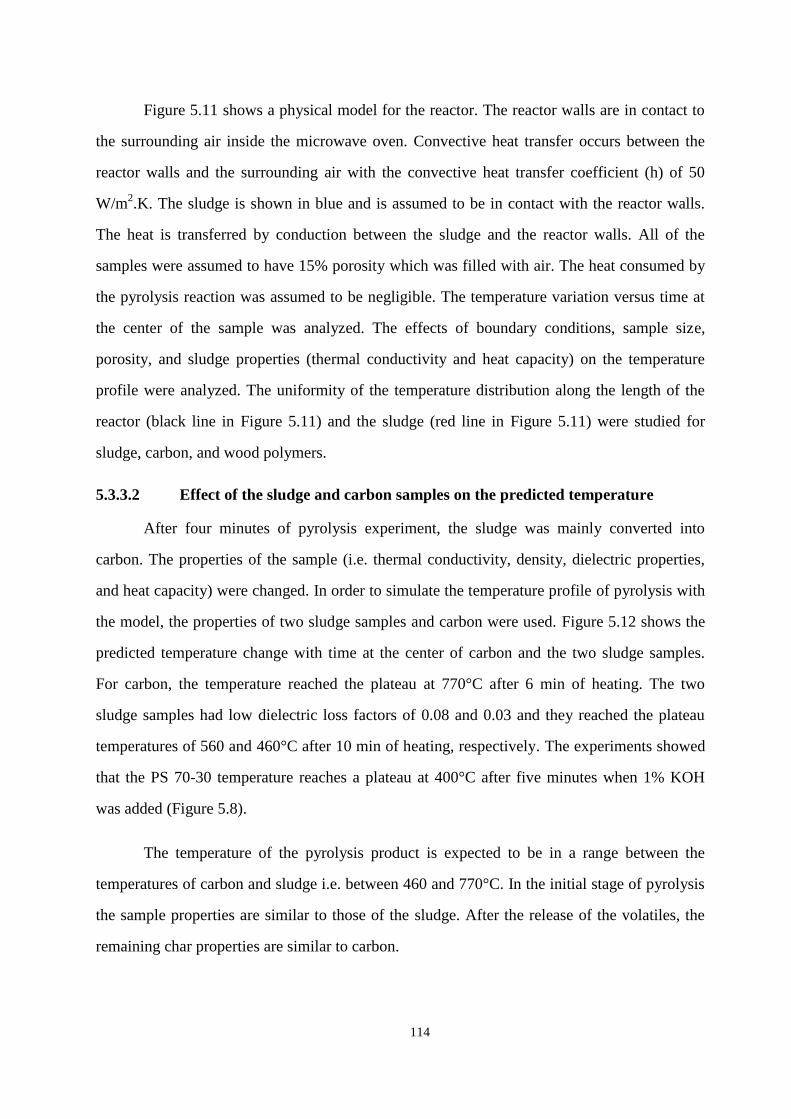
114
Figure 5.11 shows a physical model for the reactor. The reactor walls are in contact to
the surrounding air inside the microwave oven. Convective heat transfer occurs between the
reactor walls and the surrounding air with the convective heat transfer coefficient (h) of 50
W/m2.K. The sludge is shown in blue and is assumed to be in contact with the reactor walls.
The heat is transferred by conduction between the sludge and the reactor walls. All of the
samples were assumed to have 15% porosity which was filled with air. The heat consumed by
the pyrolysis reaction was assumed to be negligible. The temperature variation versus time at
the center of the sample was analyzed. The effects of boundary conditions, sample size,
porosity, and sludge properties (thermal conductivity and heat capacity) on the temperature
profile were analyzed. The uniformity of the temperature distribution along the length of the
reactor (black line in Figure 5.11) and the sludge (red line in Figure 5.11) were studied for
sludge, carbon, and wood polymers.
5.3.3.2 Effect of the sludge and carbon samples on the predicted temperature
After four minutes of pyrolysis experiment, the sludge was mainly converted into
carbon. The properties of the sample (i.e. thermal conductivity, density, dielectric properties,
and heat capacity) were changed. In order to simulate the temperature profile of pyrolysis with
the model, the properties of two sludge samples and carbon were used. Figure 5.12 shows the
predicted temperature change with time at the center of carbon and the two sludge samples.
For carbon, the temperature reached the plateau at 770°C after 6 min of heating. The two
sludge samples had low dielectric loss factors of 0.08 and 0.03 and they reached the plateau
temperatures of 560 and 460°C after 10 min of heating, respectively. The experiments showed
that the PS 70-30 temperature reaches a plateau at 400°C after five minutes when 1% KOH
was added (Figure 5.8).
The temperature of the pyrolysis product is expected to be in a range between the
temperatures of carbon and sludge i.e. between 460 and 770°C. In the initial stage of pyrolysis
the sample properties are similar to those of the sludge. After the release of the volatiles, the
remaining char properties are similar to carbon.
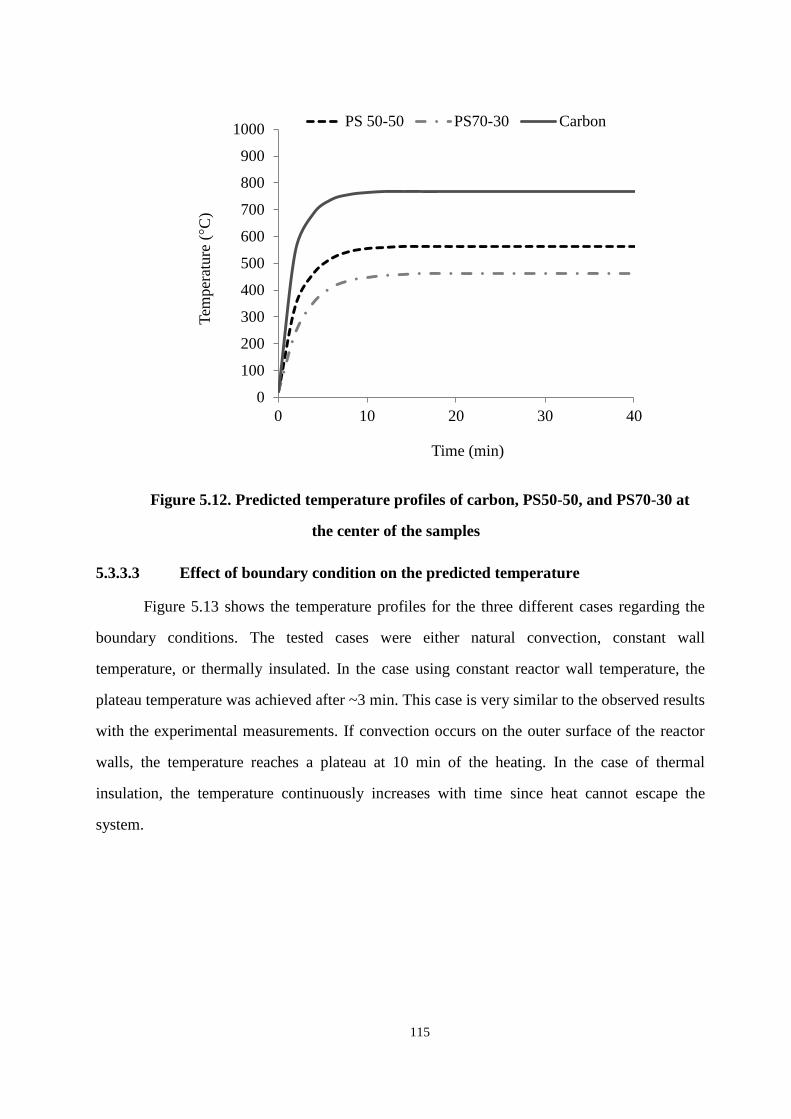
115
Figure 5.12. Predicted temperature profiles of carbon, PS50-50, and PS70-30 at
the center of the samples
5.3.3.3 Effect of boundary condition on the predicted temperature
Figure 5.13 shows the temperature profiles for the three different cases regarding the
boundary conditions. The tested cases were either natural convection, constant wall
temperature, or thermally insulated. In the case using constant reactor wall temperature, the
plateau temperature was achieved after ~3 min. This case is very similar to the observed results
with the experimental measurements. If convection occurs on the outer surface of the reactor
walls, the temperature reaches a plateau at 10 min of the heating. In the case of thermal
insulation, the temperature continuously increases with time since heat cannot escape the
system.
0
100
200
300
400
500
600
700
800
900
1000
0 10 20 30 40
Tem
per
ature
(°C
)
Time (min)
PS 50-50 PS70-30 Carbon
116
Figure 5.13. Effect of the three boundary conditions on the predicted
temperature profiles at the center of the sludge
5.3.3.4 Effect of material properties on the predicted temperature
5.3.3.4.1 Sample size
During the pyrolysis experiment, the height of the sludge sample inside the reactor was
reduced from 0.12 to 0.06 m in y direction due to the release of the volatiles. As a result of this
process, the sludge is converted into carbon. The carbon sample’s surface was mainly in
contact with nitrogen gas. In the simulation, the gas was assumed to be nitrogen. Figure 5.14
shows the predicted temperature profile when the volume of the carbon sample is reduced to
half. The smaller volume of carbon (117.5 cm3) attained a plateau temperature of
approximately 1800°C after about 7 minutes. This temperature was not observe during the
experiment due to the excess heat loss from the volatile matters.
0
200
400
600
800
1000
0 5 10 15 20
Tem
per
atu
re (°C
)
Time (min)
Thermal insulation on the walls
Constant temperture on the walls
Natural convection
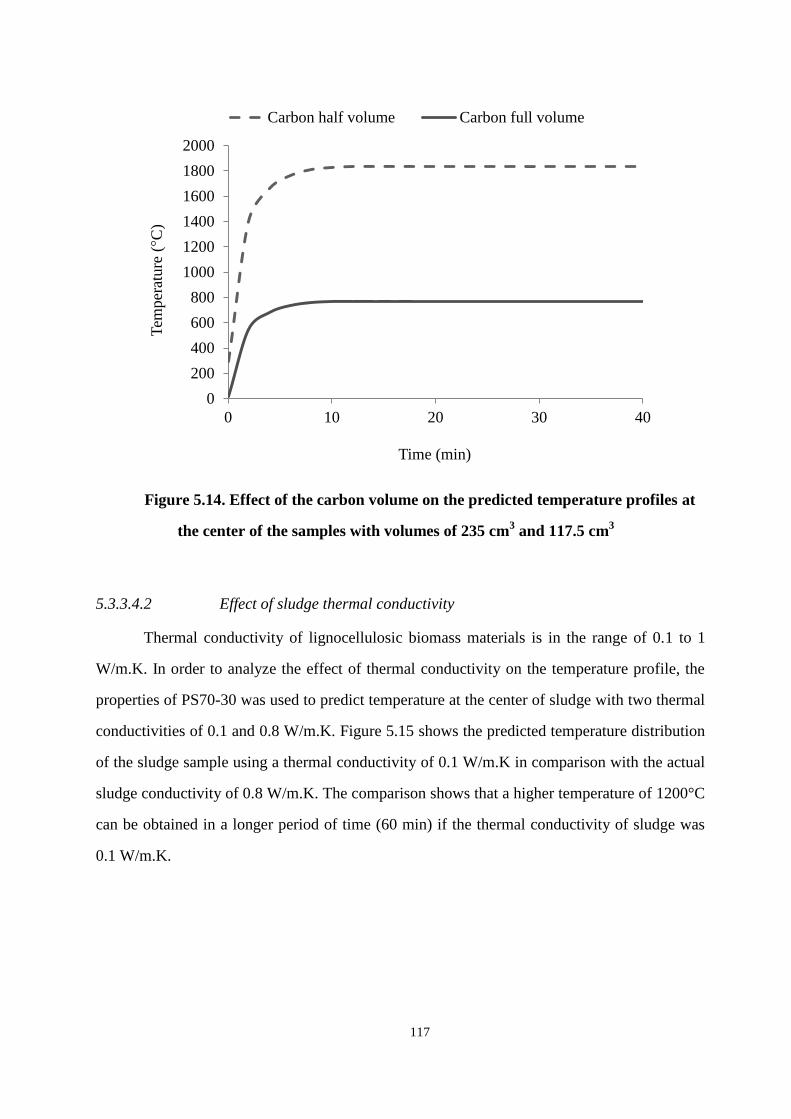
117
Figure 5.14. Effect of the carbon volume on the predicted temperature profiles at
the center of the samples with volumes of 235 cm3 and 117.5 cm
3
5.3.3.4.2 Effect of sludge thermal conductivity
Thermal conductivity of lignocellulosic biomass materials is in the range of 0.1 to 1
W/m.K. In order to analyze the effect of thermal conductivity on the temperature profile, the
properties of PS70-30 was used to predict temperature at the center of sludge with two thermal
conductivities of 0.1 and 0.8 W/m.K. Figure 5.15 shows the predicted temperature distribution
of the sludge sample using a thermal conductivity of 0.1 W/m.K in comparison with the actual
sludge conductivity of 0.8 W/m.K. The comparison shows that a higher temperature of 1200°C
can be obtained in a longer period of time (60 min) if the thermal conductivity of sludge was
0.1 W/m.K.
0
200
400
600
800
1000
1200
1400
1600
1800
2000
0 10 20 30 40
Tem
per
ature
(°C
)
Time (min)
Carbon half volume Carbon full volume
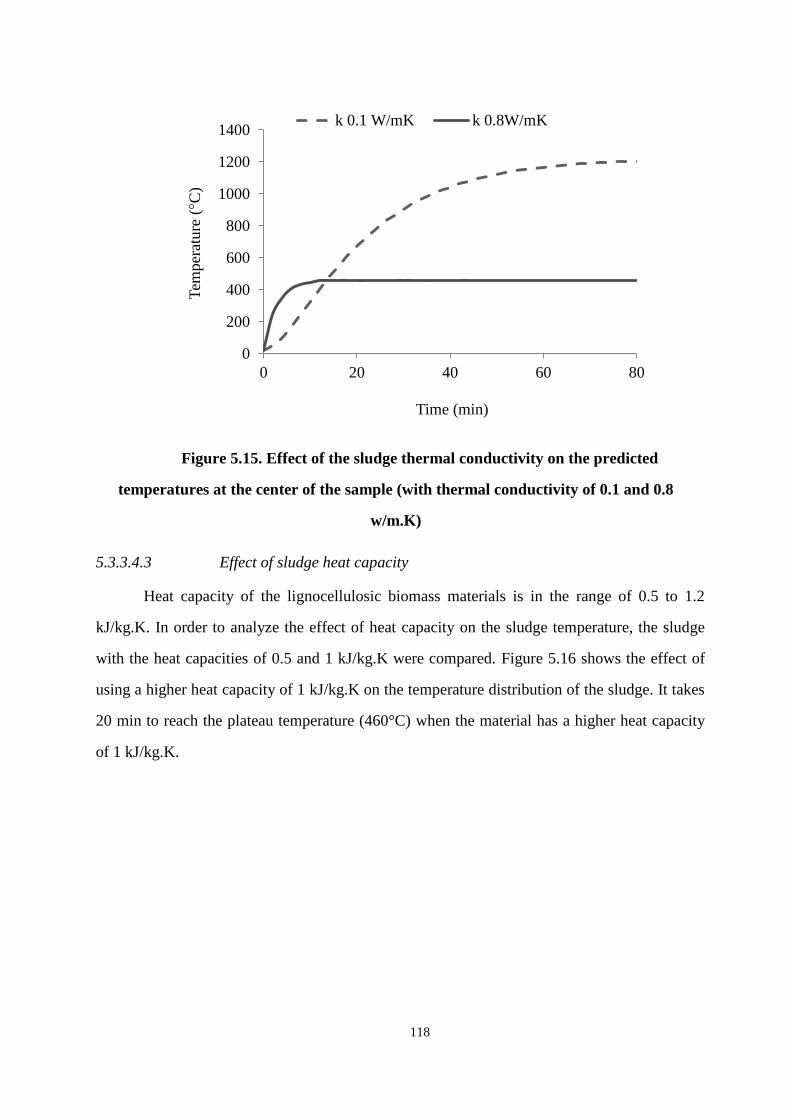
118
Figure 5.15. Effect of the sludge thermal conductivity on the predicted
temperatures at the center of the sample (with thermal conductivity of 0.1 and 0.8
w/m.K)
5.3.3.4.3 Effect of sludge heat capacity
Heat capacity of the lignocellulosic biomass materials is in the range of 0.5 to 1.2
kJ/kg.K. In order to analyze the effect of heat capacity on the sludge temperature, the sludge
with the heat capacities of 0.5 and 1 kJ/kg.K were compared. Figure 5.16 shows the effect of
using a higher heat capacity of 1 kJ/kg.K on the temperature distribution of the sludge. It takes
20 min to reach the plateau temperature (460°C) when the material has a higher heat capacity
of 1 kJ/kg.K.
0
200
400
600
800
1000
1200
1400
0 20 40 60 80
Tem
per
ature
(°C
)
Time (min)
k 0.1 W/mK k 0.8W/mK
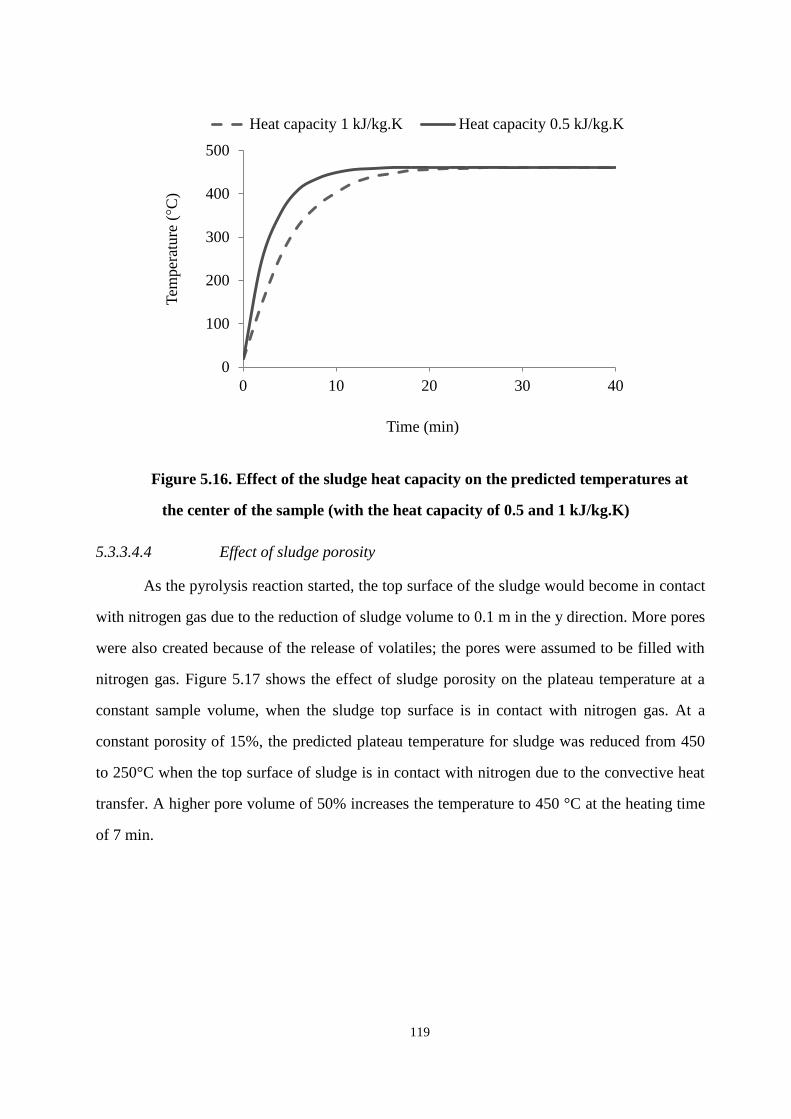
119
Figure 5.16. Effect of the sludge heat capacity on the predicted temperatures at
the center of the sample (with the heat capacity of 0.5 and 1 kJ/kg.K)
5.3.3.4.4 Effect of sludge porosity
As the pyrolysis reaction started, the top surface of the sludge would become in contact
with nitrogen gas due to the reduction of sludge volume to 0.1 m in the y direction. More pores
were also created because of the release of volatiles; the pores were assumed to be filled with
nitrogen gas. Figure 5.17 shows the effect of sludge porosity on the plateau temperature at a
constant sample volume, when the sludge top surface is in contact with nitrogen gas. At a
constant porosity of 15%, the predicted plateau temperature for sludge was reduced from 450
to 250°C when the top surface of sludge is in contact with nitrogen due to the convective heat
transfer. A higher pore volume of 50% increases the temperature to 450 °C at the heating time
of 7 min.
0
100
200
300
400
500
0 10 20 30 40
Tem
per
ature
(°C
)
Time (min)
Heat capacity 1 kJ/kg.K Heat capacity 0.5 kJ/kg.K
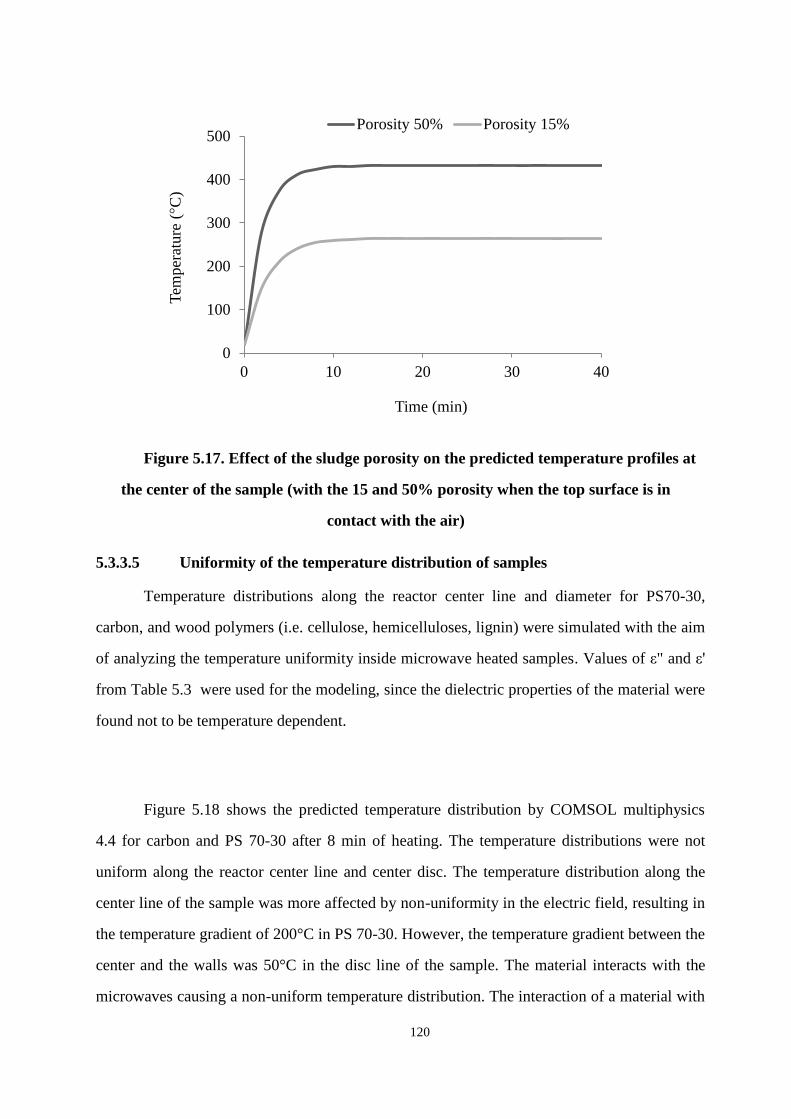
120
Figure 5.17. Effect of the sludge porosity on the predicted temperature profiles at
the center of the sample (with the 15 and 50% porosity when the top surface is in
contact with the air)
5.3.3.5 Uniformity of the temperature distribution of samples
Temperature distributions along the reactor center line and diameter for PS70-30,
carbon, and wood polymers (i.e. cellulose, hemicelluloses, lignin) were simulated with the aim
of analyzing the temperature uniformity inside microwave heated samples. Values of ε" and ε'
from Table 5.3 were used for the modeling, since the dielectric properties of the material were
found not to be temperature dependent.
Figure 5.18 shows the predicted temperature distribution by COMSOL multiphysics
4.4 for carbon and PS 70-30 after 8 min of heating. The temperature distributions were not
uniform along the reactor center line and center disc. The temperature distribution along the
center line of the sample was more affected by non-uniformity in the electric field, resulting in
the temperature gradient of 200°C in PS 70-30. However, the temperature gradient between the
center and the walls was 50°C in the disc line of the sample. The material interacts with the
microwaves causing a non-uniform temperature distribution. The interaction of a material with
0
100
200
300
400
500
0 10 20 30 40
Tem
per
ature
(°C
)
Time (min)
Porosity 50% Porosity 15%
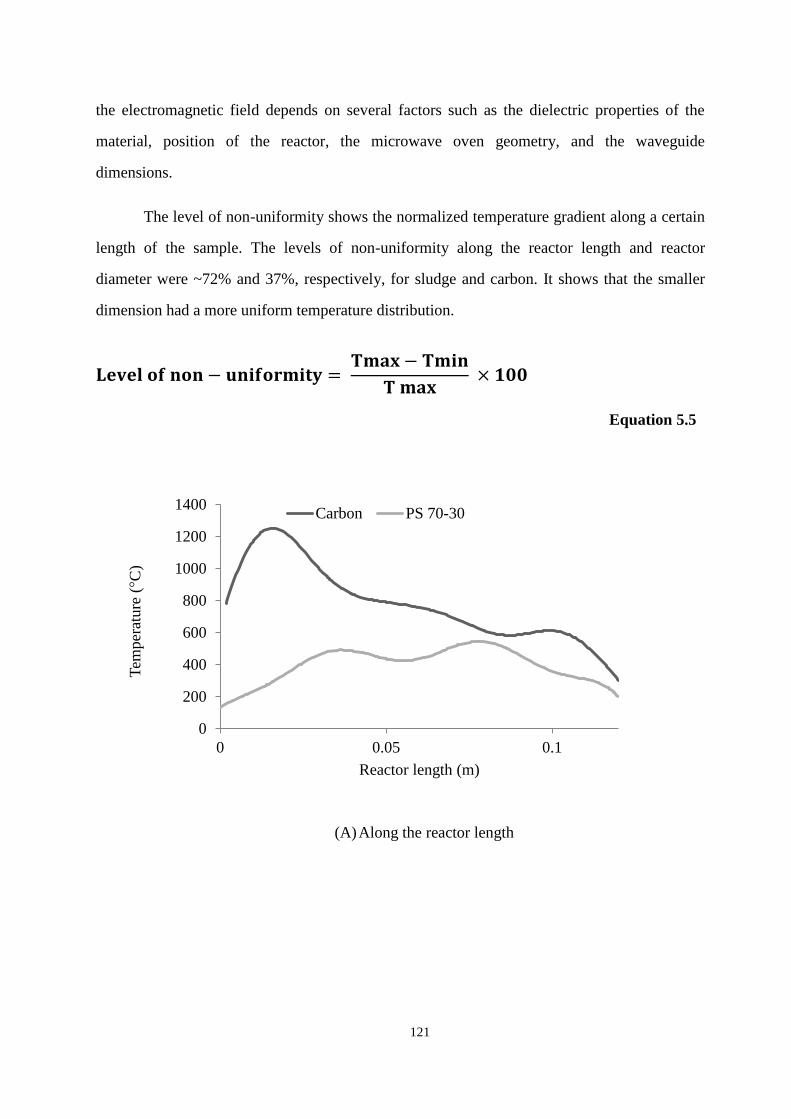
121
the electromagnetic field depends on several factors such as the dielectric properties of the
material, position of the reactor, the microwave oven geometry, and the waveguide
dimensions.
The level of non-uniformity shows the normalized temperature gradient along a certain
length of the sample. The levels of non-uniformity along the reactor length and reactor
diameter were ~72% and 37%, respectively, for sludge and carbon. It shows that the smaller
dimension had a more uniform temperature distribution.
Equation 5.5
(A) Along the reactor length
0
200
400
600
800
1000
1200
1400
0 0.05 0.1
Tem
per
ature
(°C
)
Reactor length (m)
Carbon PS 70-30
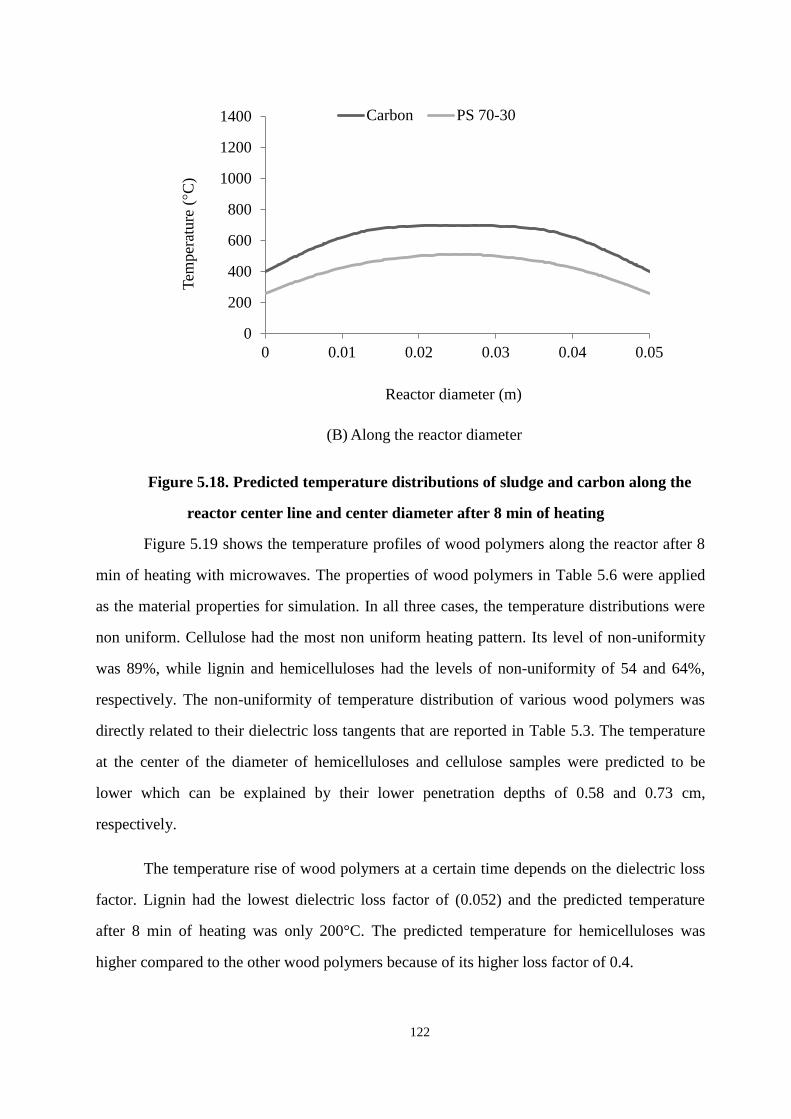
122
(B) Along the reactor diameter
Figure 5.18. Predicted temperature distributions of sludge and carbon along the
reactor center line and center diameter after 8 min of heating
Figure 5.19 shows the temperature profiles of wood polymers along the reactor after 8
min of heating with microwaves. The properties of wood polymers in Table 5.6 were applied
as the material properties for simulation. In all three cases, the temperature distributions were
non uniform. Cellulose had the most non uniform heating pattern. Its level of non-uniformity
was 89%, while lignin and hemicelluloses had the levels of non-uniformity of 54 and 64%,
respectively. The non-uniformity of temperature distribution of various wood polymers was
directly related to their dielectric loss tangents that are reported in Table 5.3. The temperature
at the center of the diameter of hemicelluloses and cellulose samples were predicted to be
lower which can be explained by their lower penetration depths of 0.58 and 0.73 cm,
respectively.
The temperature rise of wood polymers at a certain time depends on the dielectric loss
factor. Lignin had the lowest dielectric loss factor of (0.052) and the predicted temperature
after 8 min of heating was only 200°C. The predicted temperature for hemicelluloses was
higher compared to the other wood polymers because of its higher loss factor of 0.4.
0
200
400
600
800
1000
1200
1400
0 0.01 0.02 0.03 0.04 0.05
Tem
per
ature
(°C
)
Reactor diameter (m)
Carbon PS 70-30
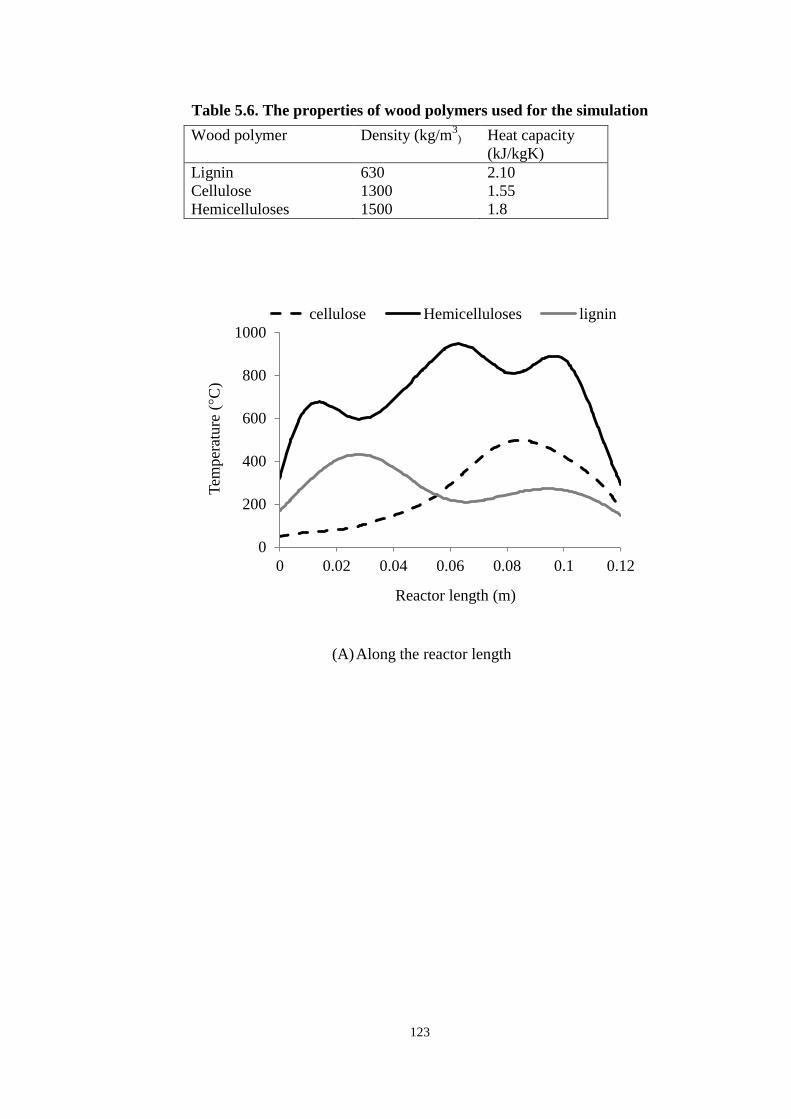
123
Table 5.6. The properties of wood polymers used for the simulation
Wood polymer Density (kg/m3
) Heat capacity
(kJ/kgK)
Lignin 630 2.10
Cellulose 1300 1.55
Hemicelluloses 1500 1.8
(A) Along the reactor length
0
200
400
600
800
1000
0 0.02 0.04 0.06 0.08 0.1 0.12
Tem
per
ature
(°C
)
Reactor length (m)
cellulose Hemicelluloses lignin
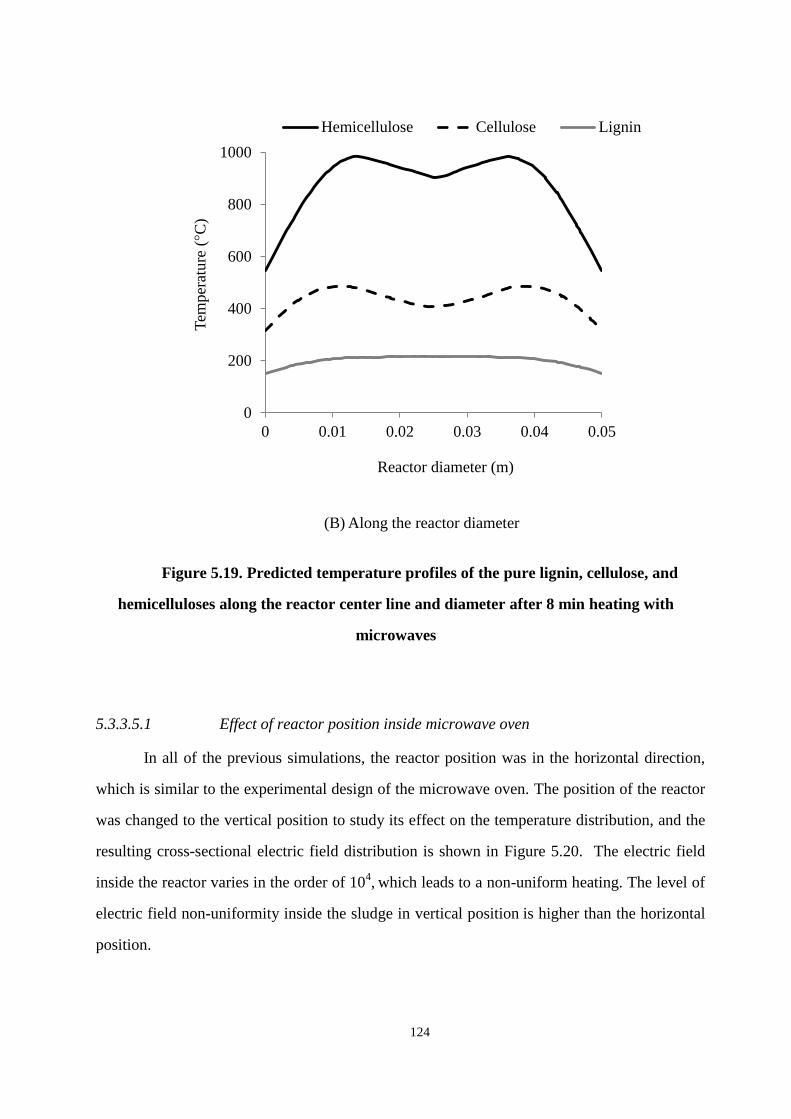
124
(B) Along the reactor diameter
Figure 5.19. Predicted temperature profiles of the pure lignin, cellulose, and
hemicelluloses along the reactor center line and diameter after 8 min heating with
microwaves
5.3.3.5.1 Effect of reactor position inside microwave oven
In all of the previous simulations, the reactor position was in the horizontal direction,
which is similar to the experimental design of the microwave oven. The position of the reactor
was changed to the vertical position to study its effect on the temperature distribution, and the
resulting cross-sectional electric field distribution is shown in Figure 5.20. The electric field
inside the reactor varies in the order of 104, which leads to a non-uniform heating. The level of
electric field non-uniformity inside the sludge in vertical position is higher than the horizontal
position.
0
200
400
600
800
1000
0 0.01 0.02 0.03 0.04 0.05
Tem
per
atu
re (°C
)
Reactor diameter (m)
Hemicellulose Cellulose Lignin
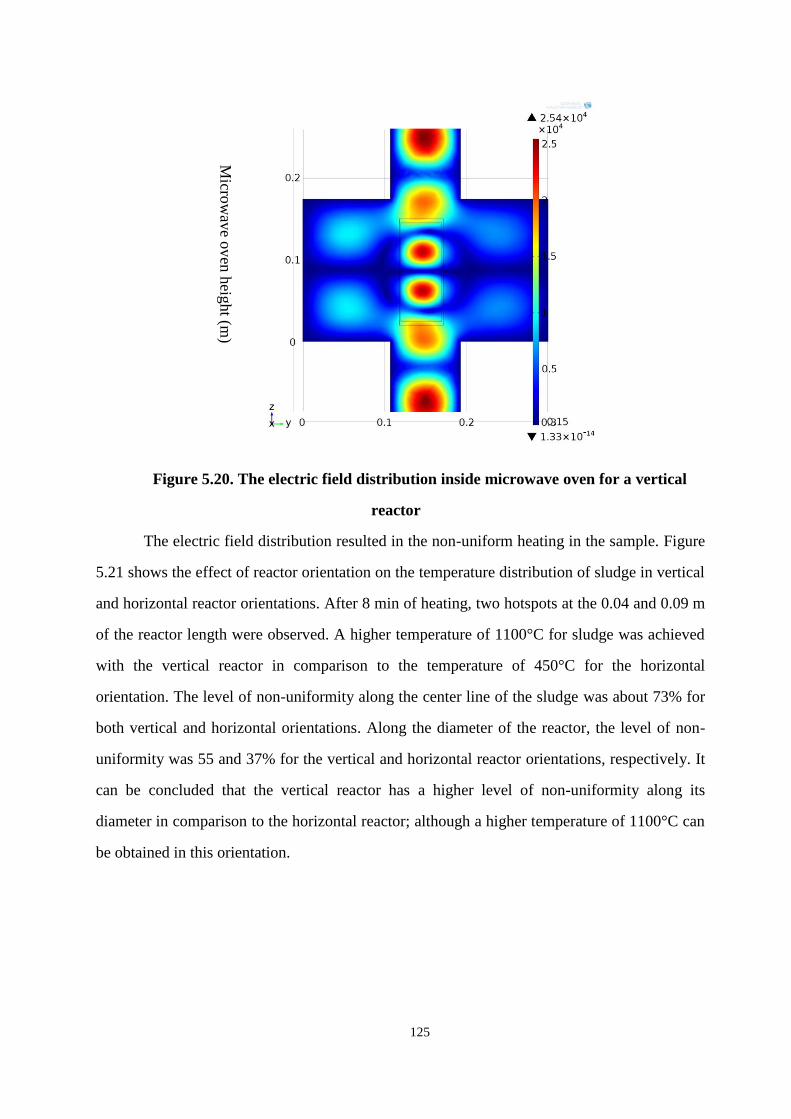
125
Figure 5.20. The electric field distribution inside microwave oven for a vertical
reactor
The electric field distribution resulted in the non-uniform heating in the sample. Figure
5.21 shows the effect of reactor orientation on the temperature distribution of sludge in vertical
and horizontal reactor orientations. After 8 min of heating, two hotspots at the 0.04 and 0.09 m
of the reactor length were observed. A higher temperature of 1100°C for sludge was achieved
with the vertical reactor in comparison to the temperature of 450°C for the horizontal
orientation. The level of non-uniformity along the center line of the sludge was about 73% for
both vertical and horizontal orientations. Along the diameter of the reactor, the level of non-
uniformity was 55 and 37% for the vertical and horizontal reactor orientations, respectively. It
can be concluded that the vertical reactor has a higher level of non-uniformity along its
diameter in comparison to the horizontal reactor; although a higher temperature of 1100°C can
be obtained in this orientation.
Micro
wav
e ov
en h
eight (m
)
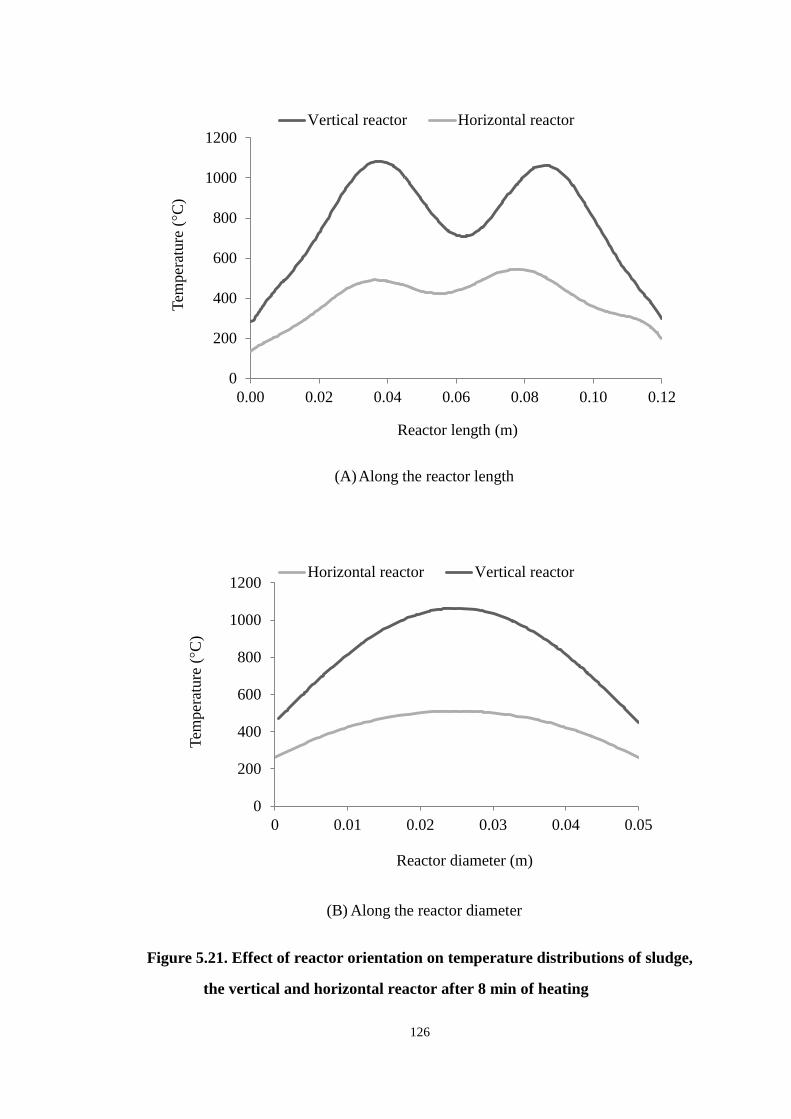
126
(A) Along the reactor length
(B) Along the reactor diameter
Figure 5.21. Effect of reactor orientation on temperature distributions of sludge,
the vertical and horizontal reactor after 8 min of heating
0
200
400
600
800
1000
1200
0.00 0.02 0.04 0.06 0.08 0.10 0.12
Tem
per
ature
(°C
)
Reactor length (m)
Vertical reactor Horizontal reactor
0
200
400
600
800
1000
1200
0 0.01 0.02 0.03 0.04 0.05
Tem
per
ature
(°C
)
Reactor diameter (m)
Horizontal reactor Vertical reactor
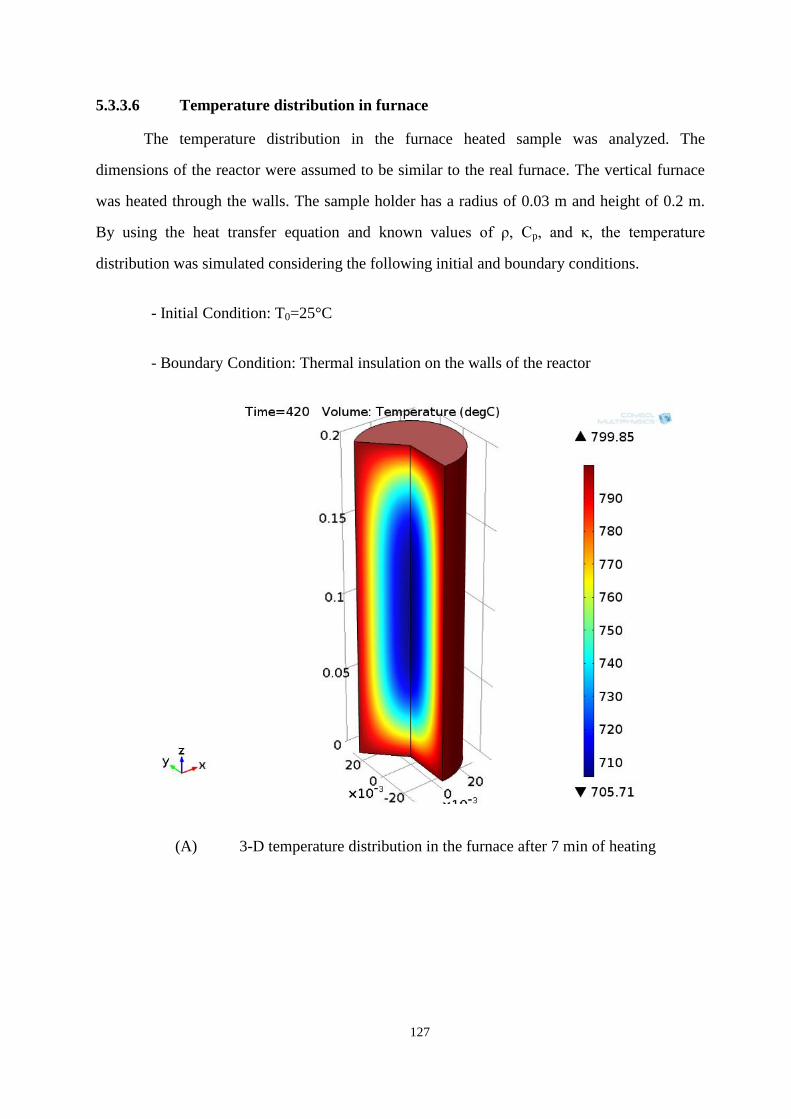
127
5.3.3.6 Temperature distribution in furnace
The temperature distribution in the furnace heated sample was analyzed. The
dimensions of the reactor were assumed to be similar to the real furnace. The vertical furnace
was heated through the walls. The sample holder has a radius of 0.03 m and height of 0.2 m.
By using the heat transfer equation and known values of ρ, Cp, and , the temperature
distribution was simulated considering the following initial and boundary conditions.
- Initial Condition: T0=25°C
- Boundary Condition: Thermal insulation on the walls of the reactor
(A) 3-D temperature distribution in the furnace after 7 min of heating
Ti
me (s)
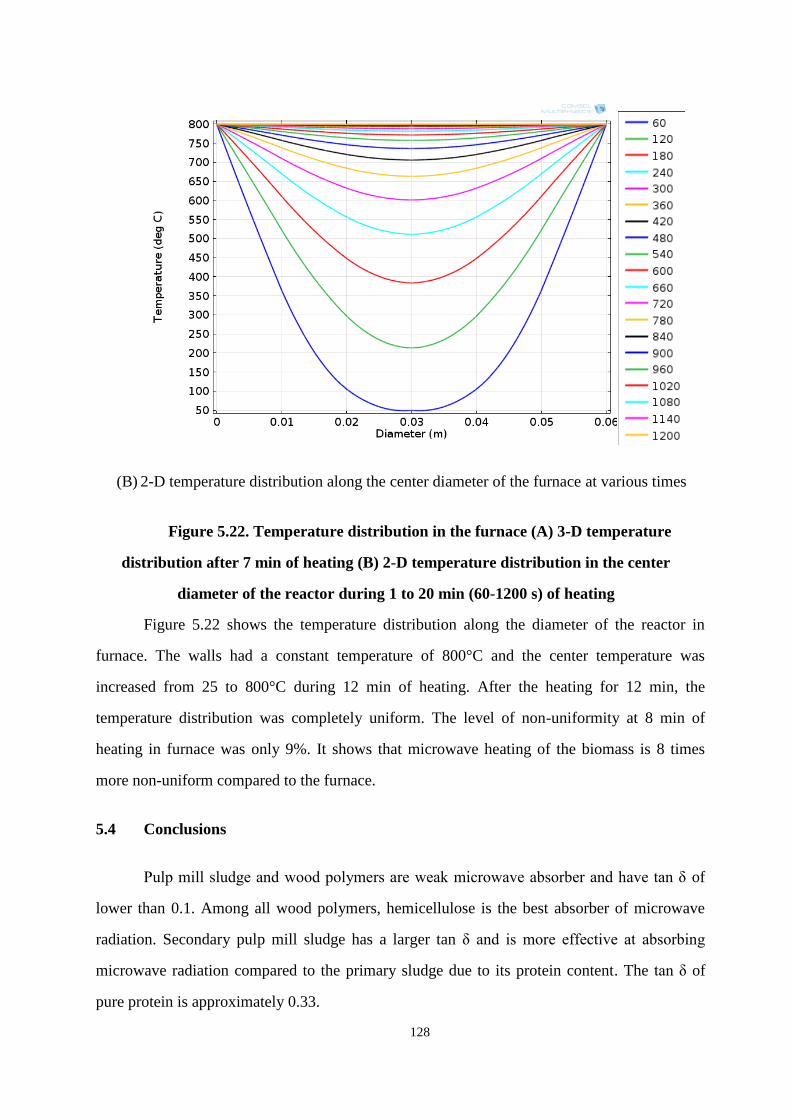
128
(B) 2-D temperature distribution along the center diameter of the furnace at various times
Figure 5.22. Temperature distribution in the furnace (A) 3-D temperature
distribution after 7 min of heating (B) 2-D temperature distribution in the center
diameter of the reactor during 1 to 20 min (60-1200 s) of heating
Figure 5.22 shows the temperature distribution along the diameter of the reactor in
furnace. The walls had a constant temperature of 800°C and the center temperature was
increased from 25 to 800°C during 12 min of heating. After the heating for 12 min, the
temperature distribution was completely uniform. The level of non-uniformity at 8 min of
heating in furnace was only 9%. It shows that microwave heating of the biomass is 8 times
more non-uniform compared to the furnace.
5.4 Conclusions
Pulp mill sludge and wood polymers are weak microwave absorber and have tan δ of
lower than 0.1. Among all wood polymers, hemicellulose is the best absorber of microwave
radiation. Secondary pulp mill sludge has a larger tan δ and is more effective at absorbing
microwave radiation compared to the primary sludge due to its protein content. The tan δ of
pure protein is approximately 0.33.
129
The pressure-based temperature probe with a larger bulb is better than the ones without
a bulb and with a smaller bulb in term of repeatability. Under the conditions that were studied ,
the temperature at the center of the sample reaches a plateau, between 600 to 800 C within
about 4 minutes. The plateau temperature is controllable by adjusting the microwave power
level and the amount of strong microwave absorber, such as KOH.
COMSOL multiphysics 4.4 was used to develop a 3-D model to simulate the
temperature distribution in the microwave-heated sample and its time dependence. The effects
of heat capacity (Cp), thermal conductivity (k) of samples, and position of the reactor inside
the microwave oven were studies. Thermal conductivity was found to affect the uniformity of
heating and the plateau temperature, while the heat capacity only affected the time to reach the
plateau temperature. In addition, simulation results demonstrated the importance of the mode
of heat transfer between the reactor and its surrounding, sample porosity and volume in
determining plateau temperature.
The modelling results demonstrated that a continuing microwave radiation would result in a
non-uniform temperature distribution even after reaching the plateau, which is very different
from heating in a conventional furnace. The degree of non-uniformity changes with thermal
properties of samples, such as heat conductivity and capacity, as well as sample location in the
microwave oven.
130
6 Effect of Chemical Components in White Liquor on Carbon
Activation4
Abstract
Conversion of pulp mill sludge into activated carbon is an alternative solution for
waste management at pulp mills. In this study, the use of white liquor as an activating agent
with the aim of applying an available source at the pulp mills was investigated. White liquor
is the cooking solution of the kraft pulp mills that mainly contains NaOH and Na2S. The
specific surface area (SSA) and activation yield (%) of the produced activated carbon were
measured for various operating conditions and compared with the pure NaOH activation
results. The SSA value of 650 m2/g and an activation yield of 61% were achieved with
synthetic white liquor at 600°C and 2 h. The SSA values obtained with white liquor were
~60% lower than that with NaOH alone. To understand the effect of white liquor compounds
on the carbon activation, the thermodynamic equilibrium of the four activation reaction
systems were analyzed using FactSage and HSC. X-ray diffraction (XRD) and elemental
analyses were used to investigate the activation reaction products. It was found that sodium
sulfide was inert and unable to participate in reactions with carbon in white liquor activation.
Also Na2CO3, a key component of white liquor and a main product of NaOH activation,
affected the equilibrium and hindered the development of pores during NaOH activation.
Both Na2S and Na2CO3 make NaOH less reactive and less available for the activation
reaction with carbon.
4 To be submitted to the journal of industrial and engineering chemistry research
131
6.1 Introduction
The pulp and paper industry is one of the major producers of the solid waste in
Canada (Statistic Canada, 2000). In 1999, the total pulp production of Canada was 31.2
million tons per year. One ton of sludge was generated for 40-50 kg of dry pulp production
(Krigstin & Sain 2006, Monte et al. 2009). Landfilling and incineration, which are common
practices for sludge disposal, have their own drawbacks, such as the leakage of hazardous
substances to the environment and the high cost of the land. Therefore, conversion of pulp
mill sludge into a value added product is an alternative (Mahmood & Elliott 2006; Monte et
al. 2009; Ochoa de Alda 2008; Arrougé et al. 1999; Arrouge et al. 1998; Scott & Smith
1995). Our previous research has shown that one possible product from pulp mill sludge is
activated carbon(Namazi et al. 2010).
One of the common methods to produce activated carbon is chemical activation, using
alkali hydroxides. illo- denas analyzed chemical reactions that take place for activation of
the coal with sodium hydroxide. The proposed reaction for sodium hydroxide activation of
carbon in the temperature range of (600-900˚C) is (Lillo-Ródenas et al. 2003, Yuan et al.
2012):
6NaOH + 2C → 2Na2CO3 + 2Na + 3H2
Equation 6.1
The kraft process is the major pulping process currently used in the pulp and paper
industry. White liquor is the cooking liquor of this process and mainly contains NaOH and
Na2S. Black liquor is the remaining solution of the cooking step and it contains dissolved
organic and inorganic substances from pulping. The chemical recovery process has been used
to recycle pulping chemicals (NaOH and Na2S) at the pulp mills for many years (Tran and
Vakkilainnen 2008). Black liquor enters to a recovery boiler for recovering energy and
recycling pulp mill chemicals. The composition of white liquor after the recovery process is
shown in Table 6.1. White liquor could be a possible candidate to be used as an activating
agent because of its high sodium hydroxide content of 53 wt%.
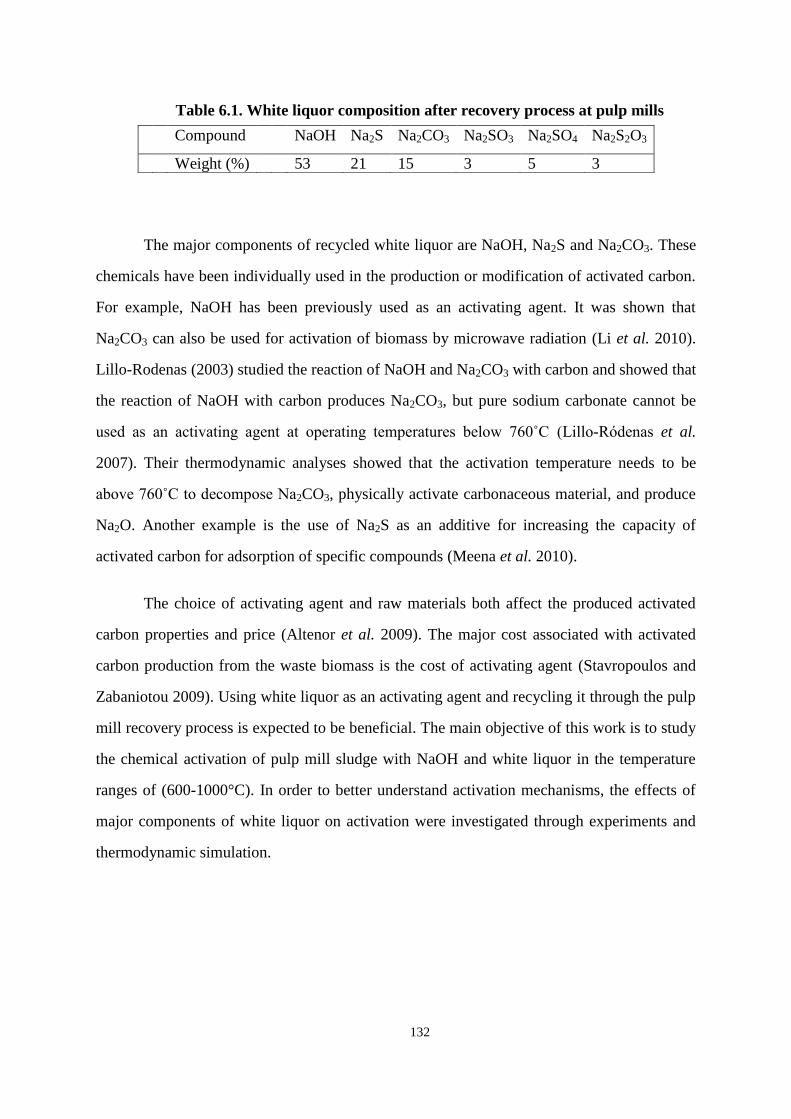
132
Table 6.1. White liquor composition after recovery process at pulp mills
The major components of recycled white liquor are NaOH, Na2S and Na2CO3. These
chemicals have been individually used in the production or modification of activated carbon.
For example, NaOH has been previously used as an activating agent. It was shown that
Na2CO3 can also be used for activation of biomass by microwave radiation (Li et al. 2010).
Lillo-Rodenas (2003) studied the reaction of NaOH and Na2CO3 with carbon and showed that
the reaction of NaOH with carbon produces Na2CO3, but pure sodium carbonate cannot be
used as an activating agent at operating temperatures below 760˚C illo- denas et al.
2007). Their thermodynamic analyses showed that the activation temperature needs to be
above 760˚C to decompose Na2CO3, physically activate carbonaceous material, and produce
Na2O. Another example is the use of Na2S as an additive for increasing the capacity of
activated carbon for adsorption of specific compounds (Meena et al. 2010).
The choice of activating agent and raw materials both affect the produced activated
carbon properties and price (Altenor et al. 2009). The major cost associated with activated
carbon production from the waste biomass is the cost of activating agent (Stavropoulos and
Zabaniotou 2009). Using white liquor as an activating agent and recycling it through the pulp
mill recovery process is expected to be beneficial. The main objective of this work is to study
the chemical activation of pulp mill sludge with NaOH and white liquor in the temperature
ranges of (600-1000°C). In order to better understand activation mechanisms, the effects of
major components of white liquor on activation were investigated through experiments and
thermodynamic simulation.
Compound NaOH Na2S Na2CO3 Na2SO3 Na2SO4 Na2S2O3
Weight (%) 53 21 15 3 5 3
133
6.2 Material and methods
6.2.1 Materials
Pulp mill sludge was collected from a pulp mill in Northern Ontario, Canada. The
sludge was a dried mixture of the primary and secondary sludge. Table 6.2 shows the
proximate and ultimate analyses of the dried pulp mill sludge used as the raw material for
activated carbon production. The proximate analysis provides the weight percentage of fixed
carbon, volatile matter, and ash. While ultimate analysis indicates the elemental composition
of a biomass.
Table 6.2. Proximate and ultimate analyses of pulp mill sludge
Raw materials Proximate analyses (%) Ultimate analyses (%)
Fixed carbon Volatile matter Ash C H N O Others
Sludge 18±1 77±2 4±1 46 6 8 21 19
A dry synthetic white liquor was prepared by grinding and mixing the dry chemical
grade reagents consists of NaOH, Na2CO3 and Na2S.9H2O, Na2SO4, Na2SO3 and Na2S2O3
(Sigma-Aldrich) homogenously with the weight ratio given in Table 6.1.
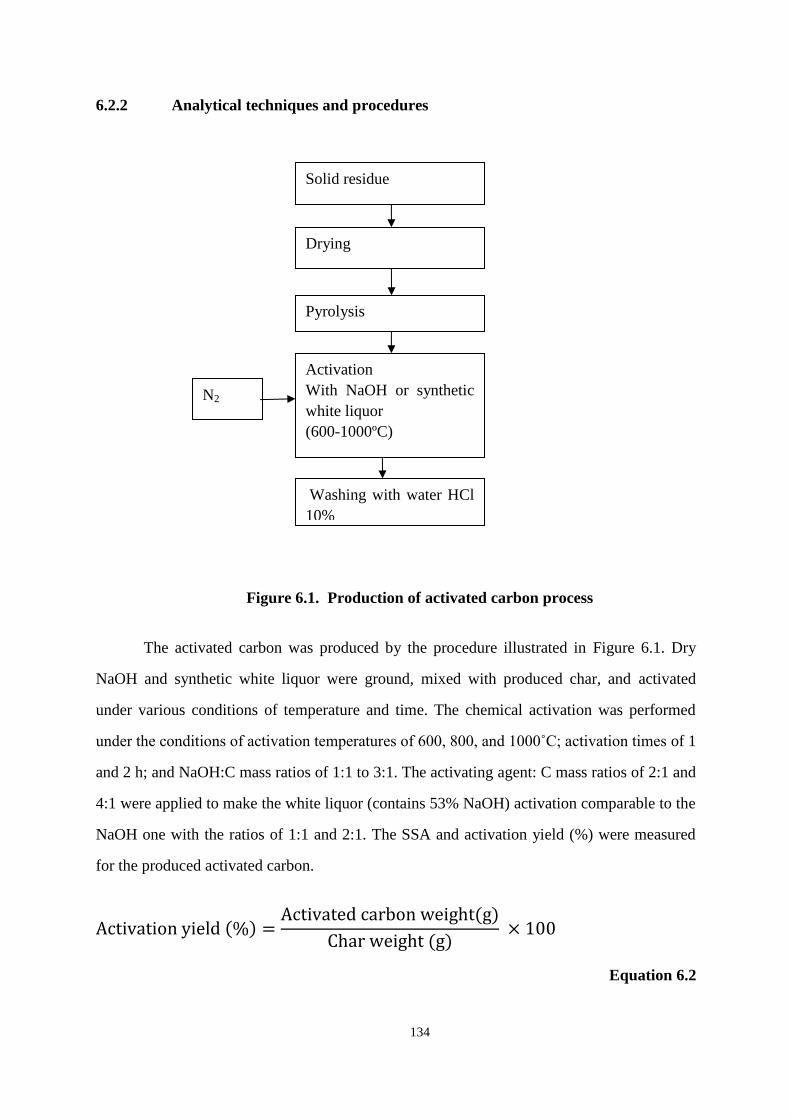
134
6.2.2 Analytical techniques and procedures
Figure 6.1. Production of activated carbon process
The activated carbon was produced by the procedure illustrated in Figure 6.1. Dry
NaOH and synthetic white liquor were ground, mixed with produced char, and activated
under various conditions of temperature and time. The chemical activation was performed
under the conditions of activation temperatures of 600, 800, and 1000˚C; activation times of 1
and 2 h; and NaOH:C mass ratios of 1:1 to 3:1. The activating agent: C mass ratios of 2:1 and
4:1 were applied to make the white liquor (contains 53% NaOH) activation comparable to the
NaOH one with the ratios of 1:1 and 2:1. The SSA and activation yield (%) were measured
for the produced activated carbon.
Equation 6.2
Washing with water HCl
10%
Solid residue
Drying
Pyrolysis
Activation
With NaOH or synthetic
white liquor
(600-1000ºC)
N2
135
The total elemental contents of the samples before and after the washing step were
determined using an Exeter Analytical CE-440 Elemental Analyzer. This device is based on a
combustion technique and some forms of sulfur, such as inorganic sulfates and pyrites were
not taken into account, depending on the decomposition temperatures. The sulfur content
determined by this method is only combustible sulfur.
The activated carbon sample was analyzed prior to washing by X-ray diffraction
(XRD) to determine the sulfur form in the crystalline structure of white liquor –activated
carbon. The samples were ground to create a fine and uniform particle size. The X-ray
diffraction was performed at room temperature and 2θ was set for 22° to 50° at 0.01°/sec and
the XRD peaks were obtained.
6.2.3 FactSage software for thermodynamic simulation
The thermodynamics of the carbon activation reaction with white liquor were
investigated to find the equilibrium compositions. Thermodynamic simulations were
performed using FactSage software, a commercial thermodynamic software package which
predicts the products by minimizing the Gibbs free energy. The reaction was studied for the
activating agent:C mass ratio of 2:1 under a helium atmosphere. For a comprehensive
understanding of white liquor chemical effects on carbon activation, various mixtures of
white liquor chemicals were used as activating agents. The ratios of activating agent
chemicals were the same as their ratio in the white liquor composition. The carbon reactions
with five activating agents were analyzed with FactSage simulations. The activating agent
names and molar compositions are summarized in Table 6.3. In each case, the reaction of
activating agent and 8.33 moles of carbon was simulated. Thermodynamic simulations
assume unlimited time for the reactions to happen. The relevant compounds in the gaseous
and solid phase were selected from the FactSage data base and are summarized in Table 6.4.
136
Table 6.3. Five activating agents used for thermodynamic simulations
Activating agent compositions (moles) Name
(A) 2.6 NaOH Hydroxide
(B) 0.28Na2CO3-2.6NaOH Carbonate and hydroxide
(C) 0.54Na2S-2.6NaOH Sulfide and hydroxide
(D) 0.54Na2S-0.28Na2CO3-2.6NaOH Carbonate, sulfide, and
hydroxide
(E) 0.07Na2SO4-0.047Na2SO3-0.54Na2S-
0.282Na2CO3-2.6NaOH
White liquor
The products were used to predict the equilibrium compositions using a
thermodynamic software package HSC (enthalpy (H), entropy (S), and heat capacity (C)).
HSC does not take into account the kinetics of the chemical reaction and non-ideality of the
solutions.
Table 6.4. List of the components considered for FactSage modeling
6.3 Results and discussion
6.3.1 Surface area and activation yield (%) analyses
6.3.1.1 NaOH Activation
Figure 6.2 shows the effect of activation time, NaOH:C mass ratio, and activation
temperature on the SSA and activation yield (%) of the activated carbon. The main
controlling parameters in NaOH activation were the NaOH:C mass ratio and activation
temperature. The highest surface area of 2500 m2/g was obtained at 800°C, 1.5 h activation
and NaOH:C mass ratio of 2:1. The activation yield (%) did not change significantly with
activation temperature, activation time (1 to 2 h), and NaOH:C mass ratio and was in the
Groups Compounds
Oxygen-containing gaseous
compounds
O2, OH, H2O, HO2, H2O2, CO, CO2, HCO, CH3OH,
C2H4O, CH3COOH,
Hydrocarbons CH3, CH4, C2H2, C2H3, C2H6
Sulfur containing compounds S, S2, HS, H2S, CS, CS2, SO, SO2, SO3, COS
Sodium compounds Na, NaH, NaO, Na2O, Na2CO3
Oxides Na2O, SO3
Sulfur containing species Na2SO3, Na2SO4, Na2S
Hydroxides NaOH
Solid species C (graphite)
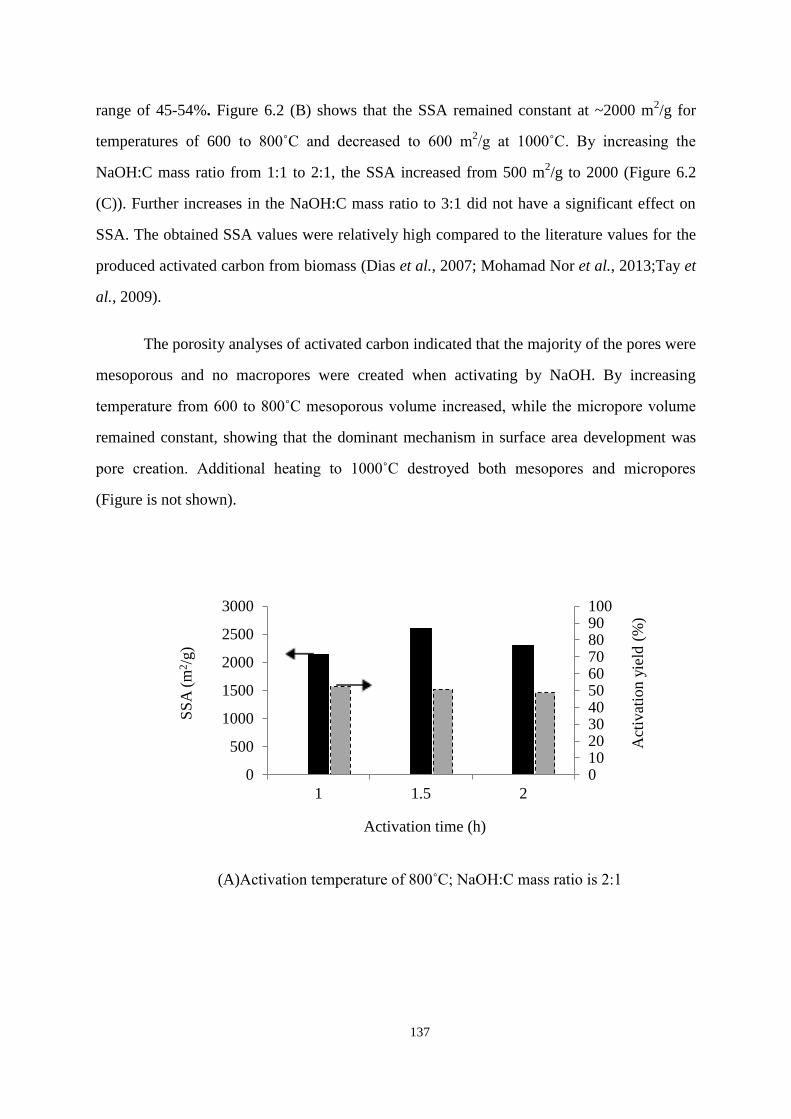
137
range of 45-54%. Figure 6.2 (B) shows that the SSA remained constant at ~2000 m2/g for
temperatures of 600 to 800˚C and decreased to 600 m2/g at 1000˚C. By increasing the
NaOH:C mass ratio from 1:1 to 2:1, the SSA increased from 500 m2/g to 2000 (Figure 6.2
(C)). Further increases in the NaOH:C mass ratio to 3:1 did not have a significant effect on
SSA. The obtained SSA values were relatively high compared to the literature values for the
produced activated carbon from biomass (Dias et al., 2007; Mohamad Nor et al., 2013;Tay et
al., 2009).
The porosity analyses of activated carbon indicated that the majority of the pores were
mesoporous and no macropores were created when activating by NaOH. By increasing
temperature from 600 to 800˚C mesoporous volume increased, while the micropore volume
remained constant, showing that the dominant mechanism in surface area development was
pore creation. Additional heating to 1000˚C destroyed both mesopores and micropores
(Figure is not shown).
(A)Activation temperature of 800˚C; NaOH:C mass ratio is 2:1
0102030405060708090100
0
500
1000
1500
2000
2500
3000
1 1.5 2
Act
ivat
ion y
ield
(%
)
SS
A (
m2/g
)
Activation time (h)
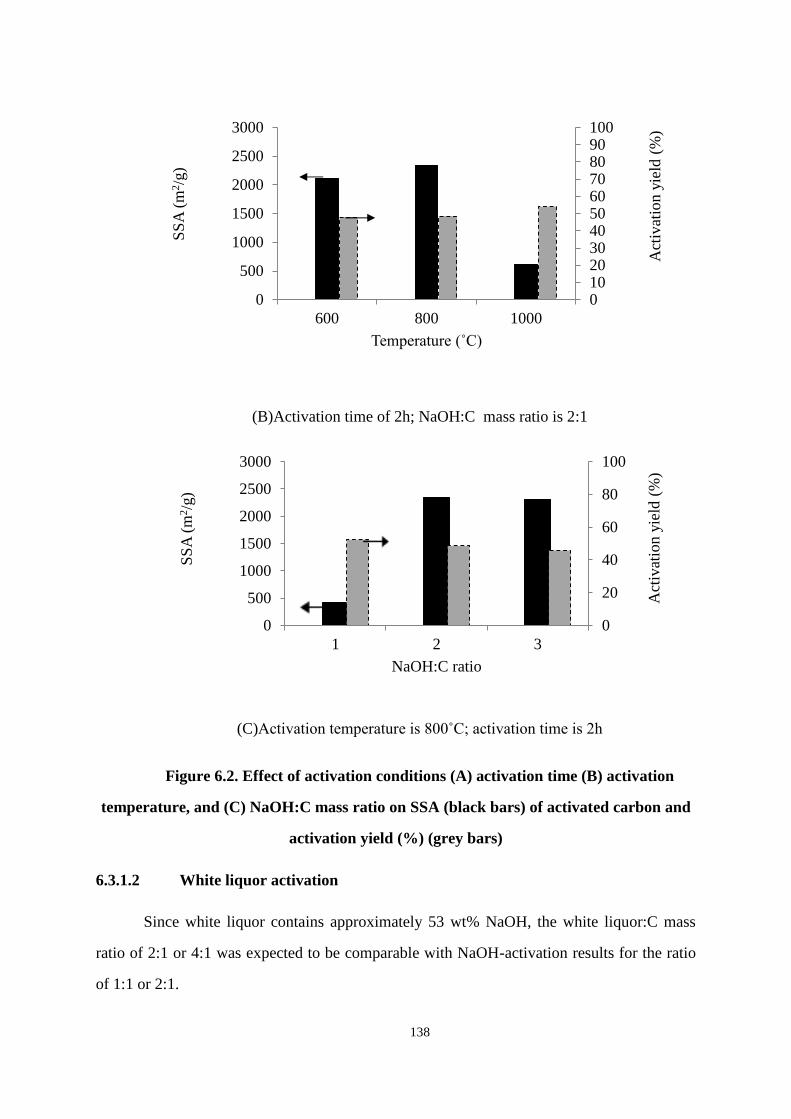
138
(B)Activation time of 2h; NaOH:C mass ratio is 2:1
(C)Activation temperature is 800˚C; activation time is 2h
Figure 6.2. Effect of activation conditions (A) activation time (B) activation
temperature, and (C) NaOH:C mass ratio on SSA (black bars) of activated carbon and
activation yield (%) (grey bars)
6.3.1.2 White liquor activation
Since white liquor contains approximately 53 wt% NaOH, the white liquor:C mass
ratio of 2:1 or 4:1 was expected to be comparable with NaOH-activation results for the ratio
of 1:1 or 2:1.
0102030405060708090100
0
500
1000
1500
2000
2500
3000
600 800 1000
Act
ivat
ion y
ield
(%
)
SS
A (
m2/g
)
Temperature ˚C)
0
20
40
60
80
100
0
500
1000
1500
2000
2500
3000
1 2 3A
ctiv
atio
n y
ield
(%
)
SS
A (
m2/g
)
NaOH:C ratio
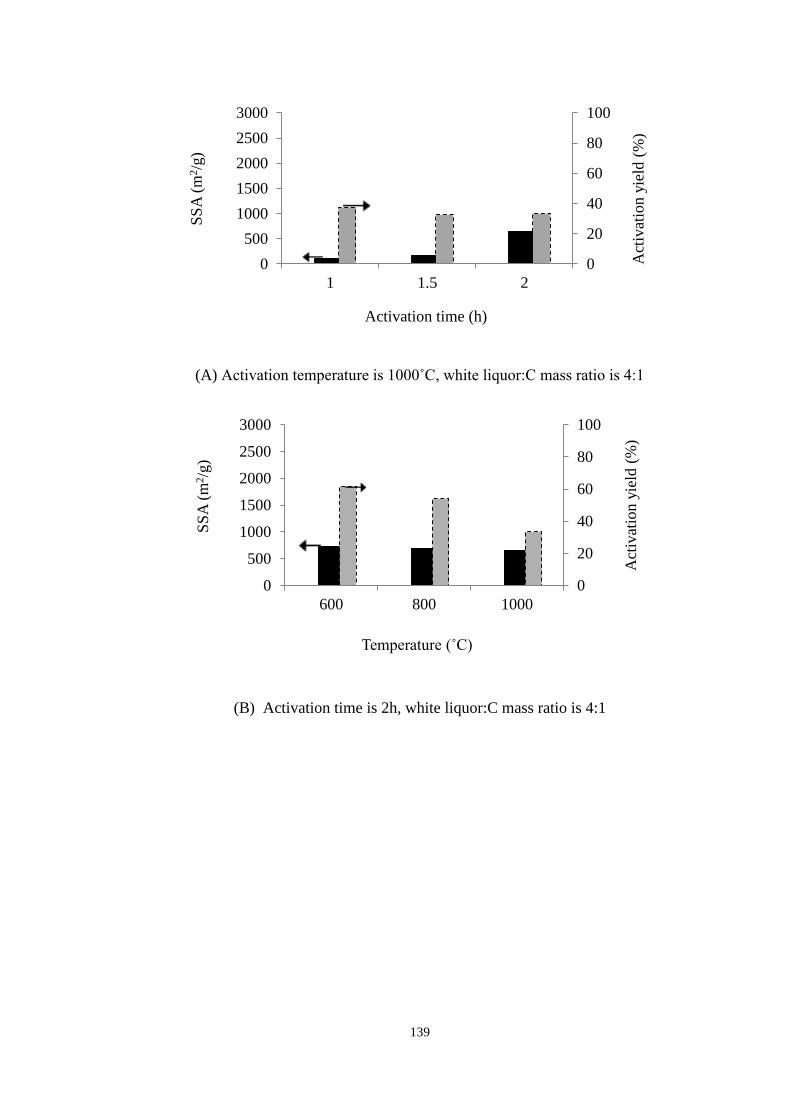
139
(A) Activation temperature is 1000˚C, white liquor:C mass ratio is 4:1
(B) Activation time is 2h, white liquor:C mass ratio is 4:1
0
20
40
60
80
100
0
500
1000
1500
2000
2500
3000
1 1.5 2
Act
ivat
ion y
ield
(%
)
SS
A (
m2/g
)
Activation time (h)
0
20
40
60
80
100
0
500
1000
1500
2000
2500
3000
600 800 1000
Act
ivat
ion y
ield
(%
)
SS
A (
m2/g
)
Temperature ˚C)
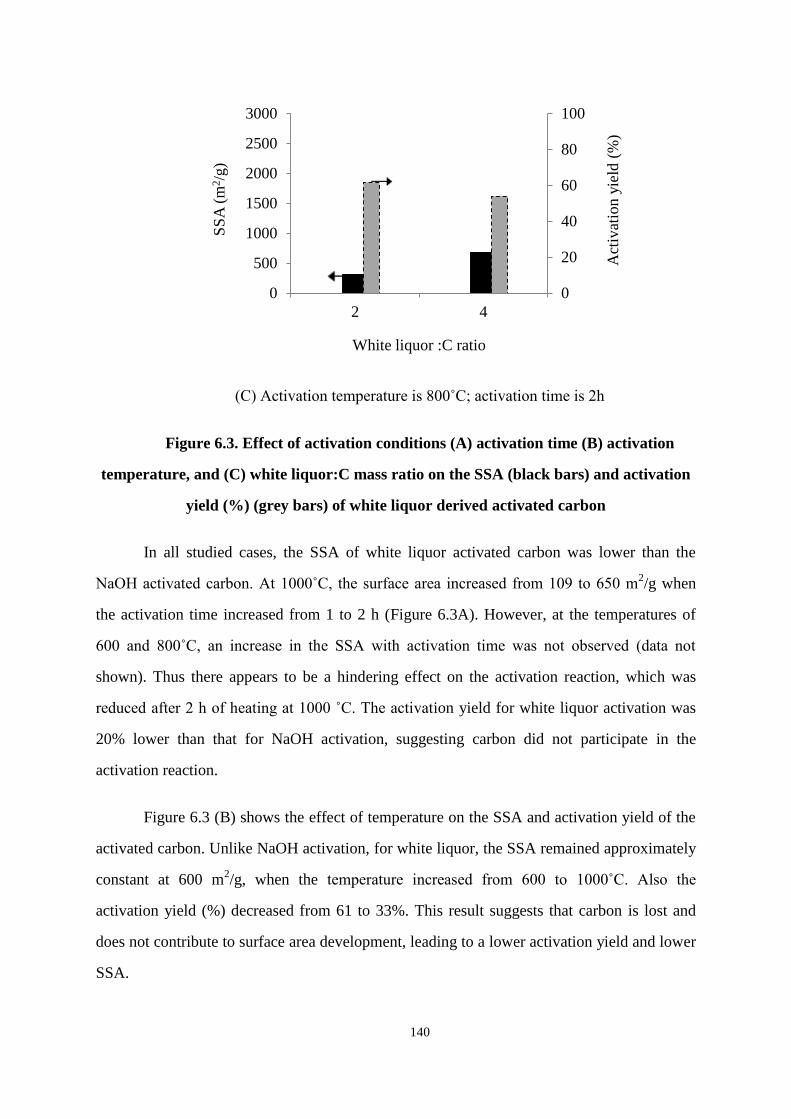
140
C) Activation temperature is 800˚C; activation time is 2h
Figure 6.3. Effect of activation conditions (A) activation time (B) activation
temperature, and (C) white liquor:C mass ratio on the SSA (black bars) and activation
yield (%) (grey bars) of white liquor derived activated carbon
In all studied cases, the SSA of white liquor activated carbon was lower than the
NaOH activated carbon. At 1000˚C, the surface area increased from 109 to 650 m2/g when
the activation time increased from 1 to 2 h (Figure 6.3A). However, at the temperatures of
600 and 800˚C, an increase in the SSA with activation time was not observed data not
shown). Thus there appears to be a hindering effect on the activation reaction, which was
reduced after 2 h of heating at 1000 ˚C. The activation yield for white liquor activation was
20% lower than that for NaOH activation, suggesting carbon did not participate in the
activation reaction.
Figure 6.3 (B) shows the effect of temperature on the SSA and activation yield of the
activated carbon. Unlike NaOH activation, for white liquor, the SSA remained approximately
constant at 600 m2/g, when the temperature increased from 600 to 1000˚C. Also the
activation yield (%) decreased from 61 to 33%. This result suggests that carbon is lost and
does not contribute to surface area development, leading to a lower activation yield and lower
SSA.
0
20
40
60
80
100
0
500
1000
1500
2000
2500
3000
2 4
Act
ivat
ion y
ield
(%
)
SS
A (
m2/g
)
White liquor :C ratio
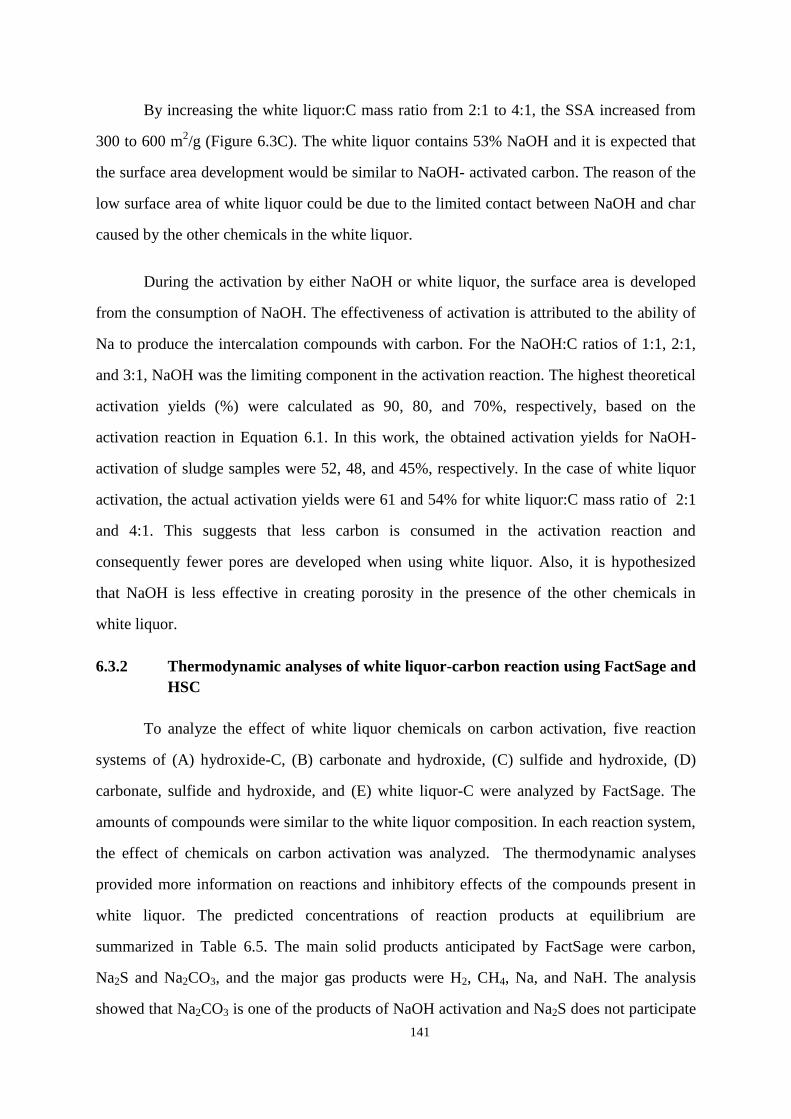
141
By increasing the white liquor:C mass ratio from 2:1 to 4:1, the SSA increased from
300 to 600 m2/g (Figure 6.3C). The white liquor contains 53% NaOH and it is expected that
the surface area development would be similar to NaOH- activated carbon. The reason of the
low surface area of white liquor could be due to the limited contact between NaOH and char
caused by the other chemicals in the white liquor.
During the activation by either NaOH or white liquor, the surface area is developed
from the consumption of NaOH. The effectiveness of activation is attributed to the ability of
Na to produce the intercalation compounds with carbon. For the NaOH:C ratios of 1:1, 2:1,
and 3:1, NaOH was the limiting component in the activation reaction. The highest theoretical
activation yields (%) were calculated as 90, 80, and 70%, respectively, based on the
activation reaction in Equation 6.1. In this work, the obtained activation yields for NaOH-
activation of sludge samples were 52, 48, and 45%, respectively. In the case of white liquor
activation, the actual activation yields were 61 and 54% for white liquor:C mass ratio of 2:1
and 4:1. This suggests that less carbon is consumed in the activation reaction and
consequently fewer pores are developed when using white liquor. Also, it is hypothesized
that NaOH is less effective in creating porosity in the presence of the other chemicals in
white liquor.
6.3.2 Thermodynamic analyses of white liquor-carbon reaction using FactSage and
HSC
To analyze the effect of white liquor chemicals on carbon activation, five reaction
systems of (A) hydroxide-C, (B) carbonate and hydroxide, (C) sulfide and hydroxide, (D)
carbonate, sulfide and hydroxide, and (E) white liquor-C were analyzed by FactSage. The
amounts of compounds were similar to the white liquor composition. In each reaction system,
the effect of chemicals on carbon activation was analyzed. The thermodynamic analyses
provided more information on reactions and inhibitory effects of the compounds present in
white liquor. The predicted concentrations of reaction products at equilibrium are
summarized in Table 6.5. The main solid products anticipated by FactSage were carbon,
Na2S and Na2CO3, and the major gas products were H2, CH4, Na, and NaH. The analysis
showed that Na2CO3 is one of the products of NaOH activation and Na2S does not participate
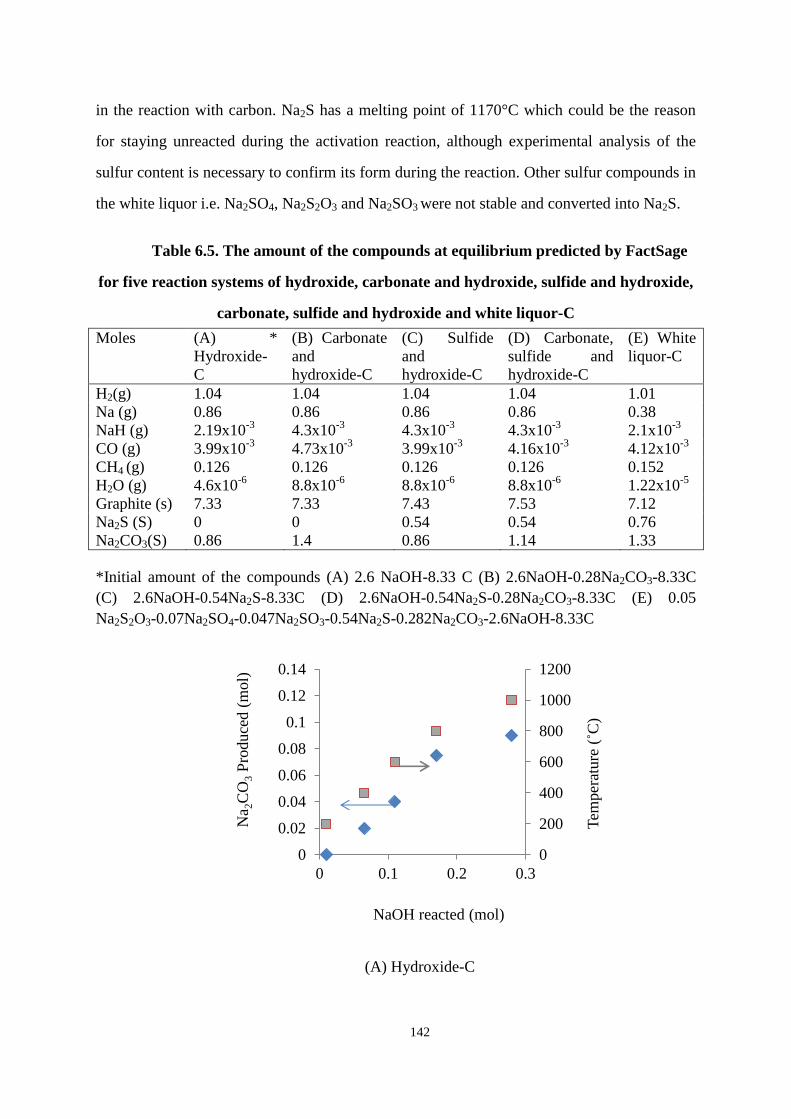
142
in the reaction with carbon. Na2S has a melting point of 1170°C which could be the reason
for staying unreacted during the activation reaction, although experimental analysis of the
sulfur content is necessary to confirm its form during the reaction. Other sulfur compounds in
the white liquor i.e. Na2SO4, Na2S2O3 and Na2SO3 were not stable and converted into Na2S.
Table 6.5. The amount of the compounds at equilibrium predicted by FactSage
for five reaction systems of hydroxide, carbonate and hydroxide, sulfide and hydroxide,
carbonate, sulfide and hydroxide and white liquor-C
Moles (A) *
Hydroxide-
C
(B) Carbonate
and
hydroxide-C
(C) Sulfide
and
hydroxide-C
(D) Carbonate,
sulfide and
hydroxide-C
(E) White
liquor-C
H2(g) 1.04 1.04 1.04 1.04 1.01
Na (g) 0.86 0.86 0.86 0.86 0.38
NaH (g) 2.19x10⁻³
4.3x10⁻³
4.3x10⁻³
4.3x10⁻³
2.1x10⁻³
CO (g) 3.99x10⁻³
4.73x10⁻³
3.99x10⁻³
4.16x10⁻³
4.12x10⁻³
CH4 (g) 0.126 0.126 0.126 0.126 0.152
H2O (g) 4.6x10⁻⁶
8.8x10⁻⁶
8.8x10⁻⁶
8.8x10⁻⁶
1.22x10⁻⁵
Graphite (s) 7.33 7.33 7.43 7.53 7.12
Na2S (S) 0 0 0.54 0.54 0.76
Na2CO3(S) 0.86 1.4 0.86 1.14 1.33
*Initial amount of the compounds (A) 2.6 NaOH-8.33 C (B) 2.6NaOH-0.28Na2CO3-8.33C
(C) 2.6NaOH-0.54Na2S-8.33C (D) 2.6NaOH-0.54Na2S-0.28Na2CO3-8.33C (E) 0.05
Na2S2O3-0.07Na2SO4-0.047Na2SO3-0.54Na2S-0.282Na2CO3-2.6NaOH-8.33C
(A) Hydroxide-C
0
200
400
600
800
1000
1200
0
0.02
0.04
0.06
0.08
0.1
0.12
0.14
0 0.1 0.2 0.3
Tem
per
ature
(˚C
)
Na 2
CO
3 P
roduce
d (
mol)
NaOH reacted (mol)
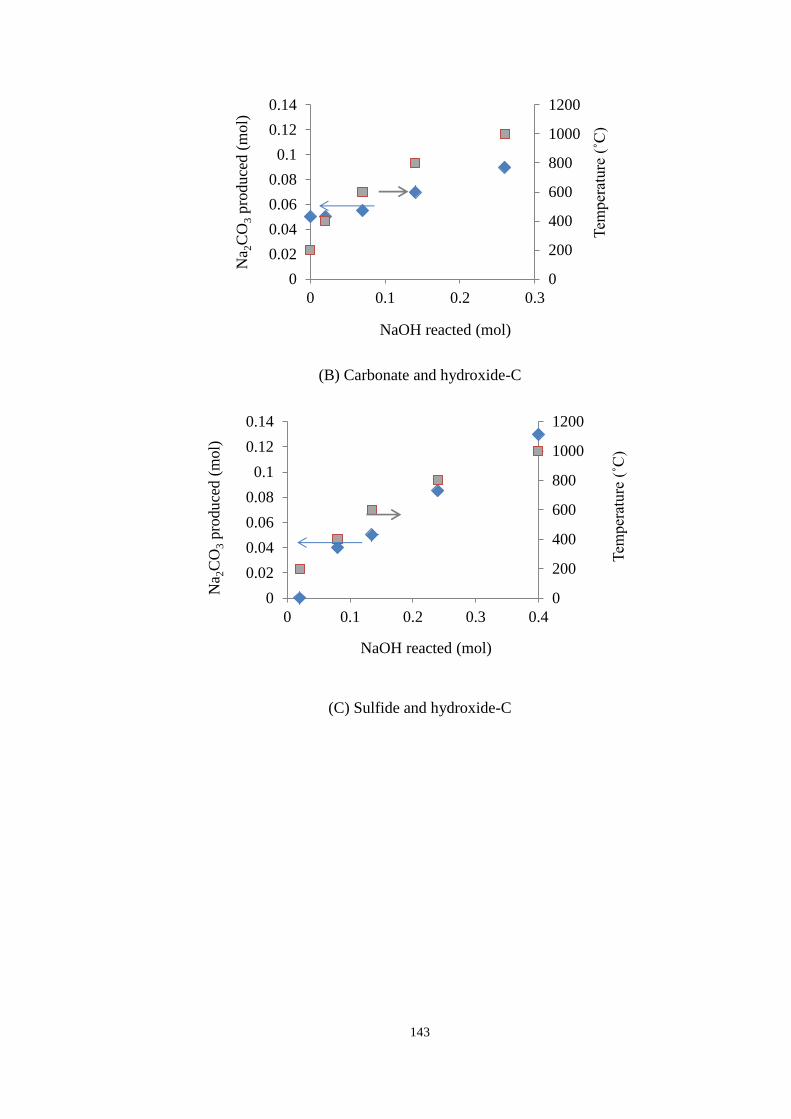
143
(B) Carbonate and hydroxide-C
(C) Sulfide and hydroxide-C
0
200
400
600
800
1000
1200
0
0.02
0.04
0.06
0.08
0.1
0.12
0.14
0 0.1 0.2 0.3
Tem
perature ˚C)
Na 2
CO
3 p
roduce
d (
mol)
NaOH reacted (mol)
0
200
400
600
800
1000
1200
0
0.02
0.04
0.06
0.08
0.1
0.12
0.14
0 0.1 0.2 0.3 0.4Tem
perature ˚C)
Na 2
CO
3 p
roduce
d (
mol)
NaOH reacted (mol)
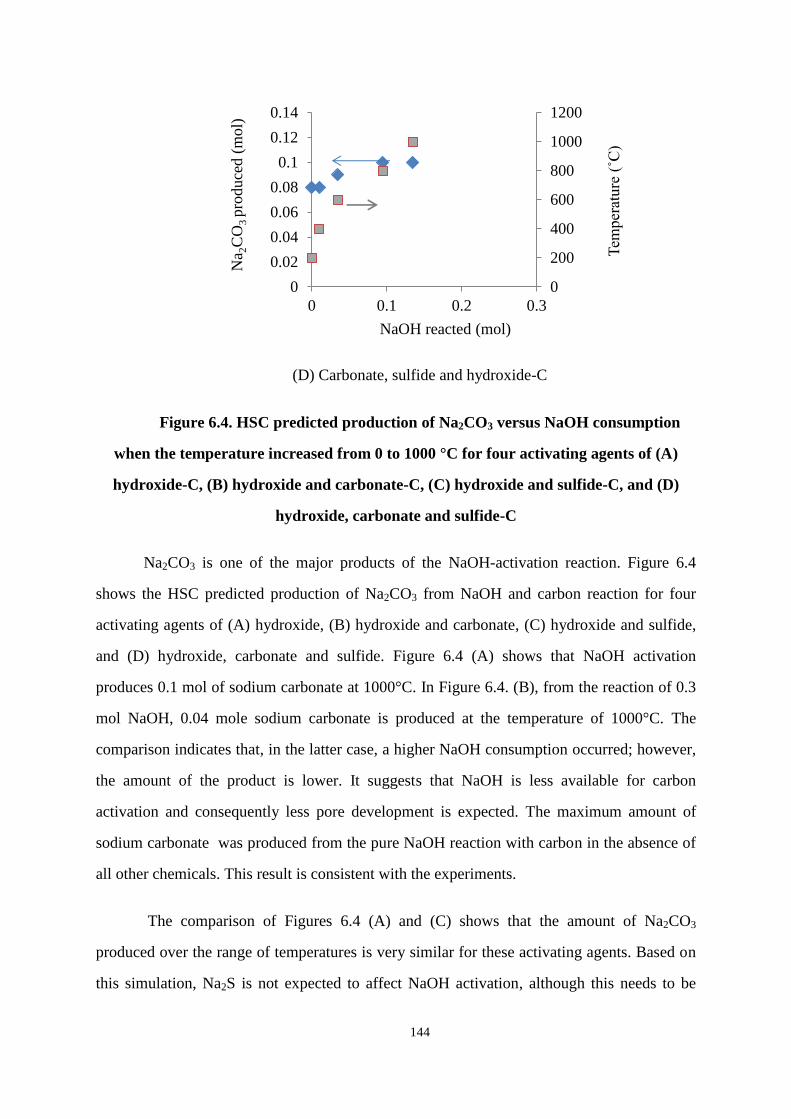
144
(D) Carbonate, sulfide and hydroxide-C
Figure 6.4. HSC predicted production of Na2CO3 versus NaOH consumption
when the temperature increased from 0 to 1000 °C for four activating agents of (A)
hydroxide-C, (B) hydroxide and carbonate-C, (C) hydroxide and sulfide-C, and (D)
hydroxide, carbonate and sulfide-C
Na2CO3 is one of the major products of the NaOH-activation reaction. Figure 6.4
shows the HSC predicted production of Na2CO3 from NaOH and carbon reaction for four
activating agents of (A) hydroxide, (B) hydroxide and carbonate, (C) hydroxide and sulfide,
and (D) hydroxide, carbonate and sulfide. Figure 6.4 (A) shows that NaOH activation
produces 0.1 mol of sodium carbonate at 1000°C. In Figure 6.4. (B), from the reaction of 0.3
mol NaOH, 0.04 mole sodium carbonate is produced at the temperature of 1000°C. The
comparison indicates that, in the latter case, a higher NaOH consumption occurred; however,
the amount of the product is lower. It suggests that NaOH is less available for carbon
activation and consequently less pore development is expected. The maximum amount of
sodium carbonate was produced from the pure NaOH reaction with carbon in the absence of
all other chemicals. This result is consistent with the experiments.
The comparison of Figures 6.4 (A) and (C) shows that the amount of Na2CO3
produced over the range of temperatures is very similar for these activating agents. Based on
this simulation, Na2S is not expected to affect NaOH activation, although this needs to be
0
200
400
600
800
1000
1200
0
0.02
0.04
0.06
0.08
0.1
0.12
0.14
0 0.1 0.2 0.3
Tem
perature ˚C)
Na 2
CO
3 p
roduce
d (
mol)
NaOH reacted (mol)
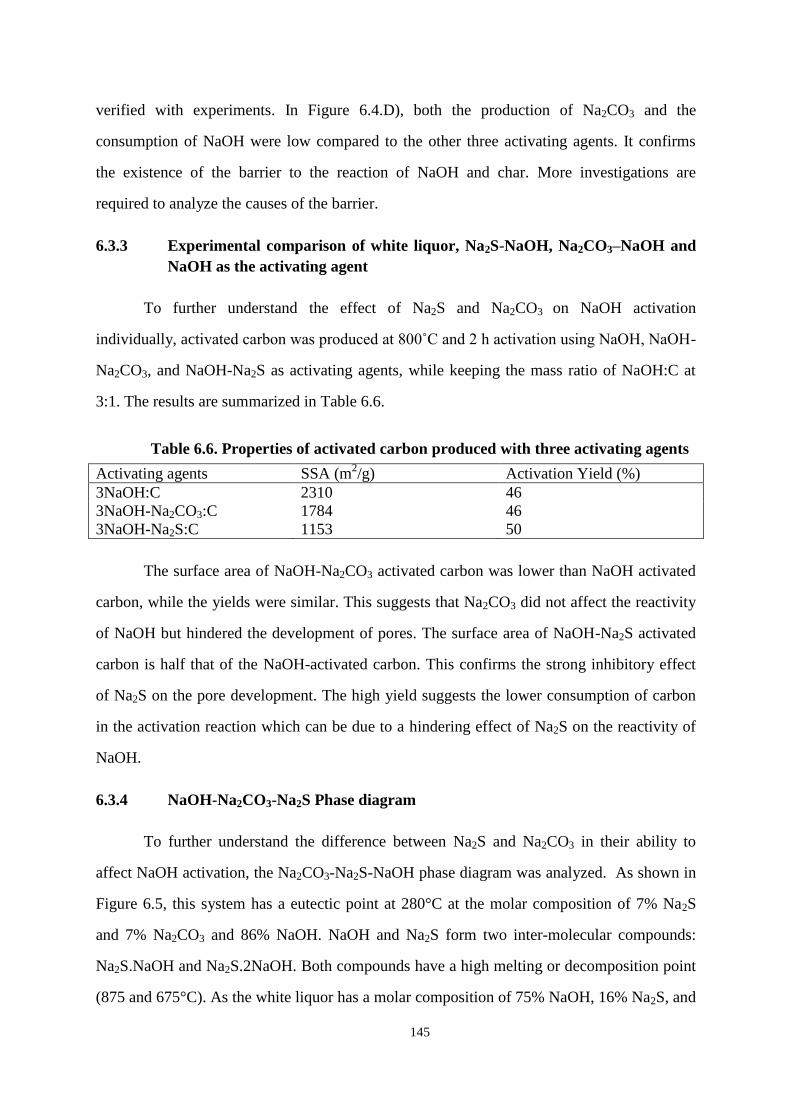
145
verified with experiments. In Figure 6.4.D), both the production of Na2CO3 and the
consumption of NaOH were low compared to the other three activating agents. It confirms
the existence of the barrier to the reaction of NaOH and char. More investigations are
required to analyze the causes of the barrier.
6.3.3 Experimental comparison of white liquor, Na2S-NaOH, Na2CO3–NaOH and
NaOH as the activating agent
To further understand the effect of Na2S and Na2CO3 on NaOH activation
individually, activated carbon was produced at 800˚C and 2 h activation using NaOH, NaOH-
Na2CO3, and NaOH-Na2S as activating agents, while keeping the mass ratio of NaOH:C at
3:1. The results are summarized in Table 6.6.
Table 6.6. Properties of activated carbon produced with three activating agents
Activating agents SSA (m2/g) Activation Yield (%)
3NaOH:C 2310 46
3NaOH-Na2CO3:C 1784 46
3NaOH-Na2S:C 1153 50
The surface area of NaOH-Na2CO3 activated carbon was lower than NaOH activated
carbon, while the yields were similar. This suggests that Na2CO3 did not affect the reactivity
of NaOH but hindered the development of pores. The surface area of NaOH-Na2S activated
carbon is half that of the NaOH-activated carbon. This confirms the strong inhibitory effect
of Na2S on the pore development. The high yield suggests the lower consumption of carbon
in the activation reaction which can be due to a hindering effect of Na2S on the reactivity of
NaOH.
6.3.4 NaOH-Na2CO3-Na2S Phase diagram
To further understand the difference between Na2S and Na2CO3 in their ability to
affect NaOH activation, the Na2CO3-Na2S-NaOH phase diagram was analyzed. As shown in
Figure 6.5, this system has a eutectic point at 280°C at the molar composition of 7% Na2S
and 7% Na2CO3 and 86% NaOH. NaOH and Na2S form two inter-molecular compounds:
Na2S.NaOH and Na2S.2NaOH. Both compounds have a high melting or decomposition point
(875 and 675°C). As the white liquor has a molar composition of 75% NaOH, 16% Na2S, and
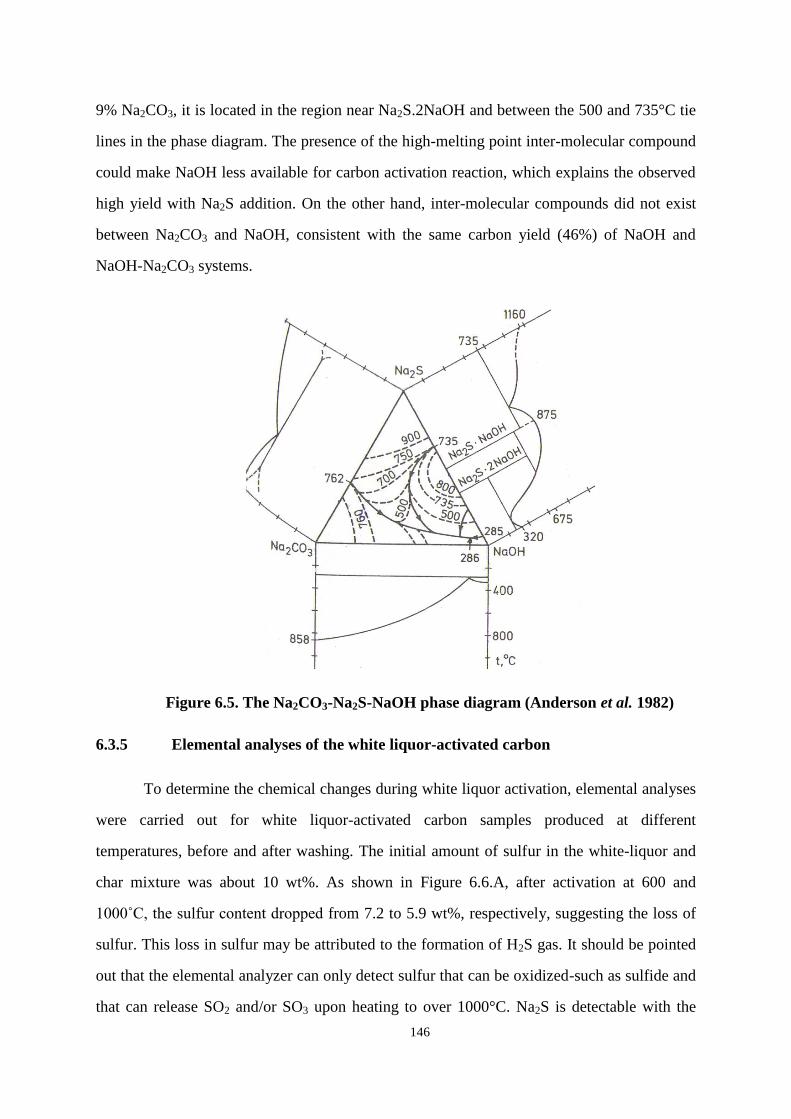
146
9% Na2CO3, it is located in the region near Na2S.2NaOH and between the 500 and 735°C tie
lines in the phase diagram. The presence of the high-melting point inter-molecular compound
could make NaOH less available for carbon activation reaction, which explains the observed
high yield with Na2S addition. On the other hand, inter-molecular compounds did not exist
between Na2CO3 and NaOH, consistent with the same carbon yield (46%) of NaOH and
NaOH-Na2CO3 systems.
Figure 6.5. The Na2CO3-Na2S-NaOH phase diagram (Anderson et al. 1982)
6.3.5 Elemental analyses of the white liquor-activated carbon
To determine the chemical changes during white liquor activation, elemental analyses
were carried out for white liquor-activated carbon samples produced at different
temperatures, before and after washing. The initial amount of sulfur in the white-liquor and
char mixture was about 10 wt%. As shown in Figure 6.6.A, after activation at 600 and
1000˚C, the sulfur content dropped from 7.2 to 5.9 wt%, respectively, suggesting the loss of
sulfur. This loss in sulfur may be attributed to the formation of H2S gas. It should be pointed
out that the elemental analyzer can only detect sulfur that can be oxidized-such as sulfide and
that can release SO2 and/or SO3 upon heating to over 1000°C. Na2S is detectable with the
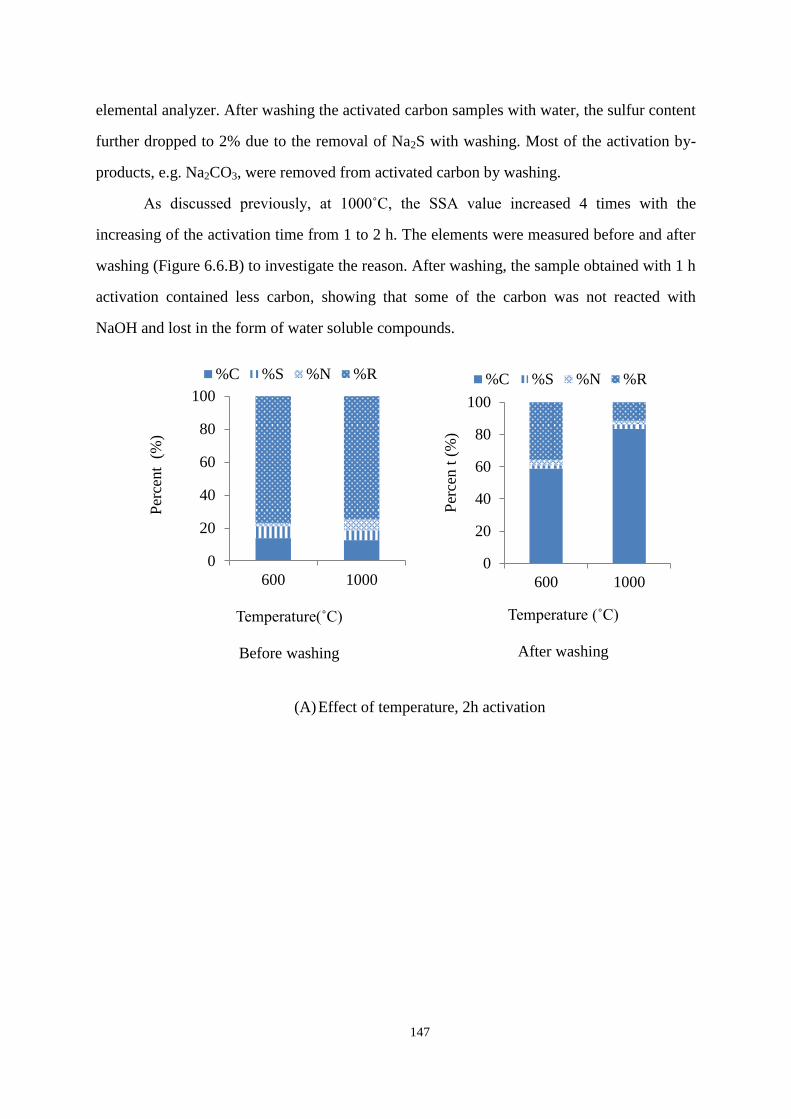
147
elemental analyzer. After washing the activated carbon samples with water, the sulfur content
further dropped to 2% due to the removal of Na2S with washing. Most of the activation by-
products, e.g. Na2CO3, were removed from activated carbon by washing.
As discussed previously, at 1000˚C, the SSA value increased 4 times with the
increasing of the activation time from 1 to 2 h. The elements were measured before and after
washing (Figure 6.6.B) to investigate the reason. After washing, the sample obtained with 1 h
activation contained less carbon, showing that some of the carbon was not reacted with
NaOH and lost in the form of water soluble compounds.
(A) Effect of temperature, 2h activation
0
20
40
60
80
100
600 1000
Per
cent
(%
)
Temperature ˚C)
Before washing
%C %S %N %R
0
20
40
60
80
100
600 1000
Per
cen t
(%
)
Temperature ˚C)
After washing
%C %S %N %R
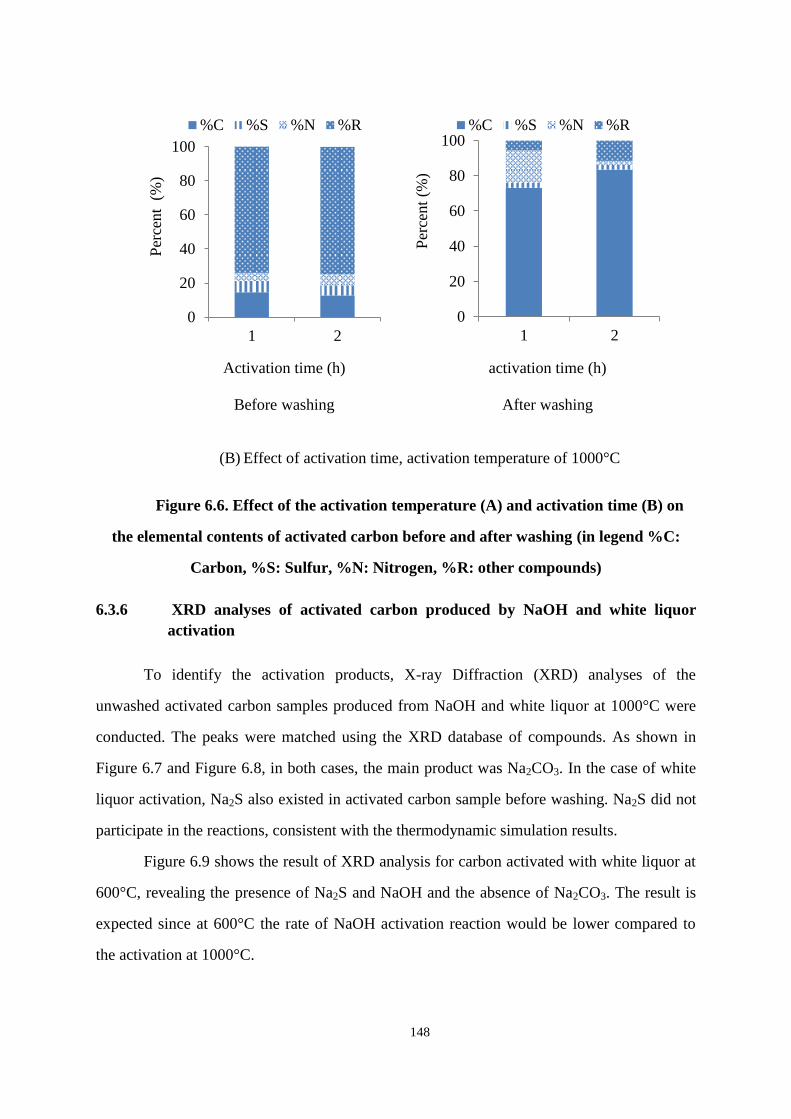
148
(B) Effect of activation time, activation temperature of 1000°C
Figure 6.6. Effect of the activation temperature (A) and activation time (B) on
the elemental contents of activated carbon before and after washing (in legend %C:
Carbon, %S: Sulfur, %N: Nitrogen, %R: other compounds)
6.3.6 XRD analyses of activated carbon produced by NaOH and white liquor
activation
To identify the activation products, X-ray Diffraction (XRD) analyses of the
unwashed activated carbon samples produced from NaOH and white liquor at 1000°C were
conducted. The peaks were matched using the XRD database of compounds. As shown in
Figure 6.7 and Figure 6.8, in both cases, the main product was Na2CO3. In the case of white
liquor activation, Na2S also existed in activated carbon sample before washing. Na2S did not
participate in the reactions, consistent with the thermodynamic simulation results.
Figure 6.9 shows the result of XRD analysis for carbon activated with white liquor at
600°C, revealing the presence of Na2S and NaOH and the absence of Na2CO3. The result is
expected since at 600°C the rate of NaOH activation reaction would be lower compared to
the activation at 1000°C.
0
20
40
60
80
100
1 2
Per
cent
(%
)
Activation time (h)
Before washing
%C %S %N %R
0
20
40
60
80
100
1 2
Per
cent
(%)
activation time (h)
After washing
%C %S %N %R
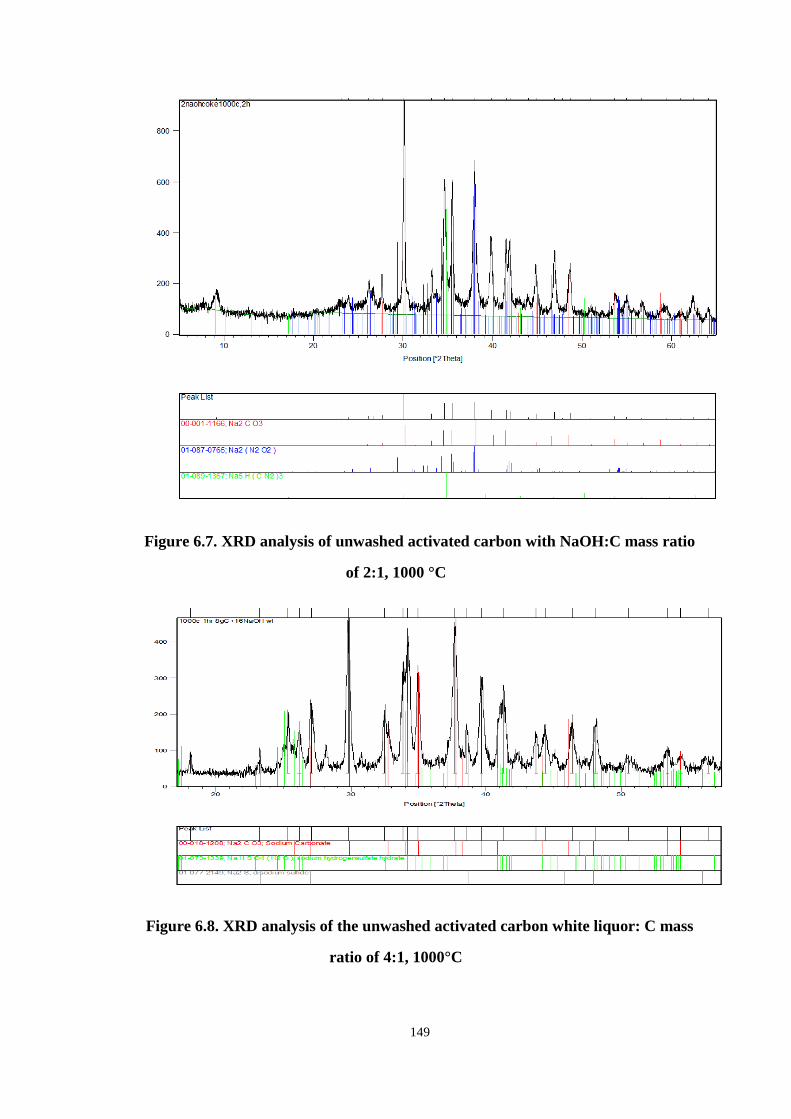
149
Figure 6.7. XRD analysis of unwashed activated carbon with NaOH:C mass ratio
of 2:1, 1000 °C
Figure 6.8. XRD analysis of the unwashed activated carbon white liquor: C mass
ratio of 4:1, 1000°C
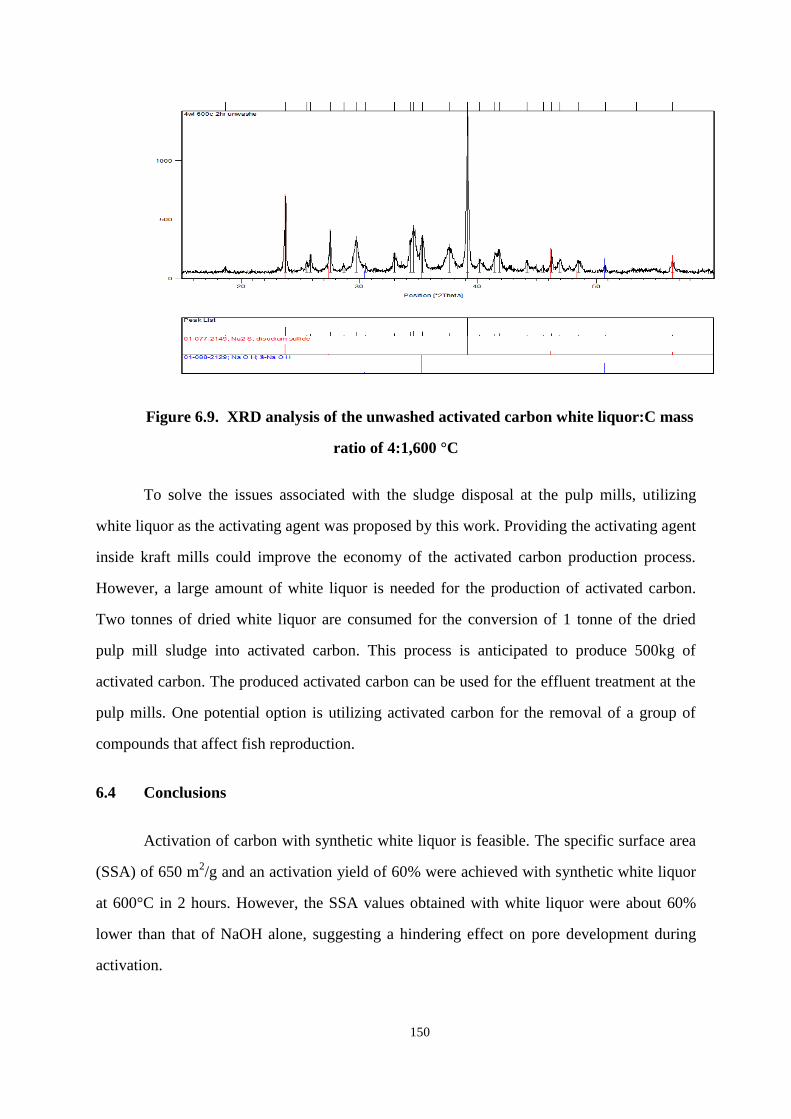
150
Figure 6.9. XRD analysis of the unwashed activated carbon white liquor:C mass
ratio of 4:1,600 °C
To solve the issues associated with the sludge disposal at the pulp mills, utilizing
white liquor as the activating agent was proposed by this work. Providing the activating agent
inside kraft mills could improve the economy of the activated carbon production process.
However, a large amount of white liquor is needed for the production of activated carbon.
Two tonnes of dried white liquor are consumed for the conversion of 1 tonne of the dried
pulp mill sludge into activated carbon. This process is anticipated to produce 500kg of
activated carbon. The produced activated carbon can be used for the effluent treatment at the
pulp mills. One potential option is utilizing activated carbon for the removal of a group of
compounds that affect fish reproduction.
6.4 Conclusions
Activation of carbon with synthetic white liquor is feasible. The specific surface area
(SSA) of 650 m2/g and an activation yield of 60% were achieved with synthetic white liquor
at 600°C in 2 hours. However, the SSA values obtained with white liquor were about 60%
lower than that of NaOH alone, suggesting a hindering effect on pore development during
activation.
151
Thermodynamic simulations showed that sodium sulfide and sodium carbonate could
hinder the porosity development. Under the activation conditions, sodium sulfide was inert
and unable to participate in reactions with carbon based on thermodynamic simulations. Its
presence in white liquor would make NaOH less available to the activation reaction with
carbon. Sodium sulfide can form two inter-molecular compounds with NaOH, which have a
melting or decomposition point of 675 and 875°C. Consequently, these compounds could
make NaOH less reactive and less available for the activation reaction with carbon.
While being a key component of white liquor, Na2CO3 is also a main product of
NaOH activation. Its presence in white liquor could affect equilibrium and hindered the
development of pore during NaOH activation. Na2CO3 may become reactive with carbon
when the temperature is over 1000˚C.
XRD analyses confirmed the presence of both Na2CO3 and Na2S in carbons activated
at 1000°C with white liquor as the activating agent. At 600°C, the rate of the NaOH
activation reaction would be too low to produce Na2CO3.
152
7 Feasibility Study of Utilizing Pulp Mill Sludge-derived Activated
Carbon to Remediate the Effect of Effluent on Fish Reproduction
Abstract
It is known that a group of unidentified organic compounds in some pulp mill
effluents affect fish reproduction. Towards the development of a remediation strategy, this
work was conducted to determine the effectiveness of pulp mill sludge-derived activated
carbon in removing the effluents' effect on fathead minnow egg production and to compare
the efficiency with a commercial activated carbon. Chemical activation with KOH was able
to convert a set of pulp mill sludges into activated carbon that has physical characteristics
similar to the commercial activated carbon. After treatment with activated carbon, effluent
samples were analyzed using gas chromatography to estimate their total organic content. The
NKS-activated carbon was particularly effective in removing dissolved organics by
approximately 35% compared to the other produced activated carbon. A commercial
activated carbon was used in trials to assess potential remediation strategies. Five-day
reproduction tests on fathead minnows revealed that effluent treatment in a fixed bed reactor
with a contact time of 0.54 minutes and a dosage not less than 5 g/L was sufficient to
eliminate effects on fish reproduction tested by the short term assay. Therefore, the use of
sludge-derived activated carbon is a technically feasible means to eliminate effluent effects
on fish.
7.1 Introduction
It is well established that some unidentified chemicals in the pulp mill effluents affect
fish reproduction (Kovacs et al. 2005; Fentress et al. 2006; Hewitt et al. 2008; Hall et al.
2009). The fish reproduction disruption has been reported in several pulp mills around the
world (Hewitt et al. 2008; Chiang et al. 2010). In Canada, the regulatory Environmental
Effects Monitoring (EEM) program showed that some pulp mill effluents have the potential
to cause metabolic disruption in fish as evidenced by reducing gonad size, and increasing
liver size (Lowell et al. 2003; Fox 2001; Kovacs et al. 2007). Several biological tests have
153
been applied by various research groups, which have led to questions about characteristics of
these compounds and their sources Dub Maclatchy 2001; ickwood et al. 2006).
A remediation strategy to solve this problem has not been developed yet, mainly due
to the lack of knowledge about the responsible compounds and their sources as well as the
absence of a cost-effective way to remove the adverse effects of these compounds (Milestone
et al. 2012). The investigation for causative agents has been focused on the pulp mill effluent
composition and manufacturing processes through monitoring effluent quality at the mills in
Canada (Hall et al. 2009; Kovacs et al. 2010).
Kovacs et al. (2011) showed that the gas chromatography (GC) index of an effluent
is a representative of total organic content of effluent and it is correlated to the effect of
effluent on fathead minnow egg production. The effluent monitoring studies showed that the
total content of solvent-extractable organics in the pulp mill effluent is linked to the level of
adverse effect on fish reproduction using a laboratory assay (Kovacs et al. 2011). The
effluent’s effect on fish reproduction varies from one mill to another. It is caused by the
effluent total amount of organics and is not related to the manufacturing and biotreatment
process at the mills. The effect of the effluent on fish reproduction was positively correlated
to total organic content as measured by biochemical oxygen demand (BOD) and the sum of
GC peak areas of solvent-extracted effluents (Kovacs et al. 2011; Martel et al. 2011).
Kovacs et al. (2011) analyzed the effect of seven mills effluent exposure to fathead
minnows. Their investigation indicated that four of the effluents did not significantly affect
fish reproduction while others lowered or stopped fish reproduction. Total organic content
and BOD level (< 20 mg/L) in the effluent were used as indicators of the effluent quality.
Total organic content can be indicated with the GC index. Interestingly, fish reproduction
disruption was reversible by improving the effluents quality (Kovacs et al. 2011).
Activated carbon is widely used to remove organics and bioactive compounds from
water (Tanghe & Verstraete 2001; Asada et al. 2004; Choi et al. 2005; Fukuhara et al. 2006).
Activated carbon from delayed petroleum coke removed higher than 90% of chlorinated
154
organic and color compounds from bleached pulp mill effluent. Pore size distribution, surface
chemistry, and ash content are the most important factors related to the extent of adsorption
of organic compounds (Shawwa et al. 2001). The adsorption capacity depends on the
accessibility of the organic molecules to carbon surface and their size (Ren et al. 2007).
Although the exact compositions of compounds that disrupt fish reproduction are not
identified, adsorption by activated carbon seems to be an effective method of removing them
from final effluents.
Pulp mills produce 40-50 kg of dry sludge per ton of pulp production (Monte et al.
2009). Managing the sludge disposal is costly and environmentally challenging. Conversion
of pulp mill sludge into activated carbon for organic removal from pulp-mill effluents could
be beneficial (Hojamberdiev et al. 2008). Currently the sludge is simply being burned or
landfilled and such practices can cause environmental problems and greenhouse gas
emissions (GHGs) (Monte et al. 2009). One potential alternative is using the pulp mill sludge
for production of activated carbon, which could then be used as an adsorbent at the pulp
mills. The feasibility of activated carbon production from pulp mill sludge has been studied
in the past, along with the effect of operating conditions on the surface area of the produced
activated carbon (Namazi et al. 2010).
The objective of this work is to determine the effectiveness of pulp mill sludge-
derived activated carbon in removing pulp mill effluent compounds that affect fish
reproduction. The activated carbon was produced from various pulp mill sludges under
optimized conditions at University of Toronto. The sludge-derived carbon and a commercial
activated carbon were evaluated for their ability to remove dissolved organics from pulp mill
effluent at Forest Product Innovations (FPInnovations). Fathead minnow egg production tests
were conducted with effluents treated with the commercial activated carbon to determine the
feasibility of eliminating the disruptive effect of effluent on fish reproduction.
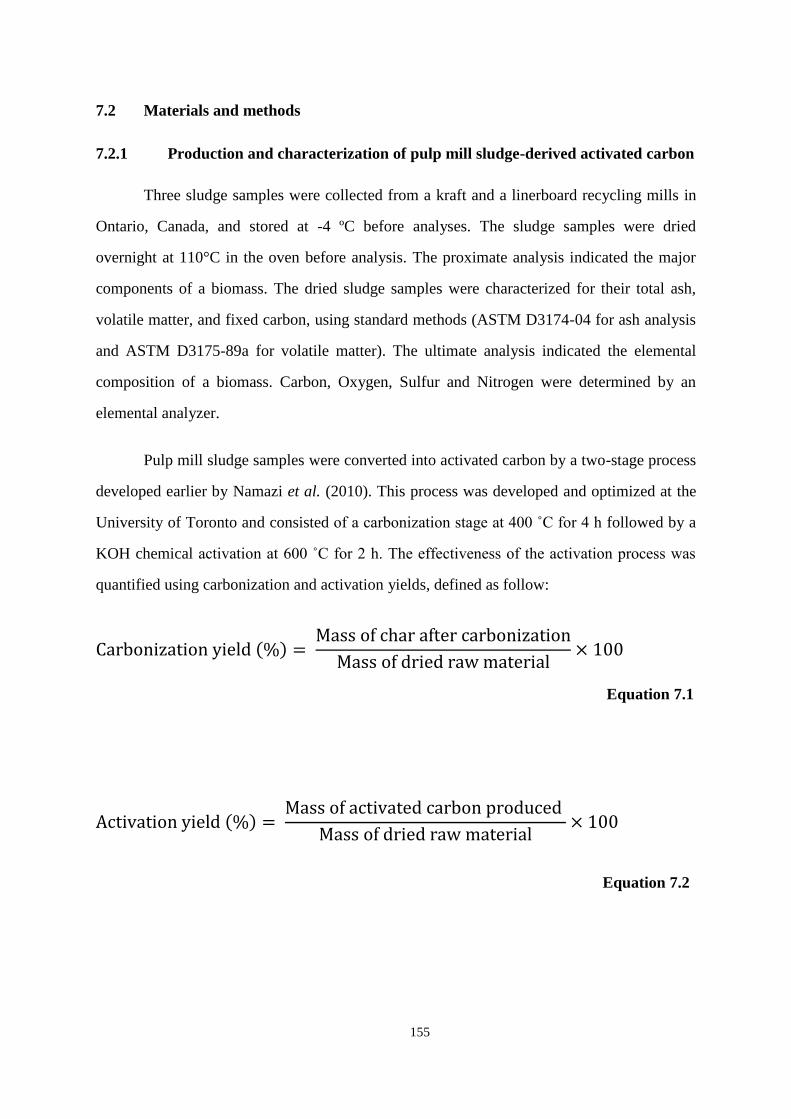
155
7.2 Materials and methods
7.2.1 Production and characterization of pulp mill sludge-derived activated carbon
Three sludge samples were collected from a kraft and a linerboard recycling mills in
Ontario, Canada, and stored at -4 ºC before analyses. The sludge samples were dried
overnight at 110°C in the oven before analysis. The proximate analysis indicated the major
components of a biomass. The dried sludge samples were characterized for their total ash,
volatile matter, and fixed carbon, using standard methods (ASTM D3174-04 for ash analysis
and ASTM D3175-89a for volatile matter). The ultimate analysis indicated the elemental
composition of a biomass. Carbon, Oxygen, Sulfur and Nitrogen were determined by an
elemental analyzer.
Pulp mill sludge samples were converted into activated carbon by a two-stage process
developed earlier by Namazi et al. (2010). This process was developed and optimized at the
University of Toronto and consisted of a carbonization stage at 400 ˚C for 4 h followed by a
KOH chemical activation at 600 ˚C for 2 h. The effectiveness of the activation process was
quantified using carbonization and activation yields, defined as follow:
Equation 7.1
Equation 7.2
156
The produced activated carbon was characterized for specific surface area (SSA) and
porosity using nitrogen adsorption isotherm data obtained with a surface analyzer
(AUTOSORB 1). The samples were degassed at 200 ºC for 2 h prior to the measurements.
The Brauner, Emmett and Teller (BET) and Barrett, Joyner and Halenda (BJH) methods were
used for surface area and pore size distribution measurements, respectively (Brunauer et al.
1938).
7.2.2 Adsorption of organic compounds from effluent by sludge-derived activated
carbon
The potential of sludge-derived activated carbon in removal of the effluent
compounds that affect fish was tested by batch adsorption experiments. The experiments
were conducted by adding 0.1 g of the activated carbon to 100 mL effluent under well-mixed
conditions in a shaker with 120 rpm for 17 h at 30 C. The organic removal from pulp mill
effluent was tested using three types of sludge-derived activated carbon along with a
commercial activated carbon derived from coconut shell. The activated carbon particle size
was less than 200 µm. Treated effluent samples were prepared for quantification of total
dissolved organics using GC analysis.
7.2.2.1 Quantification of dissolved organics in effluents
Dissolved organics in the effluent samples were concentrated by liquid-liquid
extraction to prepare them for GC analyses. 250 mL treated effluent was transferred to a
separatory flask. One hundred mL methyl tert-butyl ether (MTBE-Fisher Scientific Canada)
and an internal standard consisting of heneicosanoic acid (C21) and tricosanoic acid methyl
ester (C23) as a methylation surrogate were added to the separatory flasks. After shaking for
two minutes, the solvent was separated in a round bottom flask and the extraction was
repeated. The solvent was removed by rotary evaporation at 30 °C under vacuum of 45
mmHg, and flasks containing the extractives were further dried in nitrogen stream to a final
volume of 2 mL and transferred to a conical vial. Finally, the extract was evaporated under a
nitrogen stream to a final volume of approximately 1.5 mL (Ankley et al. 2009).
157
7.2.2.2 Gas chromatography (GC) analyses of extracted organics
The organic extract from the samples including activated carbon treated samples, raw
effluent, and control samples were analyzed by the GC. The GC used in this work was
Hewlett Packard 6890+ GC with 5973 Mass Selective Detector. A sample of 1 µL was
injected into the GC under the following conditions. The inlet temperature was 250 oC Inlet,
splitless. The oven condition was 45 oC hold for 10 min, increased 5
oC/min to 290
oC hold
for 20 min, 1.3 mL/min flow, and MS detector (HP 5973) in TIC mode 40-610 m/z. The
peaks in each chromatogram were integrated and normalized based on the peak area of C21
standard for analyses.
The GC index does not provide information about individual compounds, but instead
provides a useful measure of total compounds in the effluent that were detectable by GC. The
total peak area of the chromatogram of each effluent was determined for the purpose of
developing a relative estimate of total extractable organic content or the GC index. The total
peak area of the raw effluent, which had the highest peak area, was assigned a GC index
value of one, while other samples’ GC indices were calculated in relation to that.
Equation 7.3
Equation 7.4
7.2.3 Fish reproduction tests with activated carbon-treated effluents
Bio-treated effluent samples of 2000 L were collected from a thermo-mechanical
pulp mill on two different dates and sent for testing the day after sampling. The effluent
samples were screened using 210 μm mesh and stored at 4 °C. The effluent samples were
labled “effluent I” and “effluent II” and their characteristics are summarized in Table 7.1.
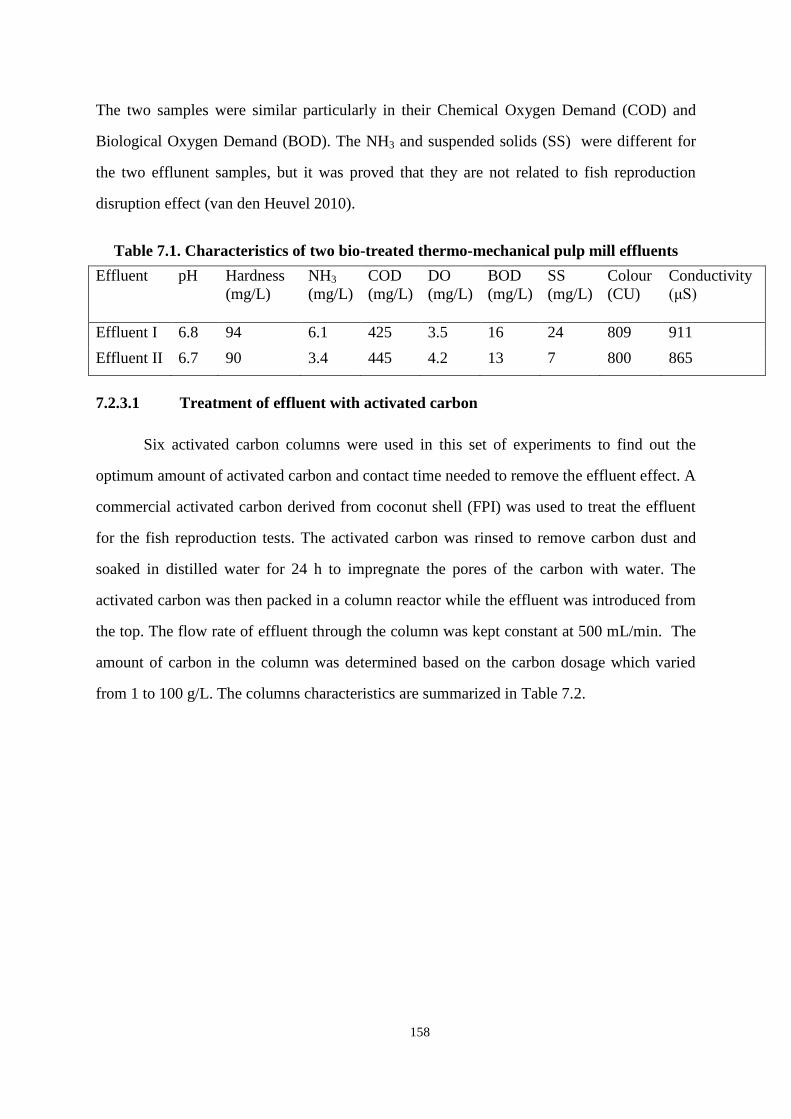
158
The two samples were similar particularly in their Chemical Oxygen Demand (COD) and
Biological Oxygen Demand (BOD). The NH3 and suspended solids (SS) were different for
the two efflunent samples, but it was proved that they are not related to fish reproduction
disruption effect (van den Heuvel 2010).
Table 7.1. Characteristics of two bio-treated thermo-mechanical pulp mill effluents
Effluent pH Hardness
(mg/L)
NH3
(mg/L)
COD
(mg/L)
DO
(mg/L)
BOD
(mg/L)
SS
(mg/L)
Colour
(CU)
Conductivity
μS)
Effluent I 6.8 94 6.1 425 3.5 16 24 809 911
Effluent II 6.7 90 3.4 445 4.2 13 7 800 865
7.2.3.1 Treatment of effluent with activated carbon
Six activated carbon columns were used in this set of experiments to find out the
optimum amount of activated carbon and contact time needed to remove the effluent effect. A
commercial activated carbon derived from coconut shell (FPI) was used to treat the effluent
for the fish reproduction tests. The activated carbon was rinsed to remove carbon dust and
soaked in distilled water for 24 h to impregnate the pores of the carbon with water. The
activated carbon was then packed in a column reactor while the effluent was introduced from
the top. The flow rate of effluent through the column was kept constant at 500 mL/min. The
amount of carbon in the column was determined based on the carbon dosage which varied
from 1 to 100 g/L. The columns characteristics are summarized in Table 7.2.
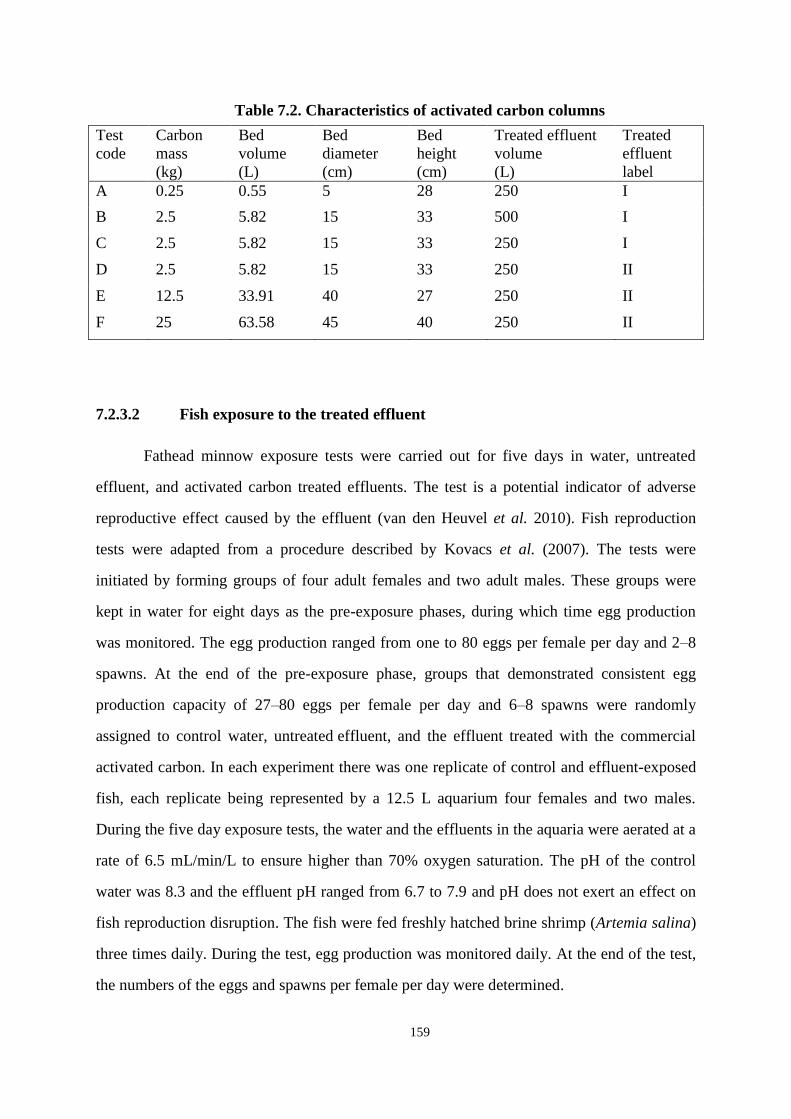
159
Table 7.2. Characteristics of activated carbon columns
Test
code
Carbon
mass
(kg)
Bed
volume
(L)
Bed
diameter
(cm)
Bed
height
(cm)
Treated effluent
volume
(L)
Treated
effluent
label
A 0.25 0.55 5 28 250 I
B 2.5 5.82 15 33 500 I
C 2.5 5.82 15 33 250 I
D 2.5 5.82 15 33 250 II
E 12.5 33.91 40 27 250 II
F 25 63.58 45 40 250 II
7.2.3.2 Fish exposure to the treated effluent
Fathead minnow exposure tests were carried out for five days in water, untreated
effluent, and activated carbon treated effluents. The test is a potential indicator of adverse
reproductive effect caused by the effluent (van den Heuvel et al. 2010). Fish reproduction
tests were adapted from a procedure described by Kovacs et al. (2007). The tests were
initiated by forming groups of four adult females and two adult males. These groups were
kept in water for eight days as the pre-exposure phases, during which time egg production
was monitored. The egg production ranged from one to 80 eggs per female per day and 2–8
spawns. At the end of the pre-exposure phase, groups that demonstrated consistent egg
production capacity of 27–80 eggs per female per day and 6–8 spawns were randomly
assigned to control water, untreated effluent, and the effluent treated with the commercial
activated carbon. In each experiment there was one replicate of control and effluent-exposed
fish, each replicate being represented by a 12.5 L aquarium four females and two males.
During the five day exposure tests, the water and the effluents in the aquaria were aerated at a
rate of 6.5 mL/min/L to ensure higher than 70% oxygen saturation. The pH of the control
water was 8.3 and the effluent pH ranged from 6.7 to 7.9 and pH does not exert an effect on
fish reproduction disruption. The fish were fed freshly hatched brine shrimp (Artemia salina)
three times daily. During the test, egg production was monitored daily. At the end of the test,
the numbers of the eggs and spawns per female per day were determined.
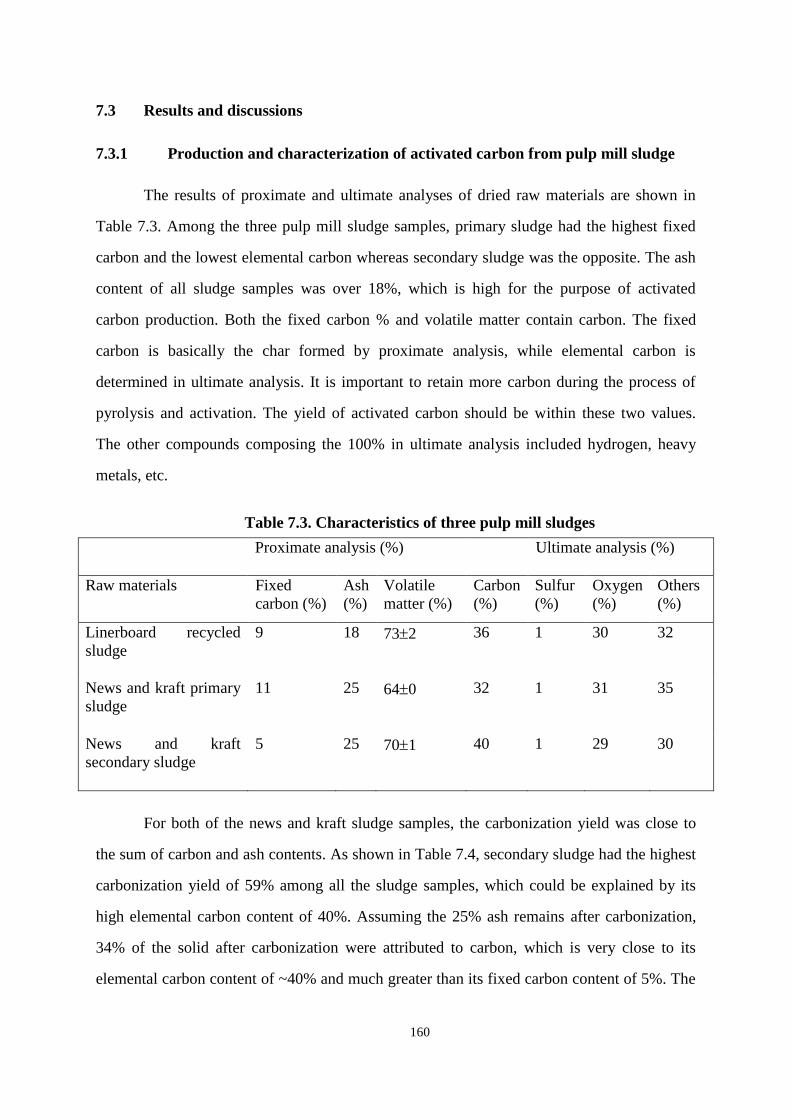
160
7.3 Results and discussions
7.3.1 Production and characterization of activated carbon from pulp mill sludge
The results of proximate and ultimate analyses of dried raw materials are shown in
Table 7.3. Among the three pulp mill sludge samples, primary sludge had the highest fixed
carbon and the lowest elemental carbon whereas secondary sludge was the opposite. The ash
content of all sludge samples was over 18%, which is high for the purpose of activated
carbon production. Both the fixed carbon % and volatile matter contain carbon. The fixed
carbon is basically the char formed by proximate analysis, while elemental carbon is
determined in ultimate analysis. It is important to retain more carbon during the process of
pyrolysis and activation. The yield of activated carbon should be within these two values.
The other compounds composing the 100% in ultimate analysis included hydrogen, heavy
metals, etc.
Table 7.3. Characteristics of three pulp mill sludges
Proximate analysis (%) Ultimate analysis (%)
Raw materials Fixed
carbon (%)
Ash
(%)
Volatile
matter (%)
Carbon
(%)
Sulfur
(%)
Oxygen
(%)
Others
(%)
Linerboard recycled
sludge
9 18 732 36 1 30 32
News and kraft primary
sludge
11 25 640 32 1 31 35
News and kraft
secondary sludge
5 25 701 40 1 29 30
For both of the news and kraft sludge samples, the carbonization yield was close to
the sum of carbon and ash contents. As shown in Table 7.4, secondary sludge had the highest
carbonization yield of 59% among all the sludge samples, which could be explained by its
high elemental carbon content of 40%. Assuming the 25% ash remains after carbonization,
34% of the solid after carbonization were attributed to carbon, which is very close to its
elemental carbon content of ~40% and much greater than its fixed carbon content of 5%. The
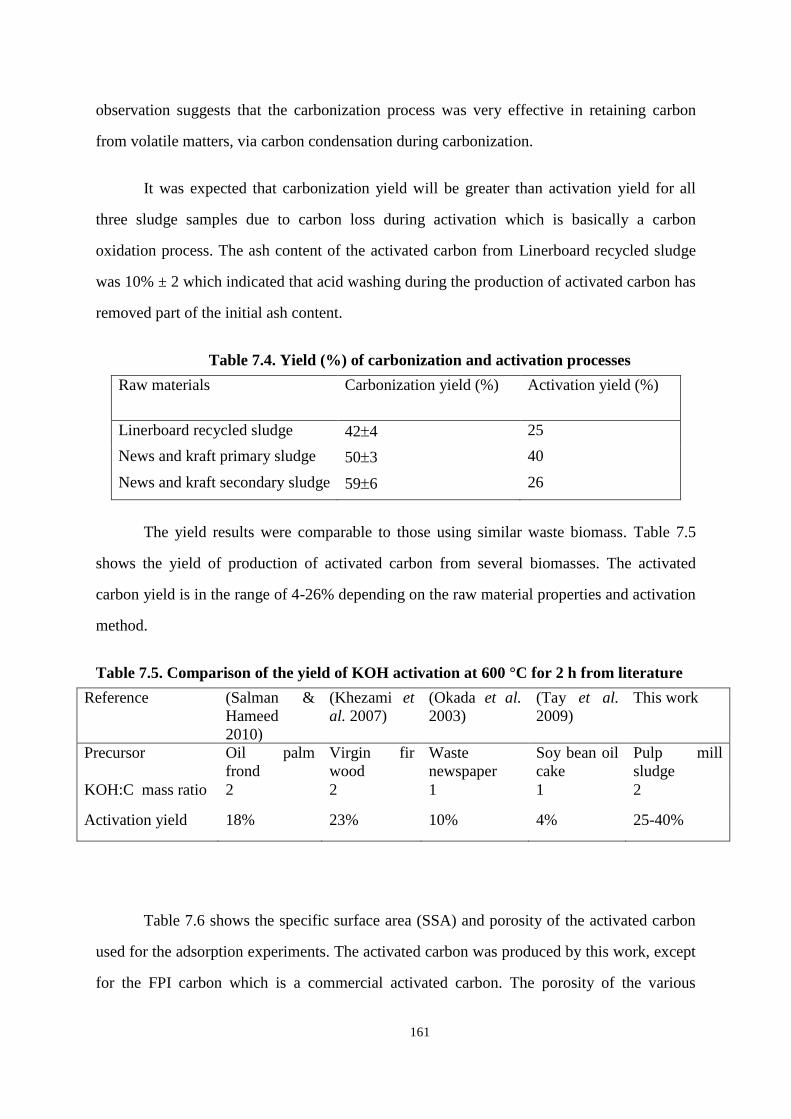
161
observation suggests that the carbonization process was very effective in retaining carbon
from volatile matters, via carbon condensation during carbonization.
It was expected that carbonization yield will be greater than activation yield for all
three sludge samples due to carbon loss during activation which is basically a carbon
oxidation process. The ash content of the activated carbon from Linerboard recycled sludge
was 10% ± 2 which indicated that acid washing during the production of activated carbon has
removed part of the initial ash content.
Table 7.4. Yield (%) of carbonization and activation processes
Raw materials Carbonization yield (%) Activation yield (%)
Linerboard recycled sludge 424 25
News and kraft primary sludge 503 40
News and kraft secondary sludge 596 26
The yield results were comparable to those using similar waste biomass. Table 7.5
shows the yield of production of activated carbon from several biomasses. The activated
carbon yield is in the range of 4-26% depending on the raw material properties and activation
method.
Table 7.5. Comparison of the yield of KOH activation at 600 °C for 2 h from literature
Reference (Salman &
Hameed
2010)
(Khezami et
al. 2007)
(Okada et al.
2003)
(Tay et al.
2009)
This work
Precursor Oil palm
frond
Virgin fir
wood
Waste
newspaper
Soy bean oil
cake
Pulp mill
sludge
KOH:C mass ratio 2 2 1 1 2
Activation yield 18% 23% 10% 4% 25-40%
Table 7.6 shows the specific surface area (SSA) and porosity of the activated carbon
used for the adsorption experiments. The activated carbon was produced by this work, except
for the FPI carbon which is a commercial activated carbon. The porosity of the various
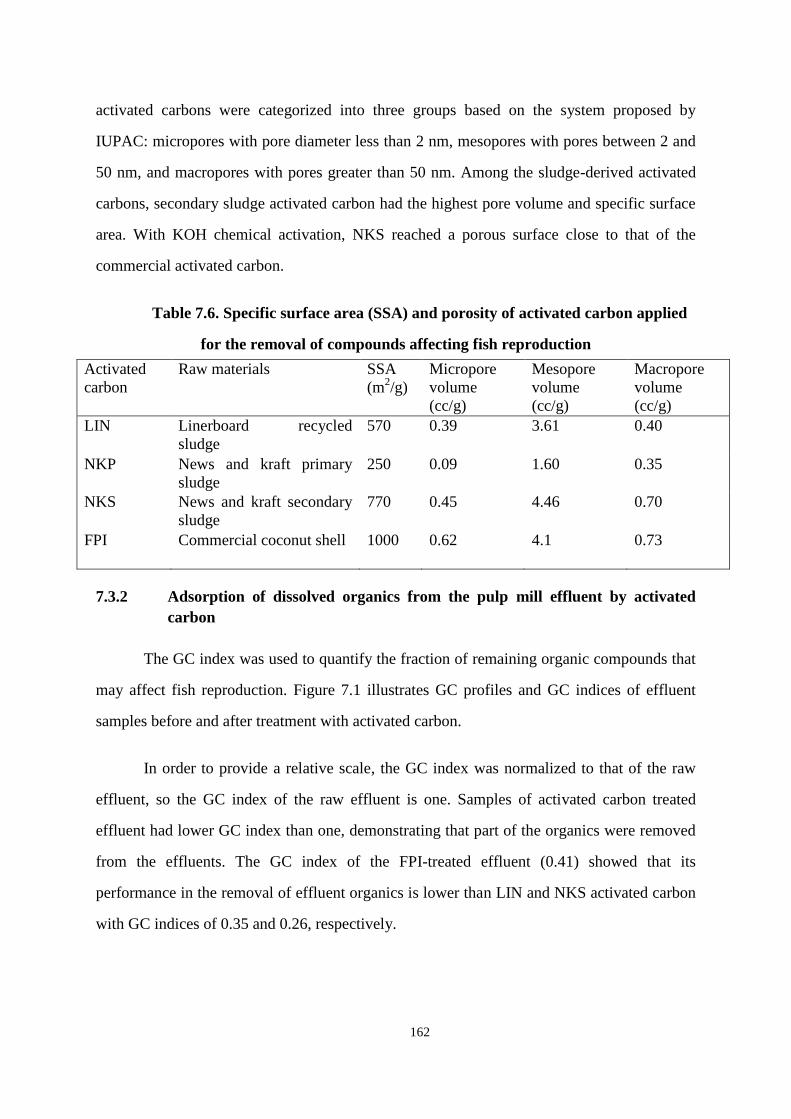
162
activated carbons were categorized into three groups based on the system proposed by
IUPAC: micropores with pore diameter less than 2 nm, mesopores with pores between 2 and
50 nm, and macropores with pores greater than 50 nm. Among the sludge-derived activated
carbons, secondary sludge activated carbon had the highest pore volume and specific surface
area. With KOH chemical activation, NKS reached a porous surface close to that of the
commercial activated carbon.
Table 7.6. Specific surface area (SSA) and porosity of activated carbon applied
for the removal of compounds affecting fish reproduction
Activated
carbon
Raw materials SSA
(m2/g)
Micropore
volume
(cc/g)
Mesopore
volume
(cc/g)
Macropore
volume
(cc/g)
LIN Linerboard recycled
sludge
570 0.39 3.61 0.40
NKP News and kraft primary
sludge
250 0.09 1.60 0.35
NKS News and kraft secondary
sludge
770 0.45 4.46 0.70
FPI Commercial coconut shell 1000 0.62 4.1 0.73
7.3.2 Adsorption of dissolved organics from the pulp mill effluent by activated
carbon
The GC index was used to quantify the fraction of remaining organic compounds that
may affect fish reproduction. Figure 7.1 illustrates GC profiles and GC indices of effluent
samples before and after treatment with activated carbon.
In order to provide a relative scale, the GC index was normalized to that of the raw
effluent, so the GC index of the raw effluent is one. Samples of activated carbon treated
effluent had lower GC index than one, demonstrating that part of the organics were removed
from the effluents. The GC index of the FPI-treated effluent (0.41) showed that its
performance in the removal of effluent organics is lower than LIN and NKS activated carbon
with GC indices of 0.35 and 0.26, respectively.
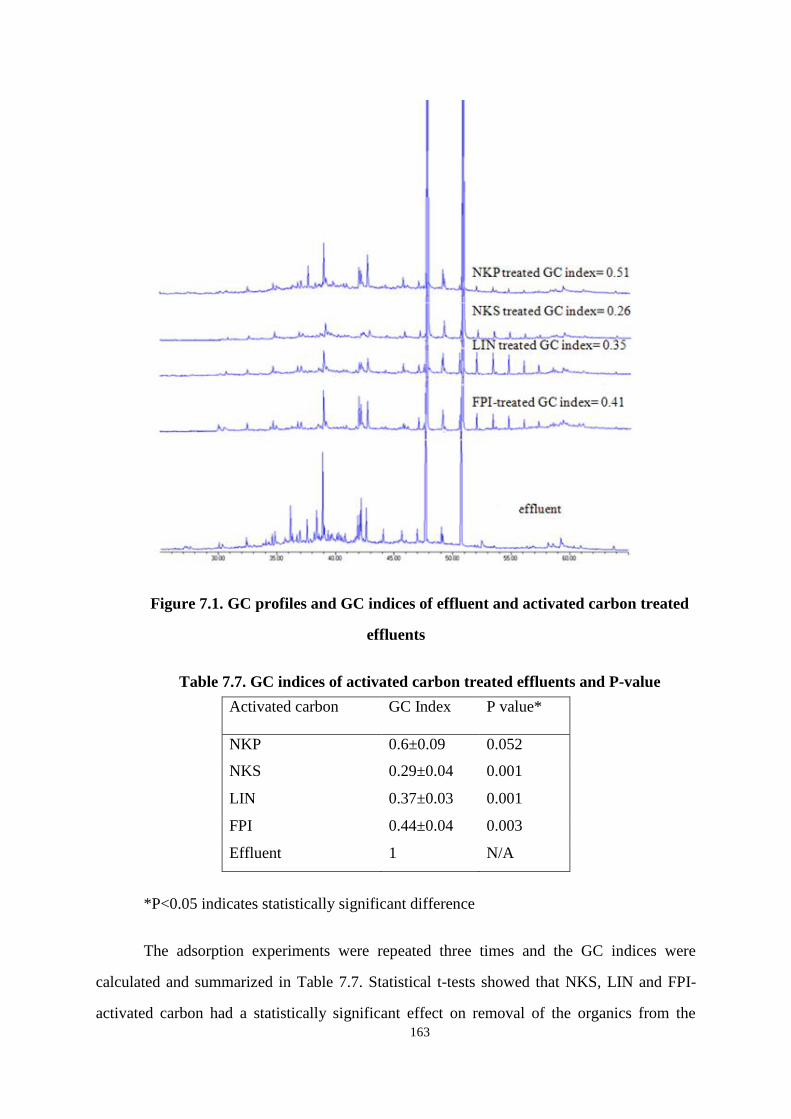
163
Figure 7.1. GC profiles and GC indices of effluent and activated carbon treated
effluents
Table 7.7. GC indices of activated carbon treated effluents and P-value
Activated carbon GC Index P value*
NKP 0.6±0.09 0.052
NKS 0.29±0.04 0.001
LIN 0.37±0.03 0.001
FPI 0.44±0.04 0.003
Effluent 1 N/A
*P<0.05 indicates statistically significant difference
The adsorption experiments were repeated three times and the GC indices were
calculated and summarized in Table 7.7. Statistical t-tests showed that NKS, LIN and FPI-
activated carbon had a statistically significant effect on removal of the organics from the
164
effluent. However NKP (p = 0.052) did not have significant effect probably due to its low
surface area of 250 m2/g. Most of the sludge-derived activated carbon samples were effective
in removing the effluent compounds that were detectable by GC. Surface area played a key
role in determining the effectiveness of organic removal. The NKS was more capable in
removing the effluent compounds than the commercial one, although it had a smaller specific
surface area of 770 m2/g. Since the organic molecules have larger diameters, the high
mesopore and macropore volumes of the secondary sludge activated carbon were expected to
be beneficial in removal of the effluent compounds.
7.3.3 Effect of activated carbon treated effluent on fish reproduction
The fish reproduction tests required large amount of activated carbon which was not
possible to produce in lab scale. Therefore the commercial carbon with similar properties to
the NKS was used for fish reproduction tests. Six fish reproduction tests were conducted with
effluent treated with the commercial activated carbon in a fixed bed reactor. Carbon dosage,
contact time, effluent type, and number of passes through the activated carbon column were
changed for each test.
Table 7.8 shows the conditions of the effluent treatment with various carbon dosages
from 1g/L to 100g/L. The contact time varied from 0.05 to 6 minutes, depending on carbon
dosage and flow rate in the fixed bed reactor. The number of passes through the column
represents the ratio of the treated effluent to the carbon bed volume and shows carbon usage
for treatment of the raw effluent. Test D was a repeat of Test C, but with Effluent II. As
shown in the experimental section, effluents I and II were collected from the same mill on
different dates and had similar properties.
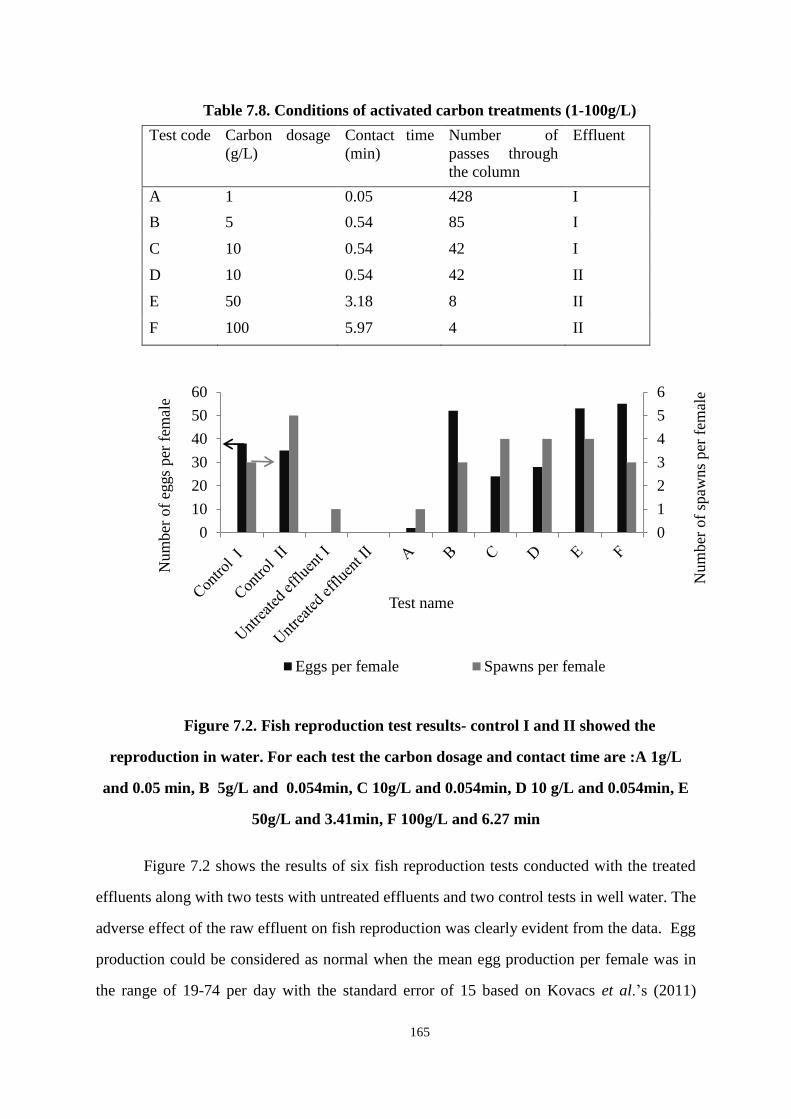
165
Table 7.8. Conditions of activated carbon treatments (1-100g/L)
Test code Carbon dosage
(g/L)
Contact time
(min)
Number of
passes through
the column
Effluent
A 1 0.05 428 I
B 5 0.54 85 I
C 10 0.54 42 I
D 10 0.54 42 II
E 50 3.18 8 II
F 100 5.97 4 II
Figure 7.2. Fish reproduction test results- control I and II showed the
reproduction in water. For each test the carbon dosage and contact time are :A 1g/L
and 0.05 min, B 5g/L and 0.054min, C 10g/L and 0.054min, D 10 g/L and 0.054min, E
50g/L and 3.41min, F 100g/L and 6.27 min
Figure 7.2 shows the results of six fish reproduction tests conducted with the treated
effluents along with two tests with untreated effluents and two control tests in well water. The
adverse effect of the raw effluent on fish reproduction was clearly evident from the data. Egg
production could be considered as normal when the mean egg production per female was in
the range of 19-74 per day with the standard error of 15 based on Kovacs et al.’s (2011)
0
1
2
3
4
5
6
0
10
20
30
40
50
60
Num
ber
of
spaw
ns
per
fem
ale
Num
ber
of
eggs
per
fem
ale
Test name
Eggs per female Spawns per female
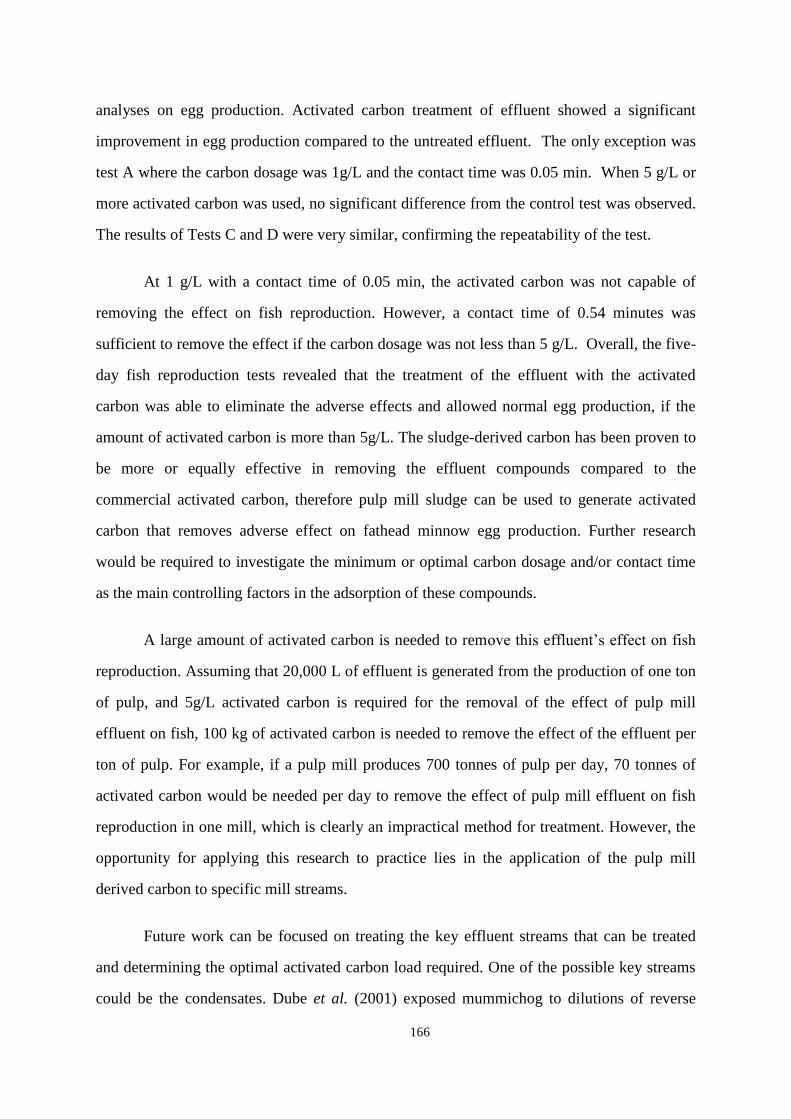
166
analyses on egg production. Activated carbon treatment of effluent showed a significant
improvement in egg production compared to the untreated effluent. The only exception was
test A where the carbon dosage was 1g/L and the contact time was 0.05 min. When 5 g/L or
more activated carbon was used, no significant difference from the control test was observed.
The results of Tests C and D were very similar, confirming the repeatability of the test.
At 1 g/L with a contact time of 0.05 min, the activated carbon was not capable of
removing the effect on fish reproduction. However, a contact time of 0.54 minutes was
sufficient to remove the effect if the carbon dosage was not less than 5 g/L. Overall, the five-
day fish reproduction tests revealed that the treatment of the effluent with the activated
carbon was able to eliminate the adverse effects and allowed normal egg production, if the
amount of activated carbon is more than 5g/L. The sludge-derived carbon has been proven to
be more or equally effective in removing the effluent compounds compared to the
commercial activated carbon, therefore pulp mill sludge can be used to generate activated
carbon that removes adverse effect on fathead minnow egg production. Further research
would be required to investigate the minimum or optimal carbon dosage and/or contact time
as the main controlling factors in the adsorption of these compounds.
A large amount of activated carbon is needed to remove this effluent’s effect on fish
reproduction. Assuming that 20,000 L of effluent is generated from the production of one ton
of pulp, and 5g/L activated carbon is required for the removal of the effect of pulp mill
effluent on fish, 100 kg of activated carbon is needed to remove the effect of the effluent per
ton of pulp. For example, if a pulp mill produces 700 tonnes of pulp per day, 70 tonnes of
activated carbon would be needed per day to remove the effect of pulp mill effluent on fish
reproduction in one mill, which is clearly an impractical method for treatment. However, the
opportunity for applying this research to practice lies in the application of the pulp mill
derived carbon to specific mill streams.
Future work can be focused on treating the key effluent streams that can be treated
and determining the optimal activated carbon load required. One of the possible key streams
could be the condensates. Dube et al. (2001) exposed mummichog to dilutions of reverse
167
osmosis feed and permeate of bleach kraft pulp mill and showed that some condensates
depress plasma testosterone concentrations. The compounds were mainly low molecular
weight phenolics, including phenols and guaiacol. Another valuable subject for research
would be the regeneration of spent activated carbon.
7.4 Conclusions
With KOH chemical activation, pulp mill sludge-derived activated carbons were able
to reach the porosity similar to that of a coconut shell-derived commercial activated carbon.
The sludge-derived activated carbon was effective in removing organics that may
affect fish reproduction. The secondary sludge-derived activated carbon showed the highest
removal of the organics for the batch experiments of 250mL effluent treatment overnight.
Surface area played a key role in determining the effectiveness of the organic removal that
affects fish reproduction.
The secondary sludge-derived activated carbon was comparable to the commercial
one in the removal of the organic compounds, although the commercial carbon had a higher
specific surface area (~1000 m2/g) than the NKS-activated carbon (~770 m
2/g).
The five days fathead minnow reproduction tests revealed that the treatment of
effluent with the activated carbon column was able to eliminate the adverse effect and allow
normal egg production, if a sufficient amount of activated carbon (5g/L) was added.
168
8 Overall Conclusions
This work explored the technical feasibility of producing activated carbon from pulp
mill sludge with microwaves as the energy source and white liquor as the activating agent.
The main conclusions are as follows:
Production of activated carbon from various pulp mill sludge samples is feasible with
using the common activating agent, KOH. Activated carbon properties i.e. Specific Surface
Area (SSA) and yield, strongly depend on the type of pulp mill sludges. The highest surface
area was 770 m2/g obtained from news and kraft secondary sludge and cow manure, which
was in the range of the commercial activated carbon. The overall yield varied from about 20
to 40 wt%, depending on the activation conditions.
Microwave pyrolysis of pulp mill sludge is not possible without the addition of a
microwave absorber like KOH. Pulp mill sludge and wood polymers are weak absorbers of
microwave radiation with small loss tangent of less than 0.1. Adding a well dispersed alkali
metal hydroxide enabled pyrolysis and improved the heating uniformity of the sludge. The
properties of the char produced by microwave pyrolysis are controlled by the amount of
microwave absorber, heating time, microwave power, and raw material properties such as ash
content, density, composition and microwave absorbability. Combining pyrolysis with
activation is recommended, considering the need to add a microwave absorbing agent during
pyrolysis.
Activated carbon can be produced from pulp mill sludge using microwaves with KOH
or NaOH activation. The activation yields for NaOH or KOH activation were in the range of
40-70 wt% or 60-80 wt%, respectively. The highest SSA achieved from NaOH-activation
was 2300 m2/g. In this work, NaOH was found to be more effective in pore development
compared to KOH; although KOH has been reported to be a better activating agent for many
precursors.
Activated carbons produced with both microwave oven and conventional furnace had
similar properties in terms of SSA and yield. The surface area of NaOH-activated carbon was
169
60% and 15% higher than the KOH-activated carbon produced in microwave oven and
conventional furnace, respectively. The total processing time with the microwave oven,
however, was from 3 to 5 minutes, compared to 1 to 2 hours with conventional furnace,
suggesting a potentially significant non-thermal effect of microwaves on activation reaction.
A new pressure-based temperature probe was designed, fabricated and used for
measuring the temperature of lignocellulosic materials heated in microwave oven. A 3-D
model was developed to simulate the temperature distribution in samples heated in
microwave oven using COMSOL multiphysics 4.4. The simulated temperature versus time
agreed with the one that was measured with the probe. Simulation results demonstrated that
microwave radiation would result in a non-uniform temperature distribution even after
reaching the plateau, which is different from heating in a conventional furnace. The degree of
non-uniformity would change with thermal properties of samples, such as heat conductivity
and capacity, as well as the location of sample in the microwave oven.
The activated carbon produced with white liquor at the optimum conditions had the
SSA of 650 m2/g and an activation yield of 61%, while activating the same sample with
NaOH yielded an activated carbon with an SSA of 2100 m2/g and activation yield of 48%
under similar conditions. With the aim of reusing available pulp mill chemicals, the simulated
recycled white liquor with NaOH (53 wt%), Na2S (21wt%), and Na2CO3 (15 wt%) was used
for activation of pulp mill sludge. The experimental and thermodynamic analyses showed
that the lower surface area of white liquor- activated carbon was attributed to the hindering
effect of both Na2S and Na2CO3 on the availability and reactivity of NaOH in white liquor.
The sludge-derived activated carbon was effective in removing these compounds,
with the secondary sludge-derived activated carbon being the most effective case with up to
70% removal based on the GC index measurements. The applicability of sludge-derived
activated carbon in effluent treatment was tested with the actual pulp mill effluent that was
known to contain compounds that affect fish reproduction. The five-day fathead minnow
reproduction tests revealed that treating the final effluent with 5g/L activated carbon in a
packed bed reactor eliminated the adverse effect and normal egg production was resumed.
170
9 Implications and Recommendations
Pulp mills produce large amount of waste every day that causes environmental and
economic issues. This work investigated the production process of activated carbon from the
pulp mill sludge. Utilizing pulp mill sludge for production of activated carbon not only
reduces the amount of waste that is generated, but also addresses the removal of effluent
contaminants.
This work analyzed the effect of pulp mill sludge source and composition on the
produced activated carbon. In this work, it was shown that the activated carbon produced
from the same pulp mill treatment plant had similar properties (surface area and yield). The
operating conditions for activated carbon production with conventional furnace were
investigated. The activating agent ratio to carbon was identified as the most important factor
in surface area development. KOH-chemical activation of pulp mill sludges generates
activated carbon with similar properties to the commercial products. However, drying of the
sludge, thermal treatment duration, and activating agent cost might negatively affect the
economics of the process and further works should investigate the cost effectiveness of the
process.
In order to potentially improve the process of activated carbon production, microwave
radiation was used for pyrolysis and activation of the sludge. The challenge of using
microwave radiation is the uniformity of the temperature distribution inside samples. In the
pyrolysis process, the produced chars had a low uniformity. The uniformity was enhanced by
modifying the properties of sludge such as increasing microwave absorbability and grinding
of the sludge. In contrast to the conventional method, the produced chars by microwave
radiation had lower retained carbon of 10%; however the pyrolysis process was 12 times
faster in a microwave. Using microwave fluidized bed reactor for pyrolysis and activation is
recommended to improve the uniformity of the product.
The chemical activation process by microwave radiation was investigated and
compared with the conventional furnace activation. The produced activated carbon by both
171
methods had similar properties (surface area and yield), when using the same activating agent
ratio to carbon. Interestingly, the activated carbon production in a microwave oven was 12
times faster than conventional furnace. The homogeneity of produced activated carbon was
comparable for the two methods, because the addition of alkali hydroxides as the activating
agent caused uniform heating in a microwave oven. The thermal runaway was the challenge
that needs to be controlled during microwave activation. Another benefit of the microwave
processing is that the pyrolysis and activation could be combined. However, in the
conventional furnace and microwave activation, the combination of the two steps has lowered
the surface area of the activated carbon. Economic analysis of microwave assisted and
conventional activation showed that the ROI of the processes are 17.3 and 18 %, respectively
(calculations are presented in Appendix D).
Utilizing white liquor as the activating agent was proposed by this work to
provide the activating agent inside kraft mills and improve the economics of activated carbon
production process. The benefits of using white liquor are that its recycling process has been
established at the pulp mills for many years and it contains 50% sodium hydroxide. This
work has found that white liquor is not an effective activating agent even though it contains
50% sodium hydroxide, which is shown to be a suitable activating agent for sludge
activation. The thermodynamic analysis by FactSage and HSC demonstrated that some of the
white liquor compounds (Na2S and Na2CO3) inhibit the activation reaction. Therefore,
considering other types of activating agents at the pulp mills for the production of activated
carbon is recommended.
The performance of the produced activated carbon was analyzed by the removal of
the effluent compounds that affect fish reproduction. In some of the pulp mill effluents, a
group of compounds has been shown to affect fish reproduction. The elimination of these
compounds at the sources has not yet been established. Currently, the best practice could be
the removal of these compounds from the final effluent. Since the individual compounds are
unknown, the GC index was used as the indicator of the total amount of these compounds
that affect fish reproduction. An adsorption study in this work showed that several produced
activated carbons can reduce the GC index to the level of pure water. Additionally, 5 days
172
fish exposure experiments indicated that activated carbon is able to remove the effect of these
compounds on fish. The amount of activated carbon needed for the removal process can be
optimized by targeting specific suspicious streams at the pulp mills. The removal of
compounds that affect fish reproduction with produced activated carbon is a good example of
their applicability at the pulp mills.
The following works are recommended for future research:
1. Study the behavior of biologically treated-biomass, such as municipal secondary sludge,
during microwave-assisted pyrolysis and activation. Such a study will help elucidate the
contributions of various wood polymer and proteins to the production of activated carbon.
2. Analyze the possibility of using a lower amount of chemical activating agent by
combining physical and chemical activation process and soaking the char into the
activating agent prior to activation.
3. Combine a fluidized bed reactor with microwave for pyrolysis and activation. Study the
effect of fluidization on product uniformity. Investigate the potential benefit of
intermittent microwave radiation in improving product uniformity.
4. Analyze the possibility of producing bio-oil using microwave pyrolysis which is a faster
process. A fast pyrolysis might favor the production of bio-oil. The operating conditions
of microwave pyrolysis need to be analyzed to find out the optimum conditions for bio-oil
production.
5. Investigate the other chemicals readily available at pulp mills as activating agents. The
surface area of activated carbon produced with white liquor was lower than the NaOH-
activated carbon. The surface area may be improved by using other possible activating
agents available at pulp mills.
6. Identify the wastewater streams within pulp mills that are the sources of compounds that
affect fish reproduction. This would reduce the amount of water that needs treatments and
therefore the amount of activated carbon required.

173
174
References
Aci F., Nebioglu M., Arslan M., Imamoglu M., Zengin M. and Küçükislamoglu M. (2008). Preparation of activated
carbon from sugar beet molasses and adsorption of methylene blue. Fresenius Environ Bull. 17(8 A), 997-
1001.
Ahmad A. L., Loh M. M. and Aziz J. A. (2007). Preparation and characterization of activated carbon from oil palm
wood and its evaluation on Methylene blue adsorption. Dyes and Pigments. 75(2), 263-272.
Altenor S., Carene B., Emmanuel E., Lambert J., Ehrhardt J. -. and Gaspard S. (2009). Adsorption studies of
methylene blue and phenol onto vetiver roots activated carbon prepared by chemical activation. J Hazard
Mater. 165(1-3), 1029-1039.
Amaya A., Medero N., Tancredi N., Silva H. and Deiana C. (2007). Activated carbon briquettes from biomass
materials. Bioresour Technol. 98(8), 1635-1641.
Andersson,S. (1982). Studies on phase diagram Na2S-Na2SO4, Na2CO3- Na2S-Na2SO4, Na2CO3-Na2SO4-NaOH,
Na2CO3-Na2S-NaOH” Chemica Scripta, 33,164-170
Ania C. O., Parra . B., Men ndez . A. and Pis . . 2005). Effect of microwave and conventional regeneration on
the microporous and mesoporous network and on the adsorptive capacity of activated carbons. Microporous
and Mesoporous Materials. 85(1-2), 7-15.
Ankley G. T., Bencic D. C., Breen M. S., Collette T. W., Conolly R. B., Denslow N. D., Edwards S. W., Ekman D.
R., Garcia- eyero N., ensen K. M., azorchak . M., Martinović D., Miller D. H., Perkins E. ., Orlando E.
F., Villeneuve D. L., Wang R. -. and Watanabe K. H. (2009). Endocrine disrupting chemicals in fish:
Developing exposure indicators and predictive models of effects based on mechanism of action. Aquat
Toxicol. 92(3), 168-178.
Appleton T. J., Colder R. I., Kingman S. W., Lowndes I. S. and Read A. G. (2005). Microwave technology for
energy-efficient processing of waste. Appl Energy. 81(1), 85-113.
Arjmand, C., Kaghazchi, T., Latifi, S. M. & Soleimani, M. (2006) Chemical Production of Activated Carbon from
Nutshells and Date Stones, Chem. Eng. Tech., 29, No. 8, 986–991
Arrougé, T., Moresoli, C., Soucy, G., 1999. Primary and secondary sludge composting: A feasibility study
Suggestions are offered on how to reduce the disposal problem, Pulp and Paper Canada 100(4), 33-36.
Asada T., Oikawa K., Kawata K., Ishihara S., Iyobe T. and Yamada A. (2004). Study of removal effect of bisphenol
A and β-estradiol by porous carbon. J Health Sci. 50(6), 588-593.
175
Assoumani, A., Favier-Teodorescu, L., & Wolbert, D. (2009) Adsorption kinetics and isotherm characteristics of
selected endocrine disrupting compounds on activated carbon in natural waters
Attia, A.A., Girgis B.S. & Khedr, S. A. (2003) Capacity of activated carbon derived from pistachio shells by H3PO4
in the removal of dyes and phenolics, J. Chem. Tech. Biotec. 78:611–619
Aygun, A., Yenisoy-Karakas S. & Duman, I. (2003) Production of granular activated carbon from fruit stones and
nutshells and evaluation of their physical, chemical and adsorption properties, Micro. Meso. Mat. 66 (2003)
189–195
Bagreev A. A., Broshnik A. P., Strelko V. V. and Tarasenko Y. A. (2001). Effect of Oxidizing Treatment of Walnut
Shell on the Properties of Activated Carbon. Russian Journal of Applied Chemistry. 74(9), 1453-1457.
Bagreev A., Bandosz T. J. and Locke D. C. (2001). Pore structure and surface chemistry of adsorbents obtained by
pyrolysis of sewage sludge-derived fertilizer. Carbon. 39(13), 1971-1979.
Bagreev A., Bashkova S., Locke D. G. and Bandosz T. J. (2001). Sewage sludge-derived materials as efficient
adsorbents for removal of hydrogen sulfide. Environmental Science and Technology. 35(7), 1537-1543.
Basta, A. H., Fierro, V., El-Saied, H., & Celzard, A. (2009) 2-steps KOH activation of rice straw: An efficient
method for preparing high-performance activated carbons. Bioresource Technology, 100(17), 3941-3947.
Belknap A. M., Solomon K. R., MacLatchy D. L., Dubé M. G. and Hewitt L. M. (2006). Identification of
compounds associated with testosterone depressions in fish exposed to bleached kraft pulp and paper mill
chemical recovery condensates. Environmental Toxicology and Chemistry. 25(9), 2322-2333.
Bello, O. S., Adeogun, I. A., Ajaelu, J. C., & Fehintola, E. O. (2008) Adsorption of methylene blue onto activated
carbon derived from periwinkle shells: Kinetics and equilibrium studies. Chemistry and Ecology, 24(4), 285-
295.
Benaddi H., Bandosz T. ., agiello ., Schwarz . A., ouzaud . N., egras D. and B guin F. 2000). Surface
functionality and porosity of activated carbons obtained from chemical activation of wood. Carbon. 38(5),
669-674.
Brunauer S., Emmett P. H. and Teller E. (1938). Adsorption of gases in multimolecular layers. J Am Chem Soc.
60(2), 309-319.
Burton P.J., Messier C., Smith D. w., Acadamowicz W.L. (editors) (2003). Toward sustainable management of the
boreal forests, NRC research press, Ottawa, ON, Chapter 19
176
Bykov Y. V., Rybakov K. I. and Semenov V. E. (2001). High-temperature microwave processing of materials. J
Phys D. 34(13), R55-R75.
Cagnon B., Py X., Guillot A., Stoeckli F. and Chambat G. (2009). Contributions of hemicellulose, cellulose and
lignin to the mass and the porous properties of chars and steam activated carbons from various lignocellulosic
precursors. Bioresour Technol. 100(1), 292-298.
Campanone L. A., Zaritzky N. E. (2005). Mathematical analysis of microwave heating process. J Food Eng. 69(3),
359-368.
Castro J. J., Doyle F. J. (2004). A pulp mill benchmark problem for control: problem description. J Process Control.
14(1), 17-29.
Caturla F., Molina-Sabio M. and Rodríguez-Reinoso F. (1991). Preparation of activated carbon by chemical
activation with ZnCl2. Carbon. 29(7), 999-1007.
Chang, H., Choo, K. , Lee, B., & Choi, S. (2009). The methods of identification, analysis, and removal of endocrine
disrupting compounds (EDCs) in water. Journal of Hazardous Materials, 172(1), 1-12.
Chen H., Hashisho Z. (2012). Fast preparation of activated carbon from oil sands coke using microwave-assisted
activation. Fuel. 95, 178-182.
Chiang G., Munkittrick K. R., Orrego R. and Barra R. (2010). Monitoring of the environmental effects of pulp mill
discharges in chilean rivers: Lessons learned and challenges. Water Qual Res J Can. 45(2), 111-122.
Cho B. R., Suzuki M. (1980). Activated carbon by pyrolysis of sludge from pulp-mill waste water treatment. J Chem
Eng Japan. 13(6), 463-466.
Choi K. J., Kim S. G., Kim C. W. and Kim S. H. (2005). Effects of activated carbon types and service life on
removal of endocrine disrupting chemicals: Amitrol, nonylphenol, and bisphenol-A. Chemosphere. 58(11),
1535-1545.
Choy K. K. H., Barford J. P. and McKay G. (2005). Production of activated carbon from bamboo scaffolding waste-
process design, evaluation and sensitivity analysis. Chem Eng J. 109(1-3), 147-165.
Ciacci T., Galgano A. and Di Blasi C. (2010). Numerical simulation of the electromagnetic field and the heat and
mass transfer processes during microwave-induced pyrolysis of a wood block. Chemical Engineering Science.
65(14), 4117-4133.
Clark D. E., Folz D. C. and West J. K. (2000). Processing materials with microwave energy. Materials Science and
Engineering: A. 287(2), 153-158.
177
Conesa J. A., Marcilla A., Moral R., Moreno-Caselles J. and Perez-Espinosa A. (1998). Evolution of gases in the
primary pyrolysis of different sewage sludges. Thermochimica Acta. 313(1), 63-73.
Costas, P. & Snoeyink, V.L. (2000) Competitive adsorption between atrazine and methylene blue on activated
carbon: the importance of pore size distribution, Carbon 38, pp. 1423–1436.
CPBIS–Center for Paper Business and Industry Studies. “Today’s Paper Industry–Its Character and Structure”
http://www.paperstudies.org/industry/character.html 2003
De La Hoz A., Díaz-Ortiz Á. and Moreno A. (2005). Microwaves in organic synthesis. Thermal and non-thermal
microwave effects. Chem Soc Rev. 34(2), 164-178.
Demirbas A. (2009). Agricultural based activated carbons for the removal of dyes from aqueous solutions: A review.
J Hazard Mater. 167(1-3), 1-9.
Di Blasi C. (2008). Modeling chemical and physical processes of wood and biomass pyrolysis. Progress in Energy
and Combustion Science. 34(1), 47-90.
Di Blasi C. (2009). Combustion and gasification rates of lignocellulosic chars. Progress in Energy and Combustion
Science. 35(2), 121-140.
Dias, J. M., Alvim-Ferraz, M. C. M., Almeida, M. F., Rivera-Utrilla, J., & Sánchez-Polo, M. (2007) Waste materials
for activated carbon preparation and its use in aqueous-phase treatment: A review. Journal of Environmental
Management, 85(4), 833-846.
Díaz-Terán J., Nevskaia D. M., Fierro J. L. G., López-Peinado A. J. and Jerez A. (2003). Study of chemical
activation process of a lignocellulosic material with KOH by XPS and XRD. Microporous and Mesoporous
Materials. 60(1-3), 173-181.
Dominguez A., Menendez J. A., Inguanzo M. and Pis J. J. (2005). Investigations into the characteristics of oils
produced from microwave pyrolysis of sewage sludge. Fuel Process Technol. 86(9), 1007-1020.
Dub M. G., Maclatchy D. . 2001). Identification and treatment of a waste stream at a bleached-kraft pulp mill
that depresses a sex steroid in the mummichog (Fundulus heteroclitus). Environmental Toxicology and
Chemistry. 20(5), 985-995.
Dutta B., Dev S. R. S. and Raghavan V. G. S. (2013). Finite element modeling of selective heating in microwave
pyrolysis of lignocellulosic biomass. Progress In Electromagnetics Research B. (56), 1-24.
Fentress J. A., Steele S. L., Bart Jr. H. L. and Cheek A. O. (2006). Reproductive disruption in wild longear sunfish
(Lepomis megalotis) exposed to kraft mill effluent. Environ Health Perspect. 114(1), 40-45.
178
Fernandez, Y. Arenillas A., Menendez J (2011). Microwave Heating Applied to Pyrolysis, Advances in Induction
and Microwave Heating of Mineral and Organic Materials, Prof. Stanisław Grundas Ed.), ISBN: 978-953-
307-522-8, InTech, DOI: 10.5772/13548. Available from: http://www.intechopen.com/books/advances-in-
induction-and-microwave-heating-of-mineral-and-organic-materials/microwave-heating-applied-to-pyrolysis
Foo K. Y., Hameed B. H. (2011). Utilization of rice husks as a feedstock for preparation of activated carbon by
microwave induced KOH and K 2CO 3 activation. Bioresour Technol. 102(20), 9814-9817.
Foo K. Y., Hameed B. H. (2012). Microwave-assisted preparation and adsorption performance of activated carbon
from biodiesel industry solid reside: Influence of operational parameters. Bioresour Technol. 103(1), 398-404.
Fox G. A. (2001). Effects of endocrine disrupting chemicals on wildlife in Canada: past, present and future. Water
Qual Res J Can. 36(2), 233-251.
Fukuhara T., Iwasaki S., Kawashima M., Shinohara O. and Abe I. 2006). Adsorbability of estrone and 17β-estradiol
in water onto activated carbon. Water Res. 40(2), 241-248.
Gasco G., Blanco C. G., Guerrero F. and Mendez Lazaro A. M. (2005). The influence of organic matter on sewage
sludge pyrolysis. J Anal Appl Pyrolysis. 74(1-2), 413-420.
Girgis, B. S., Smith, E., Louis, M. M., & El-Hendawy, A. A. (2009) Pilot production of activated carbon from cotton
stalks using H3PO4. Journal of Analytical and Applied Pyrolysis, 86(1), 180-184.
Girods P., Dufour A., Fierro V., Rogaume Y., Rogaume C., Zoulalian A. and Celzard A. (2009). Activated carbons
prepared from wood particleboard wastes: Characterisation and phenol adsorption capacities. J Hazard Mater.
166(1), 491-501.
Gonzalez J. C., Gonzalez M. T., Molina-Sabio M., Rodriguez-Reinoso F. and Sepulveda-Escribano A. (1995)
Porosity of activated carbons prepared from different lignocellulosic materials. Carbon. 33(8), 1175-1177.
González, J. F., Román, S., Encinar, J. M., & Martínez, G. (2009) Pyrolysis of various biomass residues and char
utilization for the production of activated carbons. Journal of Analytical and Applied Pyrolysis, 85(1-2), 134-
141.
Gude V. G., Patil P. and Deng S. (2012). Microwave energy potential for large scale biodiesel production. World
Renewable Energy Forum, WREF 2012, Including World Renewable Energy Congress XII and Colorado
Renewable Energy Society (CRES) Annual Conferen. 1, 751-759.
Guo, J. & Lua, A.C. (1999) Textural and chemical characterisations of activated carbon prepared from oil-palm
stone with H2SO4 and KOH impregnation, Micro. Meso. Mat. 32, 111–117
179
Guo, Y., Rockstraw, D. A. (2007) physicochemical properties of carbons prepared from pecan shell by phosphoric
acid activation. Biores. Tech. 98 (2007) 1513–1521
H Tran, EK Vakkilainnen - 2008 - tappi.org
Hall T. J., Fisher R. P., Rodgers Jr. J. H., Minshall G. W., Landis W. G., Kovacs T., Firth B. K., Dubé M. G.,
Flinders C. A., Deardorff T. L. and Borton D. L. (2009). A long-term, multitrophic level study to assess pulp
and paper mill effluent effects on aquatic communities in four US receiving waters: lessons learned. Integrated
environmental assessment and management. 5(2), 283-290.
Hameed B. H., Ahmad A. L. and Latiff K. N. A. (2007). Adsorption of basic dye (methylene blue) onto activated
carbon prepared from rattan sawdust. Dyes and Pigments. 75(1), 143-149.
Hasna A. M. (2011). Microwave processing applications in chemical engineering: Cost analysis. Journal of Applied
Sciences. 11(21), 3613-3618.
Hayashi, J., Kazehaya, A., Muroyama,K.& Watkinson, A.P., (2000) Preparation of activated carbon from lignin by
chemical activation, Carbon 38, 1873–1878
Hewitt L. M., Kovacs T. G., Dubé M. G., MacLatchy D. L., Martel P. H., McMaster M. E., Paice M. G., Parrott J.
L., Van Den Heuvel M. R. and Van Der Kraak G. J. (2008). Altered reproduction of fish exposed to pulp and
paper mill effluents: Roles of individual compounds and mill operating procedures (Environmental Toxicology
and Chemistry (2008) 27, (682-697)). Environmental Toxicology and Chemistry. 27(5), 1226.
Hewitt L. M., Smyth S. A. M., Dubé M. G., Gilman C. I. and MacLatchy D. L. (2002). Isolation of compounds from
bleached kraft mill recovery condensates associated with reduced levels of testosterone in mummichog
(Fundulus heteroclitus). Environmental Toxicology and Chemistry. 21(7), 1359-1367.
Hewitt, L. M., Kovacs, T. G., Dubé, M. G., MacLatchy, D. L., Martel, P. H., McMaster, M. E., et al. (2008). Altered
reproduction of fish exposed to pulp and paper mill effluents: Roles of individual compounds and mill
operating procedures (environmental toxicology and chemistry 27, (682-697)). Environmental Toxicology and
Chemistry, 27(5), 1226.
Hojamberdiev M., Kameshima Y., Nakajima A., Okada K. and Kadirova Z. (2008). Preparation and sorption
properties of materials from paper sludge. J Hazard Mater. 151(2-3), 710-719.
Hoseinzadeh Hesas R., Arami-Niya A., Wan Daud W. M. A. and Sahu J. N. (2013a). Preparation of granular
activated carbon from oil palm shell by microwave-induced chemical activation: Optimisation using surface
response methodology. Chem Eng Res Design. 91(12), 2447-2456.
180
Hoseinzadeh Hesas R., Wan Daud W. M. A., Sahu J. N. and Arami-Niya A. (2013b). The effects of a microwave
heating method on the production of activated carbon from agricultural waste: A review. J Anal Appl
Pyrolysis. 100, 1-11.
Hwang H., Choi W., Kim T., Kim J., and Oh K. (2008). The preparation of an adsorbent from mixtures of sewage
sludge and coal-tar pitch using an alkaline hydroxide activation agent. J Anal Appl Pyrolysis. 83(2), 220-226.
Ifelebuegu, A. O., Lester, J. N., Churchley, J., & Cartmell, E. (2006) Removal of an endocrine disrupting chemical
17α-ethinyloestradiol) from wastewater effluent by activated carbon adsorption: Effects of activated carbon
type and competitive adsorption. Environmental Technology, 27(12), 1343-1349.
Jackson M. J., Line M. A. (1997). Organic Composition of a Pulp and Paper Mill Sludge Determined by FTIR, 13C
CP MAS NMR, and Chemical Extraction Techniques. J Agric Food Chem. 45(6), 2354-2358.
Ji Y., Li T., Zhu L., Wang X. and Lin Q. (2007). Preparation of activated carbons by microwave heating KOH
activation. Appl Surf Sci. 254(2), 506-512.
Jiang, B.,Zhang ,Y.,Zhou ,J.,Zhang ,K. & Chen, S. (2008) Effects of chemical modification of petroleum cokes on
the properties of the resulting activated carbon. Fuel 87, 1844–1848
Jibril B., Houache O., Al-Maamari R. and Al-Rashidi B. (2008). Effects of H3PO4 and KOH in carbonization of
lignocellulosic material. J Anal Appl Pyrolysis. 83(2), 151-156.
Jones D. A., Lelyveld T. P., Mavrofidis S. D., Kingman S. W. and Miles N. J. (2002). Microwave heating
applications in environmental engineering - A review. Resour Conserv Recycling. 34(2), 75-90.
Kaleta, J. (2007) Removal of methylene blue from aqueous solution by adsorption. Archives of Environmental
Protection, 33(2), 45-54.
Kang H., Park S., and Rim Y. -. (2006). Preparation of activated carbon from paper mill sludge by KOH-activation.
Korean Journal of Chemical Engineering. 23(6), 948-953.
Kappe, C. O. and Stadler, A. (2006) Microwave Theory, in Microwaves in Organic and Medicinal Chemistry,
Wiley-VCH Verlag GmbH & Co. KGaA, Weinheim, FRG. doi: 10.1002/3527606556.ch2
Kappe, C. O., Dallinger, D. and Murphree, S. S. (2009) Starting With Microwave Chemistry, in Practical
Microwave Synthesis for Organic Chemists: Strategies, Instruments, and Protocols, Wiley-VCH Verlag GmbH
& Co. KGaA, Weinheim, Germany. doi: 10.1002/9783527623907.ch5
Karag z, S., Tay, T., car, S., Erdem, M. 2008) Activated carbons from waste biomass by sulfuric acid
activation and their use on methylene blue adsorption. Bioresource Technology, 99(14), 6214-6222.
181
Kawano, T., Kubota, M., Onyango, M.S., Watanabe, F. & Matsuda, H. (2008) Preparation of activated carbon from
petroleum coke by KOH chemical activation for adsorption heat pump, Appl. Therm. Eng. 28, 865–871
Kazner, C., Lehnberg, K., Kovalova, L., Wintgens, T., Melin, T., Hollender, J., et al. (2008) Removal of endocrine
disruptors and cytostatics from effluent by nanofiltration in combination with adsorption on powdered
activated carbon
Khalili N. ., Campbell M., Sandi G. and Gola . 2000). Production of micro- and mesoporous activated carbon
from paper mill sludge. I. Effect of zinc chloride activation. Carbon. 38(14), 1905-1915.
Khalili N. R., Campbell M., Sandi G., Lu W. and Barsokov I. V. (2001). Physical and Electrochemical Properties of
a Carbon-based Material Produced from Paper Mill Sludge. Journal of New Materials for Electrochemical
Systems. 4(4), 267-274.
Khalili N. R., Jain H. and Arastoopour H. (2000). Synthesis and characterization of catalysts produced from paper
mill sludge: I. Determination of NO(x) removal capability. J Hazard Mater. 80(1-3), 207-221.
Khalili N. R., Vyas J. D., Weangkaew W., Westfall S. J., Parulekar S. J. and Sherwood R. Synthesis and
characterization of activated carbon and bioactive adsorbent produced from paper mill sludge. Separation and
Purification Technology. 26(2-3), 295-304.
Khezami L., Ould-Dris A. and Capart R. (2007). Activated carbon from thermo-compressed wood and other
lignocellulosic precursors. BioResources. 2(2), 193-209.
Kim J. S., Lee Y. Y. and Park S. C. (2000). Pretreatment of wastepaper and pulp mill sludge by aqueous ammonia
and hydrogen peroxide. Applied Biochemistry and Biotechnology - Part A Enzyme Engineering and
Biotechnology. 84-86, 129-139.
Kim, S. G., Choi, K. J., & Oh, K. J. (2002). Fate of endocrine disruptor in water treatment processes. The
Proceedings of IWA World Congress,
Ko D. C. K., Mui E. L. K., Lau K. S. T. and McKay G. (2004). Production of activated carbons from waste tire –
process design and economical analysis. Waste Manage. 24(9), 875-888.
Kovacs T. G., Martel P. H., O'Connor B. I., Parrott J. L., Mcmaster M. E., Van Der Kraak G. J., Maclatchy D. L.,
van den Heuvel M. R. and Hewitt L. M. (2011a). Kraft mill effluent survey: Progress toward best management
practices for reducing effects on fish reproduction. Environmental Toxicology and Chemistry. 30(6), 1421-
1429.
Kovacs T., Martel P. (2006). Paprican research on fish reproduction in relation to mill effluents. Annual Meeting of
the Pulp and Paper Technical Association of Canada (PAPTAC). B, B101-B106.
182
Kovacs T., Martel P. and Ricci M. (2007). A shortened adult fathead minnow reproduction test developed for
Investigation of Cause and Investigation of Solution work involving pulp and paper mill effluents. Water Qual
Res J Can. 42(2), 91-100.
Kovacs T., Martel P., Gibbons S. and Naish V. (2010). 1995-2009: What have we learned about effluent
biotreatment in relation to environmental protection? Water Qual Res J Can. 45(2), 251-262.
Kovacs T., Martel P., Ricci M., Michaud J. and Voss R. (2005). Further insights into the potential of pulp and paper
mill effluents to affect fish reproduction. Journal of Toxicology and Environmental Health - Part A. 68(19),
1621-1641.
Kovacs, T., Gibbons, S., O'Connor, B., Martel, P., Paice, M., Naish, V., et al. (2004). Summary of case studies
investigating the causes of pulp and paper mill effluent regulatory toxicity. Water Quality Research Journal of
Canada, 39(2), 93-102.
Krigstin S., Sain M. (2006). Characterization and potential utilization of recycled paper mill sludge. Pulp and Paper
Canada. 107(5), 29-32.
Kuester J. L. (1994). Design, operation and analysis of microwave heated chemical reactors. Research on Chemical
Intermediates. 20(1), 51-59.
Kumar, A. K., Mohan, S. V., & Sarma, P. N. (2009). Sorptive removal of endocrine-disruptive compound (estriol,
E3) from aqueous phase by batch and column studies: Kinetic and mechanistic evaluation. Journal of
Hazardous Materials, 164(2-3), 820-828.
Kumar, V., Majumdar, C., & Roy, P. (2008). Effects of endocrine disrupting chemicals from leather industry
effluents on male reproductive system. Journal of Steroid Biochemistry and Molecular Biology, 111(3-5), 208-
216.
Kyllonen H. L., Lappi M. K., Thun R. T. and Mustranta A. H. (1988). Treatment and characterization of biological
sludges from the pulp and paper industry. Water Science and Technology. 20(1), 183-192.
Lacorte, S., Latorre, A., Barcelo´, D., Rigol, A. Malmqvist, A. & Welander, T. (2003) Organic compounds in paper-
mill process waters and effluents, Trends Anal. Chem., Vol. 22, No. 10
Li, J., Ma, F., Liang, G. B., 2010. Preparation of activated carbon from corn cob by Na2CO3 activation using
microwave radiation, ICAMS 2010 - Proceedings of 2010 IEEE International Conference on Advanced
Management Science 3, 320-324.
183
Li, W., Zhang, L. , Peng, J., Li, N., & Zhu, X. (2008). Preparation of high surface area activated carbons from
tobacco stems with K2CO3 activation using microwave radiation. Industrial Crops and Products, 27(3), 341-
347.
illo- denas M. A., Cazorla-Amor s D. and inares-Solano A. (2003). Understanding chemical reactions between
carbons and NaOH and KOH: An insight into the chemical activation mechanism. Carbon. 41(2), 267-275.
Lillo-Ródenas M. A., Cazorla-Amorós D., Linares-Solano A., Béguin F., Clinard C. and Rouzaud J. N. (2004).
HRTEM study of activated carbons prepared by alkali hydroxide activation of anthracite. Carbon. 42(7), 1299-
1304.
Lillo-Ródenas M. A., Lozano-Castelló D., Cazorla-Amorós D. and Linares-Solano A. (2001). Preparation of
activated carbons from Spanish anthracite - II. Activation by NaOH. Carbon. 39(5), 751-759.
illo- denas M. A., Marco- ozar . P., Cazorla-Amor s D. and inares-Solano A. (2007). Activated carbons
prepared by pyrolysis of mixtures of carbon precursor/alkaline hydroxide. J Anal Appl Pyrolysis. 80(1), 166-
174.
Linares-Solano A., Lozano-Castello D., Lillo-Rodenas M.A., and Cazorla-Amoros D., (2007), Chemistry and
Physics of Carbon, Edited by Ljubisa R . Radovic, CRC press, Volume 30
Linares-Solano, A., Lozano-Castello´, D., Lillo-Ro´denas, M.A., Cazorla-Amoro´ s, D. (2006) Carbon activation by
alkaline hydroxides: preparation and reactions, porosity and performances, Chem. Phys. Carbon, vol. 30,
Dekker, New York
ittrell K. C., Khalili N. ., Campbell M., Sand G. and Thiyagarajan P. 2002). Structural characterization of
activated carbon adsorbents prepared from paper mill sludge. Applied Physics A: Materials Science and
Processing. 74(SUPPL.II), S1403-S1405.
Lowell R. B., Munkittrick K. R., Culp J. A., McMaster M. E. and Grapentine L. C. (2003). National response
patterns of fish and invertebrates exposed to pulp and paper mill effluents: Reproductive disruption in
combination with eutrophication and other effects. Proceedings, 5th International Conferences on the
Environmental Fate and Effects of Pulp and Paper Effluents. , 147-155.
Lozano-Castelló D., Calo J. M., Cazorla-Amorós D. and Linares-Solano A. (2007). Carbon activation with KOH as
explored by temperature programmed techniques, and the effects of hydrogen. Carbon. 45(13), 2529-2536.
Lozano-Castello´, D., Lillo-Ro´denas, M.A., Cazorla-Amoro´s, D. & Linares-Solano, A. (2001) Preparation of
activated carbons from Spanish anthracite I. Activation by KOH, Carbon 39 741–749
184
Maciá-Agulló J. A., Moore B. C., Cazorla-Amorós D. and Linares-Solano A. (2007). Influence of carbon fibres
crystallinities on their chemical activation by KOH and NaOH. Microporous and Mesoporous Materials.
101(3), 397-405.
Madadi Yeganeh, M., Kaghazchi, T. & Soleimani, M. (2006) Effect of Raw Materials on Properties of Activated
Carbons, Chem. Eng. Tech., 29, No. 10, 1247–1251
Mahmood T., Elliott A. (2006). A review of secondary sludge reduction technologies for the pulp and paper
industry. Water Res. 40(11), 2093-2112.
Makeev M. A., Srivastava D. (2009). Thermal properties of char obtained by pyrolysis: A molecular dynamics
simulation study. Appl Phys Lett. 95(18).
Mameli A., Cincotti A., Lai N., Crisafulli C., Sciré S. and Cao G. (2004). Adsorption of organic compounds onto
activated carbons from recycled vegetables biomass. Ann Chim. 94(7-8), 547-554.
Marsh H., Rodríguez-Reinoso, F., 2006. Activated Carbon. Elsevier, London.
Martel P. H., Kovacs T. G., O'Connor B. I., Semeniuk S., Hewitt L. M., MacLatchy D. L., McMaster M. E., Parrott
J. L., Van Den Heuvel M. R. and Van Der Kraak G. J. (2011). Effluent monitoring at a bleached kraft mill:
Directions for best management practices for eliminating effects on fish reproduction. Journal of
Environmental Science and Health - Part A Toxic/Hazardous Substances and Environmental Engineering.
46(8), 833-843.
Matsui, Y., Fukuda, Y., Inoue, T., & Matsushita, T. (2003). Effect of natural organic matter on powdered activated
carbon adsorption of trace contaminants: Characteristics and mechanism of competitive adsorption. Water
Research, 37(18), 4413-4424.
Meena, A. K., Rajagopal, C., Kiran, Mishra, G. K., 2010. Removal of heavy metal ions from aqueous solutions
using chemically (Na2S) treated granular activated carbon as an adsorbent, Journal of Scientific and Industrial
Research 69(6), 449-453.
Menéndez J. A., Arenillas A., Fidalgo B., Fernández Y., Zubizarreta L., Calvo E. G. and Bermúdez J. M. (2010).
Microwave heating processes involving carbon materials. Fuel Process Technol. 91(1), 1-8.
Menéndez J. A., Domínguez A., Fernández Y. and Pis J. J. (2007). Evidence of self-gasification during the
microwave-induced pyrolysis of coffee hulls. Energy and Fuels. 21(1), 373-378.
Menéndez J. A., Inguanzo M. and Pis J. J. (2002). Microwave-induced pyrolysis of sewage sludge. Water Res.
36(13), 3261-3264.
185
Meredith R. (1998). Engineers’ handbook of industrial microwave heating. Institute of Electrical Engineers, Power
series 25 ISBN 085296 916 3, Printed in England by Short Run Press Ltd.
Milestone C. B., Orrego R., Scott P. D., Waye A., Kohli J., O'Connor B. I., Smith B., Engelhardt H., Servos M. R.,
MacLatchy D. L., Smith D. S., Trudeau V. L., Arnason J. T., Kovacs T., Heid Furley T., Slade A. H., Holdway
D. A. and Hewitt L. M. (2012). Evaluating the potential of effluents and wood feedstocks from pulp and paper
mills in Brazil, Canada, and New Zealand to affect fish reproduction: Chemical profiling and in vitro
assessments. Environmental Science and Technology. 46(3), 1849-1858.
Mitani S., Lee S. -., Yoon S. -., Korai Y. and Mochida I. (2004). Activation of raw pitch coke with alkali hydroxide
to prepare high performance carbon for electric double layer capacitor. J Power Sources. 133(2), 298-301.
Mohamad Nor, N., Lau, L. C., Lee, K. T., Mohamed, A. R., (2013) Synthesis of activated carbon from
lignocellulosic biomass and its applications in air pollution control - A review, Journal of Environmental
Chemical Engineering 1(4), 658-666.
Molina-Sabio, M. odr´ıguez-Reinoso, F. (2004) Role of chemical activation in the development of carbon
porosity Colloids and Surfaces A: Physicochem. Eng. Aspects. 241, 15–25
Monte M. C., Fuente E., Blanco A. and Negro C. (2009). Waste management from pulp and paper production in the
European Union. Waste Manage. 29(1), 293-308.
Moreno-Castilla, C. (2004) Adsorption of organic molecules from aqueous solutions on carbon materials. Carbon
42, 83–94.
Moreno-Piraján J. C., Giraldo L. (2012). Study of activated carbons by pyrolysis of Mangifera Indica seed (mango)
in presence of sodium and potassium hydroxide. E-Journal of Chemistry. 9(2), 780-785.
Nabais J. V., Carrott P., Ribeiro Carrott M. M. L., Luz V. and Ortiz A. L. (2008). Influence of preparation
conditions in the textural and chemical properties of activated carbons from a novel biomass precursor: The
coffee endocarp. Bioresour Technol. 99(15), 7224-7231.
Namazi, A. B., Jia, C. Q., Allen, D. G., 2010. Production and characterization of lignocellulosic biomass-derived
activated carbon, Water Science and Technology 62(11), 2637-2646.
Ng C., Marshall W. E., Rao R. M., Bansode R. R. and Losso J. N. (2003). Activated carbon from pecan shell:
process description and economic analysis. Industrial Crops and Products. 17(3), 209-217.
Noboru Y. (2011). Recent Studies on Fundamentals and Application of Microwave Processing of Materials,
Advances in Induction and Microwave Heating of Mineral and Organic Materials, Prof. Stanisław Grundas
(Ed.), ISBN: 978-953-307-522-8, InTech, DOI: 10.5772/13200. Available from:
186
http://www.intechopen.com/books/advances-in-induction-and-microwave-heating-of-mineral-and-organic-
materials/recent-studies-on-fundamentals-and-application-of-microwave-processing-of-materials
Ochoa de Alda, J. A. G. (2008). Feasibility of recycling pulp and paper mill sludge in the paper and board industries,
Resources, Conservation and Recycling 52(7), 965-972.
Okada K., Yamamoto N., Kameshima Y. and Yasumori A. (2003). Porous properties of activated carbons from
waste newspaper prepared by chemical and physical activation. J Colloid Interface Sci. 262(1), 179-193.
Otowa T., Nojima Y. and Miyazaki T. (1997). Development of KOH activated high surface area carbon and its
application to drinking water purification. Carbon. 35(9), 1315-1319.
Peng Z., Hwang J., Bell W., Andriese M. and Xie S. (2011). Microwave dielectric properties of pyrolyzed carbon.
TMS Annual Meeting. , 77-83.
Pokhrel, D. & Viraraghavan, T. (2004) Treatment of pulp and paper mill wastewater—a review, Sci. Tot. Env. 333,
37– 58
Ramasamy S., Moghtaderi B. (2010). Dielectric properties of typical australian wood-based biomass materials at
microwave frequency. Energy and Fuels. 24(8), 4534-4548.
Ravi, M., Somasekhara Rao, K., Sreedhar, B., Rajesh, K., & Vani, K. N. K. (2008). Adsorption of methylene blue
and surface chemical characterization of activated carbons. Indian Journal of Environmental Protection, 28(6),
505-517.
Raymundo-Piñero E., Azaïs P., Cacciaguerra T., Cazorla-Amorós D., Linares-Solano A. and Béguin F. (2005).
KOH and NaOH activation mechanisms of multiwalled carbon nanotubes with different structural
organisation. Carbon. 43(4), 786-795.
Reina J., Velo E. and Puigjaner L. (1998). Kinetic study of the pyrolysis of waste wood. Industrial and Engineering
Chemistry Research. 37(11), 4290-4295.
Ren Y., Nakano K., Nomura M., Chiba N. and Nishimura O. (2009) A thermodynamic analysis on adsorption of
estrogens in activated sludge process. Water Res. 41(11), 2341-2348.
ickwood C. ., Dub M. G., Hewitt . M., Kovacs T. G. and MacLatchy D. L. (2006). Use of paired fathead
minnow (Pimephales promelas) reproductive test. Part 2: Source identification of biological effects at a
bleached kraft pulp mill. Environmental Toxicology and Chemistry. 25(7), 1847-1856.
Robinson J. P., Kingman S. W., Baranco R., Snape C. E. and Al-Sayegh H. (2010). Microwave pyrolysis of wood
pellets. Industrial and Engineering Chemistry Research. 49(2), 459-463.
187
Rodríguez-Reinoso F., Molina-Sabio M. (1992). Activated carbons from lignocellulosic materials by chemical
and/or physical activation: an overview. Carbon. 30(7), 1111-1118.
Ros A., Lillo-Ródenas M. A., Fuente E., Montes-Morán M. A., Martín M. J. and Linares-Solano A. (2006). High
surface area materials prepared from sewage sludge-based precursors. Chemosphere. 65(1), 132-140.
Roy, D., Wang, G., & Adrian, D. D. (1993). A simplified solution technique for carbon adsorption model. Water
Research, 27(6), 1033-1040.
Salema A. A., Yeow Y. K., Ishaque K., Ani F. N., Afzal M. T. and Hassan A. (2013). Dielectric properties and
microwave heating of oil palm biomass and biochar. Industrial Crops and Products. 50, 366-374.
Salman J. M., Hameed B. H. (2010). Effect of preparation conditions of oil palm fronds activated carbon on
adsorption of bentazon from aqueous solutions. J Hazard Mater. 175(1-3), 133-137.
Schr der, E., Thomauske, K., Weber, C., Hornung, A., Tumiatti, . 2007). Experiments on the generation of
activated carbon from biomass. Journal of Analytical and Applied Pyrolysis, 79(1-2 SPEC. ISS.), 106-111.
Scott G. M., Smith A. (1995). Sludge characteristics and disposal alternatives for the pulp and paper industry.
TAPPI Proceedings - International Environmental Conference. 1, 269-279.
Shaughnessy, K. S., Belknap, A. M., Hewitt, L. M., Dube, M. G., & MacLatchy, D. L. Effects of kraft pulp mill
condensates on plasma testosterone levels in mummichog (fundulus heteroclitus). Ecotoxicology and
Environmental Safety, 67(1), 140-148.
Shawwa A. R., Smith D. W. and Sego D. C. (2001). Color and chlorinated organics removal from pulp mills
wastewater using activated petroleum coke. Water Res. 35(3), 745-749.
Shukla A. K., Mondal A. and Upadhyaya A. (2010). Numerical modeling of microwave heating. Science of
Sintering. 42(1), 99-124.
Simitzis, J., & Sfyrakis, J. (1994) Activated carbon from lignocellulosic biomass phenolic resin. Journal of Applied
Polymer Science, 54(13), 2091-2099.
Smith K. M., Fowler G. D., Pullket S. and Graham N. J. D. (2009). Sewage sludge-based adsorbents: A review of
their production, properties and use in water treatment applications. Water Res. 43(10), 2569-2594.
Smook G. A. (1990) Handbook of pulp and paper terminologies, Cegep de Trois-Rivieres
Soleimani, M. & Kaghazchi, T.( 2007) Agricultural Waste Conversion to Activated Carbon by Chemical Activation
with Phosphoric Acid, Chem. Eng. Tech., 30, No. 5, 649–654
188
Statistics canada. (2000) waste management industry survey business and government sectors 2000. 16f0023xie.
statistics canada
Stavropoulos G. G., Zabaniotou A. A. (2009). Minimizing activated carbons production cost. Fuel Process Technol.
90(7-8), 952-957.
Stoeckli H. F. (1990). Microporous carbons and their characterization: The present state of the art. Carbon. 28(1), 1-
6.
Suhas, Carrott, P. J. M., & Ribeiro Carrott, M. M. L. (2007). Lignin - from natural adsorbent to activated carbon: A
review. Bioresource Technology, 98(12), 2301-2312.
Sun, R. C., & Sun, X. F. (2001). Identification and quantitation of lipophilic extractives from wheat straw. Industrial
Crops and Products, 14(1), 51-64.
Tan, I. A. W., Hameed, B. H., & Ahmad, A. L. (2007). Equilibrium and kinetic studies on basic dye adsorption by
oil palm fibre activated carbon. Chemical Engineering Journal, 127(1-3), 111-119.
Tanghe T., Verstraete W. (2001). Adsorption of nonylphenol onto granular activated carbon. Water Air Soil Pollut.
131(1-4), 61-72.
Tay T., Ucar S. and Karagöz S. (2009). Preparation and characterization of activated carbon from waste biomass. J
Hazard Mater. 165(1-3), 481-485.
Thostenson E. T., Chou T. -. (1999). Microwave processing: fundamentals and applications. Composites Part A:
Applied Science and Manufacturing (Incorporating Composites and Composites Manufacturing). 30(9), 1055-
1071.
Tsang, D. C. W., Hu, J., Liu, M. Y., Zhang, W., Lai, K. C. K., & Lo, I. M. C. (2007). Activated carbon produced
from waste wood pallets: Adsorption of three classes of dyes. Water, Air, and Soil Pollution, 184(1-4), 141-
155.
Van den Heuvel M. R. (2010). Recent progress in understanding the causes of endocrine disruption related to pulp
and paper mill effluents. Water Qual Res J Can. 45(2), 137-144.
van den Heuvel M. R., Martel P. H., Kovacs T. G., Maclatchy D. L., van der Kraak G. J., Parrott J. L., McMaster M.
E., O'Connor B. I., Melvin S. D. and Mark Hewitt L. (2010). Evaluation of short-term fish reproductive
bioassays for predicting effects of a Canadian bleached kraft mill effluent. Water Qual Res J Can. 45(2), 175-
186.
189
Vos B., Mosman J., Zhang Y., Poels E. and Bliek A. (2003). Impregnated carbon as a susceptor material for low loss
oxides in dielectric heating. J Mater Sci. 38(1), 173-182.
Wartman C. A., Hogan N. S., Hewitt L. M., McMaster M. E., Landman M. J., Taylor S., Kovacs T. G. and van den
Heuvel M. R. (2009). Androgenic effects of a Canadian bleached kraft pulp and paper effluent as assessed
using threespine stickleback (Gasterosteus aculeatus). Aquatic Toxicology. 92(3), 131-139.
Wigmans, T. (1989). Industrial aspects of production and use of activated carbons. Carbon, 27(1), 13-22.
Williams, P. T., & Reed, A. R. (2006). Development of activated carbon pore structure via physical and chemical
activation of biomass fibre waste. Biomass and Bioenergy, 30(2), 144-152.
Wu, F., Tseng, R., Huang, S., & Juang, R.. (2009). Characteristics of pseudo-second-order kinetic model for liquid-
phase adsorption: A mini-review. Chemical Engineering Journal, 151(1-3), 1-9.
Xiang Zhao, Liping Yan and Kama Huang (2011). Review of Numerical Simulation of Microwave Heating Process,
Advances in Induction and Microwave Heating of Mineral and Organic Materials, Prof. Stanisław Grundas
(Ed.), ISBN: 978-953-307-522-8, InTech, DOI: 10.5772/13387. Available from:
http://www.intechopen.com/books/advances-in-induction-and-microwave-heating-of-mineral-and-organic-
materials/review-of-numerical-simulation-of-microwave-heating-process
Xin-hui D., Srinivasakannan C., Jin-hui P., Li-bo Z. and Zheng-yong Z. (2011). Comparison of activated carbon
prepared from Jatropha hull by conventional heating and microwave heating. Biomass Bioenergy. 35(9), 3920-
3926.
Yagmur E., Ozmak M. and Aktas Z. (2008). A novel method for production of activated carbon from waste tea by
chemical activation with microwave energy. Fuel. 87(15-16), 3278-3285.
Yang H., Yan R., Chen H., Lee D. H. and Zheng C. (2007). Characteristics of hemicellulose, cellulose and lignin
pyrolysis. Fuel. 86(12-13), 1781-1788.
Yener, J., Kopac, T., Dogu, G. & Dogu, T. (2008) Dynamic analysis of sorption of Methylene Blue dye on granular
and powdered activated carbon, Chem. Eng. J. 144, 400–406
Yin C. (2012). Microwave-assisted pyrolysis of biomass for liquid biofuels production. Bioresour Technol. 120,
273-284.
Yu, L. & Zhong Q. (2006) Preparation of adsorbents made from sewage sludges for adsorption of organic materials
from wastewater, J.Hazard. Mat. B137, 359–366
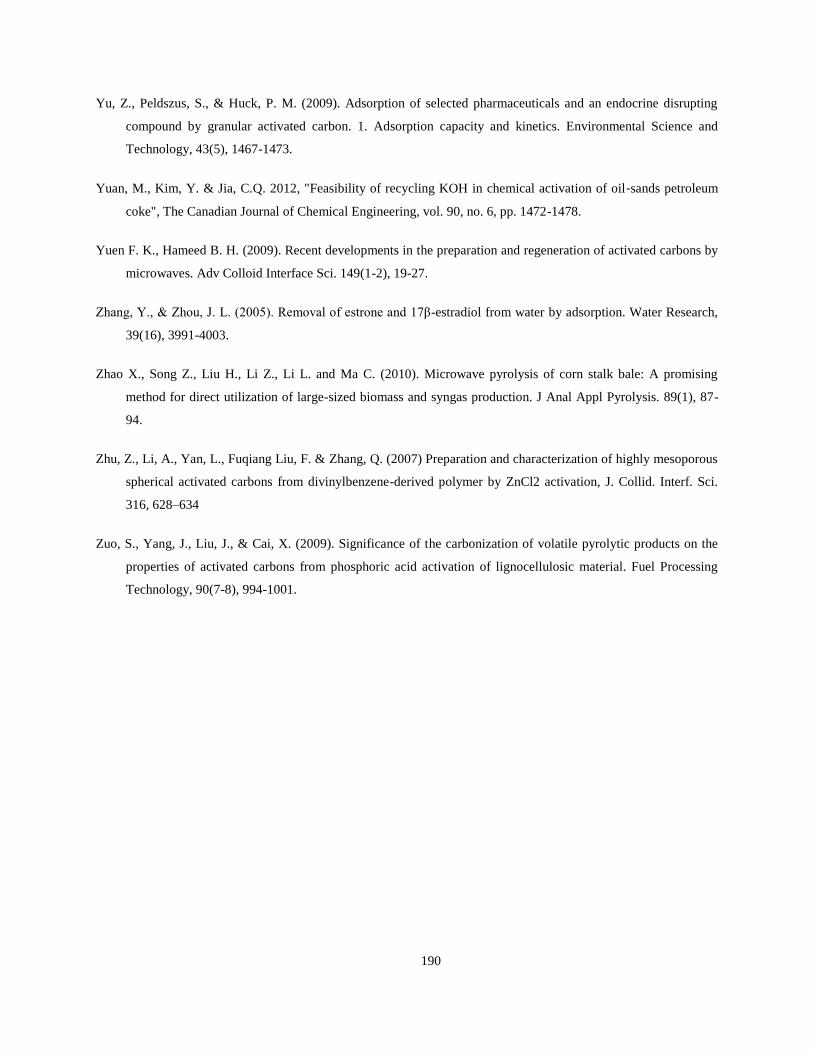
190
Yu, Z., Peldszus, S., & Huck, P. M. (2009). Adsorption of selected pharmaceuticals and an endocrine disrupting
compound by granular activated carbon. 1. Adsorption capacity and kinetics. Environmental Science and
Technology, 43(5), 1467-1473.
Yuan, M., Kim, Y. & Jia, C.Q. 2012, "Feasibility of recycling KOH in chemical activation of oil sands petroleum
coke", The Canadian Journal of Chemical Engineering, vol. 90, no. 6, pp. 1472-1478.
Yuen F. K., Hameed B. H. (2009). Recent developments in the preparation and regeneration of activated carbons by
microwaves. Adv Colloid Interface Sci. 149(1-2), 19-27.
Zhang, Y., Zhou, . . 2005). emoval of estrone and 17β-estradiol from water by adsorption. Water Research,
39(16), 3991-4003.
Zhao X., Song Z., Liu H., Li Z., Li L. and Ma C. (2010). Microwave pyrolysis of corn stalk bale: A promising
method for direct utilization of large-sized biomass and syngas production. J Anal Appl Pyrolysis. 89(1), 87-
94.
Zhu, Z., Li, A., Yan, L., Fuqiang Liu, F. & Zhang, Q. (2007) Preparation and characterization of highly mesoporous
spherical activated carbons from divinylbenzene-derived polymer by ZnCl2 activation, J. Collid. Interf. Sci.
316, 628–634
Zuo, S., Yang, J., Liu, J., & Cai, X. (2009). Significance of the carbonization of volatile pyrolytic products on the
properties of activated carbons from phosphoric acid activation of lignocellulosic material. Fuel Processing
Technology, 90(7-8), 994-1001.
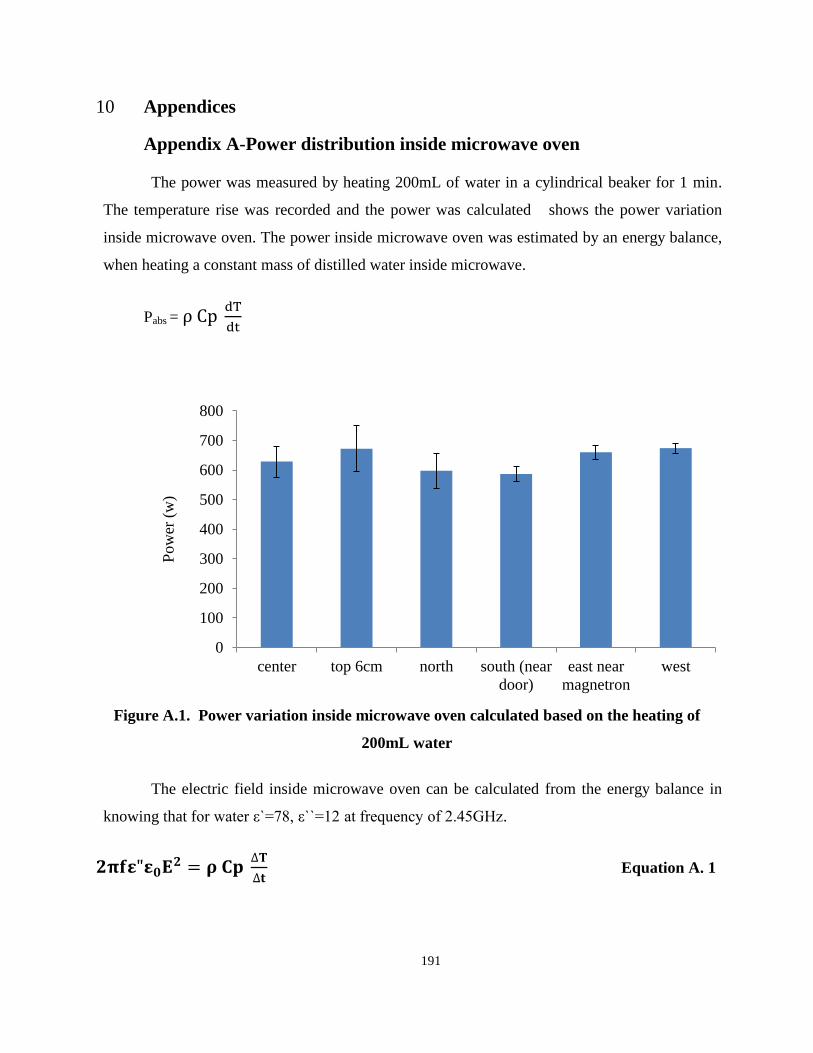
191
10 Appendices
Appendix A-Power distribution inside microwave oven
The power was measured by heating 200mL of water in a cylindrical beaker for 1 min.
The temperature rise was recorded and the power was calculated shows the power variation
inside microwave oven. The power inside microwave oven was estimated by an energy balance,
when heating a constant mass of distilled water inside microwave.
Pabs =
Figure A.1. Power variation inside microwave oven calculated based on the heating of
200mL water
The electric field inside microwave oven can be calculated from the energy balance in
knowing that for water ε`=78, ε``=12 at frequency of 2.45GHz.
Equation A. 1
0
100
200
300
400
500
600
700
800
center top 6cm north south (near
door)
east near
magnetron
west
Pow
er (
w)

192
where ρ and Cp are density and heat capacity of water, respectively. t is the heating time, Pabs
shows the power absorbed by the material, and 2πfE2 is related to microwave oven properties.
For our Panasonic microwave at the power of 1200W, a general absorbed power into the surface
of the material can be derived as:
P = 0.28 ε”
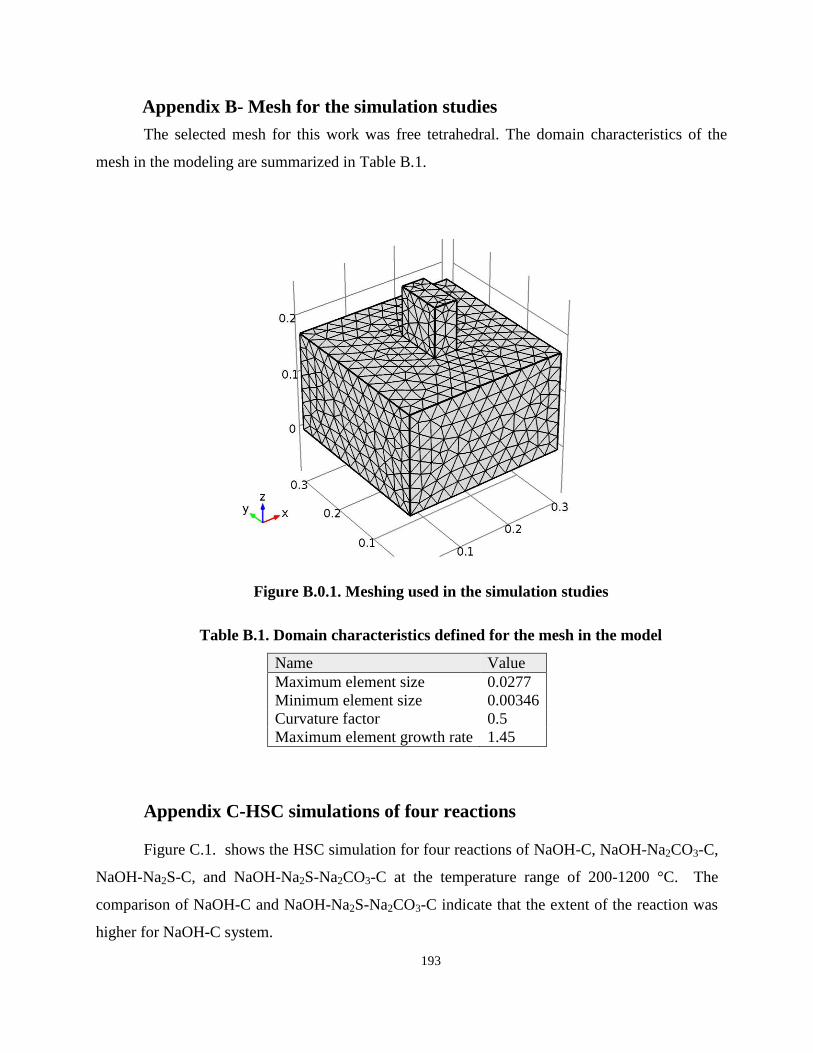
193
Appendix B- Mesh for the simulation studies
The selected mesh for this work was free tetrahedral. The domain characteristics of the
mesh in the modeling are summarized in Table B.1.
Figure B.0.1. Meshing used in the simulation studies
Table B.1. Domain characteristics defined for the mesh in the model
Name Value
Maximum element size 0.0277
Minimum element size 0.00346
Curvature factor 0.5
Maximum element growth rate 1.45
Appendix C-HSC simulations of four reactions
Figure C.1. shows the HSC simulation for four reactions of NaOH-C, NaOH-Na2CO3-C,
NaOH-Na2S-C, and NaOH-Na2S-Na2CO3-C at the temperature range of 200-1200 °C. The
comparison of NaOH-C and NaOH-Na2S-Na2CO3-C indicate that the extent of the reaction was
higher for NaOH-C system.
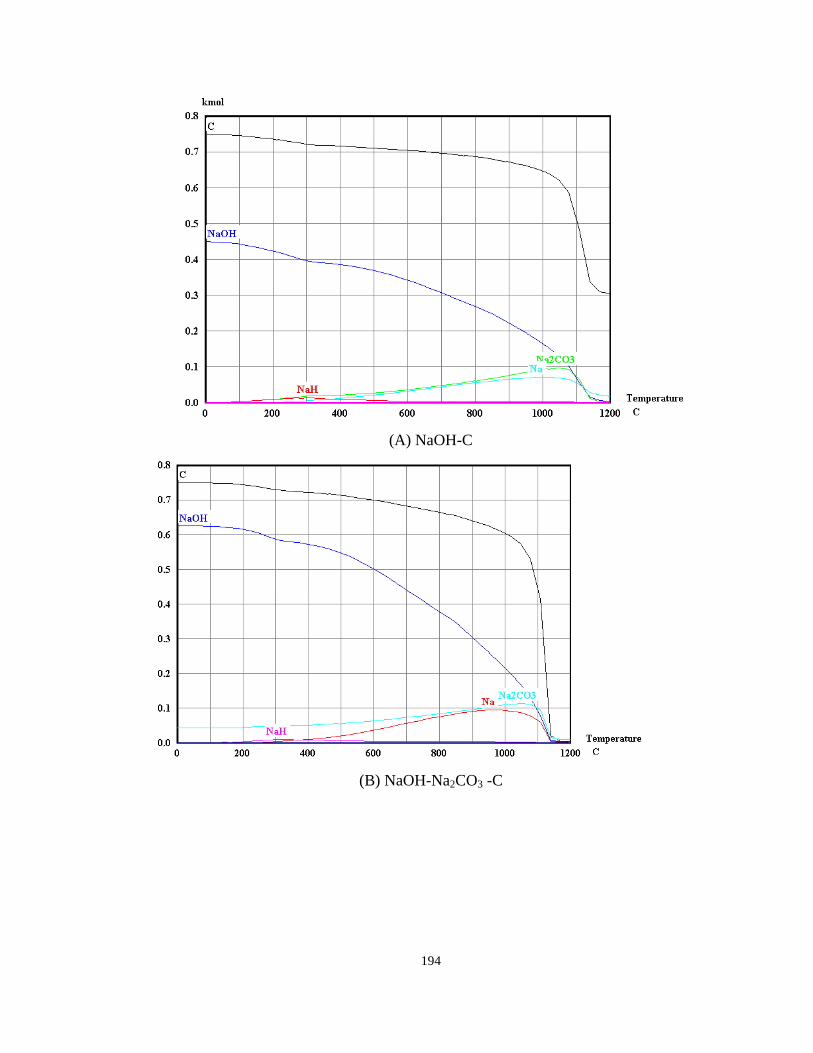
194
(A) NaOH-C
(B) NaOH-Na2CO3 -C
(D) White
liquor-C
(C)
NaOH-Na2S-C
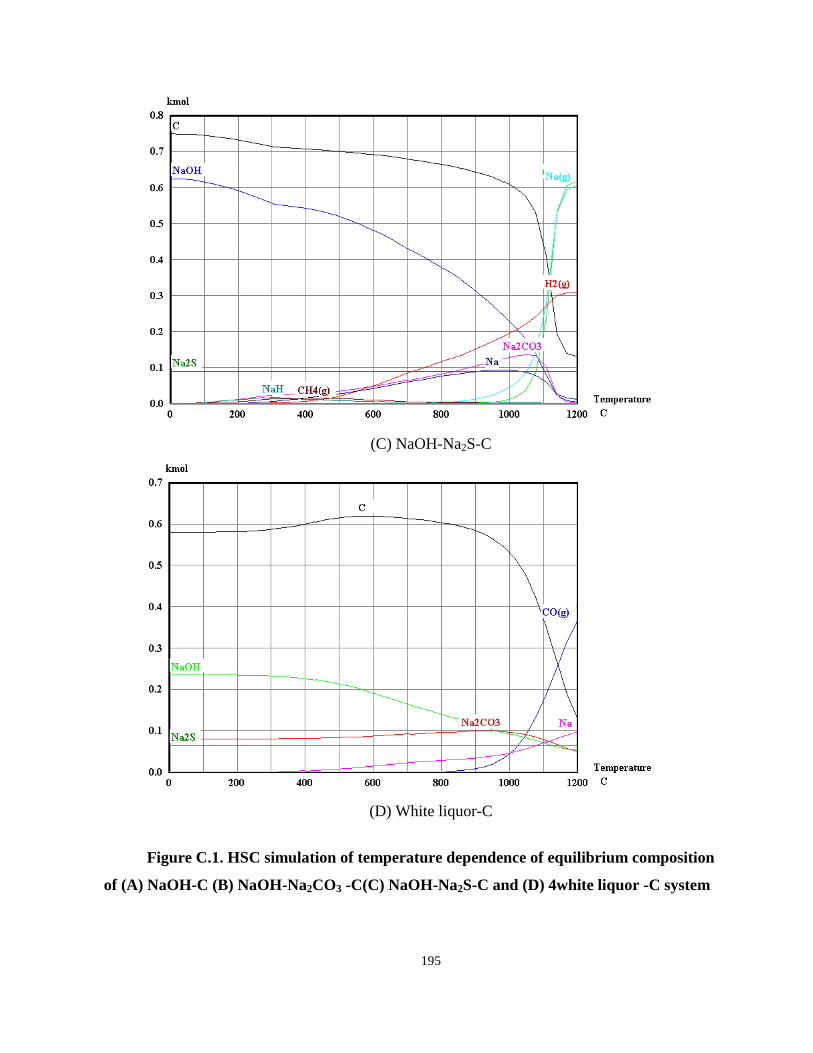
195
(C) NaOH-Na2S-C
(D) White liquor-C
Figure C.1. HSC simulation of temperature dependence of equilibrium composition
of (A) NaOH-C (B) NaOH-Na2CO3 -C(C) NaOH-Na2S-C and (D) 4white liquor -C system
196
Appendix D- Economic analyses of activated carbon production with
microwaves and conventional furnace
The conditions of activated carbon production in this work are very similar to the
conditions used in the economic analysis by Choy et al. (2005). In their work, activated carbon
was produced by a conventional furnace at 850°C with 70%wt KOH (Choy et al. 2005). Therefore
the manufacturing costs, working capital and general expenses were applied from their work.
In industrial microwave processing, magnetrons are the only consumable units and they
last longer than 5000h. If magnetron works with 65% power efficiency and an electrical unit costs
0.11$/Kw.h, it costs 1188$ when works for 6000 h. An example of industrial microwave dryer
unit needs 75 kW power. If the microwave power efficiency is 70%, the source requires 97.5kW
and the electrical input for microwave consume 108kW considering the electrical losses. The
annual cost of the microwave unit is 110500$, if the unit works 6000h per working year and the
price of the 0.11$/Kw.h (Hasna 2011)
.
In the designing of microwave assist activation unit, the working capital, indirect costs,
fixed operating cost, raw materials cost and general expenses were assumed to be the same as the
conventional activation unit. The utilities cost for conventional and microwave activation unit is
summarized in the Table D.1. Table D.1 and D.2 showed the price of the raw materials and the
major equipment’s. The sludge pyrolysis yield is considered to be 40% and it will be mixed with
KOH mass ratio of 2:1. The KOH is assumed to be recycled in this process with 10% loss every
day. Tables of D.3, D.4, and D.5 showed the total capital investment cost, total revenue and return
of investment, respectively.
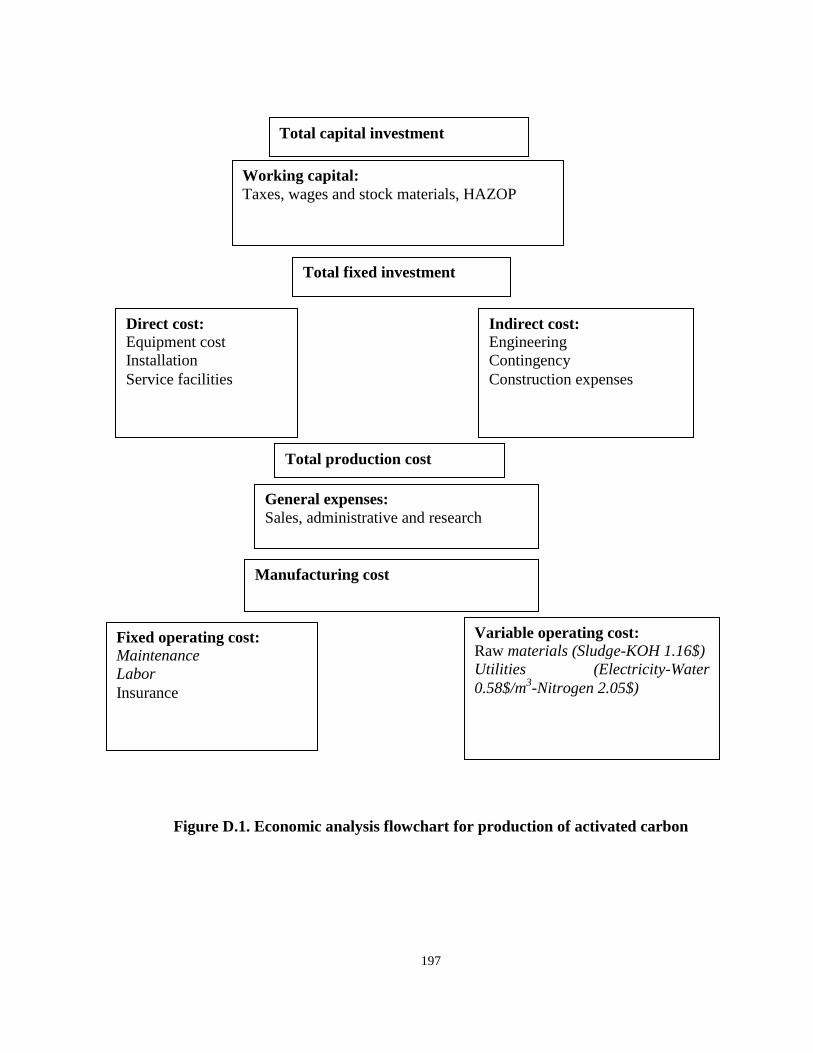
197
Figure D.1. Economic analysis flowchart for production of activated carbon
Total capital investment
Working capital:
Taxes, wages and stock materials, HAZOP
Total fixed investment
Direct cost:
Equipment cost
Installation
Service facilities
Indirect cost:
Engineering
Contingency
Construction expenses
Manufacturing cost
Fixed operating cost:
Maintenance
Labor
Insurance
Variable operating cost:
Raw materials (Sludge-KOH 1.16$)
Utilities (Electricity-Water
0.58$/m3-Nitrogen 2.05$)
Total production cost
General expenses:
Sales, administrative and research
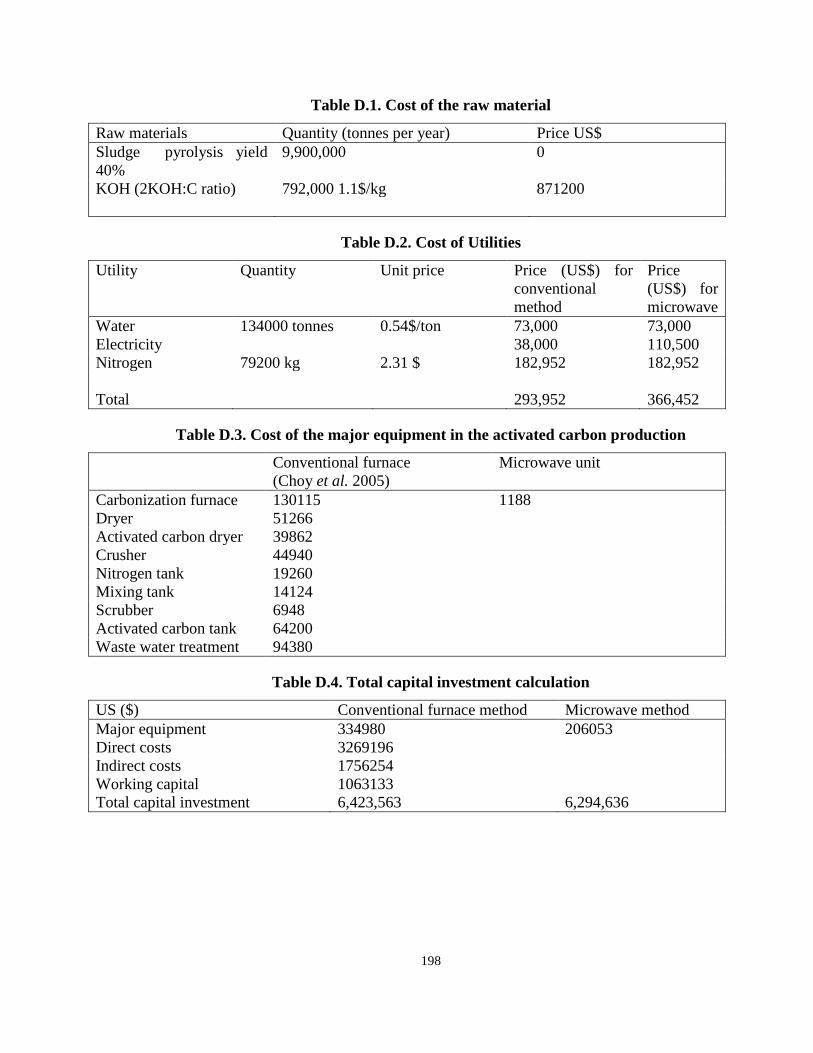
198
Table D.1. Cost of the raw material
Raw materials Quantity (tonnes per year) Price US$
Sludge pyrolysis yield
40%
9,900,000 0
KOH (2KOH:C ratio) 792,000 1.1$/kg 871200
Table D.2. Cost of Utilities
Utility Quantity Unit price Price (US$) for
conventional
method
Price
(US$) for
microwave
Water 134000 tonnes 0.54$/ton 73,000 73,000
Electricity 38,000 110,500
Nitrogen 79200 kg 2.31 $ 182,952 182,952
Total 293,952 366,452
Table D.3. Cost of the major equipment in the activated carbon production
Conventional furnace
(Choy et al. 2005)
Microwave unit
Carbonization furnace 130115 1188
Dryer 51266
39862
44940
19260
14124
6948
64200
94380
Activated carbon dryer
Crusher
Nitrogen tank
Mixing tank
Scrubber
Activated carbon tank
Waste water treatment
Table D.4. Total capital investment calculation
US ($) Conventional furnace method Microwave method
Major equipment 334980 206053
Direct costs 3269196
Indirect costs 1756254
Working capital 1063133
Total capital investment 6,423,563 6,294,636
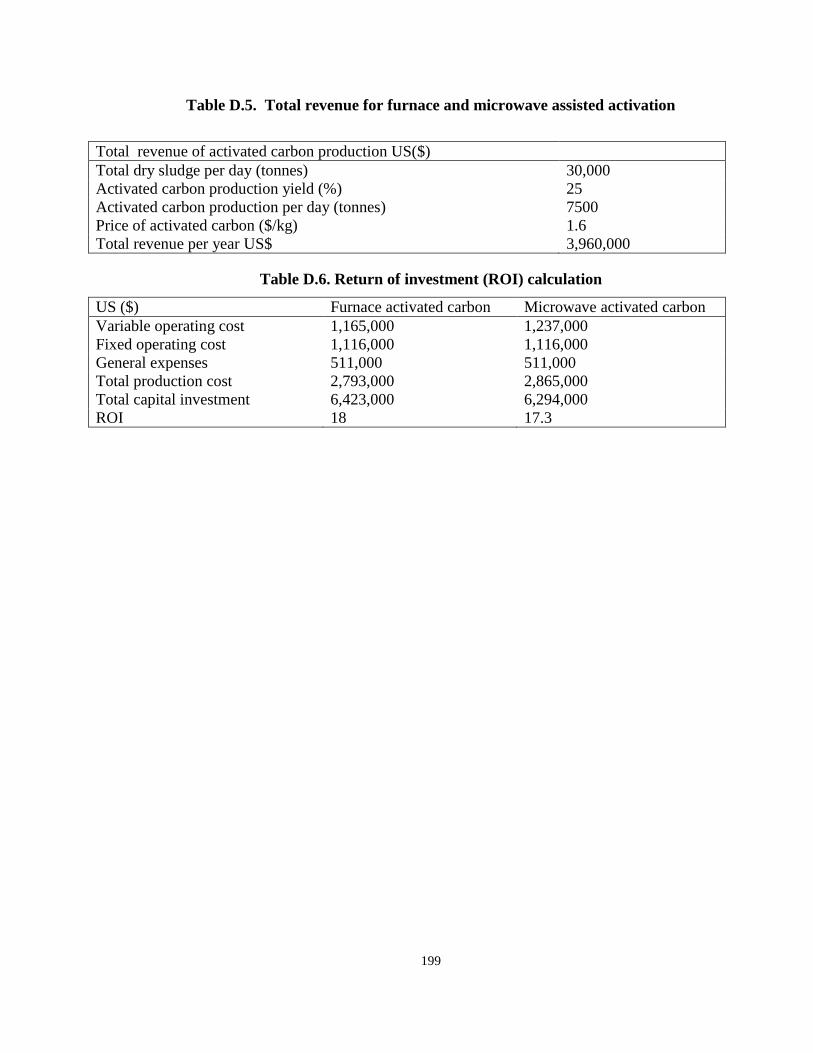
199
Table D.5. Total revenue for furnace and microwave assisted activation
Total revenue of activated carbon production US($)
Total dry sludge per day (tonnes) 30,000
Activated carbon production yield (%) 25
Activated carbon production per day (tonnes) 7500
Price of activated carbon ($/kg) 1.6
Total revenue per year US$ 3,960,000
Table D.6. Return of investment (ROI) calculation
US ($) Furnace activated carbon Microwave activated carbon
Variable operating cost 1,165,000 1,237,000
Fixed operating cost 1,116,000 1,116,000
General expenses 511,000 511,000
Total production cost 2,793,000 2,865,000
Total capital investment 6,423,000 6,294,000
ROI 18 17.3
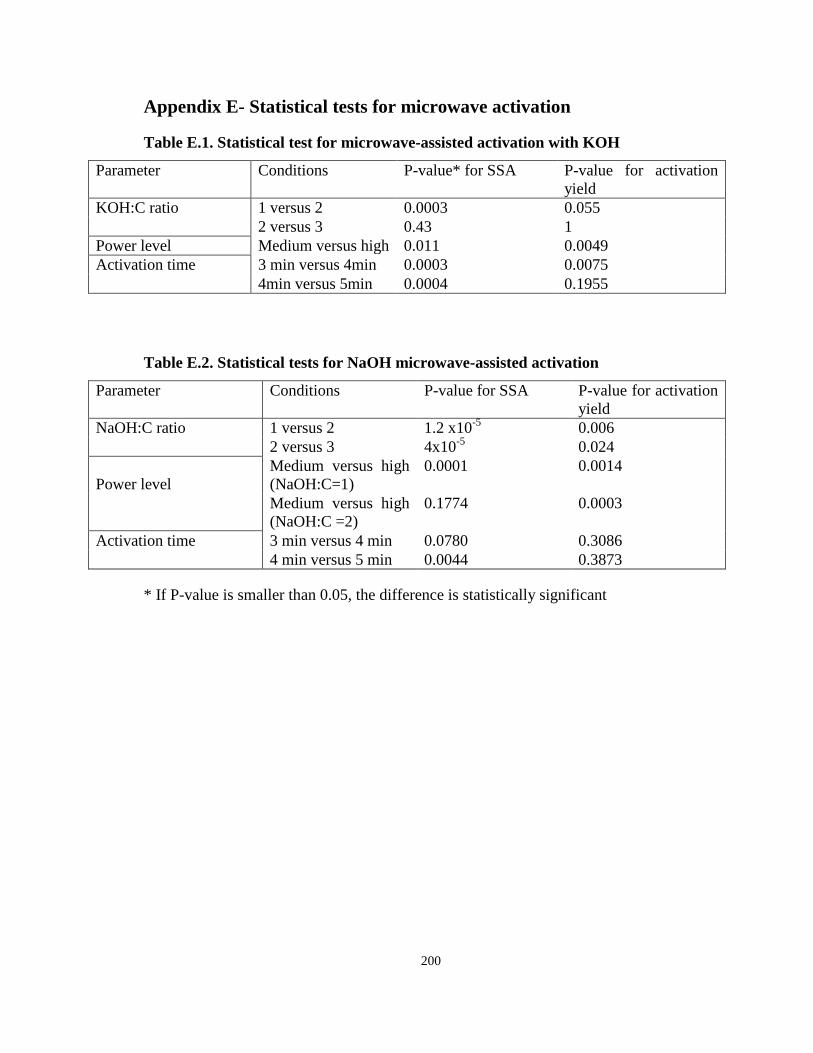
200
Appendix E- Statistical tests for microwave activation
Table E.1. Statistical test for microwave-assisted activation with KOH
Parameter Conditions P-value* for SSA P-value for activation
yield
KOH:C ratio 1 versus 2 0.0003 0.055 2 versus 3 0.43 1
Power level Medium versus high 0.011 0.0049 Activation time 3 min versus 4min 0.0003 0.0075
4min versus 5min 0.0004 0.1955
Table E.2. Statistical tests for NaOH microwave-assisted activation
Parameter Conditions P-value for SSA P-value for activation
yield
NaOH:C ratio 1 versus 2 1.2 x10⁻⁵ 0.006
2 versus 3 4x10⁻⁵ 0.024
Power level
Medium versus high
(NaOH:C=1) 0.0001 0.0014
Medium versus high
(NaOH:C =2) 0.1774 0.0003
Activation time 3 min versus 4 min 0.0780 0.3086 4 min versus 5 min 0.0044 0.3873
* If P-value is smaller than 0.05, the difference is statistically significant
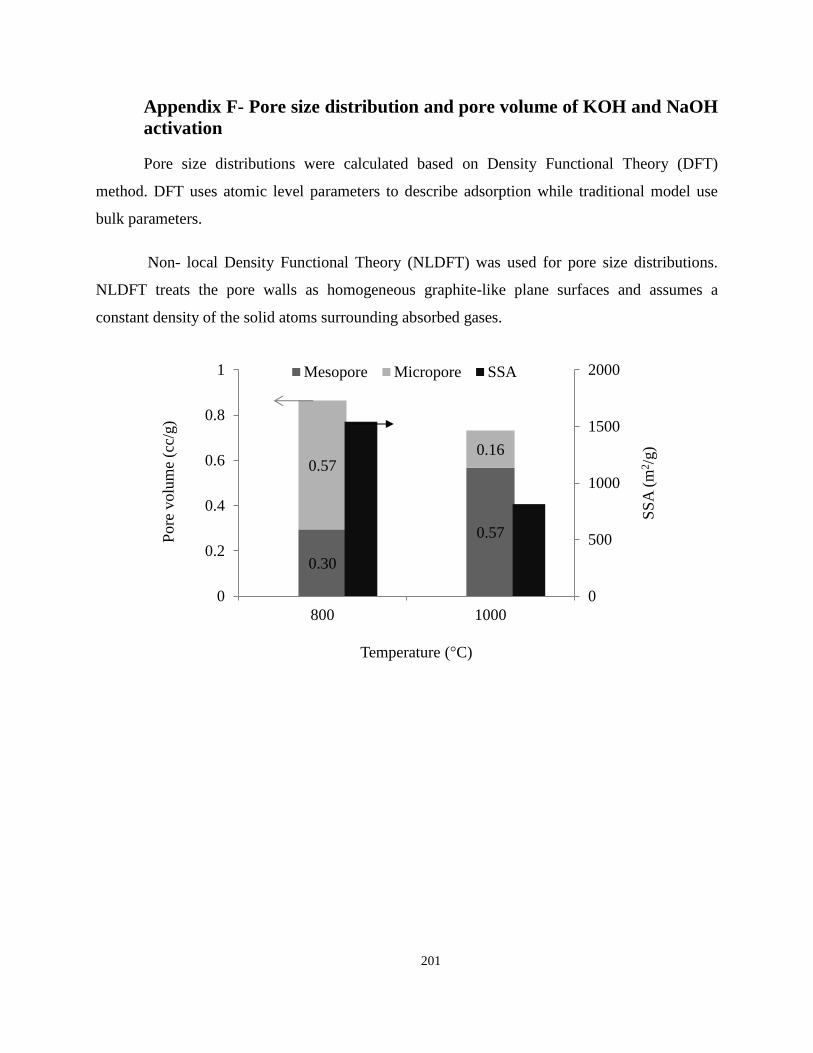
201
Appendix F- Pore size distribution and pore volume of KOH and NaOH
activation
Pore size distributions were calculated based on Density Functional Theory (DFT)
method. DFT uses atomic level parameters to describe adsorption while traditional model use
bulk parameters.
Non- local Density Functional Theory (NLDFT) was used for pore size distributions.
NLDFT treats the pore walls as homogeneous graphite-like plane surfaces and assumes a
constant density of the solid atoms surrounding absorbed gases.
0.30
0.57
0.57 0.16
0
500
1000
1500
2000
0
0.2
0.4
0.6
0.8
1
800 1000
SS
A (
m2/g
)
Pore
volu
me
(cc/
g)
Temperature (°C)
Mesopore Micropore SSA
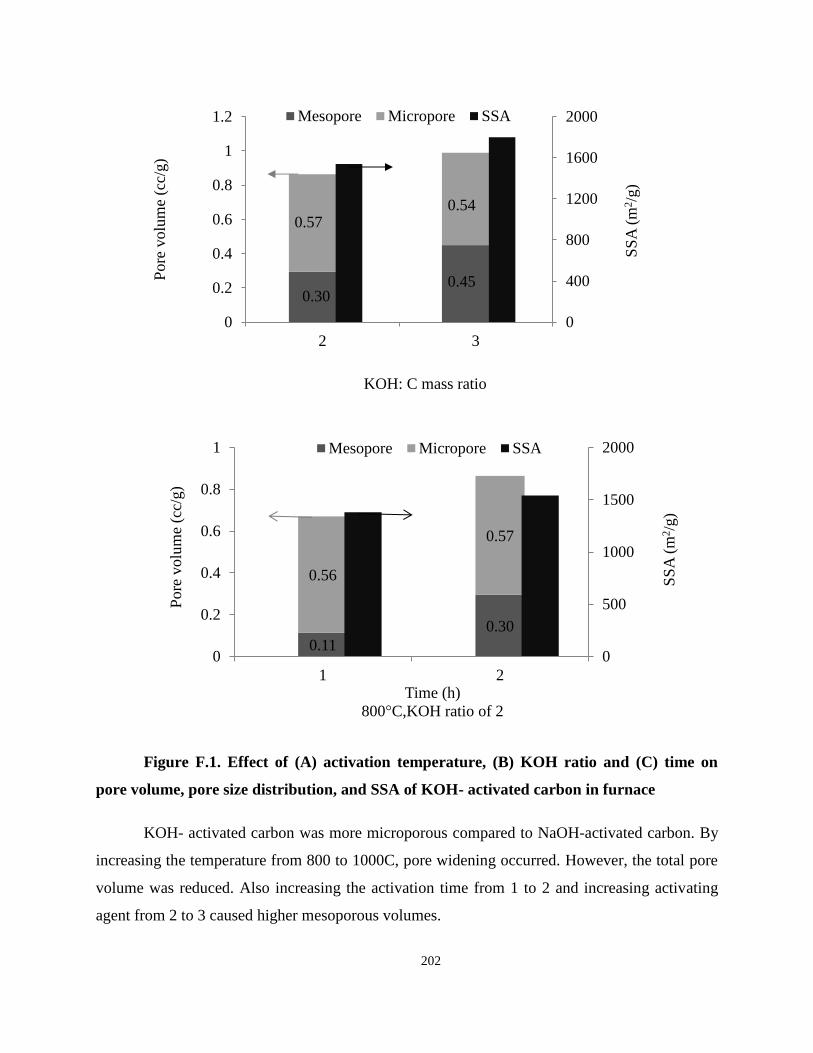
202
Figure F.1. Effect of (A) activation temperature, (B) KOH ratio and (C) time on
pore volume, pore size distribution, and SSA of KOH- activated carbon in furnace
KOH- activated carbon was more microporous compared to NaOH-activated carbon. By
increasing the temperature from 800 to 1000C, pore widening occurred. However, the total pore
volume was reduced. Also increasing the activation time from 1 to 2 and increasing activating
agent from 2 to 3 caused higher mesoporous volumes.
0.30 0.45
0.57 0.54
0
400
800
1200
1600
2000
0
0.2
0.4
0.6
0.8
1
1.2
2 3
SS
A (
m2/g
)
Pore
volu
me
(cc/
g)
KOH: C mass ratio
Mesopore Micropore SSA
0.11
0.30
0.56
0.57
0
500
1000
1500
2000
0
0.2
0.4
0.6
0.8
1
1 2S
SA
(m
2/g
)
Pore
volu
me
(cc/
g)
Time (h)
800°C,KOH ratio of 2
Mesopore Micropore SSA
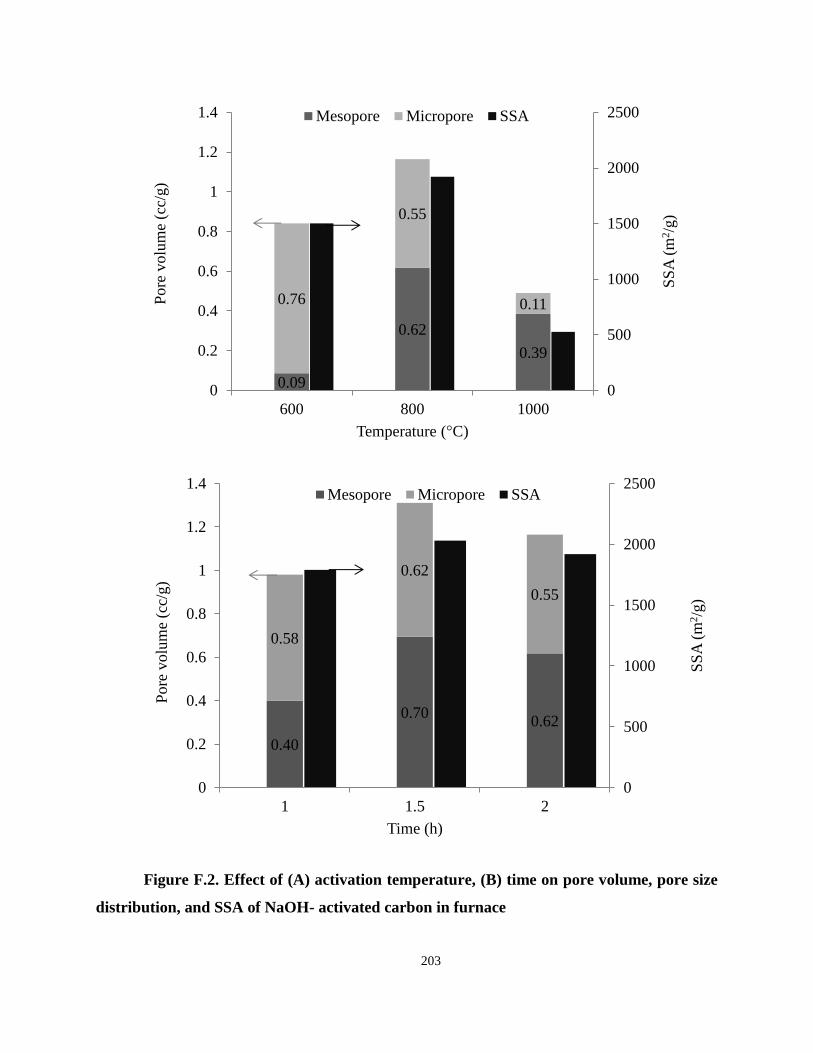
203
Figure F.2. Effect of (A) activation temperature, (B) time on pore volume, pore size
distribution, and SSA of NaOH- activated carbon in furnace
0.09
0.62
0.39
0.76
0.55
0.11
0
500
1000
1500
2000
2500
0
0.2
0.4
0.6
0.8
1
1.2
1.4
600 800 1000
SS
A (
m2/g
)
Pore
volu
me
(cc/
g)
Temperature (°C)
Mesopore Micropore SSA
0.40
0.70 0.62
0.58
0.62
0.55
0
500
1000
1500
2000
2500
0
0.2
0.4
0.6
0.8
1
1.2
1.4
1 1.5 2
SS
A (
m2/g
)
Pore
volu
me
(cc/
g)
Time (h)
Mesopore Micropore SSA

204
The NaOH-activated carbon contains both mesoporous and microporous. The activation
conditions affect the pore size distribution, especially the activation temperature. By increasing
the temperature from 600 to 800°C, micropore widening occurred and mesopore volume was
increased. Further increase to 1000°C destroyed both micro and mesopores. Porosity was also
affected by activation time by a lesser extent.