Embed Size (px)
Citation preview


1
Microtechnologies
for Biology and Healthcare
Leti is an institute of CEA, a French research-and-technology organization with activities in energy, IT, healthcare, defence and security. By creating innovation and transferring it to industry, Leti is the bridge between basic research and production of micro- and nanotechnologies that improve the lives of people around the world. Backed by its portfolio of 2,200 patents, Leti partners with large industrials, SMEs and startups to tailor advanced solutions that strengthen their competitive positions. It has launched more than 50 startups. Its 8,000m² of new-generation cleanroom space feature 200mm and 300mm wafer processing of micro and nano solutions for applications ranging from space to smart devices. Leti’s staff of more than 1,700 includes 200 assignees from partner companies. Leti is based in Grenoble, France, and has offices in Silicon Valley, Calif., and Tokyo. Visit www.leti.fr for more information Microtechnologies for Biology and Healthcare research activities are mainly dedicated to Medical Imaging, In Vitro Diagnostic, Biosensors and Environment Monitoring fields of applications. These activities cover the design, integration and qualification of systems comprising sensors (for radiation, biochemical, neural activity or motion detection) or actuators, analog front end electronics, acquisition system, signal processing algorithms, data management and control software. The design and fabrication of microfluidic components with embedded biological functions and associated systems is also addressed. This set of R&D works is achieved through strong partnerships with academic or industrial partners ranging from SMEs to large international companies. Bridging the gap between basic research and industrial developments, the collaborative projects main goal, is to introduce scientific achievements into innovative and successful new products.


3
Edito 5 Key figures 7 Scientific activity 9 Radiation Detection 11 Optical Imaging 21 Microfluidics 31 Sensors 41 Neural Interfaces 51 Nanotechnologies 55 PhD Degree Awarded 61


5
"Health is a state of complete physical, mental and social well-being and not merely the absence of disease or infirmity". This definition, given by the Worldwide Health Organization when created in 1946, is very inclusive and englobes domains such as environment, wellbeing and security. The DTBS, in collaboration with Clinatec, other departments of CEA and more widely with its academic and clinical partners, addresses the challenge of health at large (including animal health). In the plan to build the « new industrial France », presented by the French government in 2013, one concerns the Medical Device Industry. This industry is the most innovative in terms of patents but its growth is not the one expected, showing difficulties to transform innovation in products. To face this challenge, we got involved in 2014 in several structuring projects: - we launched a medical device prototyping platform, enabling to deliver prototypes in conformity with 13485 rules. The offer covers, the conception, development, fabrication, pre-clinical and clinical validation and industrialization of innovative medical devices. A pilot phase is actually running on 2 projects, with a certification planned end 2016. - we actively participate, with other CEA departments to the European EIT Health project, bringing together 150 leading European actors from industry, research and education to create new tools fostering the development of innovations for healthy living and active ageing. As introduce last year, we continue to work closely with designers to be able to deliver prototypes ready to transfer to the industry (ex. Microdiff). The main objectives of next year remain miniaturization, multi-modality, prototypes “ready to transfer”, going towards low-cost products and connected devices (m-health, e-health).
Daniel Vellou, Head of Microtechnologies for
Biology and Healthcare Division


7
133 permanent researchers 88 PhDs, Post-docs and short
term contracts
56 Book Chapters & Journals 68 Conferences & workshops
Clean rooms dedicated to surface chemistry and biochemistry
A dedicated chemistry platform for synthesis and formulation
35 Patents filed in 2014 387 Patents Portfolio


9
Publications • 56 book chapters and journals, 68 conferences and worshop • Main papers: - S. Vinjimore Kesavan, F. Momey, O. Cioni, B. David-
Watine, N. Dubrulle, S. Shorte, E. Sulpice, D. Freida, B. Chalmond, J. M. Dinten, X. Gidrol & C. Allier,” High-throughput monitoring of major cell functions by means of lensfree video microscopy”, Nature Scientific Reports - Sci Rep. 2014 Aug 6,
• Quemerais MA, Doron M, Dutrech F., Melki V., Franc S., Antonakios M., Charpentier G., Hanaire H., Benhamou PY.; Diabeloop Consortium, “Preliminary evaluation of a new semi-closed loop insulin therapy system over the prandial period in adult patients with type 1 diabetes : the WP6.0 Diabeloop study”, Journal of Diabetes Science and Technology. Main conferences: IEEE-MIC-NSS-RTSD, BIOS, MicroTAS, Material Research Society
Prize and Awards • Séverine Vignoud, project leader at CEA-Leti, was awarded the
prize for Innovating Technologies during POLLUTEC for the development of a portable system for water quality analysis.
• Agathe Puszka is awarded the « innovation » prize for her thesis in the field of Biomedical Engineering 2014
• Marjorie Vrignaud received the best poster award at ISGS (International Sol-gel Society) Summer School
Experts • 1 Research Director, 9 Senior Experts, 17 Experts
International Collaborations • USA: Wake Forest Institut-Winston-Salem, MIT-Cambridge,
Chicago Diabete Institut, University of California-Los Angeles, Lawrence Berkeley National Laboratory, Michigan University, Brookhaven National Laboratory
• Netherland: Universitair Medisch Centrum Utrecht • Belgium: Université Catholique de Louvain • Germany: Charité Berlin, Freiburg Univsersity • Switzerland: Hopitaux Universitaires de Genève • Italy: Pisa University, Bologne University, INFN Pisa, Consiglio
Nazionale delle Ricerche Lecce • England: Surrey University • Czech Republic: Prague Institute of Physics • Japan: Hosei University, Keio University


Radiation detection
X-ray diffraction
Multi energy X-ray Imaging
Gamma ray Imaging
IC for X-ray medical Imaging
Fight against counterfeit
1

12
––– X-Ray Diffraction (XRD) is becoming a prevailing technique to analyze materials in many contexts. Unlike classical X-ray techniques, diffraction can provide very specific signature linked to the atomic and molecular structure of materials. Consequently, this technique is well suited to identify
materials both under polycrystalline form and under liquid or amorphous state. Two different sub-techniques of X-ray diffraction exist: the Angular Dispersive (ADXRD) and Energy Dispersive X-ray Diffraction (EDXRD) techniques, depending on the parameter chosen to scan the Bragg law (respectively the angle or the energy). For speed and on-line material analysis or detection, the EDXRD technique is preferably used: it consists in working at a fixed low scatter angle (<5°) thanks to a double collimation, and with a polychromatic X-ray beam to scan a wide range of energies. Compared to ADXRD, advantages of EDXRD are the possible use of powerful X-ray tubes and the limited size of the detector module, which allows parallelization to inspect an entire object in a reasonable time. Indeed, EDXRD systems can use multi-pixelated detectors to inspect a 2D plan of an object in one shot. However, a constraint for EDXRD is to use energy resolved detectors.
Figure 1: Experimental EDXRD bench
In this context, The Detector Laboratory (LDET) proposes a set of tools, technologies and skills to study the interest of
EDXRD for any specified applications. Firstly, an experimental EDXRD lab bench, with flexible geometry (collimation, angle, and distances) is available (fig 1). The detectors used in this EDXRD system corresponds to a new detector technology developed in the laboratory and based
on room temperature semiconductor crystal (CdTe/CZT), combined with optimized low noise front-end electronics to provide high energy resolved EDXRD spectra [2]. A simulation package has also been developed, in order to model the whole diffraction chain (including geometry, collimators, detectors, and diffraction physics) to dimension any new EDXRD system [3]. Finally, the LDET laboratory has been working on specific detector-level and spectrometric material discrimination processing methods (algorithms) to provide the signature of each material with the best accuracy.
Figure 2: Diffraction spectra measured on the EDXRD experimental bench for different kinds of materials and applications.
Potential applications of EDXRD (fig 2) are: . Security: Detection of dangerous items, solid explosives (TNT, TATP…) or liquids (nitromethane, H2O2…). . Counterfeit: Identification of counterfeit medicine. . Medical: Detection and characterization of tumors in breast imaging
X-Ray tube spectrum
Diffraction signature (ex : sugar)
EDXRD spectrum
X-Ray tube, 160kV
Primary collimatorSecondary collimator
Object
Spectrometricdetector (CZT)
GazoleAcetoneWater
NaClO4KNO3NH4NO3
AluminumCopper
Polycrystals (metals) Amorphous (liquids)Polycrystals (powders) Mixed (drugs)
AlkaSeltzer®FexofenadineDafalgan®EsomeprazoleMalarone®Aspirine
Energy (keV) Energy (keV) Energy (keV) Energy (keV)
GazoleAcetoneWater
NaClO4KNO3NH4NO3
AluminumCopper
Polycrystals (metals) Amorphous (liquids)Polycrystals (powders) Mixed (drugs)
AlkaSeltzer®FexofenadineDafalgan®EsomeprazoleMalarone®Aspirine
Energy (keV) Energy (keV) Energy (keV) Energy (keV)
Research topics: X-Ray diffraction, analysis material, CdZnTe detectors
J. Tabary, C. Paulus, R. Terrier, L. Verger
ABSTRACT: The Detector Laboratory (LDET) of the LETI develops systems exploiting the Energy Dispersive X-Ray Diffraction (EDXRD) technique to identify materials in applications such as
security, counterfeit and medicine. For this, the laboratory uses various technologies, tools and skills developed internally: dedicated CdTe/CZT spectrometric detectors, EDXRD simulation tools, material discrimination processing methods and experimental bench.
Energy Dispersive X-Ray Diffraction for On-line Material Analysis
Related Publications:
[1] B. Ghammraoui, “Etude d’un système d’identification de matériaux par diffraction de rayons X à partir d’acquisitions spectrométriques
multipixels”, Ph. D. dissertation, INSA Lyon, 2012.
[2] G. Montémont, S. Lux, O. Monnet, S. Stanchina, and L. Verger, “Evaluation of a CZT gamma-ray detection module concept for SPECT,” in 2012 IEEE Nuclear Science Symposium and Medical Imaging Conference (NSS/MIC), 2012, pp. 4091–4097.
[3] B. Ghammraoui., J. Tabary, S. Pouget, C. Paulus, V. Moulin, L. Verger, Ph. Duvauchelle, “New software to model energy dispersive X-
ray diffraction in polycristalline materials”, in Nuclear Intruments and Methods in Physics Research A 664, pp. 324–331, 2012.

13
–––
X-ray coherent scattering is a way to determine the molecular and atomic structure of both crystalline and amorphous matter. Therefore, it is possible to distinguish different materials if their scattering signature (form factor) is accurately measured. Thus, many applications can be considered, ranging from security to healthcare. Two approaches are of particular interest: Angular-Dispersive X-Ray Diffraction (ADXRD) where the scattering pattern is measured at different angles with monochromatic x-rays, and Energy-Dispersive X-Ray Diffraction (EDXRD) where, on the contrary, the scattering pattern is measured at one fixed angle with polychromatic x-rays and a spectrometric detector [1]. The study presented here aims at testing the feasibility of characterizing and imaging plastic cylinders (PMMA, PTFE and PE) in a box filled with water with a system based on EDXRD. The configuration of the experiment is presented in Fig 1. The energy-resolved CZT detector, pixelated with 4x4 elements of 2,5x2,5 mm², was developed in our lab (LDET laboratory at CEA LETI). The box was translated along the X direction by 5 cm in 25 steps of 2 mm. The tube parameters were 160 kV and 11.25 mA. For each step the exposure time was 4 min.
Figure 1: Schematic illustration of the experiment
Some studies developed techniques based on CT recons-truction or 2D translations in order to obtain 2D images of their samples. We chose to benefit from subpixelation technique developed in our lab to sample the Z dimension into 16 elements over the length of the box (8 cm) [2].
Each spectrum was processed with a reference material algorithm in order to estimate the corresponding form factor, which was decomposed into a linear combination of the theoretical signatures of the four materials. For example, the map of the obtained PE coefficients is presented in Fig 2. Then, the coefficients allow us to assign a material to each image pixel (Fig 3).
Figure 2: Map of PE coefficients
Figure 3: Image obtained after processing
The overlapping on the inspected volumes seen by the subpixels makes the cylinders seem larger than they are. There is a necessity to work on some relevant processing to correct this issue. These results seem promising and encourage us to pursue this experiment in conditions closer to medical especially in terms of collimation and dimensions.
Research topics: X-ray Diffusion, Imaging, Material Analysis
D. Barbes, J. Tabary, C. Paulus, J-L. Hazemann (Institut Néel/CNRS)
ABSTRACT: This paper presents a method for material analysis and imaging based on Energy-Dispersive X-Ray Diffraction (EDXRD). The scattering spectrum is measured with a pixelated
energy-resolved CdZnTe detector. This kind of detector and the associated data processing allow then, on one hand, to use subpixelation techniques in order to sample the analyzed object in the incident beam direction, and, on the other hand, to evaluate the scattering signatures of the samples and then recognize the materials contained in the object. The main applications are medical imaging and security
Energy-Dispersive X-Ray Diffraction 2D imaging using a spatially- and energy-resolved CZT detector
Related Publications :
[1] B. Ghammraoui, CEA PhD Thesis, "Etude d'un système d'identification de matériaux par diffraction de rayons X à partir d'acquisitions
spectrométriques multi-pixels", 2012.
[2] G. Montémont, S. Lux, O. Monnet, S. Stanchina, and L. Verger, “Evaluation of a CZT gamma-ray detection module concept for SPECT,” in 2012 IEEE Nuclear Science Symposium and Medical Imaging Conference (NSS/MIC), 2012, pp. 4091–4097.

14
––– X-ray diffraction patterns depend on photon momentum transfer 𝜒 = 𝐸 sin(𝜃 2)⁄ /ℎ𝑐, where E is the photon energy, 𝜃
the diffraction angle, h Planck’s constant and c the speed of light. Thus, diffraction spectra can be measured in two ways: angular dispersive X-ray diffraction (ADXRD) and energy dispersive X-ray diffraction (EDXRD). EDXRD could only be realized alongside the development of X-ray spectroscopic detectors [1]. Scattered intensity is measured at a fixed nominal scattering angle Θ across a range of
energies. An example of a classical EDXRD setup can be seen in figure 1. Both, the finite energy resolution of the detector and the finite angular resolution of the system add energy variant blurring to the observed diffraction spectrum. In order to restore material characteristic information, we propose an inversion method based on a physical model of our EDXRD imaging system. The choice of the scattering angle combined with the energy range of the incident X-ray spectrum determines the range of observable 𝜒 during a measurement. In some cases, accessing a larger
range of 𝜒 by combining EDXRD acquisitions at different
diffraction angles in one reconstructed spectrum might be of interest. In the present work, we compare the performance of a mono- and a multi-angle EDXRD system by means of detective quantum efficiency (DQE) calculations. We propose a multi-angle reconstruction method, which was tested on simulated and experimental X-ray diffraction spectra. A measured X-ray diffraction spectrum 𝑚(𝐸𝑑) blurred by the
different elements of an EDXRD system can be described by the following expression:
𝑚(𝐸𝑑 , Θ) = ∑ ℛ(𝐸𝑑 , Θ, 𝜒) ∙ 𝑓(𝜒)𝜒
,
where 𝐸𝑑 is the detected energy, 𝑓 the sample's scattering
signature and ℛ the global system response taking into
account system blurring by the collimation system, the detector response, the incident spectrum and sample absorption.
Figure 1: Schematic representation of a typical EDXRD setup.
Our goal is to estimate the theoretical diffraction spectrum 𝑓
from our measurement 𝑚 while knowing ℛ. This
corresponds to a typical inverse problem which we propose to solve by a maximum likelihood expectation maximization (MLEM) approach without prior:
𝑓𝑛+1(𝜒) =𝑓𝑛(𝜒)
∑ ℛ(𝐸𝑑, Θ, 𝜒)𝐸𝑑,Θ
∑ (ℛ(𝐸𝑑 , Θ, 𝜒)𝑚(𝐸𝑑, Θ)
∑ 𝑓𝑛(𝜒′)ℛ(𝐸𝑑, Θ, 𝜒′)𝜒′
)
𝐸𝑑,Θ
DQE comparison of mono-angle (2° and 5°) and multi-angle (2-5° at o.1° step) systems showed that multi-angle configuration permits to cover a significantly larger 𝜒-range
than mono-angle systems. Furthermore, the system sensitivity is smoothed and there is no hypersensitivity due to the source's characteristic rays as for mono-angle systems. Resolution is intermediate between the two mono-angle systems.
Figure 2: Comparison of mono- and multi-angle reconstructions
These results are confirmed by comparing the reconstructed scattering signatures (Fig. 2). Almost all salt peaks could be restored using a multi-angle system, whereas mono-angle systems did not allow restoration of all peaks at once. The reconstructed signature at 5° presents an additional peak (𝜒 = 2.2 𝑛𝑚−1) which is due to background accentuated by
hypersensitivity effect of the source's characteristic rays. Multi-angle approach will be interesting if the 𝜒-range to
cover is not known for the inspected material or if the sample contains different materials requiring a large range of momentum transfer. Smoothing of the adverse effect of the source's characteristic rays is useful to avoid additional background scattering peaks and might also be interesting in the case of amorphous materials presenting a continuous X-ray scattering signature.
Research topics: X-ray diffraction, Spectroscopic detector, Reconstruction, DQE
F. Marticke, C. Paulus, G. Montémont, O. Michel, J. I. Mars, L. Verger
ABSTRACT: Energy Dispersive X-Ray Diffraction (EDXRD) spectra are classically measured at one single fixed scattering angle. Reconstruction allows restoration of material proper information
without system blurring. This paper proposes to combine EDXRD spectra at different scattering angles in order to improve reconstruction results. We present an iterative multi-angle reconstruction method. The algorithm was tested on simulated and experimental salt (NaCl) spectra.
Multi-angle reconstruction of energy dispersive x-ray diffraction spectra
Related Publications:
[1] Verger L., Gentet M., and Gerfault, L., "Performance and perspectives of a CdZnTe-based gamma camera for medical imaging". IEEE
Transactions on Nuclear Science, 2004
[2] F. Marticke, C. Paulus, G. Montémont, O. J.J. Michel, J.I. Mars, L. Verger, "Multi Angle reconstruction of energy dispersive X-Ray diffraction spectra", proc. of WHISPERS'2014, Lausanne, Suisse, 2014.

15
––– The recently emerged room temperature semiconductor photon counting detectors allow the measurement of photons classified in energy channels, the number of which varies from a few bins, typically 2 to 6, to a hundred ~1 keV width bins, depending on the electronic circuit [1]. This new
technology allows the development of multi-energy imaging both in radiographic and tomographic acquisition modes with the ability to differentiate present material components and estimate their equivalent thicknesses and relative ratios (bone, soft tissue, contrast agent enhanced tissue, etc.) by using a single acquisition. However, these techniques require a high degree of accuracy in the images (low bias, low noise, etc.), especially for materials close in terms of attenuation. It is well known that x-ray scattering disturbs quantification. The photon flux received by the detector is actually the sum of two signals: the primary flux, coming linearly from the detector and measuring the photons that have not been stopped or deviated by any interaction, and the scattered radiation, the interacted photons that had been modified in direction and energy (Compton interaction). Thus, scattering induces a loss of contrast and, more importantly, a bias in radiographic material imaging and artefacts in CT. The purpose of the present study was to evaluate the disturbances induced by scattered radiation in multi-energy radiography, more precisely, when applying a material decomposition approach commonly used in radiography or projection-based CT. Simulation software developed in the lab [2], [3] was applied on an elliptical cylinder water phantom with different material inserts (Figure 1). Varying scatter levels were considered: 10% 50% and 100% (100% corresponds to an SPR of 1.32). From Figure 1 the disturbance caused by the presence of scatter in the images, which were subjected to material decomposition, manifests itself not only in terms of thickness sub-estimation for water and over-estimation for cortical bone but also in terms of spatial disturbances. Additional examination of water and cortical bone thickness images by tracing images profiles and comparing them to the true thickness expected in that area further confirms the significant impact of scattered radiation on material thickness estimation (Figure 2). With an SPR of 1.32, the average error in cortical bone and water thickness estimates was 157.1% and 74.1%, respectively. Based on qualitative and quantitative evaluation of the data resulting from an application of a material decomposition procedure on multi-
energy images it was concluded that a scatter correction method adapted for multi-energy data is essential to fully benefit from multi-energy information in case of a non-collimated geometry.
Figure 1: Water (left) and cortical bone (right) thickness images.
Images (a)-(b) and (c)-(d) correspond to cases with and without
scatter in images subjected for decomposition. Profile locations are
marked in blue and red for water and cortical bone, respectively.
Figure 2: Water and cortical bone thickness profiles taken from the
corresponding images in Fig. 1 compared to the true thickness of the
respective material.
.
0
0.5
1
1.5
2
2.5
3
3.5
4
0
2
4
6
8
10
12
14
16
18
20
0
2
4
6
8
10
12
14
16
18
20
0
0.5
1
1.5
2
2.5
3
3.5
4(a) (b)
(c) (d)
0 64 128 192 256 320 384 448 5120
2
4
6
8
10
12
14
16
18
20
22
Pixel Number
Th
ickn
ess, cm
True Thickness
No Scatter
10% Scatter
50% Scatter
100% Scatter
0 64 128 192 256 320 384 448 5120
0.4
0.8
1.2
1.6
2
2.4
2.8
Pixel Number
Th
ickn
ess, cm
True Thickness
No Scatter
10% Scatter
50% Scatter
100% Scatter
Water Cortical bone
Research topics: X-ray scattering, simulation, material decomposition
A. Sossin, V. Rebuffel, J. Tabary, J. M. Létang and N. Freud (INSA, CREATIS), L. Verger
The emergence of energy resolved x-ray detectors introduced the ability to differentiate material components by processing a single shot acquisition image. The performance of such techniques is severely degraded by the presence of scattered radiation. The present study aimed to evaluate the disturbance caused by scatter on multi-energy imaging. For a scatter-to-primary ratio (SPR) of 1.32 results showed a significant impact on quantification accuracy with an average error of
157% and 74% for cortical bone and water thicknesses, respectively.
Influence of Scattering on Material Quantification Using Multi-Energy X-ray Imaging
Related Publications:
[1] A. Brambilla, P. Ouvrier-Buffet, J. Rinkel, G. Gonon, C. Boudou, and L. Verger, “CdTe Linear Pixel X-Ray Detector With Enhanced
Spectrometric Performance for High Flux X-Ray Imaging,” IEEE Trans. Nucl. Sci., vol. 59, no. 4, pp. 1552–1558, Aug. 2012.
[2] V. Rebuffel, J. Tabary, P. Hugonnard, E. Popa, A. Brambilla, G. Montemont, and L. Verger, “New functionalities of SINDBAD simulation
software for spectral X-ray imaging using counting detectors with energy discrimination,” in NSS/MIC, 2012 IEEE, 2012, pp. 2550–2554.
[3] A. Sossin, J. Tabary, V. Rebuffel, J. M. Létang, N. Freud and L. Verger, “Fast Scattering Simulation Tool for Multi-Energy X-ray
Imaging,” in NSS/MIC, 2014 IEEE.

16
––– Recycling of waste has become a major economic and environmental issue. The market is growing rapidly and is based on advanced waste sorting technologies. Among them, Multi-energy X-Ray Transmission imaging (ME-XRT) plays an important role due to its ability to provide real-time
volumetric information on the chemical composition of the sorted waste. This feature makes it a unique technique for sorting polymers, metals, glass or batteries.
Figure 1 : Prototype sorting machine designed by BERTIN
A full scale sorting machine prototype was designed by Bertin. It consists of an X-ray tube at high angular aperture and a 1 meter large linear sensor provided by MULTIX. The latter consists of 128 ME100 modules, for a total of 1280 pixels with 64 channels of energy each. A conveyor belt carries the waste samples above the detector at 3 m/s.
Figure 1: 1 meter linear detector made up of 10 ME100 provided by
Multix.
CEA LETI was in charge of developing a dedicated processing algorithm for the sorting of plastic wastes in order to discriminate undesired additives such as brominated and chlorinated flame retardant. The method used is based on material basis decomposition: the X-ray
attenuation function of the analyzed sample is a linear combination of attenuation of two materials: µ𝑠𝑎𝑚𝑝𝑙𝑒(𝐸)𝐿𝑠𝑎𝑚𝑝𝑙𝑒 = µ1𝐿1 + µ2𝐿2
𝐿1 and 𝐿2 are called equivalent lengths of basis material. The
concentration of bromine or chlorine is related to the ratio R of equivalent lengths : 𝑅 = 𝐿1/(𝐿1 + 𝐿2) = 𝑐 ∙ [𝐵𝑟] Figure 2 shows the measurement of R for different bromine concentration in 3 mm thick plastic samples. The analysis was performed on a ROI of 64 mm² (10x10 pixels) in order to reduce photonic noise. These measurements show that
very low concentration of bromine down to 1% can be discriminated.
Figure 2: Ratio of equivalent lengths for different bromine
concentration measured
The first test have shown the interest of ME-XRT for sorting of polymers. The machine is now operational and will serve as a demonstrator to test this novel technology in other waste sorting sectors.
Research topics: X-ray imaging, waste sorting, environment
A. Brambilla, F. Marticke, J. Rinkel, G. Gonon, V. Moulin, L. Verger
ABSTRACT: NOPTRIX-ME, a collaborative project between CEA-LETI, Ecole des Mines d'Alès, Multix and Bertin, was founded to evaluate the performance of an energy sensitive X-ray imaging
detector for waste sorting. In this context, a sorting machine prototype has been developed that integrates dedicated processing algorithms developed at CEA-LETI. This innovative technology will improve the efficiency of waste sorting in several industrial sectors, such as polymers, metals and electronic devices.
Prototype multi-energy X-ray system for waste sorting
Related Publications:
[1] Brambilla A., Ouvrier-Buffet P., Gonon G., Rinkel J., Moulin V., Boudou C., Verger L., Fast CdTe and CdZnTe semiconductor detector
arrays for spectroscopic X-ray imaging (2013) IEEE Transactions on Nuclear Science, 60 (1), art. no. 6395225, pp. 408-415..
[2] Beldjoudi G., Rebuffel V., Verger L., Kaftandjian, V. Rinkel J., An optimised method for material identification using a photon counting detector (2012) Nuclear Instruments and Methods in Physics Research, Section A: Accelerators, Spectrometers, Detectors and Associated
Equipment, 663 (1), pp. 26-36.
[3] Gorecki A., Brambilla A., Moulin V., Gaborieau E., Radisson P., Verger L., Comparing performances of a CdTe X-ray spectroscopic
detector and an X-ray dual-energy sandwich detector (2013) Journal of Instrumentation, 60, P11011

17
––– CdZnTe is a semiconductor material for room temperature detection that is used widely for gamma-ray application. Its main advantages are a high resistivity, good transport properties and a sufficient crystallinity for fabricating devices of several cubic centimeters.
Segmenting detector anode in small areas allows building a spectrometric gamma-ray imaging device and has several advantages: noise reduction, improvement of energy resolution by the pixel effect and the improvement of device spatial resolution. However, there are also disadvantages to this electrode segmentation. First, the increased number of readout channels leads to higher system complexity and cost. Second, the charge sharing effect becomes important and provokes a degradation of spectral quality. An alternative way to improve spatial resolution has been investigated since several years by using signal induced on neighboring electrodes. We have worked on the practical implementation of this type of subpixel positioning techniques using a 5 mm thick detector and 2.5 mm pitch anodes [1]. At 122 keV, we have demonstrated that it was possible to acquire images with 300 µm spatial resolution and 2.5% energy resolution.
Figure 1: Detection module (left) and an example of energy
spectrum acquired on a Cobalt-57 source (right).
The module (figure 1) uses CdZnTe crystals with 2.5 mm pitch anodes and 5 mm thickness. It is buttable on its four sides and measures 40x40 mm. The 256 anodes are read out by eight IDeFX-HD designed at CEA-IRFU [2]. This chip combines low noise and low power (1 mW/ch). Readout chips communicate with a master FPGA that carries out real-time data processing.
We have applied this new module design to coded aperture imaging for source localization and identification (figure 2). Thanks to the good spatial resolution, we were able to resolve small details of coded aperture mask and then localize source with a good angular resolution (2 degrees on
a field of view of 45 degrees). The good energy resolution of the module helps to separate isotope accurately and improve signal detectability in background.
Figure 2: Source localization application using a coded aperture
mask and a single 40x40x5 mm module subpixelated into 128x128
virtual pixels. On the left, the projection image with a single source
irradiating the detector through the mask. On the right, reconstructed isotope image: 15 s acquisition at a distance of 1.5 m
with a 3.7 MBq Americum-241 source and a 1.1 MBq Cobalt-57
source.
Subpixelation allows improving spatial resolution without degrading spectral response by charge sharing but implies to process coincident signal on several channels. It is well suited for low flux applications where spectral response matters. With a 40x40x5 mm module, we have built a 128x128 virtual pixel spectrometric imaging system allowing accurately identifying and localizing radionuclide emitters. A single module already allows detecting low dose rate sources (50 nSv/h) from 20 to 1000 keV in the order of one minute and is well suited for security applications, where one wants to search for radionuclides with a small mobile device
Research topics: CZT detector, coded aperture, radioactive source localization
G. Montémont, O. Monnet, S. Stanchina, L. Verger
ABSTRACT: Subpixelation is an acquisition principle that uses transient signals induced on anodes surrounding the collecting anode to precisely localize interactions. Subpixelation is a
powerful principle for gamma-ray imaging and allow to considerably enhance spatial resolution for a constant anode size. It is known that reducing anode size increases charge sharing between electrodes and degrades energy resolution, but using signal processing to localize interaction allows reaching high spatial resolution at no cost for energy resolution.
Gamma-ray imaging using subpixelated CZT detectors
Related Publications:
[1] G. Montemont, S. Lux, O. Monnet, S. Stanchina, and L. Verger, IEEE Transactions on Nuclear Science, vol. 61, no. 5, pp. 2559–2566,
Oct. 2014.
[2] O. Gevin, O. Lemaire, F. Lugiez, A. Michalowska, P. Baron, O. Limousin, and E. Delagnes, Nuclear Instruments and Methods in Physics Research Section A, vol. 695, pp. 415--419, 2012.

18
––– Radiography X-ray medical imaging requires 2D large surface detectors (20 cm to 40 cm width) equipped with rather large pixels (50 µm to 200 µm width). Submicronic high integration integrated circuits allow designing complex circuitry in such pixels. The goal of this project is to
implement a multi-energy discriminator in each pixel, thus allowing X-ray color imaging. The energy of each detected X-ray has then to be measured and, depending on this measurement, one of a series of counters implemented in the pixel is incremented. The detection process includes a first step where each X-ray is absorbed and converted in secondary particles, and a second step, in an integrated circuit, where these secondary particles are measured to give the X-ray energy. In case a scintillator is used, each pixel of the integrated circuit has to include a photodiode to convert visible photons to electrons. The required energy resolution corresponds to a measurement with 100 electrons accuracy. In addition, as the global detector will include several million pixels, the power consumption of each pixel has to be kept as low as a few microwatts to fulfill the specification. We have developed for several years [1] a concept of counter charge measurement (also called charge balancing). In this concept, the electrons created by the detection of an X-ray cause the decrease of the voltage of a capacitor. When this voltage crosses the threshold of a comparator, a positive calibrated counter charge is injected on the capacitor. The number of counter charges required to compensate for the X-ray gives the digitized value of its energy. The schematic diagram of the present circuit [2], called "Sphinx", is given in Figure 1. It has been designed with two main goals: - the circuit is improved in order to achieve lower and more homogenous values of the counter charges, - in case the X-ray flux is too high, the pulses corresponding to the different detected X-rays pile-up, and the spectrometric measurement is no more feasible. The integrated circuit then includes a mode where all counter charges are summed up independently on the X rays which have generated them. This is the so called "integration mode". The simulated results foresee the following main performances: - the targeted 100 electron counter charge is expected to be obtained with +/- 20% dispersion,
- the expected noise related to one counter-charge is 𝐸𝑁𝐶 [𝑒−‐ 𝑟𝑚𝑠] = 0.56 × 𝐶𝑑𝑒𝑡 [𝑓𝐹] + 9
Where ENC is the effective number of noise charges, and 𝐶𝑑𝑒𝑡 is the capacitance of the input comparator node.
- the maximum expected counting rate is 1 MSPS (Mega Samples per Second) in the spectrometric mode, - the power consumption depends on the detected current and is about 1 µW as shown in Figure 2.
Figure 1: Integrated circuit pixel schematics
Figure 2: Pixel power consumption in integrated mode versus
detector current; APC and DPC: Analog and Digital power
consumptions
The ASIC was processed in a 0.13µm CMOS process. Experimental results are expected next year.
Research topics: X-rays, medical imaging, spectrometry, integration
A. Habib, M. Arques, B. Dupont, J.-L. Moro, G. Sicard, M. Tchagaspanian, L. Verger
ABSTRACT: multi-energy X-ray medical imaging allows distinguishing different components in a patient, such as bones, soft tissues, or injected products. This has been up to now developed in
X-ray CT scanners which use linear detectors. This project aims to provide the same capabilities to a 2D flat panel detector used in conventional radiography. A small integrated circuit has been designed to test a new pixel electronic concept mixing spectrometry and integration modes and offering high accuracy measurements and low power consumption. .
High accuracy (100 electrons), low power, integrated circuit for X-ray medical imaging in Spectrometric and Integration modes
Related Publications:
[1] A. Peizerat, M. Arques, P. Villard, J.-L. Martin, et G. Bouvier, « Pixel-level ADC by small charge quantum counting », in 13th IEEE
International Conference on Electronics, Circuits and Systems, 2006. ICECS ’06, 2006, p. 423‑426.
[2] A. Habib, M. Arques, B. Dupont, P. Rohr, G. Sicard, M. Tchagaspanian, L. Verger, "Sphinx1: Spectrometric photon counting and
integration pixel for X-ray imaging with a 100 electron LSB" 2013 IEEE Nuclear Science Symposium and Medical Imaging Conference
(NSS/MIC)

19
––– Nowadays, society’s expectations and needs are centered on energy, environment and security issues This last requirement includes a number of aspects, namely, food products, medication, luxury goods and official documents (passports, identity cards, fiduciary documents, etc.).
Detection of authenticity is one of the major issues associated with the struggle against counterfeits. We have developed a new kind of marker called Xtag that can be incorporated in medication packaging and that can be detected only by a spectrometric imaging system [1]. The Xtag's have been incorporated in inks that have been applied on cardboard sample by industrial coating or printing processes. A special effort was made to reach sufficient thicknesses and concentrations for reliable detection.
Figure 1 : Coating process for the application of Xtag marked inks
The identification of the marked sample is performed by scanning the medicament boxes with a ME100 linear spectrometric imaging detector based on the innovative technology of CEA-Leti [2] and produced by MULTIX (figure 2). The Xtag's have a specific signature visible on the X-ray attenuation function. The difficulty of the measure is due to the fact that one does not know the contents of the package.
Figure 3 : ME100 linear array pixel detector [3]
First measurements have been performed on homogeneous materials with several thicknesses of tagged paperboard sheets. We used a standard basis material decomposition method to extract the signal from the Xtag. The results show that it is possible to discriminate the number of
tagged boxes (Figure 2).
Figure 2 : Estimated Xtag thickness vs number of tagged paperboard
sheet
A second approach based on a Linear Discriminant Analysis (LDA) method provides interesting results with very fast calculation times. This advantage allows real-time process of the acquired data during the scan. The discriminator value obtained from LDA depends on the presence of Xtag in the packaging(Figure 3).
Figure 3 : Distribution of the discriminator for tagged and untagged
samples.
Research topics: Fight against counterfeit, X-ray imaging
A. Brambilla, M. Tartare, B. Ben Fadhel, V. Moulin, , L. Verger
ABSTRACT: The IDEMAX project proposes an original solution for marking medication to guarantee its authenticity. This marking carried out “in the material” calls for a new emerging X-
ray spectrometric detector technology to be identified, and is totally invisible both to the naked eye and by traditional X-ray means. We have developed processes for incorporating these new markers in medication packaging and implemented measurement benches and processing algorithm to identify them.
Idemax - A new solution to guarantee traceability and authenticity of drugs
Related Publications:
[1] Brambilla A., et al, WISG 2014, IDEMAX : “Drug Identification by X-Ray marker"
[2] Brambilla A., Ouvrier-Buffet P., Gonon G., Rinkel J., Moulin V., Boudou C., Verger L., Fast CdTe and CdZnTe semiconductor detector
arrays for spectroscopic X-ray imaging (2013) IEEE Transactions on Nuclear Science, 60 (1), art. no. 6395225, pp. 408-415. [3] www.multixdetection.com.


Optical Imaging
Fluorescence imaging
Raman spectrometry
Lensfree video microscopy
Time-resolved tomography
2

22
––– Prostate cancer diagnosis is based on PSA determination followed by endorectal ultrasound biopsy. The biopsy protocol’s lack of specificity and the difficulty to accurately identify and localize malignant tumors in some cases lead to a dramatic increase in biopsies collection and an increased
risk of complications. To make biopsies more efficient and less invasive, members partners of the "Investissements d'Avenir" BITUM Project (ANR-10-NANO-0001-01) have developed a new approach taking advantage of recent developments of Fluorescence Molecular Tomography [1]. During the procedure, a tumor-specific fluorescent marker will be injected into the patient several hours before the exam. A pulsed laser will trigger the fluorescence accumulation in the tumor and an optical probe associated to a dedicated reconstruction algorithm will localize it [2]. After successful testing of the marker (Lipimage) on small animals[3], the project entered in a second preclinical phase which aims to validate the approach on canine prostates (dog is the closest model to human as prostate is concerned)
Figure 1: LEFT: Preclinical test performed at VetAgroSup Lyon.
RIGHT: Mobile Time resolved optical system ("Prostamobile)
To this end, we developed a mobile version of the optical acquisition system to simplify transport and deployment in an operative room. However we had to deprive the system from US imaging as it was incompatible with the reduced size of the dog probe. Instead, an external veterinary echographer was used to guide the optical probe in front of the prostate before acquisitions were performed.
This preclinical probe was first used to measure the optical properties of the prostate of 3 healthy dogs. Results showed that variability of the absorption coefficient was high for "inter-dog" measurements but low for "intra-dog" ones. Globally, these values were in the same range of the ones
measured on human prostates. In the next experiment, we simulated the presence of a marked tumor in the prostate by injecting a mixture of Lipimage and matrigel (liquid that solidifies at 37°C) in the prostate of a healthy dog. We performed several acquisitions at fixed relative angles and depths between the probe and the inclusion while the operator was moving the optical probe in the rectum. After reconstruction by a dedicated algorithm, the team was able to localize the inclusion at the correct place for the 6 different points of view.
Figure 2: Top: real position of the induced fluorescent inclusion in
canine prostate. Bottom: Reconstructed position of the inclusion.
Further work will be to perform preclinical tests on dogs bearing prostate cancer and enhance the targeting power of the marker by assembling anti-PSMA ligands to its surface.
Research topics: Biomedical Imaging
J. Boutet, L. Hervé, E. Rustique, A. Hoang, F. Ponce, D. Sayag, S. Buff, J-M. Dinten
ABSTRACT: In a project aimed at designing a more effective and less-invasive procedure for detecting prostate cancer, we have developed a new approach combining a fluorescent marker
(Lipimage 815) and a time resolved optical system. The system underwent a second phase of preclinical in vivo tests on beagle dogs. After successfully measuring optical properties of healthy prostates, we demonstrated the capability of the system to localize an inclusion of Lipimage815 and follow its position while the operator was rotating the optical probe inside the rectum.
Fluorescence Molecular Imaging for a less invasive procedure for cancer detection: first preclinical results
Related Publications:
[1] N. Grenier, J.Boutet, M. Debourdeau al. ”Development of a bimodal ultrasonic sensor and optics for the detection of prostate cancer”,
Bulletin du Cancer, Volume: 98 Supplement: S Pages: S83-S84, 2011
[2] J. Boutet, M. Debourdeau, L. Hervé, D. Vray, O. Messineo, A. Nguyen Dinh, N. Grenier, JM. Dinten, « Fluorescence imaging to improve prostate cancer diagnosis », Electronic Engineering Times, 2012
[3] A. Jacquart, M. Kéramidas, J. Vollaire, R. Boisgard, G. Pottier, E. Rustique, F. Mittler, F. P. Navarro, J. Boutet, JL. Coll, I. Texier, «
LipImage™ 815: novel dye-loaded lipid nanoparticles for long-term and sensitive in vivo near-infrared fluorescence imaging”, Journal of
Biomedical Optics 18(10), 101311, 2013

23
––– By exploiting the penetration depth of light in the classical “therapeutic window” (ranging from 600 to 900 nm), near-infrared (NIR) diffuse optical imaging technique allows the observation of living tissues. When combined with dedicated fluorescent markers which targets specific biological
processes and dedicated instrumentation, this imaging technique is relevant for image guided surgery such as radical resection of tumor. Usually, the technique is performed by using a uniform illumination (UI). Here we show that the results are enhanced, in term of contrast and resolution, if the biological medium is scanned with a line (LS) and the stack of acquisition is adequately processed. The technique was first tested on a simple fluorescence rod immersed in a diffusive medium mimicking biological tissues with realistic background fluorescence. The contrast of the reconstructed LS image was found to be twice the contrast UI image for the fluorescence depth ranging from 1 to 10 mm (Figure 1).
Figure 1 : Comparison of contrast between LS imaging and usual UI
imaging.LS imaging is twice more contrasted.
Importantly, the LS reconstructed images are found to have a dramatically improved spatial resolution which is a key feature for margin detection in cancer resection surgery. The capability of the technique was tested on a resolution test pattern immersed at 3 mm depth in the previous diffusive medium. Figure 2 shows that, contrary to UI which produces barely any clear distinction between the test pattern details, most of them are distinguishable with LS imaging.
Figure 2: Comparison of UI imaging (left) and LS imaging (right) on
a test pattern immersed at a depth of 3 mm in a diffusive medium.
The technique was also tested on the case of a fluorescence (Alexa Fluor 700 at 20µM) capillary inserted inside a mouse, in the intestines (good results but not presented here) or in the thorax region. This latter case is proved to be challenging because light propagation is disturbed by the large optical heterogeneity of lungs. From figure 3, we see that the fluorescence inside lungs is visible in the case of LS imaging whereas none was measured with standard UI imaging.
Figure 3: Comparison of UI imaging (left) and LS imaging (right) on a fluorescence capillary inserted in the thorax region. LS imaging
allows a clearer view of the fluorescence tube whereas the UI is
comparable with the witness test (without inserted fluorescence, not
shown).
In conclusion, line scan imaging is proved, from dedicated experiments on phantom to provide images with higher contrast and resolution than uniform illumination imaging. The technique was also successfully tested on an in vivo experiment performed on a mouse. Efforts must now be done to translate the technique to a real-time one.
Research topics: Near infrared fluorescence imaging, contrast, resolution, line scan
L. Hervé, F. Fantoni, J. Mars, J.-M. Dinten
ABSTRACT : Intraoperative fluorescence imaging in reflectance geometry is an attractive imaging modality to noninvasively monitor the fluorescence targeted tumors. It is usually performed by
using a uniform illumination. Here, we propose to scan the medium with a laser line illumination. The processing of the image stack enables an enhanced fluorescence resolution and contrast of the result image. This technique has been validated on tissue-like phantoms with background fluorescence and on in vivo acquisition on mice.
Enhanced fluorescence visualization in diffusive media with laser line scanning illumination scheme
Related Publications:
[1] F. Fantoni, L. Hervé, V. Poher, S. Gioux, J.I. Mars, J.-M. Dinten, " Laser line scanning illumination scheme for the enhancement of
contrast and resolution of fluorescence reflectance imaging", imaging", Journal of Biomedical Optics, 19(10), 106003, 2014.
[2] F. Fantoni, L. Hervé, V. Poher, S. Gioux, J.I. Mars, J.-M. Dinten, " Background fluorescence reduction and absorption correction for fluorescence reflectance imaging ", imaging", SPIE BiOS. International Society for Optics and Photonics, 2014. p. 89350Z-89350Z-12.

24
––– Vibrational methods, and among them, confocal Raman micro-spectroscopy, are very promising techniques for fast and robust identification of microorganisms. In the context of pathogen threat detection the technique has to be deployed in the field, which motivated the achievement of a
novel compact Raman analyzer called BACRAM (figure 1). The spectra recorded on microorganisms are therefore dependent on the phenotype under scrutiny, which is largely dictated by growth and environmental conditions. Studies previously conducted on bacteria cultivated under various conditions (medium, temperature, age) indicate that identification at the species or even strain level is possible, provided a comprehensive database containing spectra from all relevant conditions is employed. In this work, we discuss the choice of a comprehensive reference database containing spectra from all conditions, against a reduced database of standard spectra alone. We use Raman spectra acquired with a short integration time (10 s), a SVM classifier, and perform identification at the species level.
Figure 1: Photograph of the integrated instrument called BACRAM,
and schematic of the optical setup.
The database contains in total 2056 spectra of the five bacteria Bacillus subtilis (BS), Bacillus cereus (BC), Escherichia coli (EC), Staphylococcus Epidermidis (SE), Serratia Marcescens (SM), cultured in standard (all bacteria), and non-standard conditions (limited to BS and EC). Non-standard conditions correspond to media of increasing nutrient content (medium 1 to 3), various temperatures (LB30, TSB37), and matrices (Air and Seine). These conditions were chosen to induce heterogeneous phenotypes.
Figure 2: results of a SVM classifier at the species level when culture
conditions and environmental matrix of BS (top) and EC (bottom)
are varied. We show side by side the classification results obtained
with standard (left) and comprehensive (right) training set.
Considering standard conditions only, the SVM classifier gives an average identification rate of 90.1%. Gram+ species (BS, BC, SE) show higher rates (98.6%) than Gram+ species (76.6%) due to confusions observed between EC and SM species. In adverse conditions, the achieved identification rate is 89% provided a comprehensive database is used (Figure 2, right). We further observed that species B. subtilis could be robustly identified in 95.5% of the cases using a reduced database composed of standard spectra alone, i.e. without incorporating all conditions and matrices in the base (figure 2, left). This was not the case of E. Coli for which a comprehensive database was needed in order to decrease the confusion with the other gram negative species. E. Coli displayed large intra-species variability with environmental conditions. This correlates with lower Raman yield of E. Coli spectra in standard conditions. This discussion suggests that in a number of cases a standard laboratory-build database is sufficient to provide satisfying identification of a single bacterium at the species level. This study thus brings a key element in favor of the ability of the technique to be deployed in the field and to answer the needs of first responders.
Research topics: Raman spectrometry, microbiology, single bacteria identification
J-C. Baritaux, E. Schultz, A-C. Simon, A-G. Bourdat, I. Espagnon, P. Laurent, J-M. Dinten
ABSTRACT: We report on our recent results on robust identification of single bacterial cells embedded in various environmental conditions using our novel Raman Analyzer, the so-called BACRAM system. Identification rates at the species level comparable to those obtained on lab cultures were possible using a comprehensive database containing spectra recorded in all
environments. In addition, B. Subtilis was correctly identified in 95.5% of the cases using a database composed exclusively of spectra obtained in lab conditions.
Fast and robust identification of single bacteria in environmental matrices by Raman spectroscopy
Related Publications:
[1] Strola S.A., Baritaux J.-C., Schultz E., Simon A.C., Allier C., Espagnon I., Jary D., and Dinten J.-M., “Single bacteria identification by
Raman spectroscopy.,” Journal of biomedical optics 19(11), (2014).
[2] Schultz E., Strola S., Allier C., Dupoy M., Patent FR 1350857

25
––– Confocal Raman microspectroscopy allows in-depth molecular and conformational characterization of samples non-invasively. Unfortunately, even in transparent mediums, distortions occur due to changes in refractive index and spherical aberrations. Mathematical models were
consequently applied, for example, in tracking drug penetration on excised skin to correct depth and axial resolution values. Recently, several papers pointed out the additional effect of elastic scattering in the depth profile response of semicrystalline polymers. Our objective is to correct the attenuation of Raman peaks intensity by considering the quantified optical properties. In a first study, we perform confocal Raman depth profiling of homemade phantoms with various optical properties controlled by diffuse reflectance spectroscopy (DRS). In this purpose, we developed PDMS phantoms [1] mimicking skin and with tunable optical properties. Briefly, PDMS, a transparent material, was chosen as the bulk material and TiO2 was used as light scattering agent. By varying the amount of TiO2 we change the scattering coefficient. An optical system based on a fibers bundle has been previously developed for in vivo skin characterization with Diffuse Reflectance Spectroscopy (DRS) [2]. Used on our phantoms, this technique allows checking their optical properties. Raman microspectroscopy was performed using a commercial confocal microscope. Depth profiles were constructed from integrated intensity of some specific PDMS Raman vibrations. Acquired on monolayer phantoms, they display a decline which is increasing with the scattering coefficient (Fig. 1).
Figure 1 : Raman depth profiles of vibrations ranging from 2870 to 3000 cm-1 obtained on monolayer phantoms with varying scattering
coefficients
Therefore, determining the optical properties of any biological sample is crucial to correct properly Raman depth profiles.
A model, inspired from S.L. Jacques's expression for Confocal Reflectance Microscopy and modified at some points, is proposed and tested to fit the depth profiles obtained on the phantoms as function of the reduced scattering coefficient [3]. Our model differs from literature by the constant added to the exponential decay to
describe the escape of deep Raman photons from the confocal volume. It means that taking this residual deep Raman signal into account is crucial to better describe and understand the effect of elastic scattering on the Raman intensity decline with depth.
realz
realNew ezR )(
In this model, we verify experimentally that parameter is
linearly depending on the scattering coefficient (Fig. 2).
Figure 2 : Variation of with the reduced scattering coefficient
obtained by DRS on the monolayer phantoms.
Thus, once the optical properties of a biological sample are known, by DRS for example, the intensity of deep Raman spectra distorted by elastic scattering can be corrected with our reliable model. We are considering quantitative studies for purposes of skin characterization in in vivo conditions to assess and confirm the benefit of the parameter in this correction process.
With this ongoing investigation, we also want to link the model parameters with physical quantities. This work forms integral part of Blandine Roig's PhD work.
Research topics: Raman and diffuse reflectance spectroscopy, Skin Characterization
B. Roig, A. Koenig, F. Perraut, J-M. Dinten
ABSTRACT: Our objective is to correct the attenuation of in-depth Raman peaks intensity by considering biological tissues elastic scattering. We developed multilayered phantoms mimicking
skin optical properties. Before acquisition of confocal Raman depth profiles, their scattering and absorption spectra were controlled with our homemade Diffuse Reflectance Spectroscopy system. The Raman signal attenuation through each layer is directly dependent on its scattering property. A model is proposed to correct Raman depth profiles distorted by elastic scattering.
Correction of deep Raman spectra distorted by elastic scattering
Related Publications: [1] Roig, B., Koenig A., Perraut, F., Piot, O., Vignoud, S., Lavaud, J., Manfait, M., Dinten, J.-M., "Multilayered phantoms with tunable optical
properties for a better understanding of light/tissue interactions", accepted for oral presentation at SPIE BiOS 2015 (paper 9325-11).
[2] Koenig A., Grande S., Dahel K., Planat-Chrétien A., Poher V., Goujon C., Dinten J-M., “Diffuse reflectance spectroscopy: a clinical study
of tuberculin skin tests reading.” BiOS, 2 - 7 February 2013, San Francisco, California USA.
[3] Roig, B., Koenig A., Perraut, F., Piot, O., Gobinet, C., Manfait, M., Dinten, J.-M., "Biophotonics of skin: method for correction of deep
Raman spectra distorted by elastic scattering", accepted for oral presentation at BIOS 2015 (paper 9318-18).

26
Lensfree imaging is a powerful tool for real-time, label-free monitoring of living cells. In previous works [1,2], we have demonstrated the potential of our lensfree video microscope to acquire images of cell cultures in Petri dishes directly inside a standard incubator, on a large field of view (25
mm²) and over periods going from a few hours to several days, with a temporal resolution close to few seconds. The understanding of the behavior of a cell population as a global and coherent structure from the single cell's scale (microns) to the tissue's scale (centimeters) is of great interest for cell biology. However, for tissue growth experiments such as wound healing assays, a 25mm² field of view remains quite limited. Our "super wide field" lensfree system is based on the same principle described in [1, 2]. Figure 1 shows our lensfree scanner. An acquisition consists in scanning a sample, e.g. a Petri dish, by snapping image in snake mode and acquiring 100 images in 5 minutes. The mosaic of images is then recombined using a stitching algorithm.
Figure 1. (a) Experimental setup of the lensfree scanner. The light
source, a white light LED with 150µm optical fiber + a wavelength
filter at 534±42nm, and the 25mm² CMOS sensor are mounted on 2
linear stages set on XY configuration. (b) Scanning trajectory of a
Petri dish. (c) Meta-image of the Petri dish.
We demonstrated the potential of super wide field and real-time lensfree imaging in the context of wound healing assays of cultures of keratinocytes HaCaT. We coupled the 2
features using our lensfree video microscope device [1,2] for real-time imaging, and the scanner for final point imaging.
Figure 2. Label-free measurement of the area of proliferation on the
lensfree scan of the entire Petri dish of the HaCaT culture. (a) Meta-
image at t0+96 hours. (b) Zoom on a region of interest. (c) Gradient
image. The clusters corresponds to the growth of cells ripped at the
removing of depletion plot. (d) Crowns' delimitations at t0 and t0+96
hours for areas' measurements. (f) Colorized Petri dish for classical
non label-free measurements of proliferation. (g) Statistical results
of quantification of the area of proliferation on N=10 cell cultures.
(h) Statistical results of quantification of the mean shifting at 4
cardinal points on N=10 cell cultures. (i) Real-time lensfree sequence of HaCaT cells' growth and velocity measurement.
a) c)
b)
f) Standard colorization (Giemsa)
c) Gradient image
d) Crowns' delimitations
e)
a) Cell culture at t0+96 hours
Front at t0 (dark crown)
Front at t0 (dark crown)
Front at t0+96 hours
cell clusters
b) Zoom
g) h)
shiftings at the cardinal points
Research topics: Cell culture, lensfree video microscopy
F. Momey, C. Allier, J.-G. Coutard, T. Bordy, F. Navarro, M. Menneteau, J.-M. Dinten
ABSTRACT: This paper presents a new methodology based on lensfree imaging to perform wound healing assay with unprecedented statistics. Lensfree video microscopy can perform the follow-up in a large field of view (25 mm²) of several parameters during the culture of cells. In the case of tissue growth experiments, the field of view of 25 mm² remains not sufficient. Hence, to conduct exhaustive wound healing assay, we enlarge the field of view up to 10 cm² by
performing a scan of the cell culture.
Dynamics of cell and tissue growth acquired by means of 25 mm² to 10 cm² lensfree
Related Publications:
[1] Vinjimore Kesavan, S., Allier, C., et al. (2014, April). Real-time cell culture monitoring by means of lensfree video microscopy.
In Biomedical Optics (pp. BT3A-21). Optical Society of America.
[2] Kesavan, S. V., Momey, F., Cioni, O., et al. (2014). High-throughput monitoring of major cell functions by means of lensfree video microscopy. Nature Scientific reports, 4.
[3] Momey F., Coutard J.-G., Bordy T., Navarro F., Menneteau M., Dinten J.-M., Allier C. (2015, February). Dynamics of cell and tissue
growth acquired by means of 25 mm² to 10 cm² lensfree. SPIE BiOS conference, Imaging, Manipulation, and Analysis of Biomolecules,
Cells, and Tissues XIII.
27
–––
Though microscopy is gaining deeper access inside the cell, appropriate methodologies for cell monitoring at a mesoscopic scale with strong statistics both in space and time are still missing. Real-time cell culture monitoring is essential in cases where the behavior of not just a single cell but a cell population dynamics needs to be observed with significant temporal resolution. Various imaging platforms have been explored to meet this requirement, especially, video microscopy and impedance readers. Limited field of view, high cost, and complexity in manipulating cell culture during the experiment, are the major limitations of video microscopy.
We have demonstrated the capability of our lensfree video microscope [1] (Figure 1) to monitor the fundamental processes of the cell culture directly inside a standard incubator. We introduced specifically devised metrics to
follow cell-substrate adhesion, cell spreading, cell division, cell division orientation, and cell death (Figures 2 and 3). We showed that these metrics can be applied to a very large range of population, from few tens to more than 4000 cells, for a period ranging from few hours to weeks. More notably, these metrics allow following the fate of single cells within large populations and large period of observations. Our methodology consisted in first testing, and assessing different metrics at the level of single cells, followed by computation of the metrics over the entire population as a function of time. The latter results in scatter plots compiling 25,000–900,000 label-free measurements depending on cell density and period of observation (Figure 3).
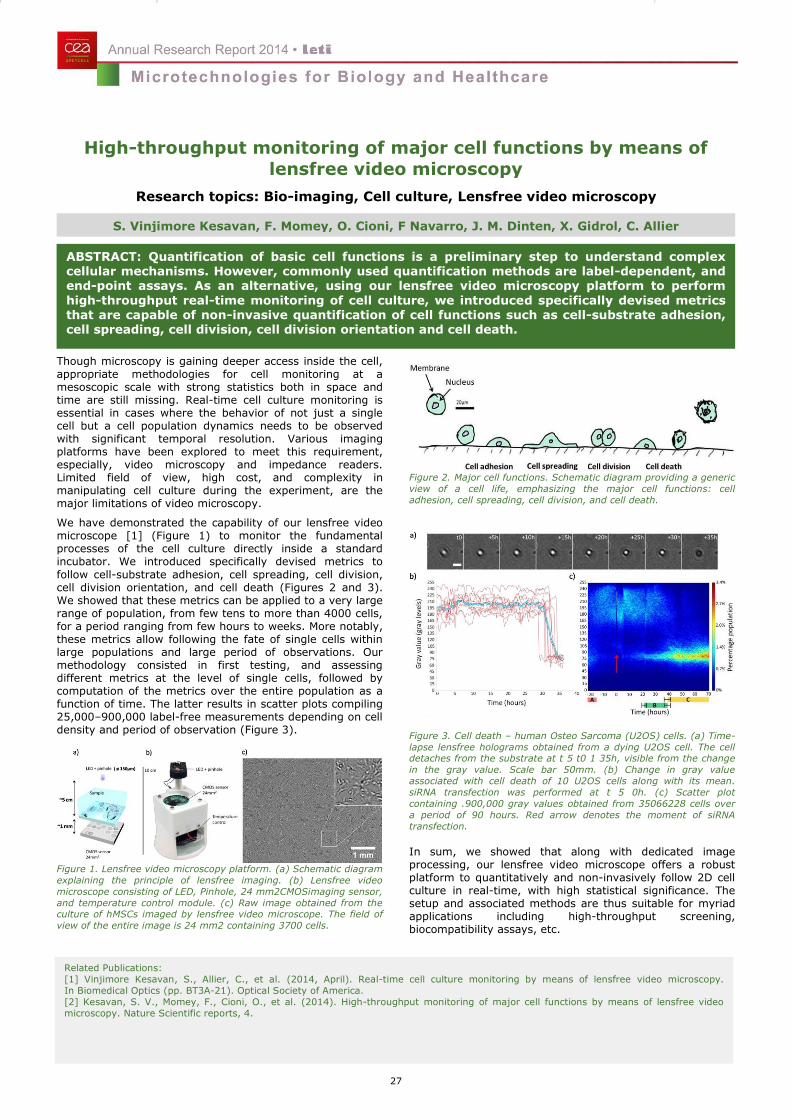
Figure 1. Lensfree video microscopy platform. (a) Schematic diagram
explaining the principle of lensfree imaging. (b) Lensfree video
microscope consisting of LED, Pinhole, 24 mm2CMOSimaging sensor,
and temperature control module. (c) Raw image obtained from the culture of hMSCs imaged by lensfree video microscope. The field of
view of the entire image is 24 mm2 containing 3700 cells.
Figure 2. Major cell functions. Schematic diagram providing a generic
view of a cell life, emphasizing the major cell functions: cell
adhesion, cell spreading, cell division, and cell death.
Figure 3. Cell death – human Osteo Sarcoma (U2OS) cells. (a) Time-
lapse lensfree holograms obtained from a dying U2OS cell. The cell detaches from the substrate at t 5 t0 1 35h, visible from the change
in the gray value. Scale bar 50mm. (b) Change in gray value
associated with cell death of 10 U2OS cells along with its mean.
siRNA transfection was performed at t 5 0h. (c) Scatter plot
containing .900,000 gray values obtained from 35066228 cells over
a period of 90 hours. Red arrow denotes the moment of siRNA
transfection.
In sum, we showed that along with dedicated image processing, our lensfree video microscope offers a robust platform to quantitatively and non-invasively follow 2D cell culture in real-time, with high statistical significance. The setup and associated methods are thus suitable for myriad applications including high-throughput screening, biocompatibility assays, etc.
Research topics: Bio-imaging, Cell culture, Lensfree video microscopy
S. Vinjimore Kesavan, F. Momey, O. Cioni, F Navarro, J. M. Dinten, X. Gidrol, C. Allier
ABSTRACT: Quantification of basic cell functions is a preliminary step to understand complex cellular mechanisms. However, commonly used quantification methods are label-dependent, and end-point assays. As an alternative, using our lensfree video microscopy platform to perform
high-throughput real-time monitoring of cell culture, we introduced specifically devised metrics that are capable of non-invasive quantification of cell functions such as cell-substrate adhesion, cell spreading, cell division, cell division orientation and cell death.
High-throughput monitoring of major cell functions by means of
lensfree video microscopy
Related Publications:
[1] Vinjimore Kesavan, S., Allier, C., et al. (2014, April). Real-time cell culture monitoring by means of lensfree video microscopy.
In Biomedical Optics (pp. BT3A-21). Optical Society of America.
[2] Kesavan, S. V., Momey, F., Cioni, O., et al. (2014). High-throughput monitoring of major cell functions by means of lensfree video
microscopy. Nature Scientific reports, 4.

28
–––
The system is based on a Time-Resolved instrumentation described in [1], coupled with a method based on Mellin-Laplace Transform [2] to reconstruct 3D optical characteristics deeply buried in diffusive tissues. A multispectral acquisition and analysis provides 3D reconstruction of chromophore concentrations. For the purpose of the studies presented here, we optimized the lab prototype in order to push it out of the lab and to address the operating room environment. A mobile secure instrument is built up to achieve pre-clinical tests in real surgery context. We present two preclinical assessments we have conducted to validate the use of this instrument. Preclinical tests on young macaques for the detection of white matter lesions purpose: this work has been done in collaboration with MIRCEN - Fontenay-aux-Roses.Despite progresses made in neonatology, white matter lesions of the premature remain a major issue. Brain MRI is not possible on a routine basis in neonatal ICU. In this context, our bedside noninvasive optical-based instrument aims at providing such information safely and continuously specially around the first week of life of the preterm babies. We present here the very first in vivo experiment to address the detection and identification of white matter lesion in 4 young non-human primates (NHPs). At day 0, brain MRI was performed and the helmet probe was positioned. Recording of optical imaging was performed at day+7 or +8, the white matter lesion was performed at day +36 or +37 and the optical recording as well as a new brain MRI recording were performed 8 days later, a time at which the LPC-induced lesions of the white matter are expected to be maximal [3]. Both optical and MRI data are acquired in a common framework to allow data comparison between pre-lesion and post lesion raw data and data co-registration of optical 3D reconstructions and MRI. The first result of this study is the validation of lesion model in NHPs (see Fig 1a): a myelin loss – with necrosis sometimes - as well as a local inflammation was observed by Luxol Fast Blue and H&E respectively. Nevertheless the quantification of these lesions leads to smaller volumes than expected: it was about 2 to 18 mm3, instead of 1 cm3 targeted, which means it may be undetectable in some cases. The second important result is that, owing to the method we have developed, a good correlation between optical measurements and MRI data was observed. The scar on the scalp, when present in the
measurement field, was clearly co-registered for both modalities (Fig 1c example on NHP#2).
Fig1. Co-registered optical and MRI data on young macaques for
white lesion detection purpose.
In a second clinical context, we used our time-resolved instrumentation to show its capability to image spatio-temporal evolution of blood perfusion for the non-invasive assessment of flap viability. We apply the method to perform pre-clinical tests on rats inducing total venous occlusion in the cutaneous abdominal flaps. This work has been done in collaboration with the CHU - Grenoble. We verify the possibility to detect spatial changes of chromophores concentration due to an increase in concentration of deoxyhemoglobin following the occlusion (up to 550 μM in 54 minutes) - in case of venous occlusion figured out in this paper.
Fig2: Chromophore concentrations evolution after a venous occlusion
performed on an abdominal flap on rat.
These two applications validate the use of the mobile secure instrument we have developed to address a real surgery context. Monitoring flap viability as white matter detection and characterization are unmet clinical needs: the new approach we propose combined with routinely used modalities could be a help to improve relevant early diagnosis.
Time-resolved optical imaging for tissue exploration in depth: preclinical results
Research topics: Time-resolved tomography, Tissue characterization
Related Publications:
[1] A. Puszka and al., "Time-domain reflectance diffuse optical tomography with Mellin-Laplace transform for experimental detection and
depth localization of a single absorbing inclusion.," Biomed. Opt. Express 4, 569–83 (2013).
[2] L. Hervé and al, "Time-domain diffuse optical tomography processing by using the Mellin-Laplace transform.," Appl. Opt. 51, 5978–88
[3] V. Dousset and al. Lysolecithin-induced demyelination in primates: preliminary in vivo study with MR and magnetization transfer. AJNR
Am J Neuroradiol. 1995 Feb;16(2):225-31.
M. Berger, J-M. Dinten, H. Grateau, L. Hervé, A. Puszka, A. Planat-Chrétien
ABSTRACT: We developed a bedside non-invasive optical-based Time-Resolved instrumentation that we used to address two clinical applications: (1) detection and characterization of white matter lesions of the premature (2) measurement of blood perfusion in depth for the non-invasive assessment of flap viability. We built up a mobile secure instrument to achieve pre-clinical tests in real surgery context. We present here the results obtained on animal models for each one of these two applications.

29
–––
Optical label free techniques, among them elastic scattering, are very promising for fast identification of microorganism species. Elastic scattering here includes diffraction, interference or lens effects that are produced by a microcolony placed in the path of a laser beam. The resulting scattering pattern is a morphological signature of the colony forming unit, and is produced in a non-invasive and non-destructive way. Bacteria species or strain identification has already been demonstrated, however on colonies with biomass ranging about 106-107 cells, generally obtained after 24h of cultivation. In this work, we aim at bringing the method for identification of both bacteria and yeasts at a very earlier stage of growth (microcolonies sizing between 10 and 200µm). A novel setup was achieved, and further integrated in a transportable system aimed at being deployed in microbiological laboratories (figure 1). The instrumentation is simple and low cost, and allows the acquisition of scatterograms directly on the closed Petri dish using very short integration times (50-150 µs).
Figure 1: schematic of the optical setup. The laser power is 1 mW
onto the sample. The laser source and associated optics are mounted
on a vertical translation stage so that the probe diameter can vary. A
CCD camera is placed above the Petri dish to collect the scattering
image. (a) is a wide-field image, and (b) is an example of
scatterogram recorded. On top is a photograph of the instrument.
The setup also includes a large field imaging modality allowing fast and automated localization of the microcolonies over the whole Petri dish. The scatterograms are analyzed off-line using algorithms of pattern recognition (Zernike polynomial decomposition). Finally, SVM classification was performed to provide identification. A first database of 1900 scatterograms was collected after 6h of growth: on TSA for bacteria (2 strains of S. epidermidis, 1 strain of E. cloacae, 4 strains of E. coli), and on SDA for yeasts (3 strains of C. albicans, 1 strain of C. glabrata, C. krusei, C. lusitaniae, C. tropicalis, S. cerevisiae). The Table1 gives the example of identification results for yeasts only: a recognition rate of 76.1% is obtained. The same value was reached for the recognition rate of the whole database. Considering the bacteria dataset, an identification rate of 86.5 % is obtained.
Table 1: Confusion matrix for yeasts strains. A mean identification
score of 76.1% is achieved.
When a much rougher distinction was drawn between Gram positive, Gram negative and yeasts, the recognition rate was as high as 94%.
Table 2:.confusion matrix for yeasts and bacteria gram+ and bacteria gram-. A score of 94% is achieved.
These identification scores show the potential of the method to provide early clinical relevant information to accelerate diagnostic of infectious diseases. In addition, the developed instrument can be incorporated in the clinical workflow thanks to its simplicity (requires no sample preparation or manual operation, prevents cross-contamination), and its ability to be automated.
C. albicans C. glabrata C. krusei C. lusitaniae C. tropicalis S. cerevisiae <-- classified as
82,4 5 0,6 0,8 7,2 4 C. albicans
9,8 83,9 0,9 5,4 0 0 C. glabrata
4,7 0 94,5 0,8 0 0 C. krusei
9,2 14,5 0 75,6 0,7 0 C. lusitaniae
42 0 1,7 0 55,5 0,8 C. tropicalis
41,4 0 0 0 4,5 54,1 S. cerevisiae
Research topics: Elastic optical scattering, microbiology, microcolony, classification
P. Marcoux, E. Schultz, J. Méteau, V. Genuer
ABSTRACT: We studied the ability of elastic scattering to discriminate yeasts or bacteria species
at a very early stage of growth, directly on commercial Petri dishes. Seven strains of bacteria and eight strains of yeasts were considered after 6 h of incubation at 37°C. We recorded the scatterograms arising from microcolonies and performed feature extraction followed by SVM classification. The six yeasts species were correctly identified in 76% of the cases. In addition, a very good discrimination (94%) were also possible between yeasts, Gram+ and Gram-.
Rapid label-free identification of pathogens with optical scattering
Related Publications:
[1] P. R. Marcoux, M. Dupoy, A. Cuer, J.-L. Kodja, A. Lefebvre, F. Licari, R. Louvet, A. Narassiguin, F. Mallard, Optical forward-scattering for
identification of bacteria within microcolonies, Appl. Microbiol. Biotechnol. (2014) 98:2243-2254

30
––– The technique we present here is based upon the spatially resolved diffuse reflectance spectroscopy. We have developed a system which consists in a tungsten halogen lamp as excitation source, a fibered probe for illumination and detection coupled to a fibered spectrometer [1]. The
geometry of collection of the specific probe has been optimized for clinical measurements. To analyze the recorded spectra, we developed a method based on the deconvolution of the reflectance spectra from diffusion and absorption. After pre-processing, for each wavelength, we compute the reflectance decay signal according to the distance to excitation. This decay is compared to a Look up table computed off line with a Monte Carlo algorithm. Then by minimization of the error between simulation and acquisition, we obtain the optical coefficients of absorption µa and scattering µs’ of the examined tissue. This instrument and processing method have been used for tuberculosis skin tests reading [2] or skin-collagen alterations study [3]. To mimic optical properties of skin tissue, we chose to use polydimethylsiloxane (PDMS) as the base material for our multilayered phantoms [4]. In order to create a material with tunable scattering and absorption coefficients, approaching skin optical properties, TiO2 is added to this base material as scattering agent, and ink as absorption agent. Layer 3, with TiO2 only mimics stratum corneum, layer 2 with TiO2 and black ink mimics epidermis basal layer and layer 1 with TiO2 and blue ink mimics dermis (Fig. 1).
Figure 1: Tri layered phantom and acquisition zones.
The multilayered phantoms were designed to allow acquisition of reflectance for three distinct sample zones (zone 1 for layer 1 only, zone 2 for layers 2 and 1 or zone 3 for layers 3, 2 and 1). We acquired data on these three distinct sample zones.
We show on these acquisitions that optical absorption extracted for layer 1 on zone 3 is corrupted by the presence of the upper layers (epidermis and stratum corneum). Thus we underestimate the absorption of the dermis layer. Using a method (i.e. "depth" method) that takes into
account only the most distant fibers to extract the absorption coefficient, we obtain a better quantification for the dermis layer, approximately equal to the value extracted on zone 1. Clinical experiments were conducted in order to evaluate this "depth" method on biological tissues (Pierre Fabre). For this purpose a panel of thirty volunteers presenting faces with redness was selected. Measurements were done on faces without any agent or product application. On the examined area, color calibrated photos, chromameter data (Fig 2 top) and reflectance spectra were successively acquired.
Figure 2: comparison between a healthy area and a redness area.
Color calibrated photos and absorption parameter μa.
The analysis of the optical properties (Fig 2 bottom) obtained with our DRS instrument shows a higher absorption coefficient between 500 and 600 nm on the redness area in comparison with the healthy area. This wavelength range corresponds to the hemoglobin absorption scope. It is in accordance with the chromameter or the calibrated photographs where an increased redness is seen between both areas. Furthermore, DRS highlights an in-depth phenomenon for several subjects. The so called "depth method" was also employed and confirms these results. Thus, dermis properties can be determined while being less sensitive to the upper layers.
Research topics: Diffuse reflectance spectroscopy, Skin Characterization
A. Koenig, B. Roig, S. Vignoud, J-M. Dinten,
ABSTRACT: We show here the potential of DRS and of our instrument to analyze multilayered tissues such as skin. Thus, we developed a fabrication process to obtain multilayered phantoms
with tunable optical properties. PDMS was chosen as the bulk material. TiO2 was used as light scattering agent. A blue dye and black ink were adopted to mimic, respectively, oxy-hemoglobin and melanin absorption spectra. Furthermore, an in vivo study was carried out on volunteers presenting exhibiting redness faces or rosacea.
DRS analyzing multilayered phantoms
Related Publications:
[1] Koenig A., Grande S., Dahel K., Planat-Chrétien A., Poher V., Goujon C., Dinten J-M., “Diffuse reflectance spectroscopy: a clinical study
of tuberculin skin tests reading.” BiOS, 2 - 7 February 2013, San Francisco, California USA.
[2] B. Roig, M. Guilbert, A. Koenig, O. Piot, F. Perraut, M. Manfait, J-M. Dinten, "Can diffuse reflectance spectroscopy emphasize skin-
collagen alterations due to ageing?", ISBS_SICC October 2013, Milano, Italy.
[3] Roig B., Koenig A., Perraut F., Piot O., Vignoud S., Lavaud J., Manfait M., and Dinten J.-M., “Multilayered phantoms with tunable optical
properties for a better understanding of light/tissue interactions” accepted for oral presentation at conference on Design and Performance
Validation of Phantoms Used in Conjunction with Optical Measurement of Tissue VII, part of SPIE BiOS 2015.

Microfluidics
A generic microfluidic platform
An integrated microfluidic cartridge
A micro-bioreactor
Capillary-based microsystems
Open-surface microflows
Stretchable microfluidic
Acoustics and microfluidics for
biology
3

32
Because of its high toxicity and easy production, ricin is a potent poison that poses an increasing bioterrorism threat to the world. Made from the seeds of the castor bean plant (Ricinus communis), this deadly toxin protein works by inactivating ribosomes, the primary sites in cells for protein synthesis [1]. Immunoassays are the most common approach currently being used for ricin detection. Although they are suited for detecting samples in environmental matrix, immunoassays have several limitations for medical diagnosis in the case of bioterrorist attacks as well as for therapeutic purposes. For example, very low concentrations of ricin are difficult to detect in medical samples, and the development of specific, stable and robust antibodies for ricin is still a challenge. Furthermore, selecting the most relevant body fluid to immunoassay for the toxin is not so obvious. Finally, the adverse effects triggered by ricin may vary from one individual to the next, limiting the usefulness of antibody-based ricin detection for therapeutic orientation. We developed a new approach based on toxicogenomics for diagnosing ricin exposure in the blood of putative victims of an accidental or terrorist attack-related exposure. We hypothesized that the presence of the toxin in a host and its first adverse effects will trigger changes in the gene expression profile in the peripheral blood of the exposed person. Therefore, expression profiling in the blood of suspected victims should facilitate both early diagnosis and therapeutic orientation. Isogenic mice received ricin through intranasal and intravenous exposure. Genome-wide gene expression profiling in the whole blood of the exposed mice was compared with vehicle treated mice to extract and characterize an exposure signature. Emergency medicine requires rapid and portable “near patient” assays. Microfluidic systems provide numerous advantages in this regard, including portability, economies of scale, parallelization and automation, and increased sensitivity and precision, all of which come from the use of small volume reaction. To make the ricin exposure diagnosis assay readily available to patients in an emergency situation related to either a bioterrorism attack or an accidental exposure, the assay developed here has been integrated with a PMMA microfluidic cartridge that is dedicated to expression profiling. This new cartridge stores the reagents
and implements all of the process steps for ricin exposure-diagnosis and therapeutic orientation of the victims, ranging from sample preparation (i.e., extraction of mRNA from 10 µl of whole blood) to performing tens of RT-qPCR reactions in parallel in less than 1 h 30 min [2].
Figure 1: We established a gene expression profile resulting from
ricin exposure and demonstrate its ability to classify exposed vs non-exposed mice from a drop of blood using an integrated microfluidic
cartridge.
We established a new approach to diagnose exposure to ricin from a drop of blood. This approach is based on the host response to the presence of ricin in the body and has the potential to provide a comprehensive picture of the systemic response for therapeutic orientation in emergency situations. A set of 27 genes among 24109 were identified to be relevant for exposure to ricin and were validated by RT-qPCR in a microfluidic cartridge. Ricin diagnosis based on host response developed here is 125 fold more sensitive than comparable immuno-PCR testing. The “point of care” microfluidic cartridge we proposed enables sample preparation followed by tens of parallel
nucleic acid amplifications in a low-cost plastic chip.
Research topics: microfluidic, Point of Care, sample preparation, toxicogenomics
M.L.Y Diakite, J. Rollin, R. Charles, D. Jary, J. Berthier, C. Mourton-Gilles, D. Sauvaire, C. Philippe, G. Delapierre, and X. Gidrol
M.L.Y DIAKITE, J. ROLLIN, R. Charles, D. JARY, J. BERTHIER, C. MOURTON-GILLES, D. SAUVAIRE, C. PHILIPPE, G. DELAPIERRE, and X. GIDROL
ABSTRACT: A long-sought milestone in the defense against bioterrorism is the development of
rapid, simple, and near-patient assays for diagnostic and theranostic purposes. Here, we present a powerful test based-on a host response to a biological weapon agent, namely ricin-toxin. A signature for exposure to ricin was extracted and characterized in mice and then integrated into a plastic microfluidic cartridge. This enabled early diagnosis of exposure to ricin in mice using a drop of whole blood in less than 1 h 30 min.
Point of Care diagnostics by profiling gene expression modification
in Ricin Exposure
Related Publications:
[1] L. Montanaro, S. Sperti, A. Mattioli, G. Testonu, and F. Stirpe, “Inbibition by Ricin of Protein Synthesis in vitro,” Biochem.J, vol. 146, no.
1975, pp. 127–131, 1975
[2] M.L.Y Diakite, J. Rollin, R. Charles, D. Jary, J. Berthier, C. Mourton-Gilles, D. Sauvaire, C. Philippe, G. Delapierre, and X. Gidrol, “Point of care diagnostics in ricin exposure”, Lab-on-a chip, accepted with minor revisions

33
––– Many biological analysis methods require careful preparation of the raw sample, including high purification or/and sample concentration, which is all too often a tedious manual procedure and a cause of variability. FLOWPAD is a generic microfluidic platform [1] that
responds to the need for miniaturization, integration, automation and repeatability of sample preparation with detection methods such as qPCR analysis, immunologic analysis, mass spectrometry or Raman spectroscopy. FLOWPAD is including an automated machine and dedicated single-use cartridges (see fig.1). The cartridge is easily clipped into the system establishing all fluidic and pneumatic connections. FLOWPAD includes various modules, such as heating, magnetic actuation, filtration or lysis -for bacteria or spores- that can be combined depending on the needs of a given application. FLOWPAD can deal with a large range of different samples such as plasma, serum, blood, river water, aerocollected samples, in volumes up to few mL.
Figure 1: Prototype of FLOWPAD instrument for automated
sample preparation.
EXAMPLES of APPLICATIONS: FLOWPAD is able to deliver nucleic acid samples compatible with downstream qPCR detection [2]. Concentration and mechanical lysis of various pathogens (bacteria, spores, viruses) was demonstrated in various sample matrices
(water, soil, coprolite, flour, etc.). (in collaboration with J.M. Elalouf, CEA Saclay, V. Tanchou, CEA Marcoule).
FLOWPAD also allowed purification of diesel contaminated air sampling output results in the suppression of background signal in Raman spectra (see fig.2, in collaboration with E. Schultz, CEA Grenoble), enabling the bacillus subtilis bacteria to be detected.
Figure 2: Comparison of Raman spectra without (in blue) or after
FLOWPAD (in red, named Microprep in graph) sample preparation
FLOWPAD has also been tested for immunoassay detection. The pre-concentration of pathogens results in an increased sensitivity of subsequent Elisa and lateral flow strip analyses, enabling the detection of signals considered negative without FLOWPAD treatment (See fig.3; in collaboration with S.Simon, CEA Saclay).
Figure 3: Comparison of lateral flow strip and ELISA detection
without or after FLOWPAD sample preparation of 1mL sample
FLOWPAD has also been used for the extraction of blood protein biomarkers from serum prior to mass spectrometry detection. Sensitivity was increased by a factor 2 to 20 (in collaboration with V. Brun, Clinatec, Grenoble). FLOWPAD is a versatile microfluidic platform that allows rapid integration of biological assays into an automated microfluidic format. We developped a collection of function on this platform, especially for sample prep protocol and PCR detection.
Research topics: lab-on-chip, microfluidics, sample preparation, qPCR, immuno assay
A.G. Bourdat, M. Flaender, R.C. Den Dulk, R. Charles, N. Verplanck, J. Rodrigues, G. Delapierre
ABSTRACT: FLOWPAD is a generic microfluidic platform that responds to the need of miniaturization, integration, automation and repeatability of biological protocols. We demonstrated extraction, purification and concentration biological analytes for many biological analyses, such as qPCR, ELISA, immuno lateral flow strip, mass spectrometry or Raman
spectroscopy.
FLOWPAD
a generic microfluidic platform for automated sample preparation
Related Publications:
[1] R. den Dulk et al., "FLOWPAD, a generic microfluidics platform for automated sample preparation and PCR detection", CBRN Antibes 16-
18 March, 2015.
[2] J. Vanhomwegen at al., "Ebola assay development", CBRN Antibes 16-18 March, 2015.

34
––– The field of polymeric microbeads has been thoroughly studied in the last decade for applications such as drug delivery and cell therapy. Various studies have demonstrated the interest to cover the microbeads with a
mono- or multilayer of polyelectrolytes (PEMs) either to optimize the mechanical strength, the delivery, permeability or biocompatibility of the microbeads. The Layer-By-Layer coating, the most commonly used method, consists of alternately coating of oppositively charged polyelectrolytes followed by washing steps. Such process is time consuming and requires carefull handling. We then designed and implemented a new automated continuous flow microfluidic device devoted to the production of alginate microbeads followed by the coating of one polyelectrolyte covering shell. The cartridge has standard credit-card footprint (Flow-Pad® Platform) and can be easily plugged into a home-made metallic holder for connection to PTFE fluidic tubings.
Figure 1: Schematic representation of the Silicon/COC hybrid
cartridge including several microfluidic functions.
The whole process is implemented into a home-made disposable microfluidic cartridge based on a hybrid technology composed of two functionalized silicon chips bonded onto COC plates integrating specific modules dedicated for each fabrication step. Precisely, the first silicon microchip contains a Micro Flow Focusing module for the generation of alginate droplets in a continuous oil phase (see Fig.1-a). Two additional channels, used to inject pre-
gelling agent, entered into a 30 cm long serpentine microchannel where the microbeads are gelled (red channel
on Fig. 1 and Fig. 2). Following this stage, microbeads are extracted from the oil phase to the PAH phase (green channel) allowing for PAH deposition. Special attention was paid to surface chemistry, in order to limit microbeads
sticking due to hydrogel affinity with microchannels walls.
Figure 2: Image of the microfluidic hybrid silicon/COC cartridge integrated within the metallic holder (Flow-Pad®).
Images on Figure 4-a show that microbeads produced within the cartridge are spherical in shape (CV=2%) and monodispersed in size (CV 3%) with an average diameter ranging from 130µm to 160µm depending on the applied pressure. Confocal images on Figure 4-b let display a fluorescent and uniformly distributed shell that confirm an
efficient PAH-FITC coating in the second serpentine.
Figure 4: Optical (a) and confocal (b) microscopic views of perfectly 150μm spherical and monodispersed 3wt% alginate beads covered
with one layer of PAH-FITC produced by the cartridges.
This work results in the fabrication of a new closed loop microfluidic hybrid cartridge which automated the online production of 150µm spherical and monodisperse multilayers alginate based microbeads [1].
Research topics: Integrated microfluidics, Cell encapsulation, 3D cell culture
G. Laffite, E. Forvi, C. Hadji, C. Authesserre, F. Boizot, M. Alessio, G. Costa, N. Verplanck, B. Icard, F. Rivera.
ABSTRACT: This paper introduces a new automated continuous flow microfluidic platform
dedicated to the production of hydrogel microbeads followed by an in situ polymeric shell coating. Monodisperse and spherical alginate microbeads of 150 µm diameter covered with one layer of Polyallylamine hydrochloride (PAH) have been obtained. These results are the first step towards the complete automation of polymeric multilayers coating on hydrogel microbeads within a microfluidic cartridge.
Online production of polyelectrolyte coatings on alginate microbeads in an integrated microfluidic cartridge
Related Publications:
[1] Laffite, G., E. Forvi, C. Hadji, C. Authesserre, M. Alessio, G. Costa, F. Boizot, A. Bellemin-Comte, and F. Rivera. "On-Line Production of
Polyelectrolyte Coating on Monodisperse Alginate Beads in an Integrated Microfluidic Cartridge." Paper presented at the Nanotech Biotech:
Pharma et Biomaterials, Washington, June 15-18, 2014.

35
––– This project relates to cell culture in a benchtop micro-bioreactor. Small-scale culture devices offer advantages over standard cell culture and large-scale bioreactors.. Regenerative medicine would benefit from precisely defined environments to better control stem cell proliferation and differentiation that is achievable by microbioreactors. Subsequently, biopharmaceuticals would utilize microsystems’ ability to perform early stage, high-throughput screening. In this work, a unique microfluidic cell culture system was developed that combines for the first time a perfusion function for continuous media renewal
and the use of microcarriers for cell growth support. The overall system is shown on Fig. 1. It relies on a fluidic cartridge which hosts the cell culture. Porous membrane is assembled by screen printing of biocompatible glue in between two PMMA plates where trench channels are milled. This Cell Culture Cartridge (CCC) includes a perfusion function to continuously supply the cells and clean the waste they produce. A homemade holder comprising a clamping system ensures hermetical connections with the culture cartridge. The system can be placed under an upright microscope to observe the cells inside the CCC. A thermal sensor is integrated on top of the CCC in a small trench, for thermal read out. A PET-ITO heater, which consists of a 200-µm-thick polyethylene terephthalate (PET) sheet coated with 400 nm of indium tin oxide (ITO), is inserted between the CCC and holder.
Figure 3: A) Image of the PMMA fabricated device. The culture card
is mounted onto an aluminum holder. The heating element is
inserted between the holder and the card. A thermal sensor is
integrated close to the culture area at the same height where the
cells will be cultured. B) Enlarged view of thermal sensor integration.
A trench is milled in order to glue the sensor.
To demonstrate the cells culture functionality with our system, 2 types of cells were evaluated: Drosophila Schneider 2 insect cells and Human prostate cancer PC3 cells. Cell cultures were performed over the course of a week. Prior to performing bioreactor cell culture, the entire microbioreactor system was sanitized.
Figure 2: Bioreactor cell culture. Images of cells proliferating in the
culture area of the bioreactor. A) Drosophila S2 proliferation. B) PC3
proliferation on microcarriers. Images were captured daily.
The cultures of Drosophila S2 and PC3 cells are illustrated in Fig. 2. Drosophila cells were used as a simple model and without microcarriers to validate the entire system operation. This cell type can be cultured as adherent cells or in suspension due to their weak adherence. PC3 cells were used as the more complex model and were cultured on bead microcarriers. These cells require a constant temperature of 37 °C, and when exposed to air, their media requires a partial CO2 pressure of 5% to maintain its pH level. The growth of Drosophila cells (Fig. 2A) validated the global operation of the bioreactor to move toward the culture of PC3 cells on microcarriers (Fig 2B). The ability to culture different types of cells highlighted the versatility of the bioreactor The culture of Drosophila S2 cells demonstrated the ability of the device to support benchtop and long-term cell growth. In the case of PC3 cell culture on microcarriers, the perfusion flow rate was optimized to 5 µL/min resulting in the effective benchtop microcarrier cell culture of PC3 cells without the need for an incubator. This system paves the way toward the development of portable systems for continuous cell culture that provide adequate, controlled environments.
Research topics: micro-bioreactor, cell culture
F. Abeille, F. Kermarrec, P. Pouteau, X. Gidrol, N. Picollet d’Hahan, V. Agache
ABSTRACT: Microfluidic bioreactors are expected to impact cell therapy and biopharmaceutical production due to their ability to control cellular microenvironments. In this work, we developed a novel approach for continuous cell culture in a microfluidic portable system, based on microbeads carriers as growth support for anchorage-dependent mammalian cells.
Related Publications:
[1] F. Abeille, F. Mittler, P. Obeid, M. Huet, F. Kermarrec , M.E. Dolega, F. Navarro, P. Pouteau, B. Icard, X. Gidrol, V. Agache, and N.
Picollet-D’hahan, Continuous microcarrier-based cell culture in a benchtop microfluidic bioreactor, Inside cover of Lab on a Chip, pp. 3510–
3518. Vol. 14, Lab Chip, 2014. [2] F. Abeille, F. Kermarrec, X. Gidrol, V. Agache, N. Picollet d’Hahan, benchtop micro-bioreactor for continuous mammalian cell culture on
microcarriers, Proceedings of Conference Lab on a Chip 2014.
A benchtop micro-bioreactor for continuous mammalian cell culture
on microcarriers

36
––– Whole blood analysis is the basis of most Point-of-Care and home care devices. Blood contains a huge amount of data on the health of a patient. These data can be grouped in three categories: (1) proteins or metabolites such as glucose, cholesterol, thyroid hormones, and a great number
of rare metabolites; (2) viral load, such as virus, or virus having penetrated RBCs, that can be characterized by their DNA; (3) blood cell data, such as hematocrit level, RBCs count, clotting time, circulating tumor cells, etc. Hence there is a tremendous incentive to design low-cost microsystems that can be used easily and frequently by a patient to self-monitor its own blood, using only a tiny volume from a finger prick. A cooperation between the LETI and the newly created company Avalun has triggered the development of a platform based on a capillary microsystem that enables blood to flow quickly from a droplet to the reaction chambers. A joint effort from a common team has led first to the concept and fabrication of a prototype for analysis of the clotting time (INR), based on the speckle method [1-4].
1.2 cm
1.2 mm0.3 mm
1.5 mm
end reservoirliquid inlet
A B
C
V-grooveBlood droplet
Scale marks (1 mm)
SCF Concus-Finn filamentV-groove and reservoir full of liquid
Empty reservoir
Figure 1: A and B: schematic of the device; C: spontaneous capillary
flow of whole blood in the V-groove.
It has been shown that the special V-shape cross section of the fluidic channel is particularly adapted to produce a very fast capillary flow (less than 0.2 seconds for filling the 1.2 cm channel). In particular, it was demonstrated that the capillary filament in the sharp corner is a powerful engine
for moving the fluid. This fast filling is a requirement because the INR time is of the order of 30 seconds only. New developments are presently underway to enrich the platform, e.g. with a glucose test [5]. On a more theoretical basis, research is underway to understand the capillary flow of whole blood, especially the non-Newtonian behavior. It has been shown that yield stress fluids, such as whole blood, cannot flow under the action of capillary forces indefinitely (figure 2). A special focus on the formation of RBC-aggregates called “rouleaux” and non-Newtonian behavior is made presently.
Figure 2: Travel distance of a yield-stress fluid inside a cylindrical
tube as a function of time (in red) showing an asymptotic limit, which does not occur for shear-thinning fluids (orange curve) and
Newtonian fluids (green curve).
In conclusion, whole blood analysis has great potentialities for the monitoring of the patient health. At the present time the first commercial systems begin to appear on the market, but much is still to be done in this domain.
Research topics: Microfluidic, Capillary, Blood analysis, Point of Care, Home Care
J. Berthier, D. Gosselin, M. Cubizolles, M. Huet
ABSTRACT: Blood contains a large amount of data on the health of a patient. Microsystems that can monitor human blood are of utmost importance in medicine. However blood is a complex fluid that necessitates elaborated microfluidics. Solutions for point-of-care and home-care blood monitoring are presently investigated. A coagulation time measuring device has been developed and a glucose test is on the way.
Development of capillary-based microsystems for blood analysis
Related Publications:
[1] Pouteau P, Berthier J, Poher V. Device for collecting a liquid sample by capillary action and related analysis method. Patent
WO2014135652.
[2] J. Berthier, K.A. Brakke, E.P. Furlani, I. H. Karampelas, V Poher, D. Gosselin, M. Cubizolles, P. Pouteau, Whole blood spontaneous
capillary flow in narrow V-groove microchannels , Sensors and Actuators B, 206, 258–267, 2015.
[3] M. Faivre, P. Peltié, A. Planat-Chrétien, M-L. Cosnier, M. Cubizolles, C. Nougier, C. Négrier, P. Pouteau, Coagulation dynamics of a blood sample by multiple scattering analysis, Journal of Biomedical Optics, 16(5), 057001, 2011.
[4] J. Berthier, “Recent advances in capillary microflows for point-of-care devices” Invited talk, 2015 Nanotech NSTI Conference,
Washington DC, 13-18 June 2015.

37
–––
The study of the dynamics of capillary flows started long ago, in the years 1920s with the works of Lucas, Washburn and Rideal. A physical law for the velocity of capillary flows was proposed for cylindrical tubes. However, in the recent years, the geometry of capillary channels has diversified to meet the requirements of space or biotechnology industry; channels are closed (confined) or open, with various cross sectional shapes. Moreover, sharp interior angles induce capillary precursor filaments, with a special dynamics, as was shown by Concus and Finn. Finally, the used in the laboratories and industries are also various, such as blood, alginates, polymeric solutions, gels, etc., with very different rheological properties.
Hence, dynamics of liquid flows in such geometries must be revisited; this is presently a subject of studies all around the world. At the Leti, we participate to these advances by theoretical, numerical and experimental investigations.
A generalization of the Lucas-Washburn-Rideal law to confined channels of arbitrary cross section has been proposed [1]. This formulation is based on a parallel between “forced flows” and “capillary flows”. In the case of open channels, a canonical expression for the velocity has been derived [2] (fig.1 and 2).
Markers(distance 5 mm)
Capillaryfilament
TurningU-groove
Figure 1 : A : capillary flow of red tinted water in an open
rectangular U-groove (plasma O2 treated PMMA). The precursor
capillary filaments are clearly seen in the inset.
The particular case of suspended channels, where a liquid flows in a structure devoid of ceiling and floor, has been specially investigated (fig.3). It is foreseen that such flows—when the liquid is a polymeric solution— could be the basis for suspended membranes or µDOTS, once the polymer is gelled [3].
A
2 cm
Inlet port Outlet port
U-channel
Figure 2 : Penetration distance of tinted water in a winding open
rectangular channel as a function of time and comparison with the
proposed analytical formulation.
Figure 3 : Sketch of a suspended capillary flow between two vertical
plates and in a winding channel; on the right, whole blood capillary
flow in a winding suspended channel.
The dynamics of capillary precursor filaments, also called Concus-Finn filaments, has also been investigated, both numerically and experimentally [4].
Figure 4 : Left : Evolver simulation of capillary filaments; right, experimental view of the same phenomenon.
In conclusion, the understanding of the dynamics of capillarity has seen important advances in the year 2014. The effort will continue next year to clarify the flow behavior of non-homogeneous fluids in varying cross section channels.
Research topics: microfluidics, capillarity, Point Of Care systems
J. Berthier, D. Gosselin
ABSTRACT: The dynamics of spontaneous capillary flows is of utmost importance in
biotechnology, especially for point-of-care and home-care applications. It is a necessity to know the time necessary for the filling of a component by the body fluids, and the penetration distance that can be achieved. An effort is underway to clarify the dynamics of capillary flows in the various geometries of modern devices and for the rheological complex biologic liquids.
Capillarity, spontaneous capillary flow, open-surface microflows
Related Publications:
[1] J. Berthier, D. Gosselin, E. Berthier, A generalization of the Lucas-Washburn-Rideal law to composite microchannels of arbitrary cross-
section, Microfluid. Nanofluid., in print, 2015.
[2] J. Berthier, D.Gosselin, N. Villard, C. Pudda, F. Boizot G. Costa, G. Delapierre, The dynamics of spontaneous capillary flow in confined
and open microchannels, Sensors & Transducers, 183 (12), 123-128, 2014.
[3] J. Berthier, K. Brakke, D. Gosselin, A-G. Bourdat, G. Nonglaton, N. Villard, G. Laffite, F.Boizot, G. Costa, G. Delapierre, Suspended
microflows between vertical parallel walls, Microfluid. Nanofluid. , in print, DOI 10.1007/s10404-014-1482-z [4] J. Berthier, K. Brakke, D. Gosselin, M. Huet, E. Berthier, Metastable capillary filaments in rectangular cross section open microchannels,
AIMS Biophysics, 1,(1), 31-48, 2014.

38
–––
The material used in this work is a hyper-elastic polymer named Ecoflex 00-50. This bi-component silicone material is able to withstand large deformations with a Young’s modulus around 200kPa and a maximal stretching ratio before breaking of 980%. Ecoflex was purchased from Smooth-On, this material was initially used for ludic applications (movie industry), but also for electronic encapsulation, and more recently for soft robotic [1]. Material characterization and simulation: The mechanical properties of Ecoflex were characterized using bulge test technics. This testing technique determines the mechanical properties of hyper-elastic thin films by measuring the deformation that forms in response to the application of a controlled differential pressure. The experiment shows that the deformation presents a perfect spherical shape. This deformation is reversible and no creep or aging effects were observed. The amplitude of deformation can be predicted using a hyper elastic model (Mooney-Rivlin model) [2].
Figure 1: Left, example of strain sensor design. The channels are 200x200µm2. Right, sensor response to stretching.
Strain sensor: [2] The Strain sensor is based on a microchannel molded inside the elastomer. This channel having a serpentine shape is filled with an electrically conductive fluid. A liquid metal alloy (Galinstan: gallium/indium/tin alloy) was used in our experiment. The deformation of the sensor induces a change of the channel’s shape, and thus a modification of its electrical resistance. Typical measurements of resistance recorded during a large deformation are presented in Fig. 2. In this example, the resistance is multiplied by 8 when the stretching ratio goes from 0 to 255 %. Such a sensor was
characterized and modeled for different serpentine shapes and orientations. Other experiments showed that these sensors are reliable after several cycles without any degradation even for high deformations. Such performances are impossible to obtained with standard technology (ex. silicon MEMS). This new technology sensor is a promising approach to develop sensors dedicated to monitor large deformations of non-conformal shapes such as skin, clothes, sport equipment etc. Smart blister for lab on a chip application: [3] Inspired from the bulge test experiment, the idea was to develop smart blisters. The inflating elastomer reservoir is used to store liquid reagents. The spherical cap shape defines the confined volume. This reservoir has a volume ranging from 0 to a few 100µl, and the exact volume can be continuously monitored by measuring the cap geometry (ex: the height of the spherical cap). This is done by an imaging acquisition system. Figure 2 presents a polymer card that integrates a fluidic network composed of channels and two valves, in order to fill or empty the stretchable reservoir. This device is able to dispense a series of small volumes by controlling the opening/closing of the valve while the volume of the stretchable reservoir is continuously monitored. Experiments show that this programmable, on-demand and integrated dispenser system is reproducible (CV<5%). Finally, a dilution range was performed using à combination of 3 reservoirs on a single fluidic card.
Figure 2: Smart blister. Left, schematic. Right, stretchable reservoir
filled with 1ml of colored liquid. The reservoir is embedded in the
fluidic card.
Conclusion: The combination of soft materials with microfluidic technologies offers new possibilities in term of flexibility and stretchability for future mechanical sensors. Furthermore, this soft material can also be useful to develop more portable and integrated microfluidic devices for future bio-medical applications.
0
2
4
6
8
10
12
14
16
18
0 10 20 30 40 50
Re
sist
ance
in O
hm
Stretching in mm Experiment
a)
Research topics: Microfluidic, Sensor, Stretchable, Hyperelastic, Point Of Care
Y. Fouillet, F. Pineda, F. Bottausci, L. Malaquin (Institut Curie)
ABSTRACT: This work aims at exploiting the hyperelastic characteristics of new elastomers. It will especially focus on materials (Ecoflex, for example) whose elongation is very important (400% or even 1000%) while still remaining elastic. The materials will be characterized,
modeled and used in microfluidic applications: a highly stretchable sensor and a lab-on-a-chip integrated fluid dispenser.
Stretchable microfluidic
Related Publications:
[1] Martinez R.V., Glavan A., Keplinger C.., Oyetibo A.I, and Whitesides G.M. Soft Actuators and Robots that are Resistant to Mechanical
Damage, Adv. Func. Mater., 2014, 24, 3003-301.
[2] Pineda F., Bottausci F., Icard, B, Malaquin L., Fouillet Y., Using electrofluidic devices as hyper-elastic strain sensors: Experimental and
theoretical analysis. MicroElectronic. Microelectronic Engineering, Volume 144, 16 August 2015, Pages 27-3.
[3] Presented at “Artificial Polymers, Micro-Structured Systems and Living Matter” meeting, Paris, 2015

39
–––
When an acoustic wave propagates in a viscous fluid, a nonlinear phenomenon called acoustic streaming can arise. Indeed, for certain conditions (viscosity, frequency), the sound can induce a stationary flow in the fluid bulk. The acoustic streaming is the reciprocal of the noise emitted by
a turbulent flow. This nonlinear effect is used here for biological applications. Patterning - Since 1787 and the pioneering work of the German physicist E. Chladni, it is well-known that a vibrating plate can move the matter along the plate towards the nodal lines of the plate, i.e. the lines where the vibration amplitude is zero. It has been recently shown that for very small particles, the streaming effect causes particles to move toward the antipodal sites, forming inverse Chladni patterns, but the conditions for this to occur in air are very demanding. Here, we report an example of patterning at the micro scale by streaming using thin silicon membranes. This research work has been led with the LETI/DCOS department (S. Fanget and F. Casset) taking advantage of their skills in PZT (piezoelectric ceramic) deposition on thin (about 5 µm) silicon membranes. We show (see fig.1) that micro-beads initially randomly spread in a 500 µm cavity can be moved towards the antinodes of the streaming field above the plate and be arranged according to the plate modes. More interestingly, when shifting the acoustic frequency, we have shown that it is possible to make the beads rotate, jumping from one well to the nearest one and so forth. Actually, in microfluidics, viscous effects are in general much stronger than inertial effect because of the tiny size of fluid containers, so that very common operations such as mixing are made difficult for the absence of turbulence in the flow. Here, we overcome this limitation by taking advantage of the streaming effect by driving the plate vibrations in such way that it acts like acoustic micro-mixer that is able to mix in a contactless manner solutions containing beads or cells for example.
Figure 1 (top): Patterning of micro-beads in an acoustic cavity of
radius 800 micrometer. The sound wave is emitted in the low ultrasound range (<200 kHz). Particles are trapped within the
antinodal zones of the field. (bottom) Mixing and rotation of beads.
Rotation - A second example of application of micro-streaming in the field of microfluidics and cell handling is the acoustorotation: contact-less manipulation of a single cell is still a challenge especially if the cell orientation has to be well defined. Moreover, a continuous rotation of an object (like a micro-motor) is also a remaining challenge. We have recently shown that acoustic streaming produced by two orthogonal out of phase ultrasound standing waves are capable to exert a torque on individual or multiple objects. We are now working on a biochip that could trap and make cells spin to get a further insight on the cell mechanics itself, which is of great importance in biology, namely in cancer issues.
Figure 2: (left) Waveforms required for rotation of a particle by
streaming. Two orthogonal out of phase waves are impinging on the
particle. (right) Sequence of acoustorotation of a single cell (Hela-
type).
Research topics: acoustics, microfluidics, biology
V. Aubert, P-Y. Gires, D. Rabaud, C. Poulain
ABSTRACT: Acoustic waves can be used to exert a radiation force upon particles. It can also be interesting to take advantage of another effect, the acoustic streaming, to move particles or cells. Here, we show some applications of streaming for patterning and mixing a suspension of cells or micro-beads., By a precise control of the acoustic field, it is possible to use streaming to
exert a viscous torque on very small objects without contact. In the future, these techniques could enable to move any particle along any arbitrary path and any degree of freedom.
- Acoustics and microfluidics for biology -
Using the streaming effect to mix, form patterns, rotate living cells
Related Publications: [1] I. Bernard, P. Marmottant, D. Rabaud, C. Poulain and P. Thibault, " Combined acoustic torques and forces on spherical particles
obtained by the leakage of two standing orthogonal surface acoustic waves", Conference Acoustofluidics, 2014.

40
–––
When an ultrasound field is imposed on a fluid containing a suspension of particles, the latter will be affected by the acoustic radiation force arising from the scattering of the acoustic waves by the particle. The particle motion resulting from the acoustic radiation force is denoted acoustophoresis. It is very similar to the dielectrophoresis and plays a key role in on-chip cell handling. The acoustic waves present some advantages compared to other techniques for contactless micromanipulation because they do not damage biological objects at non negligible intensity. We develop chips in order to either concentrate cells in a micro-channel or form cell patterns above a substrate. In order to generate an acoustic field in a microfluidic channel, a piezoelectric ceramic can be pressed against a silicon chip in which the channel is etched. When the ceramic is excited by a sinusoidal electric field, it vibrates at the same frequency and makes the microchannel resonate.
At the fundamental frequency, there is a half acoustic wavelength in the width of the channel with a pressure node in the center. Micro-particles flowing in this channel sustain an acoustic force from this field pushing them towards the minimum pressure regions. In the same manner, using 4 piezo ceramics in a rectangular chamber, a 2D standing field is formed with a periodic distribution of pressure nodes. We have developed a code to simulate this pressure field and its potential, called Gor'kov potential, from which the acoustic force can be calculated (see fig.1) :
),(4 3 acac EkRF
k being the wave number, R the particle radius, Eac the acoustic energy and Phi is the acoustic contrast factor depending on the density and elasticity of the particles. In some rare cases, this factor can be negative (attraction towards the anti-nodes) and lead to very efficient sorting.
Figure 1: Simulations of the pressure field, acoustic potential and
acoustic force field in a square chamber.
When the behavior of the acoustic field is completely predicted, it is possible to produce microfluidic chips to manipulate micro-particles such as biological cells, bacteria or micro-beads. For example, it is possible to focus these objects in the center of a microchannel to increase their concentration, to guide them in a complex microfluidic network or for medium-exchange applications (see fig.2).
Figure 2: (top) Principle of changing the middle of the particles.
(bottom) Acoustic focusing of fluorescent beads in a 250 µm wide
silicon microchannel.
It is also possible to produce patterns in a plane or bulk configuration to trap and hold cells during antibiotic tests for example or to precisely place different populations of cells (see fig.3).
Figure 3: Patterns of cells in bulk (left, high aspect ratio cylindrical
traps) and on a vibrating plate (right, one cellular layer).
Research topics: acoustics, microfluidics, biology
V. Aubert, M. Cubizolles, D. Rabaud, C. Poulain ABSTRACT: Acoustics waves (i.e. pressure waves) can exert forces upon very small particles such as beads, microbubbles, cells or bacteria. This phenomenon arises from the radiation pressure
effect, analogous to the one used in optics with optical tweezers. In the lab, we design, package and implement acoustics on microfluidics chips in order to take advantage of a non-intrusive and contactless technique to address biological issues like sample preparation (aggregation, separation, patterning).
- Acoustics and microfluidics for biology - The radiation force: a contactless micromanipulation technique
Related Publications:
[1] I. Bernard, P. Marmottant, D. Rabaud, C. Poulain and P. Thibault, " Combined acoustic torques and forces on spherical particles
obtained by the leakage of two standing orthogonal surface acoustic waves", Conference Acoustofluidics, 2014.

Sensors
Electrical impedance tomography
Bioelectrical impedance sensors
Electrochemistry
Electrochemical transistor
Analysis of organic pollutants in water
Silicon based micro-preconcentrators
VOCs sensors
Smart bandage
Supercritical Fluid Deposition for
biosensing
4

42
–––
Electrical impedance tomography (EIT) consists in probing biological tissues with low amplitude alternating electrical fields through surface source and detector electrodes, and in analyzing the medium's response so as to reconstruct 3D electrical characteristics [1]. EIT instrumentation requires a wide dynamical range, from a few µV to hundreds of mV, along with a large operating frequency window, from a few Hz to MHz, while maintaining a measurement precision below 1%. These specifications enable to address multi-spectral reconstructions with multiple source-detector locations. A modular architecture of a portable measurement system was proposed, combining spectroscopic and multi-site operation capabilities (Figure 1). A corresponding demonstrator was built, enabling in-vivo spectroscopy characterization on implanted electrodes around the rodent vagus nerve, and in
vitro tomography sensing using saline phantoms [2].
Figure 1. Overview of the developed multi-frequency EIT
instrumentation
Numerical modeling enables measurement prediction and sensitivity analysis, both required for parameter estimation. Each control volume in the imaging domain contributes to the electrode voltages, depending on its conductivity, its distance from source and detector electrodes and the amount of current that reaches it. The sensitivity of a particular source-detector configuration involves the electric field in the actual source and virtual detector configurations (Figure 2).
Figure 2. Actual (a) and virtual (b) source and detector
configurations for EIT sensitivity analysis.
Sensitivity patterns were interpreted following a transport back-transport approach [3], [4], [5]. This allowed revisiting the EIT reconstruction framework enabling cost-efficient: 1. Difference measurement prediction, 2. Sensitivity map estimation, 3. Parameter estimation. Computation and assembly of the sensitivity matrix were spared in the process, and iterative algorithms were leveraged for inversion using only the source and detector electric fields. An unsupervised method to choose the iteration number, acting as regularization parameter, was developed. These methods also allow to enhance source and detector location sites at a low computational cost. Validation experiments were performed on a saline phantom with different conductive inclusions (Figure 3).
Figure 3. Cross sections and isosurface for 3D time difference EIT
parameter estimation using the sensitivity-matrix-free framework.
Gains in the computational workflow over traditional inversion process were substantial given the geometrically-accurate high-density 3D meshes required to account for current density spreading inside the imaging domain.
Research topics: Instrumentation, Numerical Modeling, Signal Processing
A. Fouchard, O. David, S. Bonnet
ABSTRACT: Electrical impedance tomography is an emerging non-invasive technique in medical imaging. To eventually translate this technology to clinical diagnosis, there is a need for accurate
multi-frequency portable instrumentation and cost-efficient numerical models. To reach this goal, we developed a demonstrator of a spectroscopic multi-site measurement system, along with numerical methods to address modeling and parameter estimation with 3D high-density meshes. Validations were performed in vitro using saline phantoms. The method is envisioned to be used for disease detection, for functional imaging and for surgical implant viability follow-up. .
Body characterization by electrical impedance tomography: instrumentation and data processing developments
Related Publications :
[1] A. Fouchard and P. Pham, "Micro-tomographie d’impédance électrique in vivo : une nouvelle modalité d’imagerie ?," Observatoire des
Micro et Nanotechnologies : Avancées, Tendances et Perspectives, pp. 232 – 235, 2014.
[2] A. Fouchard, A. Noca, S. Bonnet, P. Pham, V. Sinniger, D. Clarençon, and O. David, "Modular architecture of a multi-frequency electrical
impedance tomography system: Design and implementation," in 2014 36th Annual International Conference of the IEEE Engineering in
Medicine and Biology Society (EMBC), 2014, pp. 6076–6079.
[3] A. Fouchard, S. Bonnet, L. Hervé, and O. David, "An efficient transport back-transport framework for EIT," Proc. 15th Int. Conf.
Biomed. Appl. Electr. Impedance Tomogr., p. 29, 2014.
[4] A. Fouchard, S. Bonnet, L. Hervé, and O. David, "Inversion without Explicit Jacobian Calculations in Electrical Impedance Tomography,"
J. Phys. Conf. Ser., vol. 542, no. 1, p. 012002, Oct. 2014. [5] A. Fouchard, S. Bonnet, L. Hervé, and O. David, "Large scale sensitivity-matrix-free reconstruction framework for EIT," submitted to
Physiological Measurement.

43
–––
The development of portable, low-cost medical devices suitable for homebased monitoring, together with the decrease in medical supervision and nursing care as healthcare progressively moves from the clinic through to home-based monitoring, will potentially lead to a healthcare revolution. Bioelectrical Impedance Analysis (BIA) can form part of this adventure as miniaturized electronics is today a reality. BIA consists in measuring the electrical impedance of tissues between electrodes in contact with the patient’s skin. Over the past few decades, commercial devices for BIA have been developed and BIA has found clinical use in, for example, the evaluation of changes in hydration and nutritional status of patients with renal disease, for monitoring nutrition and more recently for wound monitoring. Although BIA is attractive in these areas of medical research, the technique is still largely empirical and needs to be improved. The main difficulty with this monitoring technique is associated with the lack of comprehension and quantification of the delivered electrical current density distribution inside each tissue involved during the in vivo impedance measurement. The use of easy-to-build saline phantoms as physical models to represent biological tissues is a first approach as it provides a useful tool to quantify the influence of both the sensitivity matrix and anisotropy on the measured impedance [1]:
Figure 1: Impedance measurement performed on a saline phantom
(INSA Lyon, left), numerical simulation of the saline phantom
(middle) and impedance comparison (right) between the measured
(solid lines) and the computed (dashed lines) impedance (norm in
blue lines, phase in red lines).
However saline phantom studies have limitations due to the high level of structural and electrical behavior complexity of biological tissues. For BIA applications, the numerical simulation tool loses its predictive ability as it meets the same difficulties. The potentiality of recent commercial codes to segment Magnetic Resonance Images (MRI) into
realistic geometries and Finite Element (FE) meshes potentially overcomes the geometric difficulty (see Fig. 2). Even if only a few papers have explored the question of tissue electrical properties so far, we believe that their identification, remains an unresolved question and hence numerical simulations need to be systematically coupled with spectroscopic impedance measurements. Figure 2 shows an example of one electrode layout studied in the ANR DIALYDOM project where local BIA is used to monitor the hydration status of dialysis patients:
Figure 2: Impedance measurement performed on the calf using a
longitudinal 4 electrode configuration (left), corresponding FE
geometry built from MRI segmented geometries using the Simpleware ScanIP™ software (middle), impedance norm
comparison between measurement (black line, Impedimed SFB7
device, applied current 200 µA) and the corresponding FE Comsol
Multiphysics™ computation (blue line) (right).
When in good agreement with impedance spectroscopy, numerical simulation allows the estimation of each tissue contribution on the global impedance and new designs can be experimented in silico:
Figure 3: Internal electrical potential distribution (V, colors)
and current density distribution (vectors) for the longitudinal configuration on the calf (left), resulting energy (µW) vs frequency
deposited in each tissue during the impedance measurement (right).
In conclusion, our results show that numerical simulation, if using electrical properties based on impedance spectroscopic measurements, can be used to design more effective BIA devices.
Research topics: AC electric fields and living matter
P. Pham
ABSTRACT: Numerical simulation can help design effective multi-frequency bioimpedance devices as it provides a mean to quantify each tissue contribution on the measured impedance. Many numerical simulation studies in bioimpedance applications forget to validate the numerical model before its use as a designing tool. We show how impedance spectroscopy and representative in vivo geometries due to precise magnetic resonance imagery segmentation can help create a realistic numerical model.
Numerical Modeling together with Impedance Spectroscopy for designing Bioelectrical Impedance Analysis sensors.
Related Publications:
[1] P. Pham, P. Bogonez-Franco, E. McAdams, "Design Of Bioimpedance Sensors: Unique Study Tool Composed Of Saline Phantoms,
Numerical Modeling And Impedance Spectroscopy", Oral Communication at the International Workshop on Impedance Spectroscopy 2014,
September 24-26 2014, Chemnitz, Germany. [2] P. Pham, S. Roux, F. Matonti, F. Dupont, V. Agache, and F. Chavane, “Post-implantation impedance spectroscopy of subretinal micro-
electrode arrays, OCT imaging and numerical simulation: towards a more precise neuroprosthesis monitoring tool,” J. Neural Eng., vol. 10,
no. 4, p. 046002, Aug. 2013.

44
–––
Pseudomonas aeruginosa is the 4th most frequent bacteria in nosocomial infections1. It infects 70% of cystic fibrosis patients who are over 18 years of age [2] and is the leading cause of morbidity and mortality for these patients.
The aim of the current study is to develop a new tool for in situ understanding of the Pseudomonas aeruginosa complex bacterial communication system [3]. This research is based on an electrochemical sensor that is able to monitor electrochemical messengers [4,5] in the culture medium which in this study are (see Figure 1.) Pseudomonas Quinolone Signal (PQS), Pyocyanin (PYO) and 2’-aminoacetophenone (2-AA).
Figure 1: The 3 PA electrochemical messengers studied.
The three studied metabolites (PQS, PYO and 2-AA) are detected at three separate standard potentials and exhibit three different electron exchange pathway (reversible, quasi-reversible and irreversible behavior, respectively) which makes them identifiable as shown on Figure 2.
Figure 2: Cyclic voltammetry vs Ag/AgCl of PQS, PYO and 2-AA, scan
rate 50mV/s on glassy carbon.
Supernatant of Pseudomonas aeruginosa PA01, grown in LB, were extracted at different culture times (0, 4, 6, 8 and 24h) and analyzed by square wave voltammetry on glassy carbon electrode. As shown on Figure 3., several peaks appear during growth. The most intense one, which increased during the experiment, is clearly identifiable as the toxin PYO. It is noteworthy that its shift toward negative
potential along time shows us pH rises (see Figure 4.). Specifically, PQS peak appears at 4h, grows at 6h and decreases at 24h. Other peaks are seen and they need further experiments in order to be assigned to the appropriate species. 2-AA could not be observed in this experiment because of intense inner LB peak at similar potential.
Figure 3: Square wave voltammetry of PA01 supernatant on glassy
carbon electrode
Figure 4: Calculated pH and OD versus growth time.
The project of monitoring Pseudomonas aeruginosa communication through electrochemistry is in progress. Some promising results are already obtained on PA01 supernatant on glassy carbon electrodes. We are also developing strategies based on large developed-surface electrode to increase the sensitivity of this method.
PQS PYO 2-AA
Research topics: Bacteria, Pseudomonas Aeruginosa, Electroanalysis
J. Oziat, Sylvie Elsen, P. Marcoux, R.M. Owens, G. Malliaras, P. Mailley
Electrochemistry as a tool to detect components of Pseudomonas Aeruginosa quorum sensing
PYO
PQS
ABSTRACT: This paper presents an original method for the design of Bulk Acoustic Wave (BAW) filters for a new class of applications: ultra-low-power, narrow-band RF filtering. A filter co-
design methodology, based on existing BAW resonator technology and fabrication processes, is developed and the link between decreasing filter bandwidth and decreasing power consumption of the associated integrated circuit is demonstrated. Depending on required bandwidth, the power dissipation of the driving electronics can be reduced by large factors (10 to 40).
Related publications:
1. European Centre for Disease Prevention and Control, Point prevalence survey of healthcare-associated infections and antimicrobial use in
European long-term care facilities, 2013
2. Cystic Fibrosis Foundation, Patient Registry - Annual Data Report to the Center Directors, 2013 3. P. Nadal Jimenez, et al, Microbiol. Mol. Biol. Rev., 2012, 76, 46-65
4. L. Zhou, et al, Chem. Commun., 2011, 47, 10347–10349
5. D. Sharp, et al, Bioelechem., 2010, 77, 114-119

45
Glucose is a well know metabolite which give highly relevant information for diabetics. Lactic acid in the other hand was not that much studied in the past decades but its popularity in the diagnosis of shock and myocardial infarction and in sports medicine is increasing. Classical ways to detect glucose and lactate are usually based on amperometry of spectrometry and requires blood samples. Sensing those metabolites in other types of media would allow easier, non-invasive sensing. Since 1980's a new device has raised as promising alternative to classical amperometry systems: the organic electrochemical transistor (OECT). This device uses organic polymers that are good transducers for biologic samples, conferring at the same time signal amplification.[1] Moreover, they are compatible with flexible substrates, allowing the use of printing technics.[2] The aim of this work is to detect glucose and lactate with a screen-printed organic electrochemical transistor. The device comprises two poly(3,4-ethylene dioxythiophene) doped with poly(styrene sulfonate) (PEDOT:PSS) electrodes, the gate and the channel of the transistor. We deposit on top of the transistor, a hydrogel electrolyte layer comprising an electrochemical mediator and the enzyme.
Figure 1 : Current-voltage characteristic of an organic electrochmical
transistor (OECT)
By switching gate voltage and drain voltage (see fig.1), we choose the potentials giving the maximum of transconductance.
Upon addition of the metabolite in solution, the mediator deposit electrons to the gate electrode thereby changing the potential at the gate/electrolyte interface according to the Nernst equation. Since the gate bias is held constant, the potential at the electrolyte/channel changes as well, causing a variation in the drain current by:[3]
∆𝐼𝐷𝑆 = 𝑔𝑚 ∙ ∆𝑉𝐺𝑆 = 𝑔𝑚 ∙kT
e∙ ln [C]
where gm is the transconductance of the device and C is the concentration of the mediator molecules contributing electrons to the gate. The overall process is summarized in fig 2.
Figure 2 : Schematic view of the amplified sensing of metabolites
with OECTs.
Solid state and flexibility are two important parameters that allows the development of wearable device. We developed here a solid electrolyte that avoid the leakage of the enzyme and the mediator by entrapment and covalent binding respectively. The screen printing process allowed us to successfully fabricate OECTs for use in biosensing. Lactic acid determination in sweat was also performed as proof of concept (see fig3).
Figure 3 : Normalized current response of the sensor upon addition
of sweat.
Research topics: Printed Organic Electronics, Enzymatic Biosensor, Electroanalysis
G. Scheiblin, A. Aliane, R. Coppard, R. Owens, G. Malliaras, P. Mailley
Screen-printed organic electrochemical transistor for the detection of glucose and lactic acid
ABSTRACT: We report in this article, an alternative way to detect glucose and lactic in biological media by the use of organic electrochemical transistors (OECTs). To this end, a solid electrolyte
was developed and the transfer to printing process was successfully implemented. The obtained biosensors were able to sense glucose and lactic acid in ideal media, and a validation in complex media (sweat) was also performed.
Related Publications:
[1] D. Khodagholy, J. Rivnay, M. Sessolo, M. Gurfinkel, P. Leleux, L. H. Jimison, E. Stavrinidou, T. Herve, S. Sanaur, R. M. Owens and G. G.
Malliaras, Nat Commun 2013, 4, 2133
[2] T. K. David Nilsson, Per-Olof Svensson, Magnus Berggren, Sensors and Actuators B: Chemical 2002, 86, 193-197.
[3] D. A. Bernards, D. J. Macaya, M. Nikolou, J. A. DeFranco, S. Takamatsu and G. G. Malliaras, Journal of Materials Chemistry 2008, 18,
116.

46
–––
Polycyclic aromatic hydrocarbons (PAHs) are considered to be persistent organic pollutants (POPs) due to their slow rates of degradation, toxicity and potential for both long-range transport and bioaccumulation in living organisms. These compounds are particularly monitored in environmental waters to check their compliance with the environmental quality standards (EQS), defined for 8 PAHs in surface waters (continental, transitional and coastal) by the European Water Framework Directive (2000/60/EC, 2008/105/EC, 2013/39/EU). Moreover, water intended for human consumption has to meet the minimum requirements laid down for five PAHs in the European Drinking Water Directive (1998/83/EC).
PAHs in environmental waters are monitored by laboratory analyses which imply important costs and labor, and require sampling, transport and storage steps which can induce biases on the final results due to analyte loss or sample contamination [1]. Yet no portable solution assures selective measures of all PAHs at sub-µg/L levels. In this context, our team has developed a miniaturized pre-concentration device intended to be used in a portable
system for monitoring PAHs directly in environmental waters. Our work is carried out with a lab-on-a-chip device, consisting of a silicon/glass microfluidic device functionalized with an adequate phase for PAH extraction and concentration (see fig. 1). Extraction of organic compounds from a liquid matrix with this type of device has been recently patented by our laboratory [2]. A first study evaluated the performances of a lab-on-a-chip functionalized with polydimethylsiloxane (PDMS) in comparison with Stir-Bar Sorptive Extraction (SBSE), a reference method based on extraction by sorption of dissolved compounds from the aqueous phase by a magnetic bar covered with PDMS [3].
Figure 1: Picture (a) and scanning electron microscope (SEM) images
(b) of the microfluidic device used for PAH extraction from water
The pre-concentration of 10 mL of 5 µg/L spiked solutions with the microfluidic device led to equivalent extraction recoveries to SBSE for the high molecular weight PAHs (≥ 4 aromatic rings) in approximately 70 times less time (20 min vs. 24 h). However, the performance of the microchip had to be improved for the lightest PAHs (2-3 aromatic rings). As PDMS only has high affinity for the apolar compounds (with log Kow > 5.5), a new porous layer with higher affinity with polar compounds was developed. The microchips functionalized with this phase showed equivalent recoveries to SBSE for all PAHs when extracting 10 mL of a 5 µg/L spiked solution (see fig. 2). After optimization of the microchip design and the operational parameters, equivalent recoveries to SBSE were obtained with an excellent extraction time of 1 min. Moreover, our device showed interesting performances with real environmental waters: due to the high surface area of the microchip, competition between the matrix and the analytes is reduced. The developed phase also presents the benefit of being applicable by full-wafer functionalization, a process which reduces manufacturing time and labor, and improves chip to chip reproducibility (patent pending and article for submission in 2015).
Figure 2: Comparison of extraction recoveries obtained for 15 PAHs
with a reference laboratory method (SBSE) and a microchip
functionalized with a novel porous layer.
Research topics: Sensor, Lab-on-a-chip, Water analysis, Organic pollutants
L. Foan, F. Ricoul, A. Bellemin-Comte, N. Verplanck, S. Vignoud
ABSTRACT: To date, no portative equipment enables in situ determination of polycyclic aromatic hydrocarbons (PAHs) in environmental waters with adequate selectivity and sensitivity. To build a cost-effective and high-performance portative system, lab-on-a-chip devices have been
developed to pre-concentrate, separate and quantify the micropollutants. Our micro-extraction of low-volume samples on functionalized microfluidic chips leads to equivalent extraction recoveries to a reference laboratory method in approximately 1,500 times less time.
ALEC PROJECT: Development of lab-on-a-chip devices for in situ analysis of organic pollutants in environmental waters
Related Publications:
[1] L. Wolska, M. Rawa-Adkonis, J. Namieśnik, "Determining PAHs and PCBs in aqueous samples: finding and evaluating sources of error",
Analytical and Bioanalytical Chemistry 382 (2005) 1389-1397.
[2] F. Ricoul, Device and method for extracting compounds contained in a liquid sample with a view to analysing them, Patent Application
WO2013144330 A1 (3/10/2013).
[3] L. Foan, F. Ricoul, S. Vignoud, "A novel microfluidic device for fast extraction of polycyclic aromatic hydrocarbons (PAHs) from environmental waters – Comparison with stir-bar sorptive extraction (SBSE)", International Journal of Environmental Analytical Chemistry
(2015), DOI: 10.1080/03067319.2014.994617.

47
––– Gas chromatography (GC) is a first choice laboratory technique for gas analysis. Following the development of microtechnology, efforts have been done since the late 70s towards the development of lab-on-a-chip analysis systems [1]. Research is motivated in particular by the increasing
needs for low cost, low power, highly selective, portable systems with detection in the ppb range. It concerns applications from trace quantification of volatile organic compounds (VOCs) in air quality monitoring to chemical and explosive hazards detection. In addition to the three main GC technological bricks (injection, separation and detection), the aim of preconcentration is to gain several order of magnitude in limit of detection [2, 3, 4]. The work presented here demonstrates on toluene that silicon preconcentrators filled with Tenax adsorbent can keep the system efficiency (peak width).
Micro-preconcentrator chips size is 8 mm*21 mm [5]. The 400 µm deep inlet/outlet and central cavity for adsorbent have been etched in silicon on the front side by deep reactive ion etching (DRIE). Cavities volumes range from 3µL to 30µL. Chips are sealed on top with a Pyrex glass by anodic bonding. On the back side Ti/Pt thin film heater and thermoresistive probes have been deposited by sputtering. Packaging ends with filling cavities with Tenax-TA adsorbent and gluing the inlet/outlet with silica capillaries (Figure 1).
Figure 1 : Example of Si micro-preconcentrator chip filled with
Tenax. (a) Front side, (b) back side.
Chips are connected as sampling loop to a Valco 6 port valve. On the loading position, a pump is used to load the preconcentrator with the sample during 10s to 5 minutes at typical flow rates of 1-10mL/min. Once the loading is done, the pump is stopped and the chip is heated with a 12V
standard power supply during 10s in order to reach 220°C. The valve is then switched to inject the concentrated sample in a 2m long PDMS coated column followed by a Flame Ionization Detector (Agilent 7890). GC oven temperature is set to 40°C.
We compare chromatograms obtained with/without preconcentration (Figure 2). Thanks to preconcentration, FID signal increases from 5pA to more than 1380pA, and the area of the toluene peak is multiplied by more than 200 (preconcentration factor) for a 10s sampling. Interestingly,
peaks width with/without preconcentration remains similar (0.8s), showing that the studied Si preconcentrator can keep the system efficiency.
Figure 2 : Preconcentration tests with a 10 ppm toluene in nitrogen
sample : chromatograms obtained with (red) and without (blue)
preconcentration (6 μL cavity, 10s sampling duration).
From 10s to 300s sampling duration (and a 6 µL cavity), preconcentrations factors increase from ~200 to more than 7000, without reaching the breakthrough volume. For Tenax cavity ranging from 3µL to 30µL (and a sampling duration set to 60s), peak width ranges from 0.8s to 6.2s and preconcentration factor from 221 to 670.
As conclusion we demonstrate the fabrication, tests and optimization of silicon micro-preconcentrators that allow to gain 3 orders of magnitude in VOCs (toluene) detection while keeping gas analysis system efficiency. The chip is compatible with the requirements for handheld devices.
This work is supported by the CBRNE grant from CEA and a joint R&D program funded by Apix technology.
Research topics: Lab-on-a-chip gas chromatography, MEMS sensors
B. Bourlon, F. Ricoul, A. Bellemin-Comte, N. David, N. Bonfieni, B. Icard .
ABSTRACT: Preconcentration is an important technological brick as part of the development of silicon based gas analysis systems. We report here on the fabrication of silicon micro-
preconcentrators that enable preconcentration of toluene by a factor of 1000 for sampling durations smaller than 1 minute. For a selected design, the toluene peak width at halt height remains similar with and without preconcentration. Preconcentration factors greater than 7000 have been obtained with 5 minutes sampling duration.
Silicon based micro-preconcentrators for portable gas analysis systems
Related Publications:
[1] S. C. Terry, J. H. Jerman, and J. B. Angell, “Gas-Chromatographic Air Analyzer Fabricated on a Silicon-Wafer”, Ieee Transactions on
Electron Devices, 26 (1979), 1880-86
[2] W.-C. Tian, H.K.L. Chan, C.-J. Lu, S.W. Pang, and E.T. Zellers, “Multiple-stage microfabricated preconcentrator focuser for micro gas chromatography system”, Journal of Microelectromechanical Systems, 14 (3) (2005), 498-507
[3] E.H.M. Camara, P. Breuil, D. Briand, N.F. de Rooij and C. Pijolat, “A micro gas preconcentrator with improved performance for pollution
monitoring and explosives detection”, Analytica Chimica Acta, 688 (2) (2011), 175-182
[4] M. Akbar, D. Wang, R. Goodman, A. Hoover, G. Rice, J.R. Heflin, and M. Agah, “Improved performance of micro-fabricated
preconcentrators using silica nanoparticles as a surface template”, Journal of Chromatography A, 1322 (2013), 1-7
[5]B. Bourlon et al. "Silicon based micro-preconcentrators for portable gas analysis sytems" 18th International Conference on Miniaturized
Systems for Chemistry and Life Sciences, MicroTAS 2014;San Antonio; USA

48
––– Volatile Organic Compounds (VOCs) are present in ambient air as they are emitted from natural sources or linked to human activities. They constitute a threat for human health and environment, for example by causing diseases or pollution. Their detection and their monitoring have hence
attracted a lot of attention over the years, and different types of sensors have been developed to detect them on site rather than in conventional analytical laboratory. Several technologies have been investigated such as, for example, acoustic oscillator devices, optical waveguides and devices based on electrical phenomena. These transducers generally need a chemical sensitive layer to selectively collect and concentrate target molecules and many investigations have been conducted to develop such layers, from organic polymers as polyisobutylene to carbone nanotubes or inorganic polymers as polydimethylsiloxane. In order to study new sensitive layers, an experimental setup was developed, using Quartz Crystal Microbalance (QCM) coated with the thin film of interest. Typical experimental data are shown on figure 1, for a 200 nm thin layer of poly (neopentylmethacrylate), p(npMA), deposited at the Silicon Technologies Division, and exposed to toluene concentrations from 350 ppm to 1880 ppm and separated by nitrogen purges [1].
Figure 1: Experimental results showing the frequency evolution for a
200nm p(npMA) coated QCM during an exposition to several concentrations of toluene.
The affinity of a thin film toward a gas phase can be quantified by using a factor K, called partition coefficient, defined as the ratio of the concentration of the gas in the sorbent film to the concentration in the gas phase.
Langmuir numerical and analytical models were then introduced to interpret the experimental K values and their
variation with toluene concentration: the figure 2 shows the comparison between numerical and experimental data.
Figure 2: Correlation between experimental K factors and Langmuir theoretical model.
Moreover, the kinetic response, using either this analytical model or a numerical approach taking into account the injection of gas in the test chamber, could also be analyzed with success as shown on figure 3. Thus this approach turns out to be an effective approach to get a precise characterization of the thin layers affinity and temporal response to target gases and allows us to consider using it to investigate and optimize other sensitive films for VOCs sensors.
Figure 3: Comparison between analytical, numerical and theoretical
data for the coated QCM subjected to toluene injections in the test
chamber.
Research topics: gas sensors, partition coefficient, sensitive thin layers
J. El Sabahy, J. Berthier, L. Bonnet, F. Ricoul, V. Jousseaume
ABSTRACT: This paper presents the original approach that has been developed to characterize the affinity of some thin layers towards toluene. Experimental data for an organic layer deposited
at the Silicon Technologies Division are presented. Langmuir model was used to interpret the partition coefficient evolution as function of the toluene concentration, using either analytical or numerical solutions. This determination of the Langmuir parameters provides thus a relevant way to classify thin film layers.
Study of thin layers affinity towards VOCs
Related Publications:
[1] El Sabahy, J., et al., Toluene-organic thin films partition coefficients analyzed with Langmuir adsorption theory and finite elements
simulations. Sensors and Actuators B-Chemical, 2014. 202: p. 941-948.

49
–––
The wound healing process is divided into several phases (inflammatory phase, proliferation phase and maturation phase).[1] In this study, we were interested in the final stage of wound healing, wound closure, when the skin cells (keratinocytes) proliferate from the edge of the wound towards its center to close up the wound. We have developed a new wound-healing assay using a keratinocyte cell line (HaCaT) and an innovative lensless imaging method, enabling to study the influence of the contact layer with a TLC bandage on the wound closure.[2]
Figure 1: Schematic view of the method and tools employed
Keratinocytes are seeded in a 35 mm Petri dish containing a cylindrical pad in the center. After 3 days of incubation, cell monolayer has created a cellular corona around the pad which is then gently withdrawn to create an artificial wound (1). Then the bandage is placed onto the cellular crown (2) Cell growth and migration for the wound closure of the cell-free area are then imaged directly into the incubator for at least 5 additional days using the small lensless device which allows the real time follow-up of biological processes in a large field (25 mm²)(3). Finally, the culture dish is removed from the incubator and then scanned with a lensless-based microscope which allows the imaging of the whole dish surface (4).
Figure 2: Behavior of cells speed with TLC interface (green) and
without interface (Bleu)
Several parameters are then obtained from the acquired lensless microscope pictures and scans such as the average speed of cells, the average distance from the initial corona and the average area newly covered by cells. We have observed that contact layer with TLC bandage put down on the Petri dish statistically promotes the keratinocytes migration (+30%) compared to the cell growth condition without bandage. A statistical analyses confirm that the results of this study are significant and reliable.
Figure 3: ANOVA statistical analysis
Research topics: Smart bandage, cell growth, 3D culture
F. Revol-cavalier, F. Navarro, C. Marsiquet, J.G. Coutard, M. Menneteau
ABSTRACT: This paper presents the method and results obtained in vitro during the project Micell-rail in collaboration with URGO Company. The objective of this study has been twofold, to develop a new model and tools to evaluate wound healing closure, to apply this model in order to evaluate the contact layer with a Lipido Colloid Technology (TLC) commercially used for
epithelialization.
Bandage interface to promote the wound closure
ANOVA followed by Fisher’s protected LSD tests. *** p<0,001 as compared to the basal condition
Related Publications: [1] Bernard FX, Barrault C, Juchaux F, Laurensou C, Apert L (2005). Stimulation of the proliferation of human dermal fibroblasts in vitro by
a lipidocolloid dressing. J Wound Care 14: 215-220]
[2] Velnar T., Bailey T., Smrkolj V., J Int Med Res. 2009 Sep-Oct; 37(5):1528-42. The wound healing process: an overview of the cellular
and molecular mechanisms.

50
––– With a near to liquid density but a near to gas viscosity as well as vapor pressure, supercritical carbon dioxide is an excellent solvent for chemicals and diffuses easily into porous materials. We have demonstrated for the first time the deposition of 3,4-epoxybutyltrimethoxysilane (EBTMOS) on silicon oxide using SFD [1,2]. High-pressure silanization was performed using a prototype of supercritical fluid deposition equipment (SFD-200) built by SEPAREX and 31 Degrees (Fig. 1). This equipment allows the simultaneous treatment of two 8-inch silicon wafers and offers the possibility to work with dynamic or static conditions. The ability of this specific EBTMOS layer to react with amine functions has been evaluated using the immobilization of amino-modified oligonucleotide probes. The presence of the probes is revealed by fluorescence using the hybridization with a fluorescent target oligonucleotide (Fig. 1).
Figure 1: Photograph of the SFD-200 equipment. Schematic
representation of silanization by SFD and grafting of oligonucleotide
The performances of SFD of EBTMOS has been optimized and then compared with the liquid phase (LD) and molecular vapor deposition (MVD) methods, evidencing a better grafting efficiency and homogeneity, a lower time reaction in addition to the eco-friendly properties of the supercritical carbon dioxide (Fig. 2). A step height of 2.3 nm was measured by SEEC optical technique on silica surfs. A smooth coating onto the substrate has been observed by AFM. The presence of grafted EBTMOS on the silicon
substrate was con firmed by MIR-IR.
Figure 2: Fluorescence results using LD, MVD and SFD (left). 3D
representation of the EBTMOS step deposited by SFD (right)
This EBTMOS based coating layer has been successfully used for the grafting of bio-inspired, iron based, inorganic catalysts on MCM-41 mesoporous silica (Fig. 3) [3].
Figure 3: Iron-based catalysts grafting and oxidation of thioanisole
A good catalytic activity of the supported catalyst in the oxidation of thioanisole with hydrogen peroxide was observed. These results are very interesting because the oxidation is essentially selective to the sulfoxide 1 and the catalyst has been recycled 3 times without losing activities. This preliminary results show an enhanced catalytic activity of the heterogeneous catalyst compared to the homogeneous one and need to be confirmed.
Research topics: surface chemistry, supercritical carbon dioxide, biosensing,
heterogeneous catalysis
J. Rull, G. Nonglaton, G. Costa, C. Fontelaye, G. Marchand, C. Marchi-Delapierre (iRTSV, LCBM, Grenoble), S. Ménage (iRTSV, LCBM, Grenoble)
ABSTRACT: Above 73.8 bar and 31.1 °C carbon dioxide becomes supercritical and acquires remarkable properties: density close to solvents, zero surface tension, low viscosity and high diffusivity. In this study we have developed a silanization process using Supercritical Fluid
Deposition (SFD). This process was successfully applied for the coating of silicon wafers with oligonucleotides for biosensing application and for the coating of mesoporous silica with inorganic catalysts for heterogeneous catalysis application.
Supercritical Fluid Deposition of epoxysilane on solid surface for
biosensing and heterogeneous catalysis applications
Related Publications:
[1] J. Rull, G. Nonglaton, G. Costa, C. Fontelaye, C. Marchi-Delapierre, S. Ménage, G. Marchand, “Functionalization of silicon oxide using
Supercritical Fluid Deposition of 3,4-epoxybutyltrimethoxysilane for the immobilization of amino-modified oligonucleotide”, 30th European
Conference on Surface Science (ECOSS-30), 2014, Antalya (Turkey). [2] J. Rull, G. Nonglaton, G. Costa, C. Fontelaye, C. Marchi-Delapierre, S. Ménage, G. Marchand, “Deposition of 3,4-
epoxybutyltrimethoxysilane on silicon oxide by supercritical carbon dioxide” submitted to Applied Surface Science.
[3] J. Rull, G. Nonglaton and C. Marchi-Delapierre, “Cleanup: new heterogeneous catalysts based on a new functionalization process of
porous material with supercritical CO2. 14th edition of Trends in Nanotechnology International Conference (TNT2013), Seville (Spain).

Neural interfaces
Implantable Micro electrodes
Selective recording & stimulation
Source separation from EEG
electrodes
5

52
–––
The electrodes are a critical element for establishing the electrical connection to measure the neural activity and to stimulate the neurons, the muscles for controlling the organs, the limbs or for overcoming the sensory deficits. For recording and stimulating, the cuff electrodes (gently wrapped the nerve) provide a suitable interface for the peripheral nervous system. Indeed, the implantable electrode should not damage the nerve, must avoid inflammatory reaction, glial scar encapsulation of implant, from recording sites leading to a loss of recordable neural signal and selectivity. Hence the need for a multielectrode array (MEA) technology that is capable of increasing the density for higher selectivity.
Figure 1 : left: Silicone cuff with embedded parylene electrodes and
electrical wire. Right: Cuff fully packaged with electrical connector
Single-metal-layer parylene C-based electrode arrays are fabricated. Parylene C material has been selected not only because of its biocompatibility, but also due to electrical, and mechanical criteria: low water permeability, high dielectric strength (~220MV/cm), high flexibility and mechanical strength (Young Modulus ~2.8GPa, Tensile
Strength ~68.9MPa and elongation Yield ~2.9). The platinum (Pt) has been chosen for its high inert and implantable properties as an electrode material. First, a photoresist sacrificial layer is spun on a standard silicon wafer, which acts as a carrier substrate (8”) during the micro fabrication process. An adhesion promoter was vaporized onto the sacrificial layer and a base parylene layer 8µm is then vapor-deposited. To form the electrodes onto the parylene, a metallic bi-layer of titanium, platinum, was obtained by evaporation with electron-beam evaporator and the metallic was patterned by a lift-off process. Before the metal deposition, the wafers were pretreated with a dehydration bake. A Parylene C layer is then deposited onto the patterns to form an insulating passivation layer, followed by a spin coating of a photoresist. This photoresist etch mask is exposed over the electrodes sites and contact pads, such as these metal sites are revealed after oxygen
plasma etching removal of the parylene coating. The photoresist mask is then stripped off, followed by deposition of a thick photoresist which is UV-exposed in order to pattern the overall array geometry. The entire wafer is then subjected to a reactive-ion etching in oxygen plasma, removing the parylene surrounding the array down to the sacrificial layer. Finally, the array is released from the substrate in an acetone bath to remove the sacrificial layer. The cuff electrode is made from a mesh coated with a thin silicone layer to improve the mechanical strength. The total thickness is 200 to 300µm. The mesh restrains the stretching without affecting the flexibility of the cuff. The Parylene matrix reported on the mesh coated and put into shape before reticulation allows the contacts to be flat without folds. The implantable silicone provides a water barrier and an electrical insulation.
Figure 2 : Left :tests structure of the electrodes, Right: test bench
The stability of electrode was investigated by monitoring n test structure: interdigitated electrode (IDE) soaked in model solution heated (Accelerated Lifetime Soaking Test ALST). A common model is to assume that the rate of aging is increased by a factor of 2ΔT/10, where ΔT is the temperature increase. Body temperature (37°C) has been chosen as a baseline, and accelerated aging factor at 67°C is 8, based on a doubling of the reaction rate for each 10°C increase. Leakage current is another important metric for the performance of encapsulation and was measured by applying 8V DC. The initial leakage current was about few pA for all the samples. For 8µm thick parylene coating, the leakage current increased dramatically up to nA range after 300 days of soaking at 37 °C, indicating failure of the insulation. For 20µm parylene film with ALST performed at 67°C, the failure occurred after roughly 4.5 years of equivalent soaking time at 37 °C. The introduction of a dehydration bake with 13µm parylene film improved also the estimated lifetime to 4.3 years. The parylene thickness increase and the introduction of the dehydration bake showed promising improvement for the lifetime of the thin film electrode technology.
Research topics: microelectrode, Sensing, Stimulation, implantable, neural
F. Bottausci, F. Baleras, C. Pudda, M. Cochet, C. Chabrol, F. Sauter-Starace, B. Icard, S. Maubert
ABSTRACT: This paper describes the fabrication and the packaging of a flexible parylene-based multi-contact electrode embedded in a silicone-based cuff. This type of electrode is well suited
for peripheral nerve recording and offers improved spatial selectivity. We conducted electrical tests for assessing the reliability by using accelerated lifetime protocol. The accelerated lifetime soaking tests in phosphate buffered saline (PBS) solution at 67°C showed a longer life time approximatively 4.5 years.
New sectorized implantable microelectrode fabrication, packaging and ageing for neural sensing and stimulation
Related Publications:
[1] F. Bottausci, F. Baleras, C. Pudda, M. Cochet, C. Chabrol, F. Sauter-Starace, J. Oziat, M. Rovetta, B. Icard, D. Guiraud, J.L. Divoux, C.H.
Malbert, C. Henry, S. Maubert, New sectorized implantable microelectrode fabrication, packaging and ageing for neural sensing and
stimulation IEEE NER 2015 [2] S. Bonnet, C. Rubeck, V. Agache, A. Bourgerette, O, Fuchs, S. Gharbi, F. Sauter-Starace, P. Maciejasz, J.L. Divoux, N. Bourquin, C.
Henry, S. Maubert, Selective ENG recordings using a multi-contact cuff electrode, IEEE NER 2013

53
–––
Selective recordings in electroneurography (ENG) can be accomplished with the use of multicontact cuff (MCC) electrodes. It is to be noted that MCC electrodes are also increasingly used for stimulation like in vagus nerve stimulation (VNS). The topographical arrangement of multicontact electrodes may be advantageously used to focus an electrical stimulation and target precise nerve areas. It is well-known that VNS has chronotropic (frequency) and inotropic effect (contractibility) on the heart by activating the parasympathetic nervous system. In heart-related applications, the sensitivity of VNS parameters is often studied based on physiological modifications like heart rate (bradycardia) or blood pressure. Therefore multicontact VNS yields the appealing idea that one could perform selective VNS by using adapted spatio-temporal patterns and thus minimize side effects. This study aims at completing these observations by investigating simultaneously electrocardiography (ECG) and ENG activity. ENG activity is quantified by the analysis of compound action potentials (CAPs) that are evoked by the different VNS configurations whereas ECG analysis is done by studying heart rate variability
Figure 1: left: Illustration of a VNS-based bradycardia. (Top) VNS
events. (Bottom) RR interval time series. RR-interval is increased
during VNS Right: VNS-stimulation configuration. Anode electrodes
are shown in red, cathodes in green
The platinum (Pt) was chosen for its high inert and implantable properties as an electrode material. The parylene C was selected as an insulating layer because of its favorable electrical and mechanical criteria: but also due to its biocompatibility. Concerning electrodes, leads and contact pads, the metallization layer of Pt (with a titanium layer, was first evaporated and then structured using the lift-off technology. The cuff total length is 18mm while the inner diameter is 2.8mm. The recording MCC electrode is composed of 3x6 electrodes arranged in a quasi-tripolar configuration around the nerve. Finally, each MCC electrode is glued to the inner side of a customized silicone cuff.
Figure 2 Illustration of a VNS-based bradycardia. (Top) VNS events.
(Bottom) RR interval time series. RR-interval is increased during VNS (lower heart frequency)
Figure 3: Illustration of evoked CAPs for the six different contacts
and for different VNS spatial configurations
We have assessed different stimulation configurations: bipolar ring stimulation, monocontact (1C), longitudinal or transverse stimulation, as shown in Fig. 1. It is shown that,
for a given temporal pattern, certain VNS spatial configurations have a significant effect on both heart and neural activities. We demonstrate that MCC electrodes are well indicated to recruit specific fibers in a topographical way and also to record regional fiber activity. These results entail the perspective of using ENG signals as control signals in VNS medical applications in order to optimize the therapy and use ENG as additional input in close-loop VNS heart diseases applications.
Research topics: microelectrode, sensing, stimulation, implantable, neural
S. Bonnet, A. Bourgerette, S. Gharbi, F. Baleras, F. Bottausci, N. Torres-Martinez, C. Cretallaz, F. Sauter-Starace, S. Maubert
ABSTRACT: This paper investigates the simultaneous use of two separate multicontact cuff (MCC) electrodes for selective recordings in electroneurography (ENG) and peripheral nerve selective stimulation The experiment is conducted on a pig with vagus nerve stimulation (VNS). It is shown that certain VNS spatial configurations (for a given temporal pattern) have a significant effect on the heart activity and on the neural activity. Therefore multicontact VNS yields the appealing idea that one could perform selective VNS and thus minimize side effects
Selective recording and stimulation in vagus nerve stimulation
applications with a microelectrode array
Related Publications:
[1] S. Bonnet, A. Bourgerette, S. Gharbi, F. Baleras, F. Bottausci, N. Torres-Martinez, C. Cretallaz, F. Sauter-Starace, C.-H. Malbert, L.
Laporte, C. Gallet, A.I. Hernandez, G. Carrault, O. Rossel, D. Guiraud, J.L. Divoux, C. Henry, S. Maubert, Cardiac and neural analysis for
VNS applications IEEE NER 2015
[2] S. Bonnet, C. Rubeck, V. Agache, A. Bourgerette, O, Fuchs, S. Gharbi, F. Sauter-Starace, P. Maciejasz, J.L. Divoux, N. Bourquin, C.
Henry, S. Maubert, Selective ENG recordings using a multi-contact cuff electrode, IEEE NER 2013

54
–––
During the realization of monotonous and repetitive tasks, mental fatigue, or reduced alertness, arises with growing time-on-task. Several physiological markers can be used to monitor fatigue level, like electro-encephalography (EEG) or electro-oculography (EOG). EEG is currently the upcoming method to perform mental state estimation in real-life settings. However, indices of ocular activity, such as spontaneous eye blink parameters, are also useful for characterizing mental fatigue or drowsiness states [1-2]. However, this technique requires electrodes placed on the subject's face, which are uncomfortable to wear. The solution that is proposed in this paper is the use of the sole scalp electrodes to record both cerebral and ocular activities. It is important to note that the latter is usually considered as noise in EEG recordings and is usually suppressed by denoising techniques. In order to detect and characterize the eye blinks using only the EEG signal, several processing steps are performed. First the signal is split into epochs, from which a source separation step is performed and a supervised classifier is used to identify ocular sources. Then, the data are back propagated in the sensor space in order to execute blink segmentation. Lastly blink characterization is performed and several parameters are derived like amplitude, opening/closure duration…
The method was applied on 90 minutes of signal recorded from 11 volunteers who underwent a working memory experiment authorized by the local ethics committee (Grenoble hospital, authorization number: 2012-A00826-37). They performed 736 trials in which they had to memorize a list of 2 or 6 sequential digits visually presented on a computer screen. The EEG signal was recorded from 11 frontal and fronto-central electrodes. It was presupposed that the level of mental fatigue increased during the experiment. This aspect was confirmed for each participant by means of behavioral and subjective measures. The results were compared with blink characterization parameters obtained using a vertical EOG (vEOG) reference signal. Regarding data allocation between training and testing sets, only the first 20 minutes of the first subject were used as the training set. The remaining 70 min. of this subject, as well as the 90 min. of the 4 other subjects were used as the testing set. Signals were split into 20-second non overlapping epochs. The correlation between the blink parameters extracted from both EEG and EOG modalities was 0.81 in average.
An illustration of the temporal evolution of the blink parameters computed on one subject is given by Fig.1. This allows monitoring the participant's mental fatigue.
Figure 1: Temporal evolution of the blink parameters extracted on
subject 5 using EEG and EOG. Upper left part: blink frequency;
upper right part: amplitude; lower left part: duration; lower right
part: proposed mental fatigue indicator
The new technology that is now emerging to record EEG in an easy and practical way, such as EEG headsets or caps with dry electrodes, enables to envision an EEG system that would monitor operators’ mental state for long periods [3]. The developed method could be directly applied on car drivers, operators that monitor complex systems during long periods of time, such as air traffic controllers or nuclear plants operators, who have to concentrate during long
periods on information displayed on a screen. The proposed method makes it possible to assess mental fatigue or drowsiness with an indicator that combines information from both cerebral and ocular activities without using EOG electrodes, which would be difficult to bear for a long period of time and which may impair the vision operators’ performances.
20 40 60 80
5
10
15
20
25
Time (min)
Blink frequency (bpm)
20 40 60 8050
100
150
200
250
300
Time (min)
Amplitude
20 40 60 80
100
110
120
130
140
Time (min)
D50 (ms)
20 40 60 80
0.5
1
1.5
2
2.5
3
3.5
Time (min)
Normalized FrequencyxD50xAmplitude
EOG parameters
EEG parameters
Research topics: EEG, Source Separation, Mental Fatigue
R. N. Roy, S. Charbonnier, S. Bonnet
ABSTRACT This paper describes a subject-independent method to evaluate eye blink parameters using only frontal EEG electrodes. EEG signals are decomposed into sources by means of a source separation algorithm and sources are classified into ocular or non-ocular sources using temporal, spatial and frequency features. The selected ocular source is back propagated in the signal space
and used to localize and characterize blinks. The blink parameters extracted from both EOG and EEG signals were compared. Very high performance was achieved, with a true detection rate of 89% and a false alarm rate of 3%.
Eye blink characterization from frontal EEG electrodes using source
separation and pattern recognition algorithms
Related Publications:
[1] A. Picot et al., "On-Line Detection of Drowsiness Using Brain and Visual Information", IEEE Trans. Syst., Man, Cybern., A, Syst.,
Humans, 42 (3), pp. 764-775, 2012.
[2] R. Schleicher et al., "Blinks and saccades as indicators of fatigue in sleepiness warnings: looking tired?", Ergonomics, 51 (7), pp. 982‑
1010, 2008.
[3] G. Borghini et al., "Assessment of mental fatigue during car driving by using high resolution EEG activity and neurophysiologic indices",
in Proc. of the IEEE Eng. Med. Biol. Conf., pp. 6442‑6445, San Diego, California, 2012.

Nano-technologies
Lipid nanoparticles
Nanotherapeutics
MEMS Mass sensors
Signal analysis of MEMS sensors
Statistical signal processing
6

56
–––
RNA interference (RNAi) is an useful mechanism enabling the specific down-regulation of a targeted mRNA. Since its discovery in 1998 by Fire [1], the use of this mechanism of a given gene in research has become a major approach to understand a gene function, but also to identify new biomarkers of diseased cells and discover new therapeutic targets. Because of their high molecular weight and anionic nature, siRNA does not easily cross the plasma membrane. Therefore, the use of a carrier appears to be crucial for an efficient delivery into cells. Here, we present an original
study dealing with the formulation of a novel lipid-based carrier through a design of experiment (DOE) approach in order to obtain a highly efficient down-regulation efficiency without toxicity issues. These solid lipid nanoparticles present cationic charges on their shell allowing fast post-formulation complexation. The mathematical approach provided a maximized quality of obtained information from collected data while defining the impact of each parameter (Fig. 1) [2].
Figure 1: Description of the
DOE. Down-regulation
efficiency representation
depending on DOTAP (X1),
PEG (X3) and Lecithin (X4).
The color scale represents down-regulation efficiency
area from the lowest (red) to
the highest (blue). Red and
blue dots display 2 selected
formulations.
In addition to the ability of such siRNA-loaded nanocarrier to efficiently down-regulate the expression of targeted proteins, their lipid core can also contain encapsulated lipophilic dyes, which renders therefore possible the fluorescence monitoring of the transfection (Fig. 2) [2].
Figure 2: Pictures using epifluorescence microscopy of GFP
overexpressed PC3 (green) incubated in the presence of DiD doped
cLNPa (red)/siGFP complexes overtime. The same field is studied for
each picture (top). Western blot of GFP protein after 72 hours
siControl and specific siGFP transfection, compared to α-tubuline
(left) and quantification of the level of GFP expression after
transfection of control siRNA and GFP siRNA with respectively
Lipofectamine RNAimax, cLNPa and cLNPb. WT: wild-type PC3 not overexpressing GFP.
Furthermore, several cells are well-known to be difficult to transfect, such as neurons. Transfection efficiency was observed in NGF-treated PC12 neuron-like cells with fluorescent siRNA (Fig3). On neuron-like cells, cLNPa displayed higher transfection efficiency compared to the commercial agent, lipofectamine [2].
Figure 3: Transfection on difficult-to-transfect cells. Time course of
siRNA-Alexa488 uptake after 6 hours transfection into neurons
derived from PC12. Grey spectra represent fluorescence of cells from
siRNA-alexa488 without transfection while light green and dark
green spectra represent respectively fluorescence of cells after
transfection with Lipofectamine RNAimax and cLNPa.
CONCLUSION New formulation of cationic lipid nanoparticles demonstrated high active RNAi transfection and down-regulation efficiencies in cell models, paving thus the way to applications in advanced controlled delivery of nucleic acids, especially for high-throughput screening or in vivo delivery.
AKNOWLEDGMENTS This work is part of the FACSBIOMARKER ANR project
(Investissement d'Avenir) and the thesis of Jonathan Bruniaux, PhD
defended on December 1st, 2014.
ABSTRACT: The intracellular delivery of small interfering RNA (siRNA) in a proper manner remains a bottleneck in many cases for the clinical translation. Here, we have designed through
an original design of experiment approach a novel formulation of nanostructured lipid carriers enabling a high and finely controlled transfection efficiency. Taken altogether, our results demonstrate the potential of these safe lipid particles for the RNAi intracellular delivery, including the transfection of cells recognized as hard to transfect.
Research topics: Nanomedicine, nanoparticles, RNAi, transfection, Design of Experiments
J. Bruniaux, J. Morlieras, A. Hibbitts, M. Menneteau and FP. Navarro F. Mittler (CEA-DSV), E. Sulpice (CEA-DSV), X. Gidrol (CEA-DSV)
Cationic lipid nanoparticles enabling efficient siRNA transfection
and down-regulation
Related Publications:
[1] Fire A, Xu S, Montgomery MK, Kostas SA, Driver SE, Mello CC. Potent and specific genetic interference by double-stranded RNA in
Caenorhabditis elegans. Nature. 1998; 391, 806–811
[2] Bruniaux, J., Sulpice, E., Mittler, F., Texier, I., Gidrol, X., Navarro, F.P. Cationic lipid nanoemulsions for RNAi screening (2013) Technical
Proceedings NSTI-Nanotech 2013, 3, pp. 323-326.
[3] Tiemersma et al, Emerg Infect Dis 2004, 10: 1627-1634

57
–––
The frequency of antimicrobial resistance (AMR) in bacteria has increased in line with increasing usage of antimicrobial compounds. The extensive use of antimicrobials in human medicine over the past 70 years has now led to a major threat to clinical practice due to a relentless rise in the number and types of microorganisms resistant to these medicines. Especially, as many as 650,000 people currently develop multi-drug resistant tuberculosis (MDR-TB) annually [1]. Similarly, cases of hospital-related Methicillin-resistant Staphylococcus aureus (MRSA) infections can now run as high as 40% in parts of Europe [2]. Considering this, there is now a substantial impetus to develop new anti-microbial treatments that can overcome resistance mechanisms. In the context of the NAREB European research network, we will develop and validate innovative therapies based on antimicrobial compounds and nanocarriers. The considered antimicrobial compounds will be either the traditional antibiotics, such as aminoglycosides, or new compounds recently identified from drug screening on resistant strains (GSK and Institut Pasteur partners). Moreover, innovative bio-macromolecules will be tested corresponding to transcription factor decoys (TFDs), a nucleic acid inhibiting the bacterial proliferation (Procarta Biosystems partner). Several nanoparticles will be designed by using biocompatible polymers and/ or lipids, for addressing the delivery challenges of these pre-existing or novel antimicrobial compounds into the diseased tissues, mainly the lungs and the blood/ the skin respectively for MDR-TB and MRSA, as well as the cell hosts in case of MDR-TB. Especially, neutral or cationic Lipidots® have been prepared for encapsulating the antibiotics, such as bedaquiline (see figure 1) and/ or complexing TFDs (see figure 2). Figure 1: Size (Z-average in nm) and polydispersity index (PDI) of
lipid nanoparticles, Lipidots® encapsulation the bedaquiline at
different drug loading (% w/w)
First encouraging results with these bedaquiline-loaded lipid nanoparticles have been obtained, demonstrating a high payload and colloidal stability in several buffers mimicking the biological media. Their freeze drying process is still under investigation in the lab, as well as their further evaluation in biological models. Figure 2: Size analysis of cationic lipid nanoparticles complexed with
TFDs over 3 days in A) PBS and B) RPMI media + 25 mM Hepes
buffer (n=3 SD)
Cationic lipid nanoparticles complexed with TFDs have been prepared and assessed in terms of stability and cytotoxicity in THP1 cell line. From results obtained, it was found that nanocomplexes remained stable for at least 24h in all cases and were well tolerated by cells up to N/P ratio 100/1.
CONCLUSION From these studies, antibiotic-loaded or TFDs-complexed lipid nanoparticles displayed high levels of stability across a range of environments, allowing now for future and in-depth cellular and microbiological screening.
AKNOWLEDGMENTS This work is part of the NAREB European research network
(collaborative project) supported by the European Union's Seventh
Framework Programme for research, technological development and
demonstration under grant agreement n°604237. Antibiotics
selected from microbiology experts in the consortium and TFDs
kindly supplied by Procarta Biosystems.
Research topics: Nanomedicine, Innovative therapy, infectious diseases, nanoparticles,
Drug delivery
D. Jary, A. Hibbitts, M. Zajac, M. Menneteau and FP. Navarro
ABSTRACT: Innovative therapies are highly anticipated for infectious diseases in a context of resistant strains of pathogens to current antibiotics. Combining nanoparticles, as delivery vehicles for reaching the diseased tissues and for crossing the bacterial wall, and new antimicrobial compounds may considerably improve the efficacy of these "nanotherapeutics"
against resistance mechanisms. Preliminary results demonstrated that antibiotics and novel nucleic acid-based compound were loaded into lipid nanoparticles with high efficiency without altering their colloidal stability. Further investigations are ongoing on cell and bacteria models.
Nanotherapeutics for Antibiotic Resistant Emerging Bacterial
pathogens (NAREB)
Figure 1. Size analysis of cLNP-TFD
nanocomplexes over 72hrs in A) PBS and B) RPMI
media + 25mM HEPES buffer (n=3 ±SD)
0
20
40
60
80
100
120
T=0hr T=24hr T=72hr
Size
(n
m)
cLNP-TFD N/P=4 cLNP-TFD N/P=6
cLNP-TFD N/P=8 cLNP-TFD N/P=12
0
200
400
600
800
1000
T=0hr T=24hr T=72hr
Size
(n
m)
cLNP-TFD N/P=4
cLNP-TFD N/P=6
cLNP-TFD N/P=8
cLNP-TFD N/P=12
A.
B.
Related Publications:
[1] Global tuberculosis control: surveillance, planning, financing: WHO report 2012
[2] Tiemersma et al, Emerg Infect Dis 2004, 10: 1627-1634

58
–––
This project relates to particles metrology and cells biomechanical characterization based on MEMS oscillator with embedded microchannel. As compared to previous works relying on flexural mode hollow cantilevers which require vacuum encapsulation and employ an external optical readout, the devices developed at LETI rather rely on a capacitively transduced hollow contour-mode plate oscillator, operating in air [1]-[3]. New sensor designs were implemented, resulting in a frequency stability improved by one order of magnitude as compared to previous designs.
Figure 1: SEM pictures of the sensor devices. A) Typical square plate sensor with its four transduction electrodes. B) Close-up view of the
sensor anchor with its embedded channel. C) Typical disk plate
sensor D) Perspective view of a ring plate device, showing bypass
channels internal cross section.
The sensor thickness was increased from 3 to 15µm, providing 3µm-wide microchannel cross-section to enable metrology of larger particles as compared to previous study. The buried microchannel was implemented in a bypass configuration between upstream and downstream channels to enable faster filling fluidic procedure and increase the analysis throughput. The chip interfacing is performed by a customized plug and play platform, which is hosting pogo pins for electrical contact and o-rings for hermetic fluidic connection, avoiding the constraints of wire bonding and capillaries gluing. Figure shows typical transmission curves obtained for 150µm-wide square plate (sensors A and B); the devices feature Q-factor around 20,000 in air, which is as good as similar state-of-the-art technologies.
Figure 2: {left} Transmission curves for a typical 150µm wide square device, showing low variability between similar designs, and 20000
range Q factor. {right} Table showing performances of our sensors
as compared to similar state-of-the-art hollow MEMS oscillators.
Allan deviation has been characterized leading to a minimum frequency stability of 18ppb for a 1s averaging rate; this corresponds to a mass resolution of 14fg,
Figure 3: Real-time monitoring of frequency fluctuations by applying
𝑉𝐷𝐶 increments to mimic particles transiting across the sensor.
1=580nm-diameter gold nanoparticle / 2=900nm-diameter TiO2
nanoparticle / 3=350nm-diameter mercury droplet / 4=290nm-diameter gold nanoparticle
Figure 3 demonstrates phase-locked loop (PLL) operation for a typical sensor. We can mimic particles transiting through the channel by applying successive DC pulses which modify the sensor overall stiffness. Four peaks are shown, corresponding to 𝛿𝑉 increments of +10V, +5V, +2V and
+1V; these peaks correspond to mass variations from 460fg to 3.7pg. Our devices provide a larger dynamic range than previous studies, enabled by the micrometric dimensions of the embedded channel together with the fg-range sensor mass resolution.
sensor
A) B)
C) D)
Air gap
27,50 27,55 27,60-120
-100
-80
-60
-40
Tra
nsm
issio
n g
ain
(dB
)
f (MHz)
Sensor A - Q = 19,600
Sensor B - Q = 21,500
27,556 27,560-50
-40
GHz
RESONANT STRUCTURE(MHz) (GHz)
Heidari et al. Transducers 2011 34.8 60
Olcum et al. PNAS 2014 1.87 30
Agache et al. LoC 2011 75 300
This work 27.6 600
W = 150 µmMEMS figures of merit
➲
𝜹𝒇𝟏 = 𝟔𝟓 𝑯𝒛
𝜹𝒇𝟐 = 𝟒𝟎 𝑯𝒛
𝜹𝒇𝟑 = 𝟏𝟎 𝑯𝒛
𝜹𝒇𝟒 = 𝟖 𝑯𝒛
1 2 3 4
Research topics: MEMS, nanoparticles metrology
C. Hadji, M. Cochet, F. Baléras, V. Agache, B. Icard
ABSTRACT: This work reports hollow MEMS plate oscillators for mass sensing in liquid, with a one-fold improvement in both Q-factor and Allan deviation compared to previous alike structures, and fluidic constriction larger than 1µm. These new characteristics make the devices amenable for the first time to individual particles metrology from 100nm up to the micrometre diameter range
Hollow MEMS mass sensors for real-time Weighing and sizing of nanoparticles and cells
Related Publications:
[1] V. Agache, Invited Speaker, “An embedded microchannel in a MEMS plate resonator for ultrasensitive mass sensing in liquid”, Proc. Of
the 11th Annual International Workshop on Nanomechanical Sensing (NMC 2014), Madrid, April 30th to May 2nd, 2014
[2] C. Hadji, C. Berthet, F. Baléras, M. Cochet, B. Icard, and V. Agache, Hollow MEMS mass sensors for real-time particles weighting and sizing from a few 10nm to the µm scale, Proceedings of IEEE MEMS 2015, Oral, Estoril, Portugal, January 2015.
[3] C. Hadji, C. Berthet, M. Cochet, F. Baléras, B. Icard and V. Agache, An embedded microchannel in a MEMS plate resonator for
ultrasensitive mass sensing in liquid, Proceedings of MicroTAS 2014, pp. 2324-2326, Poster session, - October 26-30, 2014 - San Antonio,
USA.

59
–––
Gas chromatography is a technique to separate chemical components in gas state. A chromatogram is a succession of peaks each corresponding to the output from the column of molecules of the same component. We consider new devices where nano-chromatography columns carved on silicium chip are coupled with sensors called NEMS, Nano Electro-Mechanical Systems. Those gravimetric sensors are vibrating cantilevers, covered with a chemical layer for molecular adsorption. The resonance frequency is controlled by a Phase Locked Loop control. The output signal is the instantaneous frequency of the vibrating beam. This resonance frequency decreases when molecules are adsorbed on the cantilever. The frequency shift is proportional to the mass adsorbed. In this paper [1,2], we consider an inverse problem approach to retrieve the original gas mixture composition from the output signal based on Bayesian source separation and model inversion.
The gas chromatography (GC) column and the NEMS sensors are here described in a molecular point of view through a stochastic model based on the random walk molecular model proposed by Giddings and Eyring [3]. Our proposed general model describes the shape of the signal output as the probability distribution on the retention time of the molecules within the column. Each acquisition is settled with some prior parameters defined by the known column and chemical properties such as the prior distributions for a molecule to stay within the mobile phase or to remain fixed on the stationary phase, or the prior distribution to be absorbed on the cantilever and then to be released in the mobile phase. Those parameters control the retention time distribution for each random walk of each molecule within the column. The inference on the unknown profile parameters is processed according to a Bayesian scheme based on the joint probability density function of the output retention times.
Such inference requires first locating the relative position of every peak in order to identify them. The position and width priors of each peak define the parameters of our model. Those estimations are achieved by maximum likelihood estimation. Once those parameters are known or estimated, we determine the shape function for each peak. Then, the mixture coefficients can be estimated. Indeed, each shape
function corresponds to one gas and constitutes a base vector of elementary components. The scalars of this vector space which need to be determined are the proportion of each constituent inside the mixture. This defines a hierarchical model with 2 levels: component and GC signal. Then, we propose to use a Hierarchical Bayesian source separation method to determine the basis vector and the scalars of a given chemical sample in this basis. The following figure demonstrates the performance of the algorithm to separate the components on a synthetic chromatographic signal generated as a weighted mixture of three different distributions.
Figure: fit of estimated signal to simulated signal on a mixture of 3
gases associated with overlapping peaks.
Research topics: Statistical signal processing, Inverse problem, Gas Chromatography
F. Bertholon, O. Harant, Ch. Jutten (GIPSA-Lab, Univ. Grenoble Alpes), B. Bourlon, L. Gerfault, P.Grangeat
ABSTRACT: This paper introduces a joined Bayesian estimation of gas samples issued from a gas chromatography column (GC) coupled with a NEMS sensor based on Giddings Eyring microscopic molecular stochastic model. The posterior distribution is sampled using a Monte Carlo Markov Chain and Gibbs sampling. Parameters are estimated using the posterior mean.
Signal analysis of NEMS sensors at the output of a chromatography column
Related publications:
[1] F. Bertholon, O. Harant, Ch. Jutten, B. Bourlon, L. Gerfault, P. Grangeat (2014)," Signal analysis of NEMS sensors at the output of a
chromatography column ", 34th International Workshop on Bayesian Inference and Maximum Entropy Methods in Science Engineering,
Amboise, France, 21 - 26 September 2014. [2] F. Bertholon, O. Harant, Ch. Jutten, B. Bourlon, L. Gerfault, P. Grangeat (2015)," Signal analysis of NEMS sensors at the output of a
chromatography column ", in Bayesian Inference and Maximum Entropy Methods in Science Engineering, AIP Conf. Proc., vol. 1641, pp.
329–336.
[3] J. C. Giddings, and H. Eyring (1955) “A Molecular Dynamic Theory of Chromatography”, The J. of Phys. Chem., vol. 59, pp. 416–421.

60
–––
Quantification and classification are key processes for proteomic studies and development of diagnostic tests using MRM measurements. On the BHI-PRO project (ANR 2010 BLAN 0313) we have studied a Bayesian hierarchical inversion algorithm (BHI) for quantification and classification. A full graphical hierarchical model of MRM acquisition chain has been proposed combining biological and technological parameters. The Bayesian estimation delivers automatically protein concentrations and extra parameters, using MRM data on AQUA labelled peptides and control quality samples for yield estimation. We have first formulated the classification as the solution of a global inversion of all variables in one step [1]. Second, for constraints on the computational time, we have then considered a suboptimal solution combining Bayesian Hierarchical Inversion for quantification and quadratic discriminant analysis for serum sample classification. In these communications [2], we have presented a statistical analysis of experimental data. We focus on robustness, linearity, discrimination and classification performance criteria. Statistical analysis is conducted on protein concentration, sample classification, but also technological parameters estimation such as molecular yield or elution time. Quantification performances on the dilution samples are computed based on linear regression, determination factors, concordance coefficient and variance analysis. Technological variability is characterized by
coefficient of variation for each parameter. On the clinical cohort, the discrimination power for each biomarker is characterized by Wald coefficient. Classification performances are measured computing sensitivity, specificity and ROC curves.
Fig. 1: digestion yield variability for 3 LFABP peptides for quality
control samples measurements during the clinical cohort campaign
Experimental data are experimental plan of set of samples with known protein dilution factors and a colorectal cancer cohort. We have considered as biomarker model the proteins LFABP, BIP and Villin having 3 MRM acquired peptides in the studied fraction. MRM acquisitions have been achieved using an ABSciex QT5500 mass spectrometer. For the 3 proteins, 3 transitions are measured for each peptide. AQUA labelled peptides are used for internal calibration. External calibration of pre-analytical process is performed for each daily batch using control quality sample. The clinical cohort includes 105 controls and 101 colorectal cancer cases from grade 1 to 4. Measurement has been achieved along 27 daily sample batches. Coefficient of variation of digestion yield have been measured for each peptide of the proteins. It varies from 2% for Villin to 13% for LFABP, with a daily maximum of 33% for LFABP. On figure 1, we have presented the variation on the digestion yield for the 3 selected peptides of LFABP protein. Evaluation of classification performances has been achieved by cross-validation, using ten 10-fold processes. Classification is applied using either each protein independently, or a combination of them. For BHI algorithm Wald coefficients have been estimated at 21.2 for LFABP, 13.4 for Villin and 0.2 for BIP. Then, on this data set, LFABP and Villin can be considered as discriminant, but not BIP. Combining these 3 biomarkers and choosing a 95 % specificity as minimal requirement for colorectal cancer
screening tests, sensitivity was 40 % on the ROC curve for the clinical cohort (cf figure 2). The Area Under the Curve (AUC) is 0.81 for these automated Bayesian BHI processing compared to 0.79 for a semi-supervised Non-linear Processing algorithm NLP used as reference.
Fig. 2: ROC curves (red : BHI – blue : NLP) associated with a
Quadratic Discriminant Analysis
Research topics: Statistical signal processing, Inverse problem, Classification,
Biostatistics, In vitro diagnosis, Proteomics, Mass spectrometry, Serum biomarkers
L. Gerfault, A. Klich (HCL, Service de Biostatistique; Univ. Lyon I), C. Mercier (HCL), P. Roy (HCL), J.-F. Giovannelli (IMS, Univ. Bordeaux), A. Giremus (IMS), P. Mahé (bioMérieux), J.-P.
Charrier (bioMérieux), B. Lacroix (bioMérieux), Pierre Grangeat
ABSTRACT: Statistical analysis is a key point to characterize MRM protein quantification and serum sample classification with respect to biological and technological variability. We focus on robustness, linearity, discrimination and classification performance criteria. Statistical
performances are protein dependent. Controlling technological variability is mandatory to get reliable mass spectrometry based diagnostic tests.
Statistical analysis of Bayesian hierarchical inversion for MRM protein quantification and QDA serum sample classification
Related Publications:
[1] P. Szacherski, J.-F. Giovannelli, L. Gerfault, P. Mahé, J.-Ph. Charrier, A. Giremus, B. Lacroix, P. Grangeat (2014), "Classification of
proteomic MS data as Bayesian solution of an inverse problem", Access, IEEE, Vol. 2, 1248 – 1262, DOI: 10.1109/ACCESS.2014.2359979.
[2] L. Gerfault, A. Klich, C. mercier, P. Roy, J.-F. Giovannelli, A. Giremus, P. Mahé, J.-Ph. Charrier, B. Lacroix, P. Grangeat (2014), "Statistical analysis of Bayesian hierarchical inversion for MRM protein quantification and QDA serum sample classification", 62nd ASMS
Conference on Mass Spectrometry and Allied Topics, Baltimore, Maryland, USA, 15 - 19 June 2014.
[3] L. Gerfault, J.-F. Giovannelli, J.-Ph. Charrier, P. Grangeat (2014), "Automatisation de la quantification par spectrométrie de masse non
supervisée", congrès français de Spectrométrie de Masse et d'Analyse Protéomique (SMAP), Lyon, France, 30 juin – 2 juillet 2014.

PhD Degree Awarded
Abeille Fabien
Bruniaux Jonathan
Fantoni Frédéric
Habib Amr
Lefebvre David
Potop Alexandra
Vinjimore Kesavan Srikanth
7

62
A benchtop micro-bioreactor for continuous mammalian cell culture on microcarriers Over the past six decades, cell culture has become a common practice. It is a major tool in biological research for the understanding of life science, such as the study of disease and the discovery of new drugs. It plays an important role in many industries since it is involved in the production of many food, cosmetic, and pharmaceutical products. However, Research and the industry are now facing some limits and are expressing needs to be addressed. They are both associated with high costs due to a large consumption of resources (cells, reagents, qualified operators). More specifically, cell culture in research is characterized by low throughput of experiments, important variability and risk of contamination due to the recurrent manual operations performed by operators. Additionally, experiments are performed in static conditions and on models (2D cultures, animals…) which poorly resemble the human physiology. Industrial cell culture needs miniaturized systems that mimic the large scale bioreactors and offer higher screening possibilities. Microfluidic cell culture systems represent a promising tool to address the aforementioned issues and needs. The change of physical behaviors at the small-scale in microfluidic devices allow controlling temporally and spatially the cell microenvironment, unattainable with conventional cell culture methods. The level of automation and integration allows the substantial increase of the number of experience per system and considerable reduction of resource consumption. Thus, many small cellular 3D architectures grown under dynamic conditions and in high-throughput have been performed and have demonstrated their ability to quickly re-create more physiological environments. Regarding the industrial culture, miniaturized cultures have already shown their ability to reproduce the characteristics of the culture observed in macrobioreactors with higher screening capabilities. In this framework, a benchtop microfluidic bioreactor, complying with the standard microfluidic platform and format used in the host laboratory, has been successfully fabricated to perform continuous cell cultures. Integrated solutions were developed to provide continuously the adequate conditions for cell proliferation (perfusion, thermal regulation…). Integrated cell harvest was also performed with the final goal to achieve long-term cell culture in the bioreactor. The fabricated system proved to guarantee sterile conditions for cell cultures on a regular lab bench. Moreover, these cultures were achieved autonomously without requiring a cumbersome incubator. In these conditions, the bioreactor demonstrated the possibility to perform continuous cell cultures of various cell types during several days: insects cells were cultured 142 during 5 days and mammalian cells during 3 days. Regarding the mammalian cell cultures performed, a breakthrough has been achieved compared to the cultures performed in microfluidic systems since microcarriers (diam.: 175 μm were used as growth support. Although microcarrier cell culture is routinely performed in the industry, no autonomous microfluidic culture system has addressed this type of culture yet. Such a miniaturization is a major step forward for bioprocess applications where the need to develop scale-down bioreactors that mimic large scale operation has been clearly identified to shorten and reduce the costs associated to bioproduct development.
Prénom Nom University :
Abeille Fabien University Joseph Fourier/ Grenoble
PhD degrees awarded in 2014

63
Lipid nanocarriers development dedicated to siRNA delivery for in vitro purposes RNA interference is a post-transcriptional inhibition mechanism, inducing the specific regulation of gene expression. This endogenous mechanism can be triggered by the transfection of exogenous interfering RNA fragments, including siRNA. This technique allows specific targeting of all the genes making up the genome, whose temporary extinction allows for the study of their function. This technique can also now be used to discover new therapeutic targets and new biomarkers. This strong research potential in vitro is also found in vivo, whereby RNA interference can be used directly as a therapeutic agent for pathological conditions such as cancer, infections or systemic diseases. However, the cytoplasmic accessibility of exogenous siRNA is required to trigger the mechanism of regulation. Currently, despite numerous transfection methods developed in the literature, this step in siRNA delivery remains an important limitation, as well as the toxicity of a range of transfection methods. Considering this, this thesis aimed at developing a new cationic lipid-based carrier, cLNP, dedicated to cell transfection without toxicity issues. Using a design of experiment, this formulation of cLNP was adapted from a neutral formulation encapsulating lipophilic molecules previously used for applications in fluorescence imaging and/or drug delivery. The physicochemical characterization of the cLNP particles showed strong colloidal stability, both in aqueous buffers and in cell culture media supplemented with serum. In addition, these nanovectors have proven extremely efficient in establishing and maintaining of electrostatic bonds with siRNA, thereby yielding complexes with high stability over time. Functional inhibition efficiencies of these nanoparticles have been successfully tested on three different cell lines (PC3, HeLa and U2OS). The overall results confirmed the high potential of this new nano-vector, in terms of functional inhibition and absence of cytotoxicity, and ranks among the better commercial transfection reagents tested. These features are complemented by multimodality abilities, including the encapsulation of drugs or lipophilic fluorophores. Finally, preliminary tests on difficult-to-transfect cells (primary cells, non-adherent cells, neurons) or three-dimensional cellular structures opened new promising perspectives.
Bruniaux Jonathan University Joseph Fourier
PhD degrees awarded in 2014

64
Innovative illumination method and detection method for contrast and resolution improvement in molecular fluorescence imaging in reflectance geometry Intraoperative fluorescence imaging in reflectance geometry is an attractive imaging modality to noninvasively monitor fluorescence-targeted tumors. However, in some situations, this kind of imaging suffers from a lack of depth penetration and a poor resolution due to the diffusive nature of photons in tissue. The objective of the thesis was to tackle these limitations. Rather than using a wide-field illumination like usual systems, the technique developed relies on the scanning of the medium with a laser line illumination and the acquisition of images at each position of excitation. Several detection schemes are proposed to take advantage of the stack of images acquired to enhance the resolution and the contrast of the final image. These detection techniques were tested both in simulation with the NIRFAST software and a Monte-Carlo algorithm and experimentally. The experimental validation was performed on tissue-like phantoms and in vivo with a preliminary testing. The results are compared to those obtained with a classical wide-field illumination. As they enhance both the contrast and the resolution, these methods allow us to image deeper targets by reducing the negative effects of parasite signals and diffusion.
PhD degrees awarded in 2014
Fantoni Frédéric University: Uuniversité Joseph Fourier, Grenoble

65
Large surface, multi-energy, radiological detectors The objective of the thesis is to propose a solution for a 2D integrated circuit X-ray imager working, either in spectrometric mode where each X photon energy is measured, or in charge integration mode where the total energy deposited by X-ray during an image is measured, the solution being compatible with large area detectors typically of 20 cm x 20 cm. A proof of concept prototype ASIC ’Sphinx’ was designed and fabricated in CMOS 0.13 μm technology ; the ASIC being formed of a matrix of 20 x 20 pixels with a 200 μm pixel pitch. The designed architecture allows the quantification of the incoming charge through the use of counter-charge packets as low as 100 electrons. The injected packets are counted for each X photon (in the spectrometric photon counting mode), or for all charges integrated during the image period (in charge integration mode). First characterization measurements prove the validity of the concept with good performance in terms of power consumption, noise, homogeneity and linearity. A first part of the ASIC is dedicated to X-ray direct detection where a semiconductor, e.g. CdZnTe, hybridized to the ASIC’s pixels converts X-photons to electrical charge. Another part of the ASIC is dedicated indirect X-ray detection where a scintillator, e.g. CsI :Tl, is used to convert X-photons to visible photons which are then detected by in-pixel photodiodes. For the latter mode, new forms of photodiodes characterized by fast detection and low capacity were designed, simulated, and fabricated in CMOS 0.13 μm technology on a different ASIC. Finally, the thesis concludes with proposing performance enhancing ideas to be potentially implemented in a future prototype.
Prénom Nom University :
PhD degrees awarded in 2014
Habib Amr University: Grenoble

66
Study of new porous materials for silicon micro-fabricated column development in gas chromatography Miniaturization in Gas Chromatography opens the way to low cost, low gas and low power consumption portable devices, which offer in-situ analysis and avoid tedious transport of samples to laboratories. Since the first micro-fabricated column in the late 1970’s, the main focus was directed to the separation of heavy molecular weight hydrocarbons, with 5 or more carbon atoms. In this work, we have developed sol-gel mesotructured silica stationary phases for the separation of light alkanes (from one to 5 carbon atoms) in micro-fabricated columns, following two different procedures: i) the deposition of a sol-gel thin film by dynamic coating directly into the GC capillary or on micro-fabricated columns or ii) the layer-by-layer (LbL) deposition of silica nanoparticles (SNPs) on micro-fabricated columns. The influence of the sol-gel process coating parameters on the final thickness of the stationary phase was studied on short capillary columns. Various ordered or disordered mesostructures were yielded by varying the nature and the concentration of the structure directing agent (SDA), thus allowing the obtention of columns with different retention strengths. Interestingly, the less organized layers led to the columns with the highest retention, comparable with commercial columns for stationary phases being 30 times thinner. The process was successfully transposed to micro-fabricated columns. The obtained micro-columns showed promising efficiencies and the highest number of theoretical plates per meter (th.p./m) reported to date for ethane (7500 th.p./m). Finally, we investigated an alternative way to coat GC micro-columns directly with mesostructured silica nanoparticles using an LbL process. The process was first evaluated for commercial non porous SNPs. Then it was successfully applied to mesostructured custom SNPs and further validated for the full-wafer simultaneous coating of 35 columns. Overall, this work demonstrated the use of mesostructured silica as an effective stationary phase for light alkane’s separation on GC micro-fabricated columns.
Prénom Nom University :
Prénom Nom
University :
PhD degrees awarded in 2014
Lefebvre David University: Lyon 1 Claude Bernard

67
Energy-resolved X-ray Imaging: material decomposition methods adapted for spectrometric detectors Scintillator based integrating detectors are used in conventional X-ray imaging systems. The new generation of energy-resolved semiconductor radiation detectors, based on CdTe, allows counting the number of photons incident on the detector and measure their energy. The LDET laboratory developed pixelated spectrometric detectors for X-ray imaging, associated with a fast readout circuit, which allows working with high fluxes while maintaining a good energy resolution. With this thesis, we bring our contribution to data processing acquired in radiographic and tomographic modes for material components quantification. Bone densitometry was chosen as a medical application. Radiographic data was acquired by simulation with a detector which presents imperfections as charge sharing and pile-up. The methods chosen for data processing are based on a material decomposition approach. Basis material decomposition models the linear attenuation coefficient of a material as a linear combination of the attenuations of two basis materials based on the energy related information acquired in each energy bin. Two approaches based on a calibration step were adapted for our application. The first is the polynomial approach used for standard dual energy acquisitions, which was applied for two and three energies acquired with the energy-resolved detector. We searched the optimal configuration of bins. We evaluated the limits of the polynomial approach with a study on the number of channels. To go further and take benefit of the elevated number of bins acquired with the detectors developed in our laboratory, a statistical approach implemented in our laboratory was adapted for the material decomposition method for quantifying mineral content in bone. The two approaches were compared using figures of merit as bias and noise over the lengths of the materials traversed by X-rays. An experimental radiographic validation of the two approaches was done in our laboratory with a spectrometric detector. Results in material quantification reflect an agreement the simulations.
Prénom Nom University :
PhD degrees awarded in 2014
Potop Alexandra University: Lyon

68
Cell culture monitoring by means of lensfree video microscopy
Biological studies always start from curious observations. This is exemplified by description of cells for the first time by Robert Hooke in 1665, observed using his microscope. Since then the field of microscopy and cell biology grew hand in hand, with one field pushing the growth of the other and vice-versa. From basic description of cells in 1665, with parallel advancements in microscopy, we have travelled a long way to understand sub-cellular processes and molecular mechanisms. With each day, our understanding of cells increases and several questions are being posed and answered. Several high-resolution microscopic techniques are being introduced (PALM, STED, STORM, etc.) that push the resolution limit to few tens of nm, taking us to a new era where ‘seeing is believing’. Having said this, it is to be noted that the world of cells is vast, with information spread from nanometers to millimeters, and also over extended time-period, implying that not just one microscopic technique could acquire all the available information. The knowledge in the field of cell biology comes from a combination of imaging and quantifying techniques that complement one another. Majority of modern-day microscopic techniques focuses on increasing resolution which, is achieved at the expense of cost, compactness, simplicity, and field of view. The substantial decrease in the field of observation limits the visibility to a few single cells at best. Therefore, despite our ability to peer through the cells using increasingly powerful optical instruments, fundamental biology questions remain unanswered at mesoscopic scales. A global view of cell population with significant statistics both in terms of space and time is necessary to understand the dynamics of cell biology, taking in to account the heterogeneity of the population and the cell-cell variability. Mesoscopic information is as important as microscopic information. Although the latter gains access to sub-cellular functions, it is the former that leads to high-throughput, label-free measurements. By focusing on simplicity, cost, feasibility, field of view, and time-lapse in-incubator imaging, we developed ‘Lensfree Video Microscope’ based on digital in-line holography that is capable of providing a new perspective to cell culture monitoring by being able to capture the kinetics of thousands of cells simultaneously. In this thesis, we present our lensfree video microscope and its applications in in-vitro cell culture monitoring and quantification. We validated the system by performing more than 20,000 hours of real-time imaging, in diverse conditions (e.g.: 37°C, 4°C, 0% O2, etc.) observing varied cell types and culture conditions (e.g.: primary cells, human stem cells, fibroblasts, endothelial cells, epithelial cells, 2D/3D cell culture, etc.). This permitted us to develop label-free cell based assays to study the major cellular events – cell adhesion and spreading, cell division, cell division orientation, cell migration, cell differentiation, network formation, and cell death. The results that we obtained respect the heterogeneity of the population, cell to cell variability (a raising concern in the biological community) and the massiveness of the population, whilst adhering to the standard cell culture practices - a rare combination that is seldom attained by existing real-time monitoring methods. We believe that our microscope and associated metrics would complement existing techniques by bridging the gap between mesoscopic and microscopic information.
Prénom Nom University :
Vinjimore Kesavan Srikanth University: Cergy Pontoise
PhD degrees awarded in 2014


70
Greetings
Editorial Committee Béatrice Icard Jean-Marc Dinten Loïck Verger Guillaume Delapierre Pascal Mailley Raymond Campagnolo Hélène Vatouyas Sandra Barbier Pierre Grangeat
Graphic Design Hélène Vatouyas
Special Thanks Bénédicte Messina
Photos ©CEA-LETI / G. Cottet ©CEA-LETI / L. Godart