Embed Size (px)
Citation preview

MICROSTRUCTURE ELEMENTS OF THE BONDS MARKET IN KENY A
Rose W. Ngugi1 & Justus Agoti2
Prepared for African Economic Conference
Globalization, institutions and Economic development in Africa This paper was written when both authors were working at Kenya Institute of Public Policy Research and Analysis (KIPPRA). It is currently being published as a KIPPRA Discussion Paper # 71. The paper has benefited from comments in KIPPRA weekly seminars and financial workshop.
1 School of Economics, University of Nairobi 2 KIPPRA

ii
Abstract
Mobilizing long term capital is a challenge in Africa with small capita market. Although the
evidence that long term finance influences economic growth saw a wave of capital market reform
in Mid-1990s, stock markets are yet to make significant contribution to growth financing.
Majority of the bonds market are in their infant stage offering minimal alternative source of
financing. Kenya’s experience is no exceptional. It has a youthful bonds market with handful
corporate bonds listed and yet to evolve long term maturity. With the emphasis on private-sector
led growth and the increasing focus on PPP as an alternative to providing public services, it
means that developing the capital market is very vital.
This paper focuses on Kenya bonds market. It analysis’s the microstructure characteristics of
they bonds market and looks at the factors influencing these characteristics. It is hypothesized
that a market that exhibits high liquidity, high efficiency and low volatility is more preferred as it
facilitates participation by firms and investors. Such characteristics reflect on the soundness of the
institutional structures and the policy environment. It is also hypothesized that growth of
Treasury bond market is a prerequisite for development of corporate bonds market.
Our results show that the bonds market has weak microstructure characteristics. These
characteristics though differ across the treasury and corporate bonds and also across the
maturities. Treasury bonds market is more liquid with higher traded value and more traded days
as compared to the corporate bonds market. However, the corporate bond market is less volatile
which is comparable to the short end of the treasury bonds. The treasury bonds returns have a
higher volatility for the longer tenors than the short tenor. This may explain the preference for
short tenor bonds than the longer tenor bonds. In explaining this we found that there are various
institutional gaps with for example no credit rating agencies, primary dealers and underwriting
services. The listing requirements have seen some interested companies fail to list. There is no
benchmarking yield curve and although the market has a Central Depository and Settlement
Corporation (CDSC) guarantee funds, the establishment of sinking fund is crucial in
securitization. Further there is no single model for determining prices of bonds. Thus to make
the market work, it is crucial to address the institutional structures.
iii
Table of Contents
Abstract…………………………………………………………………………………ii
Abbreviations…………………………………………………………………………..iii
1. Introduction…………………………………………………………………………..1
2. Bonds market in Kenya……………………………………………………………...1
2.1 Introduction…………………………………………………………………..1
2.2 Importance of the bonds market……………………………………………...5
2.3 Trading system……………………………………………………………….7
2.4 Regulatory framework……………………………………………………..…9
2.5 Policy issue…………………………………………………………………..10
3. A brief literature review…………………………………………………………..…11
3.1 Introduction…………………………………………………………………..11
3.2 Liquidity…………………………………………………………..………….11
3.3 Efficiency……………………………………………………….……………13
3.4 Volatility……………………………………………………………..………14
3. Methodology………………………………………………………………………….16
4.1 Empirical framework………………………………………………………...16
4.2 Variable definition……………………………………………………….…..17
4.3 Data and sample……………………………………………………………...18
4. Empirical results……………………………………………………………………..19
Summary statistics…………………………………………………………….…19
Liquidity analysis………………………………………………………………...20
Market efficiency……………………………………………………….………..23
Volatility analysis………………………………………………………….…….26
6. Conclusion……………………………………………………………………….…...29
Data collection problems………………………..……..………………………….……29
7. Policy recommendations……………………………………………………….……30
References……………………………………………………………………………....32
Appendix………………………………………………………………………………..34

iv
Abbreviations
APD - Average Per Deal
CBK – Central Bank of Kenya
CDS - Central Depository System
CMA - Capital Markets Authority
EADB - East African Development Bank
FISB-Fixed Income Securities Board
GDP - Gross Domestic Product
MRM - Mabati Rolling Mills
NSE - Nairobi Stock Exchange
REPO - Repurchase Orders
1
1 Introduction
Financing development is a challenge facing many emerging markets and constraining
their ability to implement the set development objectives. Although Africa is
experiencing financial sector development, the diversity of financing instruments is very
narrow and among the long term financing options. While 1990s saw a wave of capital
market reform, a lot of emphasis was on the stock market with very minimal effort put on
the bonds market. This saw substantial development of stock markets with new stock
exchanges being established, regulatory systems strengthened and trading system
rejuvenated. However, in most cases this has not attracted a significant number of
listings. There are very few fully fledged bonds markets. In most cases, bonds are traded
in the stock exchange with a dominance of the government bonds. Corporate bonds are
almost non-existence.
Bonds market is an alternative vehicle for mobilizing finance for both the government
and the private sector in financing long-term projects such as housing and infrastructure
development in addition to financing the government deficit. The development of bonds
market is seen to play a crucial role in promoting partnerships in the development process
between the government and the private sector. Successful development of bonds market
though requires a developed money market, favourable macroeconomic policies,
significant market participation, appropriate trading system and sound legal and
regulatory framework. Experience also shows that development of government bonds
market is crucial in paving way for development of the corporate bonds market. In the
development process of bonds market, it is expected that at the initial stage a lot of effort
is given to strengthen and develop the short end of the market including transparency in
securities operations and instrument design. After, focus moves to upgrading the trading
facilities and the settlement process and the market regulations.
In the Kenyan context, various changes have been instituted including the establishment
of a fixed income securities trading segment at the stock exchange, tax incentives and
other factors that reduce the transaction costs, diversification of the maturities especially
for the treasury bonds and the modernization of the trading system especially for the
treasury bonds. It is also important to note the deliberate effort that the government took
in boosting development of the bonds market in 2001. The question is with all these

2
developments, has the bonds market microstructure been strengthened? A market that is
characterized by high liquidity, efficiency and with minimal transaction costs and
volatility is desirable in the growth process. These are indicators that the market will play
a significant role in financing development.
Institutional development is indicated as a major factor that determines development of
the market microstructure. Policy makers and market administrators can influence
investment strategies of the investors through their choice of institutional set up. Market
microstructure determines the type of information available to market participants, the
manner in which incoming orders to buy and/or sell are matched and surveillance of the
market. As such, institutional set up defines the microstructure characteristics of the
market including liquidity, efficiency, trading costs and volatility.
This study attempts to analyze the microstructure characteristics of the bonds market in
Kenya, to see the implications of the various efforts being put on development of the
market.
2 Bonds Market in Kenya
2.1 Introduction
The Kenyan bonds market traces its origin back to the 1980s when the Government of
Kenya first launched a bid to use treasury bonds as a source of funds to finance
government deficit. Similarly, the first corporate bond was issued on 8th November 1996
by the East African Development Bank (EADB), which issued a multi-lateral bond. The
Kenyan bonds market experienced a turn around in 2001 however, when the government
re-launched treasury bonds. In both cases, the rates applicable were floating rates pegged
to the 91-day Treasury bill rates. Faulu Kenya, a microfinance institution listed a
medium term bond in 11th April 2005. The bonds market has been relatively more active
after 2001 and an increased number of bonds issues have been made. By end of 2005,
there were 65 Treasury bonds (Floating Rate, Special and Fixed Rate Bonds) and five
corporate bonds listed on the NSE. There has been a tremendous market gain in terms of
the size of the bond market as indicated in Table 1. Total bond value has increased from
just over Kshs. 0.8 billion in 1996, to over 186 billion in 2003, with the coupon rate in the
market ranging between 8% and 14%.

3
2.1.1 Treasury bonds
In Kenya, the objective of government has been to maintain stability in Treasury
securities interest rates, lengthen the average maturity of the domestic debt through
sustained efforts to restructure the debt away from the short tenor Treasury bills to longer
tenor Treasury bonds and develop a yield curve to provide a basis for pricing corporate
bonds. Following the introduction by the government of long tenor Treasury bonds (7, 8,
9 and 10 year) since March 2003, the average maturity of domestic debt lengthened to 2
years and 2 months at the end of June 2004 from 1 year and 7 months in June 2003.
Consequently, the stock of Treasury bills (including repos) declined as a percentage of
domestic debt to 32.5% in June 2004 from 35.6% in June 2003, while the stock of
Treasury bonds increased to 61.6% in June 2004 from 55.8% in June 2003, as shown in
table 2, reflecting the continued interest by the Government of Kenya in domestic debt
restructuring with a bias towards Treasury bonds.
The share of Treasury bonds of 5 years tenor and above in the total outstanding bonds
increased to 42.2% at the end of June 2004 from 25.7% at the end of June 2003, while
that of the 10-year bonds increased from 1.7% of the outstanding bonds in June 2003 to
4.6% in June 2004. The Government faces a challenge however, of sustaining this
achievement and extending the maturity profile further in order to diversify its fixed
income portfolio away from short-term to long-term instruments. The significant role
played by the banking sector as the leading investors in holding outstanding stock of
Treasury bonds should be recognized as should be that played by “others”, insurance
companies, parastatals and building societies in that order. Together, these investors
indirectly help government achieve its fiscal objectives, which is why their interests
should be protected.
2.1.2 Corporate bonds
Kenya’s corporate bonds market has always had a lower trading activity compared to the
Treasury bond market3. Since the inception of this market in 1996 there has only been
five corporate organizations that have listed their bonds in this market. The growth of this
market has been hindered by a number factors, among them, information asymmetry
3 See table 1 for details.

4
among potential issuers, a high and unstable interest rate regime, lack of a yield curve to
price long term instruments and the crowding out effect of the government’s domestic
debt.
Added to the foregoing, is the characteristic of the dominance of institutional investors in
this market as shown in table 4, who prefer a strategy to buy and hold the issued bonds.
These investors who include, Banks, Insurance companies, Fund Managers and
Investment companies account for approximately 97% of the total bondholding whereas,
individuals account for about 3% of the total corporate bondholding in Kenya.
2.2 Importance of the bonds market to the Kenyan Economy
There exists a direct relationship between fiscal deficit and significant issuances of
government debt securities; the development of the bond market is inextricably linked to
the direction and management of fiscal policy. The extent to which fiscal spending is
financed through the sale of government bonds in open competitive markets, and the
degree to which this sustains a critical level of supply of government debt securities have
important implications for the development of a country’s economy.
Similarly, a domestic corporate bond market helps corporations reduce their financing
costs in two ways. First, through disintermediation, by allowing corporations through
bond issuance to borrow directly from investors, bypassing the major intermediary role of
a commercial bank and second, by structuring their asset and liability profiles in such a
way as to reduce maturity risk and currency mismatch in their books of accounts.
Although corporations still go through underwriters, brokers and dealers to raise debt
finance, competition among these intermediaries is more intense compared to that
between commercial banks, pushing down their intermediation costs. As a result,
borrowing firms enjoy a lower cost of debt financing.
The bond market belongs to the larger financial services sector, which in 2003
contributed at least 10% to total GDP. The Kenya Government issues bonds majorly to
finance domestic debt borrowing, which is part of a general objective of financing public
debt. Kenya’s public debt stood at Ksh. 709.7 billion at the end of June 2004. Out of the
outstanding public debt, Ksh. 306.2 billion or 43.2% was domestic. The share of
domestic debt in GDP stood at 26.4% in June 2004. Overall, the ratio of total public debt

5
to GDP was at 61.2% in June 2004. Domestic debt was majorly financed through the sale
of Treasury bonds to commercial banks and the non-banks (61.6%), and through
utilization of the overdraft facility at the Central Bank of Kenya.
In addition to them being traded, bonds may also be used as collateral (through lien
creation) against borrowings before maturity date, or be transferred to others. The
corporate bond market statistics show a positive contribution to GDP albeit, at a lower
level. As at June 2003 for instance, corporate bonds worth 7.35 billion were outstanding.
Institutional investors who have a tendency to buy and hold to maturity dominate the
corporate bonds market.
2.3 Trading system
Bonds trading at the NSE follow a call auction system to determine the bond price. In a
call auction, the orders are accumulated periodically and are matched at a specific time at
the price, which results in maximum trading volume. In most cases, this price is the
average price between ask and bid price. Additionally, given that NSE’s bond market
does not have market makers, it is order driven and this according to Madhavan (2001)
reduces efficiency as compared to if it were a quote driven market. The main order type
used at the NSE in trading in bonds is the limit order. In this type of order, the broker is
instructed to buy or sell a security at a specific price (or better).
The secondary market for Treasury and corporate bonds in Kenya is Trading at the NSE
takes place through licensed stockbrokers who act as intermediaries playing the agent
role. For a transaction to take place in the case of treasury bonds, a prospective investor
must have a Central Depository System (CDS) account, which is a central facility at
Central Bank for holding securities by book entry without the necessity of certificates. It
is a requirement of Central Bank that all investors have a CDS account for them to
purchase Government bonds. New investors are required to complete CDS account
opening cards before making their accounts fully operational. No fee is charged to open
this account. Additionally, an investor requires only one CDS account, which is to be
used for all investment in Government securities. When applying to hold or sell bonds,
investors apply on a prescribed application form which requires information on the issue

6
number, face value, offer payment for every Kshs. 100, desired rate to maturity (% rate),
duration, name of the prospective investor and CDS account number.
Bonds in the Kenyan bond market are traded on a separate board known as the Fixed
Income Securities Board (FISB). Specific rules that govern trading in bonds on the board
are followed to ensure an orderly trading process at the NSE. To start with, bids and
offers of bonds are displayed on the Fixed Income Securities board in the order in which
they are called. Also, bids and offers are first matched on the basis of best price and
second, on the first come first served basis.
To trade, bids and offers must be equal and for at least 50% of the value on offer, for the
matching to take place. No bidding spreads or forced transactions are allowed at the
exchange. Also, it is a requirement that board lots be at par and that prices be expressed
as a percentage of Kshs. 100 par rounded to four decimal places. The minimum board lot
is according to the rules defined as the outstanding minimum nominal value of the bond.
Additionally, bonds with periodic partial principal repayments are traded at the
subsequent minimum nominal value following the partial principal repayments.
In a case where the bonds bear a floating rate of interest, the daily applicable reference
interest is displayed on the Fixed Income Securities Board at the start of the trading
session. All bonds are according to these rules traded cum coupon up to the closure of
books as communicated by the issuer for determination of entitlements. Lastly, the rules
stipulate that no bond should be traded within 3 working days of the principal
redemption.
A major issue of concern that would constrain the operations of the Treasury bond market
is the entry requirement. The minimum face value required before one invests in bonds is
Kshs. 50,000 and any additional to be invested must be in multiples of Kshs. 50,000
according to the national debt department of the central Bank of Kenya. Although those
eligible to invest include individuals, corporate bodies and non-residents through
authorized agents such as commercial banks, authorized stockbrokers and authorized
investment advisers, individual participation is highly constrained.
Aside from trading in the organized exchange, Off-market trading in bonds (also known
as Over-the Counter trading) takes place at the NSE. This market has fewer participants

7
than the organized exchange. It however helps institutional investors to do cross border
trading and execute large blocks of trades.
2.3 Regulatory framework
Trading in bonds is governed by specific eligibility and listing rules and regulations set
up by both the Nairobi Stock Exchange (NSE) and the Capital Markets Authority (CMA).
In the pre-reform period (before February 2001), NSE used to have only one listing
market segment with stringent eligibility and listing requirements. According to the
market participants, these requirements failed not only to address the needs of small and
medium-size organizations but also the special needs of institutional investors. In the
post-reform era however, the NSE regulatory framework has been changed, bringing with
it a subdivision of the market into four distinct market segments, each with its own
eligibility and listing requirements. Also, in addition to defining the various categories of
investors and addressing their needs, the post-reform NSE has defined trading lots, a
feature which did not exist before the reforms were introduced.
To list at the NSE and issue bonds, a corporate organization needs to be registered under
the Companies Act and be limited by shares with minimum share capital of Kshs. 50
million and net assets of Kshs 100 million or a guarantee. The bonds to be issued must be
freely transferable to other parties. Additionally, at the time of issuing the bonds, the
issuer must have published on a going concern basis, audited and unqualified financial
statements, which must comply with International Accounting Standards (IAS).
Furthermore, the issuer should not be in breach of any loan covenant in regard to
maximum debt capacity and should have made profit in 2 of the last three years
preceding the issue.
The organization must also be solvent and have a gearing ratio4 of 4:1 or less. At the date
of its intention to issue bonds, the organization’s three years’ ratio of funds generated
from operations to total debt should not be less than 40%. The corporate organization
should in addition to disclosing the suitability of directors and Management to the
4 A gearing ratio shows the extent of indebtedness of a corporate organization, the lower the ratio the more solvent an organization is.

8
Exchange, present a clean certificate from the relevant regulatory authority for banking
and insurance companies.
Despite all the efforts that have been made to boost trading in the bonds market and
protect investors, more effort needs to be put in to attract more investors. Both the
exchange and its controlling authority need to develop a reform agenda in the regulatory
framework to make the market more competitive in investor attraction and boost bond
market activity.Policy issue
The question that comes to mind when it comes to the Kenyan bond market is whether
enough is being done to improve the institutional structure in the bonds market and
reduce the cost of trading, reduce excess volatility and improve both efficiency and
liquidity through tax incentive provision. Taxation being an added cost to trade may have
been discouraging some potential investors into venturing into investment in bond
markets, given the fact that these same investors pay several other fees and charges.
However, a reduction in tax charged may drastically reduce the capacity of Government
to introduce necessary institutional reforms aimed at boosting bond market activity.
Therefore, a balance needs to be struck as concerns provision of tax incentives in the
bond market to ensure that market activity is boosted while at the same time improving
the institutional framework in bond markets in Kenya.
3 A brief literature review
3.1 Introduction
The viability of bond markets depends on its level of liquidity, efficiency, volatility and
trading costs. Market rules and market practices governing the trading process, such as
how trading orders are submitted and what trading information must be disclosed, affect
the market microstructure elements. This raises the question of whether changes in
institutional structure can enhance market performance by improving the microstructure
elements. We look at the empirical evidence with regard to the microstructure elements.
3.2 Liquidity
Liquidity, the ability to buy or sell both quickly and without substantially moving prices,
is the key to market success. As a market becomes more liquid, it encourages more

9
trading, which, in turn, attracts more market participants, resulting in a virtuous circle
where markets become more liquid and more efficient over time.5 By reducing the
riskiness of buying and selling bonds, liquidity makes market participation more
attractive, which has a bearing both on prices and on the ability of the market to process
information efficiently. Ultimately, liquidity can dictates the success of a market.
Liquidity goes beyond the physical ability to trade and also includes market depth, which
refers to the ability to transact at the current market price. In a deep market, even large
orders can be transacted at the current price. In contrast, when market depth is lacking,
the larger an order, the more price will have to adjust to fill that order.
Linking the institutional structure to liquidity, some studies have looked at the
implications of trading system on liquidity. For example, Madhavan (1993) develops a
theoretical framework that permits one to compare different trading structures and shows
that there are differences between the equilibrium behavior of continuous and periodic
auctions, and between dealer and quote-driven systems. Periodic auctions provide better
price efficiency in his model, but at the expense of continuity and higher information
costs. Amihud and Mendelson (1991) examine the effect of liquidity on fixed income
instruments. Their results show that liquidity has an economically and statistically
significant impact on required returns. As liquidity increases, required return declines.
Domowitz (2001) conducted a study to find out whether electronic trading can offer
much more than just the reduction of transaction costs through the automation of trade
execution and dissemination of quote information. Results showed that electronic trading
systems offers strategic liquidity management. Another study looked at the relationship
between market transparency and liquidity. Using empirical studies, Bloomfield and
O’Hara (1999) show that low-transparency dealers are more likely to provide liquidity
because of the information content of their actions in the market. However, Madhavan
and Porter (2001) case study of Toronto Stock Exchange indicate that increased
transparency had “detrimental effects” on liquidity. Gravelle (2001) found that fixed
income markets tend to be characterized by pre-trade transparency (by requiring quotes
5 See Madhavan (1993) and Mendelson (1991)

10
from dealers) and from stock exchanges by post-trade transparency (by immediately
reporting transactions).
Other studies have related liquidity to other elements of microstructure. For example, it
is shown that illiqudity can itself create trading cost especially because of its interact with
fundamental risk. As a result, the “trading cost view” postulates that illiquid securities
must provide investors with a higher return to compensate them for their larger
transaction costs, controlling for their fundamental risk Amihud and Mendelson (1986).
Studies testing this hypothesis confirm a significant cross-sectional relationship between
liquidity (as measured by the tightness of the bid-ask spread or trading volume) and asset
returns, controlling for risk including Brennan and Subrahmanyam (1996) Chordia, Roll
and Subrahmanyam (2000) Datar, Naik and Radcliffe (1998) and Elwaswapu (1997),
Warga (1992), Daves and Ehrhardt (1993), Kamara (1994) and Krishnamurthy (2000).
The “liquidity view” postulates that liquidity is itself a source of risk since it changes
unpredictably over time. Since investors care about returns net of trading costs, the
variability of trading costs affects the trading cost of a security. Acharya and Pedersen
(2004) showed that liquidity risk should be priced to the extent that it is correlated across
assets with asset fundamentals. Similarly Hasbrouck and Seppi (2004) proposed a model
of liquidity risk where traders have asymmetric knowledge about future liquidity so that
less informed investors try to learn from current trading volume how much liquidity there
may be in the future. They showed that current liquidity is a predictor of future liquidity
risk and is therefore priced.
More recent literature puts forward the “risk-liquidity interaction view” which opines that
both current and future liquidity alter the impact on the changes in risk on current prices
and yields. This view does not emphasize on liquidity risk but rather on the interaction of
liquidity and fundamental risk. Proponents of this argument including Pagano et al.
(2005) contend that changes in fundamental risk affect less the price of bonds that are
currently less liquid but more the prices of bonds that are more liquid. Similarly, Vayanos
(2004) argues that fund managers are subject to withdrawals when their performance falls
below the minimum threshold, and are therefore likely to liquidate at times of high
volatility. This increases the liquidity premium at times of high volatility.

11
3.3 Efficiency
Markets are said to be efficient if they quickly and correctly incorporate information into
prices. This is important because many traders are unable to devote time and resources to
gathering information given the cost this portends for them, preferring instead to depend
on the market itself to properly reflect all available information in prices. For these
uninformed traders, a market that is inefficient is also unattractive because it means that
trades may be made at unfavorable prices and if they realize that later they may be
discouraged from trading. For that reason, markets that are more efficient will attract
investors and this translates into increased market liquidity.
The importance of efficiency as market microstructure element was identified by Jack
Treynor’s short article on the Only Game in Town6 (written under the pseudonym of
Bagehot, 1971). In this article, Treynor explained why investors as a whole lose from
trading, and why informed investors win. According to him, the key is to understand the
role of the dealer or market maker, who loses when trading with informed investors, but
aims to more than recoup these losses through trading with uninformed investors.
Grossman and Stiglitz (1980) observed that in a world with costly information, it is
impossible for markets to be informationally efficient. They resolved this paradox by
drawing on Treynor’s idea of assuming that the market also entertains transactions from
uninformed noise traders. This focus on the way that markets function has grown into an
extensive literature on the microstructure of financial markets. The Bagehot (1971) article
provided an early insight into the way information is incorporated into security prices
through the activities of investors, and how market structure can have an impact on the
efficiency of the bond market.
The intuitive story presented by Bagehot was formalized in the price formation model
presented by Kyle (1985). Kyle developed a model in which multiple orders of variable
size are processed at a single price. His model had three types of traders: a single
6 Investors' confusion between market gains and trading gains helps explain why they continue trading even though it rarely improves their performance. Then, too, some investors reason that if trading based on random selection is as likely to prove profitable as not, trading based on any information whatever will result in performance better than neutral. The key to the fallacy in their reasoning is the market maker, who must impose a spread in order to survive.

12
informed trader, several competing market makers, and uninformed noise traders who
transact randomly. Noise traders camouflage the activities of the informed trader, whose
transactions are organized in such a way that his private information is reflected
gradually in market prices. The market makers compete and therefore break even while
informed transactors achieve a profit at the expense of noise traders.
Glosten and Milgrom (1985) showed that the very possibility of trading on information
could be sufficient to induce a positive bid-ask spread. Building on earlier work by
Copeland and Galai (1983), Glosten and Milgrom identified the element of the spread
that is attributable to adverse selection. Taken together with Demsetz’s (1968) order
processing costs, and Ho and Stoll’s (1981) measure of inventory control costs, this has
provided a framework to an extent that it is now used widely for analyzing the bid-ask
spread confronted by investors.
3.4 Volatility
Volatility refers to the frequency and magnitude of price movements in the market. While
prices are expected to vary over time to reflect changes in relative and absolute value, the
concern over volatility is that short-term price movements do not correctly reflect
changes in equilibrium value. Furthermore the concern is over excess volatility, which
has the potential of destabilizing the market and in the process making it less attractive to
potential investors. Volatility and the other microstructure elements have a strong
linkage. For instance, if markets are liquid, transaction costs will be lower, especially
bid/ask spreads and, as a result, the observed sequence of trading prices will be less
volatile as the natural bouncing of transactions between the bid and ask occurs over time.
The generally accepted view is that asset price volatility is caused by the arrival of new
information, which results in investors wishing to adjust their portfolios (Clark, 1973).
Epps and Epps (1976), in an attempt to explain volatility clustering, postulate that
because information arrives at an uneven rate, volatility is also variable. They argue that,
if one could replace clock time with event time, so that the time measure is stretched
during periods of high information arrival and is contracted in periods of low arrival
(weekends, nights, lunch-times), volatility would be much smoother.

13
A further observation is that the information arrival process impacts additionally on
trading volume, (Karpoff 1987). This is because, to the extent that new information
results in investors adjusting their portfolios, they will need to trade. The consequence is
that volume and volatility will be jointly determined and will be positively correlated
(Tauchen and Pitts, 1983). Volume will also tend to cluster (Lamoureux and Lastrapes
1990). In explaining persistence in volatility Gilbert (1987) uses a fundamental
characteristic of financial asset trades, which is that they must all at some future date, be
reversed. One cannot consume a share or a bond in the way that one consumes an apple
or an orange. Positions established today will be unwound at some future date. Shocks to
trading volume today will generate echoes in the future. On this view, volatility
persistence is the outcome of the unwinding of positions resulting from information
arrival at an earlier date.
4 Methodology
4.1 Empirical framework
The purpose of this study was to analyze the microstructure characteristics of the bonds
market. The main elements considered include: liquidity, efficiency and volatility.
Although literature provides more sophisticated models of carrying out the analysis,
because of data constraints the study carried out a simple but informative analysis about
the state of the market microstructure in the bonds market in Kenya.
a) Liquidity
To capture liquidity, the study used the traded value (which is what was available) and
number of deals. If all the statistics of the outstanding value of bonds were available, the
study would have used the turnover ratio. Similarly, it would have been more preferable
to use the traded volumes rather than values because of the impact of price changes. The
number of deals shows participation in the market while the traded volume/values show
the size of transactions. Thus, we expect that the higher the number of deals, the higher
the level of participation and the higher the value traded the larger the size of
transactions. It is possible however; that small deals could be associated with higher
traded values so that large transactions fail to capture the participation rate. In this regard

14
the study used the average traded value per deal to analyze the average size of each
transaction.
b) Efficiency
The study looked at various aspects that have implications on the efficiency of the
market. The first aspect considered was thinness of the market measured by the number
of days of traded out of the ideal situation (this excludes weekends and holidays and
includes all the days that the market is open for trading in the week). A thin market is
said to be inefficient because of the information asymmetry. Second, it is hypothesized
that when information assimilation is not an issue for the market, then the difference
between the closing prices and the highest prices quoted during the day should not be
significantly different. In this study we compare the closing prices with the highest
quoted prices. Inefficiency is inferred when the dispersion between the two is high. An
assumption is also made that the closing price that captures the information in the course
of trading should be between the high and low quotations of the day. It would have been
interesting to capture efficiency by looking at how the market adheres to administrative
directives. For example, there are defined limits within which the current price should
not exceed. With daily data it would be possible to trace the magnitude of the daily
prices and calculate their dispersions. However, the study did not get access to this type
of data.
c) Volatility
The study used the standard deviation and variance of bonds return to capture the
volatility in the market. The standard deviation captures the direction of fluctuations
while the variance captures the magnitude. The volatility is defined as:
Volatility = 1−tstd
−1
logt
t
Q
Q=
−− XX i
Where, std is the standard deviation, log is the natural logarithm, Q represents price,
current yield or any other variable whose volatility is being measured. iX is the monthly
observation and X-bar is the mean value of 12 months. Subscript 1−t indicates that the
standard deviation is conditional on information available at time 1−t . The variance is

15
defined as the square of the standard deviation. Bonds return is a sum of the current yield
and capital gain or loss. Thus, the study divided the bonds returns into the two
components and analyzed them separately. The idea was to capture the size of the two
components in the total volatility. Further, the study captured the dispersion between the
lowest and highest prices to give an indication of the price dispersions.
4.2 Variable definition
Bond return = current yield + capital gain/loss; Current yield = coupon/bond prices;
Capital gain/loss = log (bond price) t – log (bond price) t-1; Value = traded value of bonds;
Deal = number of deals struck in the period; APD = ratio of Value to Deal; Day = the
number of days traded; Day* = the ratio of number of days traded to total ideal number
of days; Closing = closing price in the day of trading; High = the highest price quoted in
the day of trading; Low = the lowest price traded in the day of trading
4.3 Data and Sample
The study covers the period 2000-2004. This is the period when comprehensive monthly
data is available as observed from the NSE’s monthly bulletins. In total the study uses
1,279 treasury bonds traded value observations, 45 corporate bonds traded value
observations, 60 bonds deals, 1,266 bond price and 1,093 current yield observations for
treasury bonds, and 45 bond price and current yield observations for the corporate bonds.
The variation in sample sizes is as a result of the way bonds data is entered at NSE; it
keeps changing the style over time and there are variations in frequency of trading.
5 Empirical results
5.1 Summary statistics
Table 6 provides summary statistics for the various measures of microstructure
characteristics of the bonds market. Corporate bonds have on average a lower price
(102.33) than the Treasury bonds (104.75). Whereas corporate bond prices range
between 99% and 109%, indicating a price dispersion of 10%, the Treasury bonds prices
range between 65% and 148.5% indicating a price dispersion of 84%. The relatively
higher price dispersion in Treasury bonds is indicative of higher price volatility in this

16
market. The distribution of prices does not follow a normal distribution as both types of
bonds, have positive skew coefficients and fat tails relative to the normal distribution.
The average value of Treasury bonds traded is generally higher than the corporate bonds
as can be observed from table 6. Theoretically, on average, Ksh. 91 million worth of
treasury bonds and Ksh. 55 million worth of corporate bonds are turned over per day, an
indication that there is more participation in the treasury bonds market. For both the
corporate and treasury bonds, an average of 73 deals were struck per day, with a
minimum of 18 deals and a maximum of 172 deals made. Treasury bond capital
gains/losses are also generally more volatile than corporate bonds with a maximum and
minimum of 0.40 and –0.429 and 0.066 and -0.088 respectively. For the current yield,
volatility for corporate bonds fluctuates between a maximum and minimum of 1.42 and –
1.29, whereas that for Treasury bonds fluctuates between 2.21 and –1.999, indicating that
the trend has been the same, with total volatility in the treasury bonds market being
higher.
5.2 Liquidity analysis
The liquidity of the market has been analyzed using various measures, with all of them
showing that participation in the corporate bonds market is much lower relative to the
treasury bonds market.
a) Traded value
Table 7 summarizes the traded values for the period 2000-2004. There is a general
increasing tendency of traded values over the period with a drop in 2004 for both the
treasury and corporate bonds. There are also notable differences across maturities for the
various types of bonds. Corporate bonds show more traded value for the 4-year than any
other active tenor. The 5-year tenor seconds 4-year tenor in market activity, followed by
the 3-year tenor, with the 7-year tenor being the relatively least active. Over time, all the
bonds indicate a higher level of trading immediately they are listed and then a drastic
general decline there after.
In traded value terms, the treasury bonds market is dominated by the 2 and 3-year tenors,
indicating a preference for short-term securities by Treasury bond investors. Another
17
indicated pattern is that, when a new treasury bond tenor is introduced in the market, it is
generally not very popular as measured by the low traded value. However, over time, it
is able to pick up as investors gain confidence in it. In the short-run, investors appear to
be substituting one-maturity with another, as an increasing trading in one sees trading in
the other decline.
Considering the monthly levels of trading, Figure 1 indicates that there is a general
tendency for the value traded to decline in the first half of the year. A peak is generally
achieved in the third quarter of the year while a declining tendency is experienced by the
end of the fourth quarter of the calendar year, this indicates seasonality effects in bond
market trading.
Comparing the corporate and treasury bonds’ traded values, results show that
participation in the corporate bonds market is relatively far lower (Figure 2), implying
that Treasury bonds dominate Kenya’s bonds market. A possible explanation for this is
the relatively higher prices that treasury bonds fetch in the bonds market.
b) Trading deals
Table 8 shows that there has been an increasing number of deals in the market, an
indication that participation in the market has increased over time. It also shows that the
average size of deals has increased overtime from 47 in 2000 to 90 in 2004. Similarly, on
average, turnover values and the average number of deals struck have increased, an
indication of market deepening. This can be attributed to the increasing number of bonds
listed in the market and the increasing awareness among the investors.
Figure 3 summarizes the relationship between the turnover value, number of deals struck
and the average turnover value per deal. A notable observation is that participation in the
bonds market is accompanied by an increasing size of the market turnover value and vice
versa. There is a general increasing trend in turnover value, average turnover per deal and
the number of deals as can be observed by the increase at a decreasing rate of the curves
representing the trend of the three variables. There is however a drop in the turnover
value, the number of deals struck and the average turnover value per deal in 2004,
signaling a decline in bond market activity.

18
5.3 Market efficiency
Although both the treasury and corporate bonds share the same floor in the secondary
market, their clearing and settlement systems and procedures are different. For instance,
an investor in the Treasury bond market is required to have a Central Depository System
(CDS) account to facilitate the immobilization bonds given that bonds are held in
electronic accounts. It also facilitates faster and easier processing of transactions. The
market defines the spreads within which daily prices move, which helps in controlling
daily volatility of prices. Conversely, one is not required to hold a CDS account to trade
in corporate bonds and this lowers the relative efficiency in trading in corporate bonds.
The first panel of table 9 reports the average price, yield and return for the corporate
bonds. Generally, the 3-year bond price is higher than the rest of the active bond tenors.
Similarly, the 4-year bond has a generally declining yield trend that is lower than the 3-
year tenor bond. The converse is true for the 5-year bond whose yield has been generally
higher than the 3-year bond. A notable feature for the 3-year bond is that it has a
declining yield even as the price declines, implying that the coupon rate for this bond has
gone down drastically over time. It therefore means that, in real terms, the 3-year bond is
relatively more rewarding to investors.
The second panel of the same table gives the average price, yield and return for Treasury
bonds. It can be observed that generally, as the tenor of the bond increases, so does its
average price. On the other hand, the yield falls as the tenor of the bond increases. This
could be the reason why trading activity is concentrated on lower tenor bonds.
Additionally, in general, corporate bonds of the same maturity as Treasury bonds are
more expensive and on average, have a higher yield. This could explain why there is
lower trading activity in corporate bonds, owing to the lower risk faced in trading in
Treasury bonds.
a) Number of days of trading
The number of days the bond is traded in the market is indicative of the thinness of the
market. Treasury bonds have recorded an increasing number of times of trading relative
to the corporate bonds (Table 10). As a proportion of the total number of days of trading,
it increased from 68% in 2000 to 87% in 2004. This means that comparatively, corporate

19
bonds thinly trade in the market, an indication that on the overall, Treasury bonds are
more efficiently traded than corporate bonds.
b) Information trading
In an efficient market, new information should be incorporated quickly and correctly in
the price of a bond. It therefore follows that, at the close of trading, the close price
should reflect all the information availed to the market until the last minute of trading
before the market closes. Similarly, in an efficient market the dispersion between the
highest price attained and the close price should be small to reflect the fact that most of
the information availed to the market was impounded in prices just before the market
closed. The dispersion between the highest price attained and the close price has been
computed and is summarized in the table 11(a), whereas the lowest price attained and
close price dispersion is reported in table 11(b). Figure 4 summarizes the relationship
between the closing price and the high and low prices.
Results from the tables show that the total average dispersion of the closing price from
the highest price is higher (9.02%), than the dispersion of the closing from the lowest
price (6.05%). In efficiency terms, it means that information that could lead to an
increase in bond price is relatively more efficiently relayed to the market than
information likely to lead to the eventual reduction in bond price. Also, a high dispersion
between the highest and closing price could be signaling information trading because,
depending on the nature of the information, as the information is assimilated in the
market, then the price at the end of the trading day may be lower or higher. For the
low/close price dispersion, we find an indication of relatively lower information trading.
5.4 Volatility analysis
The bonds return volatility, which captures the capital gain/loss and current yield
volatility have been separately computed to find out the contribution of the two to the
total bonds market volatility.
a) Treasury bonds
Figures 6 and 7 trace the volatility of T/bonds’ capital gain/loss across the various
maturities. The figures show that short tenor bonds have lower volatility compared to the

20
long tenor bonds, in terms of both the direction and magnitude of volatility. This could
explain why there is preference for the short tenor bonds relative to long tenor bonds, in
Kenya’s bonds market, given the minimal risk exposure.
Considering the current yield volatility, figures 8 and 9 show that the short tenor bonds
again have lower volatility, which is explained by the volatility in prices given that the
coupon rate is almost constant over time. Comparing the two volatilities, we find that the
current yield fluctuates between 2.21 and –1.99 as compared to the capital gain/loss
volatility, which fluctuates between 0.4 and –0.429. It means therefore that, current yield
volatility contributes a significantly higher proportion (83.55%) to the total bonds return
volatility than capital gain/loss volatility (16.45), for treasury bonds.
Considering the difference between the highest and lowest price, figure 5 and table 12
show that over time the dispersion between the two has increased. A peak is recorded in
October-2003 and a declining tendency thereafter. However, the values are generally
higher than they were in 2000.
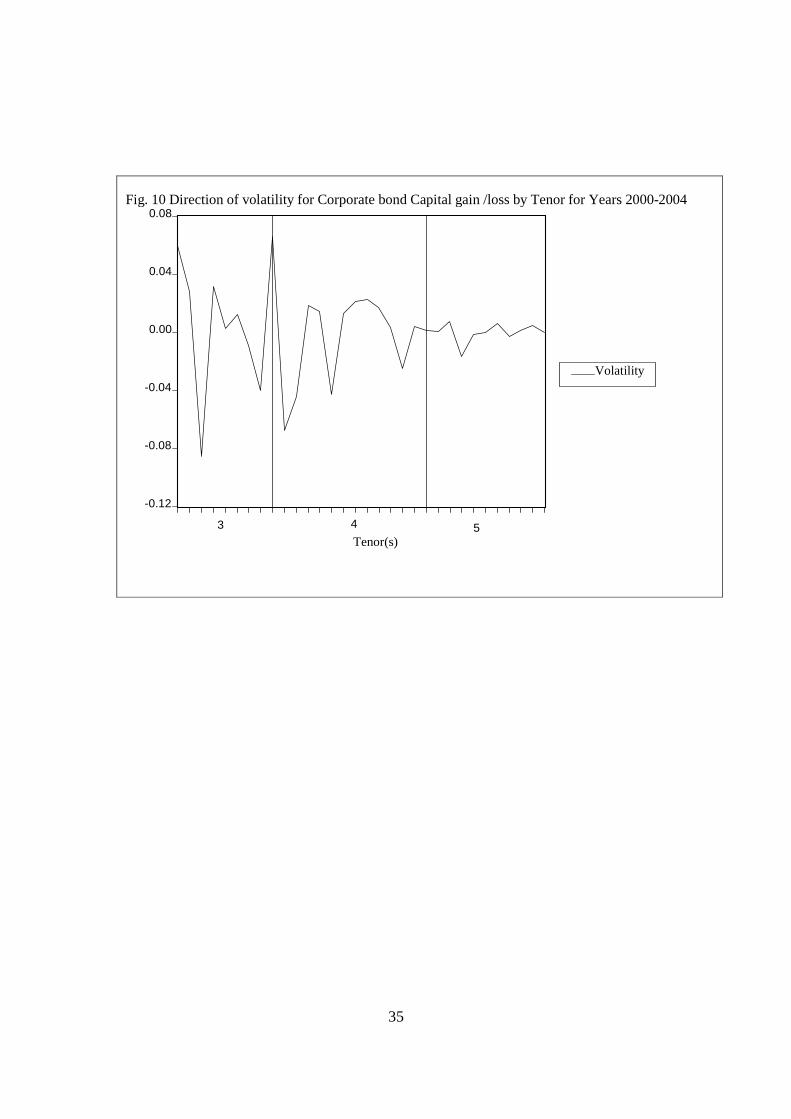
b) Corporate bonds
The corporate bond market has relatively fewer observations, signaling the fact that
trading it is not as active as the government bond market. The 3-year, 4-year, 5-year and
7-year corporate bond are the only active bonds, with the 3-year trading in all the years
between 2000 and 2004, the 4-year trading between 2001-2003, the 5-year trading in all
the years under review except 2000, and the 7-year trading in 2004 only. For capital
gain/loss, the short tenor bonds show larger spikes for both the rise and fall in bond return
as compared to the longer tenor bond (see Figures 10 and 11). These results are
replicated by the variance, which shows higher magnitudes of fluctuations for the short-
term bonds. These results are the exact opposite of the treasury bonds, which displayed
higher volatility for longer tenor bonds. The higher volatility for shorter tenor bonds
could be as a result of the higher competition with the 5-year tenor bonds, which are
issued by three companies as compared to the 3 and 4-year, which have two companies,
with higher competition leading to lower volatility.
For the current yield, Figures 12 and 13 indicate the short maturities to have relatively
lower volatility than the longer maturities. Comparing the proportionate contributions of
21
the yield and capital gain/loss volatility, we find that current yield fluctuates between
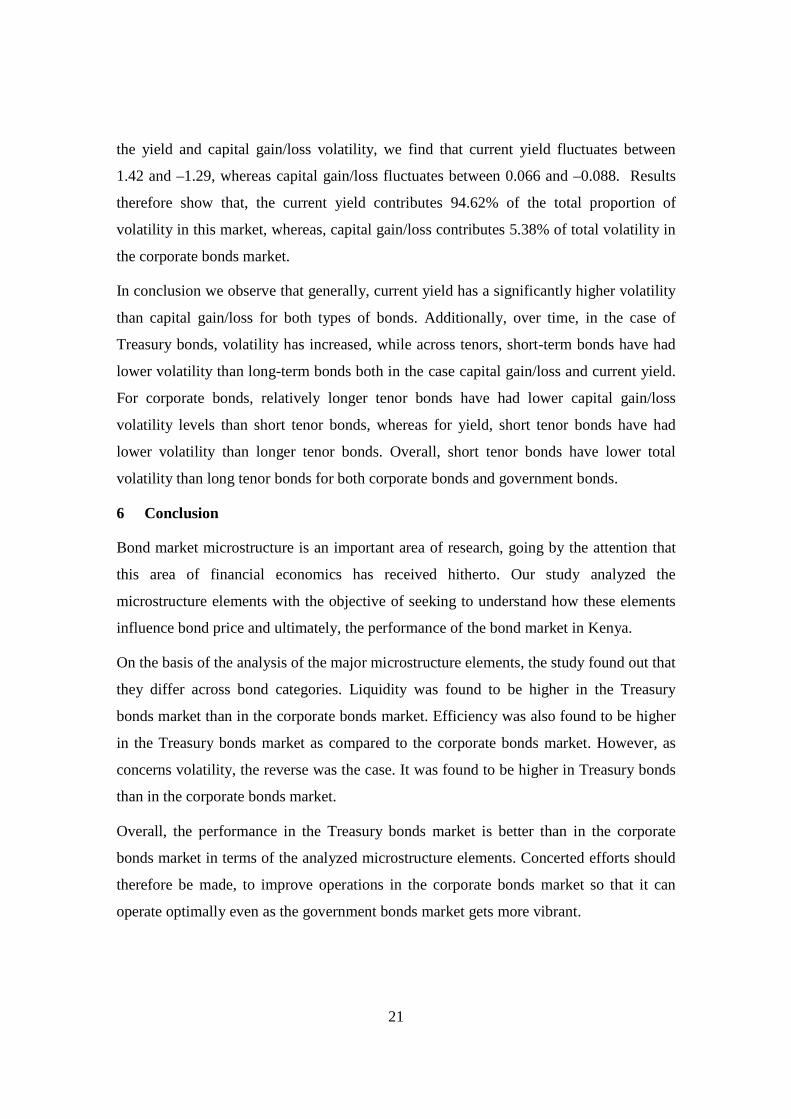
1.42 and –1.29, whereas capital gain/loss fluctuates between 0.066 and –0.088. Results
therefore show that, the current yield contributes 94.62% of the total proportion of
volatility in this market, whereas, capital gain/loss contributes 5.38% of total volatility in
the corporate bonds market.
In conclusion we observe that generally, current yield has a significantly higher volatility
than capital gain/loss for both types of bonds. Additionally, over time, in the case of
Treasury bonds, volatility has increased, while across tenors, short-term bonds have had
lower volatility than long-term bonds both in the case capital gain/loss and current yield.
For corporate bonds, relatively longer tenor bonds have had lower capital gain/loss
volatility levels than short tenor bonds, whereas for yield, short tenor bonds have had
lower volatility than longer tenor bonds. Overall, short tenor bonds have lower total
volatility than long tenor bonds for both corporate bonds and government bonds.
6 Conclusion
Bond market microstructure is an important area of research, going by the attention that
this area of financial economics has received hitherto. Our study analyzed the
microstructure elements with the objective of seeking to understand how these elements
influence bond price and ultimately, the performance of the bond market in Kenya.
On the basis of the analysis of the major microstructure elements, the study found out that
they differ across bond categories. Liquidity was found to be higher in the Treasury
bonds market than in the corporate bonds market. Efficiency was also found to be higher
in the Treasury bonds market as compared to the corporate bonds market. However, as
concerns volatility, the reverse was the case. It was found to be higher in Treasury bonds
than in the corporate bonds market.
Overall, the performance in the Treasury bonds market is better than in the corporate
bonds market in terms of the analyzed microstructure elements. Concerted efforts should
therefore be made, to improve operations in the corporate bonds market so that it can
operate optimally even as the government bonds market gets more vibrant.

22
7 Policy Recommendations
Given the tumultuous times that Kenya’s bond market has been going through, it is only
fair that urgent measures be taken to reverse the evident negative trends so that this
crucial market can take its legitimate position in spurring the Kenya’s financial sector to
the course of rapid development. To achieve this our study recommends the following.
Greater attention to longer tenor bonds
Although evidence from the analysis done shows that short tenor bonds far outperformed
long tenor bonds as measured by the microstructure elements, it is imperative that greater
attention be focused on longer tenor bonds. We therefore recommend that government
intensifies its efforts to diversify its fixed income securities portfolio to longer tenor
bonds, given the relative success in using short-tenor bonds in financing its domestic
debt. Corporate organizations should also be encouraged to launch longer tenor bonds
with attractive premiums to improve bond market vibrancy.
More instruments in the Market
Some corporate organizations defend their “buy and hold policy” by arguing that there
are no alternative instruments in the stock market that they could invest in, were they to
sell the bonds they hold. Given the limitation of few available instruments to invest in,
this contention is valid. Additional instruments in the market would therefore spur market
activity and encourage market participants to change their buy and hold behavior. Such
instruments are for instance REPOs and reverse REPOs, short selling, securities
borrowing and lending, bond futures and options and interest rate swaps.
Automation
In the era of globalization, it can be naïve not computerize operations in virtually all
information and transaction processing operations in a stock market. The NSE is semi-
automated and this has to some degree affected both the liquidity and efficiency of the
market. It is therefore our suggestion that computerizing all operations in the market
should have been done “yesterday”. This will not only improve the rate at which
information is impounded in bond price but also ease order processing and also reduce
the cost of trading. Trading online should also be facilitated to improve operations at the
bond market.

23
Information Dissemination
Most of the Kenyan populace does not understand the operations of the stock market, let
alone the bond market. It is the recommendation of this study that a deliberate campaign
be set in motion to sensitize the public about the benefits of investing generally in the
stock market and specifically in the bond market.
Reduction of the Minimum amount for investment in bonds
Retailing in bonds is an expensive undertaking that is out of reach to most potential
investors. To invest in Treasury bonds for instance, one requires at least Kshs. 50,000 and
this increases in multiples of Kshs. 50,000 for the investor interested in investing more.
The minimum amount should therefore be reduced to an “affordable” level if the
objective of improving market performance is to be met.

24
References
Acharya, Viral V., and Pedersen L. H., (2004), “Asset Pricing with Liquidity Risk,” Journal of Financial Economics, Forthcoming.
Amihud, Y., and Mendelson H. (1986). “Asset Pricing and the Bid-Ask spread”, Journal of Financial Economics, 17, pp.223-49.
Amihud, Y., and Mendelson H., (1991), “Volatility, Efficiency, and Trading: Evidence From the Japanese Stock Market”, Journal of Finance, 46, 5, pp.1765-1789.
Bagehot, W., pseud. For Treynor J., (1971). "The Only Game in Town", Financial Analysts Journal, 27 (Mar/Apr), pp. 12-17.
Bloomfield, R., and O’Hara M., (1999): “Market Transparency: Who Wins and Who Loses?”, Review of Financial Studies 6, pp.375–404.
Brennan, M., and Subrahmanyam A., (1996), “Market Microstructure and Asset Pricing On the Compensation for Illiquidity in Stock Returns”, Journal of Financial Economics 41, pp. 441-464.
Central Bank of Kenya Prospectus on Investment in Government Securities.
Chordia, T., Roll R., and Subrahmanyam A., (2000), “Commonality in Liquidity”, Journal of Financial Economics 56, pp.3-28.
Clark, P.K., (1973), “ A subordinated Stochastic Process Model with Finite Variance for Speculative Prices”, Econometrica, 41, pp.1149-1168.
Datar, V., Naik N., and Robert R. (1998), “Liquidity and stock Returns: An alternative test,” Journal of Financial Intermediation, pp.203-219.
Daves, Philip R., and Erhardt M., C. (1993), “Liquidity, Reconstitution, and the Value of U.S. Treasury Strips,” Journal of Finance 48(1), pp.315-329.
Demsetz, H., (1968). "The Cost of Trading", Quarterly Journal of Economics, 82, pp. 33-53.
Domowitz, I., (2001), “Liquidity, Transaction costs and Reintermediation in Electronic Markets”, paper presented at Bank of Canada conference on financial market structure and dynamics, November, Ottawa.
Eleswarapu, V., (1997), “Cost of Transacting and Expected Returns in the Nasdaq Market,” Journal of Finance 52, pp.2113-2128.
Emerging Markets Committee of the International Organization of Securities Commissions, (May 2002). “The Development of Corporate Bond Markets In Emerging Market Countries”.
Epps, T., and Epps M., (1976), “The Stochastic Dependence of Security Price Changes and Transaction Volumes: Implications for the Mixture of Distributions hypothesis”, Econometrica, 44, pp.305-321.
Fama, E., (1991). "Efficient Capital Markets II", Journal of Finance, 46, pp. 1575-1617.

25
Glosten, L., and Milgrom P., (1985). "Bid, Ask, and Transactions Prices in a Specialist Market with Heterogeneously Informed Traders", Journal of Financial Economics, 14, pp. 71-100.
Gravelle, T., (2001). “The Market Microstructure of Dealership Equity and Government Markets,” paper presented at Bank of Canada conference on financial structure and dynamics, November, Ottawa.
Grossman, S., and Stiglitz J., (1980). "On the Impossibility of Informationally Efficient Markets", American Economic Review, 70, pp. 393-408.
Hasbrouck, J., and Seppi D., (2001), “Common Factors in Prices, Order Flows, and Liquidity”, Journal of Financial Economics 59, pp.383-411.
Ho, T., and Hans S., (1981). "Optimal Dealer Pricing Under Transactions and Return Uncertainty", Journal of Financial Economics, 9, pp. 47-73.
Kamara, A., (1994), “Liquidity, Taxes, and Short-term Treasury Yields,” Journal of Financial and Quantitative Analysis 29(3), pp.403-417.
Karpoff, J. M. (1987), “The Relation Between Price Changes and Trading Volume; a Survey”, Journal of Financial and Quantitative Analysis 22, pp.109-126.
Krishnamurthy, Arvind (2000), “The Bond/Old-Bond Spread,” North-Western University Working Paper.
Kyle, A., (1985). "Continuous Auctions and Insider Trading", Econometrica, 53, pp. 1315-1335.
Lamoureux, C., and Lastrapes, W., (1990) “Heteroskedasticity in Stock Return Data: Volume Versus GARCH Effects,” Journal of Finance, 45: pp.221-229.
Leach, C., Madhavan, A., (1993). “Price Experimentation and Security Market Structure”, Review of Financial Studies, 6, 375-404.
Madhavan, A., and Porter, D., (2001). “Should Securities Markets be Transparent?” paper presented at presented at Bank of Canada conference on financial market structure and dynamics, November, Ottawa.
Nairobi Stock Exchange Handouts on Bonds’ Trading and Settlement Rules and Investor Education Prospectuses.
Pagano, M., and Ernst-Ludwig T., (2004), “The European Bond Markets under EMU,” Oxford Review of Economic Policy 20(4), pp.531-554.
Sharpe, W., (1964). "Capital Asset Prices: A Theory of Market Equilibrium Under Conditions of Risk", Journal of Finance, 19, pp. 425-442.
Tauchen, G. E., and Pitts M., (1983), “The Price Variability-Volume Relationship on Speculative Markets,” Econometrica, 51, pp.485-505.
Vayanos, D., (2004), “Flight to Quality, Flight to Liquidity, and the Pricing of Risk,” NBER Working Paper No. W10327.
Warga, A., (1992), “Bond Return, Liquidity, and Missing Data,” Journal of Financial and Quantitative Analysis 27, 605-617.

26
Fig.1 Monthly Liquidity Levels
0
1
2
3
4
5
6
7
Jan Feb Mar Apr May Jun Jul Aug Sept Oct Nov Dec
Month
Tu
rno
ver
Val
ue
(Ksh
. Bill
ion
s)
2000 2001 2002 2003 2004

27
Fig. 2 Total Government and Corporate bond liquidity in Kenya (%)
96%
4%
Govt. Corporate

28
Fig. 3 Relationship between average number of deals, APD and Turnover value across 2000-2005
0
20
40
60
80
100
120
140
Janu
ary
Febru
ary
Mar
chApr
ilM
ayJu
ne July
Augus
t
Septe
mbe
r
Octobe
r
Novem
ber
Decem
ber
Month
Ave
rage
No.
of D
eals
, AP
D
0
500
1,000
1,500
2,000
2,500
3,000
3,500
Tur
nove
r V
alue
Deals
APD
Value

29
Fig. 4 Average Dispersion as Measured By High,Low and Closing Price Across 2000-2004
99
100
101
102
103
104
105
106
107
108
Jan Feb Mar Apr May Jun July Aug Sep Oct Nov Dec
Month
Pric
e (%
)
High Low Close

30
Fig.5 The relationship between the high and low prices and the dispersion
90
95
100
105
110
115
120
125
130
Jan-
00
Apr-0
0
Jul-0
0
Oct-00
Jan-
01
Apr-0
1
Jul-0
1
Oct-01
Jan-
02
Apr-0
2
Jul-0
2
Oct-02
Jan-
03
Apr-0
3
Jul-0
3
Oct-03
Jan-
04
Apr-0
4
Jul-0
4
Oct-04
Time of the year
Pri
ces
-5
0
5
10
15
20
Dis
per
sio
n
High Low DSP

31
-0.6
-0.4
-0.2
0.0
0.2
0.4
0.6
Volatility
1 2 3 4 5 6 7
Tenor(s)
Fig. 6 Volatility for Govt. Bond Returns by Maturity and Across the Years 2000 – 2004.

32
0.00
0.05
0.10
0.15
0.20
Volatility
1 2 3 4 5 6 7 8 Tenor(s)
Fig. 7 Magnitude of volatility for Govt. Bond Returns by Maturity for the Years 2000-2004.

33
-3
-2
-1
0
1
2
3
Volatility
1 2 3 4 5 6
Tenor(s)
Fig. 8 Volatility for Govt. Bond Yield Returns by Maturity and Across the Years 2000-2004.

34
0
1
2
3
4
5
Volatility
1 2 3 4 5 6 Tenor(s)
Fig. 9 Magnitude of Volatility of Govt. Bond Yield by Maturity for the Years 2000-2004
35
-0.12
-0.08
-0.04
0.00
0.04
0.08
Volatility
3 5 4 Tenor(s)
Fig. 10 Direction of volatility for Corporate bond Capital gain /loss by Tenor for Years 2000-2004

36
0.000
0.002
0.004
0.006
0.008
Volatility
Tenor(s) 3 4 5
Fig. 11 Magnitude of corporate gain /loss volatility by Tenor for the years 2000-2004

37
-1.5
-1.0
-0.5
0.0
0.5
1.0
1.5
Volatility
3 4 5
Fig. 12 Direction of Volatility for Corporate bond Yield by Tenor for the Years 2000-2004
Tenor(s)

38
0.0
0.5
1.0
1.5
2.0
2.5
Volatility
3 4 5 Tenor(s)
Fig. 13 Magnitude of Volatility for Corporate bond Yield by Tenor for 2000-2004

39
Table 1. The value (in Kshs. billions) of the Kenyan bond market (1996-2003) Year 1996 1997 1998 1999 2000 2001 2002 2003
Government 0.0 10.6 37.8 28.4 34.1 80.3 130.5 178.4
Corporate 0.82 0.54 0.27 1.05 1.1 6.8 8.55 7.65
Total 0.82 11.14 38.07 29.45 35.2 87.1 139.05 186.05
Source: Nairobi Stock Exchange files.

40
Table 2. The composition of Treasury bonds in Kenya’s total domestic debt (June 2000-June 2004). June 2000 June 2001 June 2002 June 2003 June 2004
Shs. bn
% Shs. bn
% Shs. bn
% Shs. bn
% Shs. bn
%
A. Government securities Of which, Treasury Bills* Treasury bonds Government stock Non-interest bearing debt B. Others**
190.9 114.1 36.9 3.0 36.9 15.2
92.6 55.4 17.9 1.5 17.9 7.4
199.3 116.4 44.5 1.5 36.9 12.5
94.1 55.0 21.0 0.7 17.4 5.9
226.8 82.1 106.3 1.5 36.9 9.2
96.1 34.8 45.0 0.6 15.6 3.9
278.2 78.7 161.5 1.1 36.9 11.1
96.2 36.5 55.8 0.4 3.5 3.8
289.5 62.9 188.6 1.1 36.9 16.7
94.5 32.6 61.6 0.4 2.4 5.5
Total Domestic Debt (A+B) 206.1 100.0 211.8 100.0 236.0 100.0 289.3 100.0 306.2 100.0
Source: CBK monthly economic reviews, relevant months. *Excluding Treasury bill REPOs; *Others include; overdrafts, items in transit, commercial banks advances and tax reserve certificates.

41
Table 3. Outstanding stock of Treasury bonds by holder in Kshs. Billions.
June 2000 June 2001 June 2002 June 2003 June 2004
Shs. bn % Shs. bn % Shs. bn % Shs. bn % Shs. bn %
Banking institutions Of which, Central bank Commercial banks NBFIs Insurance companies Parastatals Building Societies Others
9.1 0.0 9.1 0.5 0.0 2.4 0.0 25.4
24.7 0.0 24.7 1.4 0.0 6.5 0.0 68.8
12.5 0.0 12.5 0.6 9.9 2.5 0.1 18.9
28.1 0.0 28.1 1.3 22.2 5.6 0.2 42.5
45.8 0.0 45.8 1.1 15.6 4.4 1.6 37.9
43.1 0.0 43.1 1.0 14.7 4.1 1.5 35.6
74.5 0.0 74.5 2.1 21.5 7.3 2.1 54
46.1 0.0 46.1 1.3 13.3 4.5 1.3 33.4
84.4 0.0 84.4 2.1 26.1 16.6 2.7 56.8
44.7 0.0 44.7 1.1 13.8 8.8 1.4 30.1
36.9 100.0 44.5 100.0 106.4 100.0 161.5 100.0 188.62 100.0 Source: CBK monthly economic reviews, relevant months.

42
Table 4. Outstanding stock of corporate bonds by holder in (%)
Corporate bondholding as at Dec 31, 2001 in (%) Issuer Banks Ins. Com. F/ man. Inv. Co Individuals Shelter Afrique 23.10 15.90 0.00 61.00 0.00 *E.A.D.B 59.60 14.70 0.00 25.20 0.50 *E.A.D.B 19.10 26.40 8.60 44.10 1.80 Safaricom 58.00 4.00 31.00 3.50 0.50
Corporate bondholding as at Dec 31, 2002 in (%) Issuer Banks Ins. Com. F/ man. Inv. Co. Individuals Shelter Afrique 19.14 10.86 0.00 70.00 0.00 *E.A.D.B 46.40 6.05 5.00 40.25 2.30 *E.A.D.B 41.17 25.33 0.00 31.58 1.92 Safaricom 43.85 2.80 27.35 25.60 0.40
Corporate bondholding as at Dec 31, 2003 in (%) Issuer Banks Ins. Com. F/ man. Inv. Com. Individuals Shelter Afrique 16.50 9.00 74.50 0.00 0.00 E.A.D.B 21.50 11.05 42.95 24.50 0.00 MRM 36.42 3.00 59.95 0.63 0.00 Safaricom 45.48 2.78 51.13 0.25 0.37
Corporate bondholding as at Dec 31, 2004 in (%) Issuer Banks Ins. Com. F/ man. Inv. Com. Individuals *E.A.D.B 46.00 11.05 42.95 0.00 0.00 MRM 36.42 3.00 59.95 0.63 0.00 Safaricom 45.48 2.78 50.88 0.50 0.38 *E.A.D.B 36.25 17.50 46.25 0.00 0.00 Source: CMA annual reports and files * Issued in two tranches, Ins. Com. – Insurance companies, F/man – Fund managers, Inv. Com - Investment companies.

43
Table 5. The value of Bonds, T/bills and Commercial paper as a % of GDP.
Treasury bonds
Year Face Value (Kshs mn.)
Amount Raised (Kshs mn.)
Subscription Level (%)
GDP (Kshs mn.)
Amount Raised as a % of GDP
1997 15,000 15,000 100.00 623,235 2.40
1998 29,000 28,519 98.34 694,028 4.10
1999 29,415 24,716 84.02 743,478 3.32
2000 47,886 28,583 59.69 799,244 3.58
2001 78,866 69,795 88.50 878,730 7.94
2002 85,285 94,098 110.33 962,866 9.77
2003 95,928 94,535 98.55 1,091,640 8.66
2004 80,500 66,091 90.41 1,223,226** 5.40
Total 461,882 421,341 91.22
5,793,221
7.27 Treasury bills
Year Face Value (Kshs mn.)
Amount Raised (Kshs mn.)
Subscription Level (%)
GDP (Kshs mn.)
Amount Raised as a % of GDP
1997 414,000 357,700 86 623,235 57.59
1998 351,000 382,216 108.89 694,028 55.07
1999 396,700 370,892 106.96 743,478 49.89
2000 415,800 372,160 89.5 799,244 46.56
2001 432,500 386,332 89.32 878,730 43.96
2002 298,000 367,466 123.31 962,866 38.16
2003 246,600 382,181 154.98 1,091,640 35.00
2004 223,500 258,255 115.55 1,223,226** 21.11
Total
2,778,100
2,877,202 -
5,793,221
-
Corporate bonds
Issuer Date of Approval
Date of Maturity
Amount Raised (Kshs mn.)
Subscription Level (%)
GDP
Amount Raised as a % of GDP
E.A.D.B Nov-96 Nov-99 800 100 528,739 0.15
E.A.D.B Nov-99 Nov-02 1,200 100 743,478 0.16
*Shelter Afrique
Nov-00 Jul-01
Nov-03 Jul-04
150 200
137.33 76.50
799,244 878,730
0.018 0.022
E.A.D.B
Jun -04 Mar-01
Jul-06 Apr-06
1,500 2,000
- 100
1,223,226 878,730
0.12 0.22
*MRM Sep-02 Sep-06 1,000 112 962,866 0.10 *Safaricom May-01 Sep-05 4,000 100 878,730 0.45
Total approved - - 10,850 - - -

44
Source: T/bond, C/bond, Commercial paper figures from CMA reports and files; T/bill figures from CBK periodical reviews, GDP values are in nominal figures, * means issued in two tranches, ** means provisional. Source: CMA annual reports and files
Commercial paper Year No of issues Face Value
(Kshs. mn) GDP (Ksh. mn). As a % of GDP
1997 1 500 623,235 0.08 1998 1 100 694,028 0.01 1999 14 8,650 743,478 1.16 2000 3 400 799,244 0.05 2001 2 700 878,730 0.07 2002 1 1,000 962,866 0.10 2003 1 200 1,091,640 0.018 2004 2 300 1,223,226** 0.024 Total
25
11,850
5,793,221
-

45
Table 6. Summary Statistics of Observations influencing Liquidity
Mean Median Max Min Std. Dev. Skew Kurtosis J-B Prob.
Prices and yields Corporate Bonds Bond Price 102.33 101.74 109.2 99.08 2.27 0.88 3.66 5.07 0.08 Capital gain/loss -0.0022 7.66E-05 0.0589 -0.088 0.031 -0.804 4.22 5.76 0.00 Current yield 10.61 10.66 19.58 2.97 2.65 0.48 6.62 19.91 0.00 Treasury Bonds Bond Price 104.75 102.3 148.5 65 9.13 1.61 7.15 1,451.6 0.00 Capital gain/loss -0.0004 0.0002 0.4 -0.43 0.09 -0.14 6.5 644.81 0.00 Current yield 11.09 11.78 19 1.47 2.94 -1.12 4.39 320.85 0.00
Liquidity measures C/bonds turnover 55.52 21 381 0.000077 86.1 2.28 7.67 80.23 0.00 T/ bonds turnover 91.65 10.98 1,800 0.005 170 3.36 19.38 16,686 0.00 Deals* 73.00 71.00 172.00 18.00 36.72 0.35 2.44 1.61 0.37 Value per deal* 26.38 30.15 55.60 0.01 15.05 0.01 2.14 1.84 0.40
Capital gain/loss volatility Corporate bonds Standard deviation 5.88E-11 0.003 0.066 -0.088 0.031 -0.71 4.30 5.23 0.073 Variance 0.0009 0.0002 0.0073 0.00 0.0017 2.33 7.95 61.65 0.00
Treasury bonds Standard deviation -7.99E-05 0.0004 0.4 -0.429 0.095 -0.12 6.49 643.24 0.00 Variance 0.009 0.0093 0.1847 5.28E-10 0.021 3.75 21 19,893.9 0.00
Current yield volatility Corporate bonds
Std deviation 2.44E-11 0.00498 1.421 -1.29 0.479 0.312 6.29 19.17 0.00 Variance 0.225 0.009 2.02 0.00 0.52 2.26 6.65 57.58 0.00
Treasury bonds Std deviation 1.93E-05 0.003 2.213 -1.999 0.442 0.576 9.91 2210.5 0.00 Variance 0.195 0.0056 4.528 6.30E-08 0.583 4.68 27.11 30,170 0.00 Note: The bonds’ traded value is in terms of Millions of Kenya Shillings, *Total number of deals struck and average value per deal is for both Corporate and Treasury bonds combined.

46
Table 7. Total bond traded values (Kshs. Millions) across maturities
2000 2001 2002 2003 2004
Total for the period
Corporate bonds in Kshs Millions
3-year 173.37 71.00 30.25 33.2 0.50 308.32
4-year 708.30 770.90 5.5 1,484.7
5-year 20.00 612.20 65.2 2.91 700.31
7-year 11.00 11.00
Treasury bonds in Kshs Millions
1-year 1,900 5,400 6,780 1,160 400 15,640
1.5-year 0.2 848 5.2 853.4
2-year 2,300 4, 130 7,050 13,410 6,870 29,630
3-year 1,030 3,080 7,450 12,880 6,140 30,570
4-year 1,470 2,740 4,960 9,170
5-year 3 477 3,820 6,320 10,620
6-year 800 158 3,670 2,260 6,888
7-year 1,070 2,530 3,600
8-year 2,170 1,500 3,670
9-year 670 1,500 2,170
10-year 1,200 1,200
Source: CBK and CMA bond market reviews

47
Table 8. Average Value Per Deal of Bonds in Kenya in Kshs. Millions (2000-2004)
Month 2000 2001 2002 2003
Value Deals APD Value Deals APD Value Deals APD Value Deals APD Value Deals APD
January 770 85 9.06 140 27 5.52 3,710 112 33.1 3,800 98 38.8 4,580 97 47.2
February 130 62 2.09 150 28 0.54 1,920 48 39.9 3,180 93 34.2 4,990 99 50.4
March 610 33 18.5 180 28 6.46 2,110 41 51.6 2,830 76 37.2 3,620 112 32.3
April 160 22 7.27 1,240 84 14.8 2,740 57 48.1 2,720 91 29.9 2,140 95 22.5
May 110 38 2.89 210 18 12 1,560 52 30.1 2,150 71 30.2 3,180 97 32.7
June 370 21 17.62 130 28 4.96 3,040 60 50.6 2,720 111 24.5 5,340 172 31
July 750 83 9.04 1,100 60 18.4 3,500 63 55.6 2,420 111 21.8 2,400 68 35.2
August 1,350 93 14.5 4,480 136 32.9 3,530 116 30.5 5,320 149 35.7 840 82 10.3
September 620 39 16 1,980 63 31.4 4,100 123 33.3 3,550 88 40.3 1,440 102 14.1
October 550 30 15.9 1,710 54 31.6 2,630 100 26.3 6,540 128 51.1 2,250 41 29
November 170 35 4.86 2,160 71 30.5 4,080 130 31.3 3,030 76 39.9 2,110 72 55
December 270 25 10.08 700 20 35 1,300 51 25.5 3,680 120 31.7 1,210 39 0.01
Average 488 47 10.65 1,181 51 18.67 2,851 79 37.99 3,495 101 34.60 2,842 90 29.97
Total 5,860 566 10.35 14,180 617 23 34,220 953 36 41,940 1,212 35 34,100 1,076 32
Value – Refers to the Bond turnover value in millions of Kenya Shillings; APD – Average value Per Deal in millions of Kenya Shillings.
Source: Computed from NSE monthly bulletins and Stock market files.

48
Table 9. Average Price, Current Yield and Return for Government and Corporate bonds.
2000 2001 2002 2003 2004
Tenor P00 Y00 R00 P01 Y01 R01 P02 Y02 R02 P03 Y03 R03 P04 Y04 R04
% % % % % % % % % % % % % % %
Corporate Bonds
3 103.7 12.90 .0058 104.9 11.5 -0.011 101.2 11.35 -.0424 102.07 5.6 0.0178 103.37 2.25
4 100.8 12.12 -.0223 102.65 9.27 -.0024 100.26 2.22
5 100.4 12.92 0.025 100.65 9.18 -.0029 100.57 5.8 -.00067 100.30 8.76 2.03E-03
7 100.64 7.50 0.007
Treasury bonds
1 101.3 12.0 -.0005 100.6 12.7 102.6 10.9 0.0007 101.6 11.3 0.0001 98.5 3.8 0.0041
1.5 102.0 11.3 102.9 14.2 105.0 13.8
2 101.3 12.1 -.0002 103.2 13.0 0.0006 103.3 11.3 -.0003 104.0 11.6 -.000235 101.5 8.2 0.0001
3 101.3 11.5 -.0001 99.3 13.2 0.0006 102.1 10.9 0.0002 105.7 10.0 -0.0000 101.7 10.0 -.0001
4 102.5 11.1 0.0033 106.5 10.7 -0.0009 105.2 13.0 -.0030
5 100.3 11.4 -.0201 111.9 11.4 0.0052 109.6 11.2 0.0011
6 101.9 11.8 102.0 10.6 -.0005 116.6 11.4 -0.0030 108.7 10.2 -.0072
7 115.0 12.0 -0.0099 103.5 10.19 -.0152
8 118.4 10.9 -0.0041 108.9 8.7 0.0036
9 123.8 10.3 -0.0287 110.6 10.9
10 115.5 10.4 -0.0127
Note: In a case of a mean price and average yield reporting with no corresponding return, it means there was only one observation for that tenor and return could therefore not be calculated.

49
Table 10. Number of Days of Trading for Kenya’s Corporate and Government Bonds (2000-2004) 2000 2001 2002 2003 2004
Days
Traded
Ideal
Total
Days
Traded
Ideal
Total
Days
Traded
Ideal
Total
Days
Traded
Ideal
Total
Days
Traded
Ideal
Total
T.B C.B T.B. C.B T.B C.B T.B C.B T.B C.B
January 18 2 21 10 0 23 18 3 22 20 1 21 19 1 22
February 13 1 21 11 0 20 18 3 20 19 2 20 18 0 20
March 14 0 23 8 0 22 15 1 20 19 0 20 21 0 23
April 13 0 18 12 0 19 19 3 21 20 1 21 19 0 20
May 16 0 22 9 3 19 17 1 23 20 1 21 20 0 21
June 15 1 18 9 0 21 17 1 20 19 0 21 19 0 22
July 15 1 21 15 0 22 16 4 23 19 0 23 21 1 22
August 19 0 23 16 0 23 17 2 22 20 1 21 20 1 22
September 11 0 21 14 1 20 21 3 21 20 0 22 21 1 22
October 10 1 20 15 5 22 20 2 22 21 0 22 15 0 21
November 16 0 20 21 5 22 19 3 21 18 0 19 19 0 21
December 7 1 17 7 2 18 13 1 18 19 1 20 13 1 23
Total 167 7 245 147 16 251 210 25 253 234 6 251 225 5 259
Day 2 (%) 68.2 2.0 58.6 6.4 83.0 9.9 93.2 2.4 86.9 1.2
% of Total 96 4 90 10 89 11 97 3 98 2
C.B – Corporate bonds; T.B – Treasury bonds

50
Table 11(a). The average Close/High price dispersion for 2000-2004
2000 2001 2002 2003 2004 High
% Close %
DSP %
High %
Close %
DSP %
High %
Close %
DSP %
High %
Close %
DSP %
High %
Close %
DSP %
Jan 104.23 103.62 0.61 100.77 100.76 0.01 100.97 100.54 0.43 104.55 104.16 0.39 110.66 109.03 1.63
Feb 109.33 97.09 12.24 101.00 100.73 0.27 102.96 100.90 2.06 104.48 104.32 0.16 108.45 106.44 2.01
Mar 102.51 98.26 4.25 102.34 100.63 1.71 102.84 101.01 1.83 101.86 101.11 0.75 108.66 105.67 2.99
Apr 101.91 101.9 0.01 100.85 100.44 0.41 103.13 101.03 2.1 109.15 107.27 1.88 112.21 109.31 2.9
May 103.74 102.5 1.24 100.67 99.99 0.68 100.67 99.99 0.68 107.57 105.83 1.74 103.39 101.3 2.09
Jun 103.65 102.72 0.93 99.77 99.88 -0.1 104.5 101.49 3.01 109.05 107.38 1.67 111.9 109.79 2.11
Jul 99.57 98.6 0.97 99.74 99.71 0.03 103.74 101.55 2.19 124.09 121.47 2.62 108.07 105.81 2.26
Aug 99.76 99.21 0.55 100.95 99.77 1.18 103.9 101.83 2.07 115.36 113.35 2.01 108.39 107.28 1.11
Sep 100.95 101.29 -0.34 100.25 99.72 0.53 104.05 102.17 1.88 119.3 112.97 6.33 108.76 106.47 2.29
Oct 101.85 100.39 1.46 101.51 99.98 1.53 103.08 101.89 1.19 116.8 112.1 4.7 104.5 98.28 6.22
Nov 101.96 99.07 2.89 102.68 100.62 2.06 103.2 102.19 1.01 111.3 109.13 2.17 101.99 100.2 1.79
Dec 99.83 100.91 -1.08 102.33 100.81 1.52 103.32 102.31 1.01 110.07 107.89 2.18 102.88 101.67 1.21
Mean 1.98 0.82 1.62 2.22 2.38
DSP – The Highest price-Closing price dispersion

51
Table 11(b). The average Close/Low price dispersion for 2000-2004
2000 2001 2002 2003 2004
Close %
Low %
DSP
% Close %
Low %
DSP %
Close %
Low %
DSP %
Close %
Low %
DSP %
Close %
Low %
DSP %
Jan 103.62 102.12 1.5 100.76 99.45 1.31 100.54 99.73 0.81 104.16 102.54 1.62 109.03 106.78 2.25 Feb 97.09 100.69 -3.6 100.73 97.41 3.32 100.90 102.41 -1.51 104.32 101.74 2.58 106.44 104.86 1.58 Mar 98.26 101.85 -3.59 100.63 101.62 -0.99 101.01 102.47 -1.46 101.11 99.62 1.49 105.67 101.87 3.8 Apr 101.9 100.66 1.24 100.44 99.42 1.02 101.03 101.52 -0.49 107.27 104.97 2.3 109.31 106.65 2.66 May 102.5 101.97 0.53 99.99 100.22 -0.23 99.99 101.97 -1.98 105.83 104.29 1.54 101.3 100.01 1.29 Jun 102.72 102.84 -0.12 99.88 99.42 0.46 101.49 103.13 -1.64 107.38 104.47 2.91 109.79 111.73 -1.94 Jul 98.6 98.00 0.6 99.71 98.79 0.92 101.55 101.82 -0.27 121.47 106.73 14.74 105.81 105.81 0 Aug 99.21 97.03 2.18 99.77 99.58 0.19 101.83 102.30 -0.47 113.35 107.96 5.39 107.28 105.45 1.83 Sep 101.29 98.89 2.4 99.72 99.36 0.36 102.37 102.17 0.20 112.97 109.93 3.04 106.47 105.11 1.36 Oct 100.39 92.49 7.9 99.98 100.49 -0.51 101.89 101.74 0.15 112.1 107.30 4.8 98.28 102.11 -3.83 Nov 99.07 99.07 0 100.62 102.08 -1.46 102.19 94.47 7.72 109.13 107.44 1.69 100.2 97.77 2.43 Dec 100.91 99.40 1.51 100.81 102.07 -1.26 102.31 100.78 1.53 107.89 105.30 2.59 101.67 101.22 0.45 Mean 0.87 0.26 0.21 3.72 0.99

52
Table 12. The average High/Low price dispersion for Treasury bonds 2000-2004
2000 2001 2002 2003 2004
High %
Low %
DSP %
High %
Low %
DSP %
High %
Low %
DSP %
High %
Low %
DSP %
High %
Low %
DSP %
Jan 104.23 102.12 2.11 100.77 99.45 1.32 100.97 99.73 1.24 104.55 102.54 2.01 110.66 106.78 3.88
Feb 109.33 100.69 8.64 101 97.41 3.59 102.96 102.41 0.55 104.48 101.74 2.74 108.45 104.86 3.59
Mar 102.51 101.85 0.66 102.34 101.62 0.72 102.84 102.47 0.37 101.86 99.62 2.24 108.66 101.87 6.79
Apr 101.91 100.66 1.25 100.85 99.42 1.43 103.13 101.52 1.61 109.15 104.97 4.18 112.21 106.65 5.56
May 103.74 101.97 1.77 100.67 100.22 0.45 100.67 101.97 -1.3 107.57 104.29 3.28 103.39 100.01 3.38
Jun 103.65 102.84 0.81 99.77 99.42 0.35 104.5 103.13 1.37 109.05 104.47 4.58 111.9 111.73 0.17
Jul 99.57 98.00 1.57 99.74 98.79 0.95 103.74 101.82 1.92 124.09 106.73 17.36 108.07 105.81 2.26
Aug 99.76 97.03 2.73 100.95 99.58 1.37 103.9 102.30 1.6 115.36 107.96 7.4 108.39 105.45 2.94
Sep 100.95 98.89 2.06 100.25 99.36 0.89 104.05 102.37 1.68 119.3 109.93 9.37 108.76 105.11 3.65
Oct 101.85 92.49 9.36 101.51 100.49 1.02 103.08 101.74 1.34 116.8 107.30 9.5 104.5 102.11 2.39
Nov 101.96 99.07 2.89 102.68 102.08 0 .6 103.2 94.47 8.73 111.3 107.44 3.86 101.99 97.77 4.22
Dec 99.83 99.40 0.43 102.33 102.07 0.26 103.32 100.78 2.54 110.07 105.30 4.77 102.88 101.22 1.66
Mean 2.85 1.08 1.80 5.94 3.37