Embed Size (px)
Citation preview

MICROSTRUCTURE AND PHASE BEHAVIOR IN
COLLOIDS AND LIQUID CRYSTALS
Matthew Alan Lohr
A DISSERTATION
in
Physics and Astronomy
Presented to the Faculties of the University of Pennsylvania
in
Partial Fulfillment of the Requirements for the Degree of Doctor of Philosophy
2014
Arjun G. Yodh, Professor of Physics and Astronomy
Supervisor of Dissertation
Randall D. Kamien, Professor of Physics and Astronomy
Graduate Group Chairperson
Dissertation Committee
Randall D. Kamien, Professor of Physics and Astronomy
Peter J. Collings, Adjunct Professor of Physics and Astronomy
Kathleen J. Stebe, Professor of Chemical and Biomolecular Engineering
Gary M. Bernstein, Professor of Physics and Astronomy

Dedication
Dedicated to my wife, Melissa.
Thank you for our life together.
ii

Acknowledgements
This work wouldn’t exist without the constant support of many people over many years.
My wife, Melissa, has been extremely important in keeping me sane, fed, groomed and
grounded throughout my graduate studies. When I was writing my undergraduate thesis, she
walked into my room and noticed I had been so distracted by writing that I had let a bottle of
detergent spill into the middle of the floor. My functionality during the writing ofthis thesis
dissertation is largely due to her. More importantly, she makes me happier than I could ever
imagine.
My advisor, Prof. Arjun Yodh, has been a great mentor who has been very supportive when
I became frustrated with my research. During my graduate school visits, I asked every professor
I met what they thought the worst thing about their department was. Many had clever and cir-
cuitous answers (“We don’t have enough graduate students!”). Arjun was the only one who gave
me a straightforward answer of, “What? No, there’s nothing wrong with Penn. You should just
come here.” I have since learned such frankness is an important part of being a good communi-
cator, and I hope that his sincere, direct, patient and good-natured advice has molded me into a
better scientist.
My family, currently spread across the country and globe, has been a constant source of
love and support throughout my life and academic career. My parents, beyond being extremely
supportive through my young and adult life, have always been thoughtful about my gifts and
values, pushing me towards a fulfilling career while always encouraging my interests (be they
science, music, theater, or beer). Though I love all my siblings equally, I have to give a special
shout-out in this thesis to my brother Mike, a fellow scientist who has constantly encouraged
iii

me to challenge my intellectual limits and, to quote Mr. Edward Abbey, “Subvert the Dominant
Paradigm.”
The Yodh Soft Matter Group is full of awesome people who also happen to be great scien-
tists. To my fellow graduate students, Dan Chen, Oni Basu, Peter Yunker, (Matt) Gratale, Zoey
Davidson, and Wei-Shao Wei; to our postdocs, Zexin Zhang, Ke Chen, Tim Still, Ye Xu, and
Joonwoo Jeong; and to our academic collaborators, Prof. Kevin Aptowicz and Prof. Piotr Hab-
das: you all have made this group a fun place to pursue one’s Ph. D, and I owe almost everything
I learned in graduate school to the lot of you. I could not have hoped for a better group of people
to work with over these years, and I hope to continue collaborating with all of you in the future.
Beyond my immediate group, I have had some great collaborators in and around Penn, with-
out whom my work would be boring and incomplete. To Ahmed Alsayed, Marcello Cavarello,
Mohammed Gharbi, Prof. Kathleen Stebe and Prof. Peter Collings, thank you for all your work
sharing your experimental expertise and valuable insight into sometimes mysterious and tem-
peramental materials. To Bryan Chen, Prof. Randall Kamien, Daniel Beller, Carl Goodrich,
and Daniel Sussman, thank you for performing complex derivations and simulations to support
my results, for taking the time to patiently explain finer points of various theories, and, most
importantly, for sharing your scotch with me.
Speaking of Penn, I have to give credit to the Penn Physics department. Ever since I first
visited Penn back when I was deciding where to go for graduate school, it was clear to me that
this was a department full of well-rounded and interesting people. I am proud to have been a
part of it, and I’m glad for all of the friends I’ve made there. Also, I have to thank the staff of the
LRSM for making it a welcoming building to visit every day.
iv

I never could have imagined that a close-knit group of open, friendly, passionate people
would be interested in the same squishy things I thought were cool. So I have to thank the soft
matter community at large. Though I will be stepping into a career in industry research and
development, I hope to stay in touch, and can’t wait to see the great new work you all produce
on self-assembly, phase behavior, and nonlinear phenomena.
I am extremely grateful for the opportunities I have had to pursue undergraduate research,
so I have to thank Prof. Peter Schiffer, Prof. Daniel Lathrop, Prof. Diane Henderson, Dr.
Charles Doumalin, and Dr. Masafumi Fukuto, as well as the NSF’s REU program, for getting
me involved in interesting research early on. I still draw on things I learned from your labs to
this very day.
I finally have to thank the city of Philadelphia for being an interesting and affordable place
to live, and the perfect place for a budding scientist to spend formative years. Also, need to
thank my cat Leela (a native of University City, found crouched under a car outside DRL by my
friends and colleagues Peter Yunker and Erin Buckley) for being the sweetest pet any man could
ask for, and comforting me during the more strenuous periods of my graduate career.
v

ABSTRACT
MICROSTRUCTURE AND PHASE BEHAVIOR IN COLLOIDS AND
LIQUID CRYSTALS
Matthew Alan Lohr
Arjun G. Yodh
This thesis describes our investigation of microstructure and phase behavior in colloids and
liquid crystals. The first set of experiments explores the phase behavior of helical packings of
thermoresponsive microspheres inside glass capillaries as a function of volume fraction. Sta-
ble helical packings are observed with long-range orientational order. Some of these packings
evolve abruptly to disordered states as the volume fraction is reduced. We quantify these tran-
sitions using correlation functions and susceptibilities of the orientational order parameter, 6.
The emergence of coexisting metastable packings, as well as coexisting ordered and disordered
states, is also observed. These findings support the notion of phase-transition-like behavior in
this class of quasi-one-dimensional systems.
The second set of experiments investigates cross-over behavior from glasses with attrac-
tive interactions to sparse gel-like states. In particular, the vibrational modes of quasi-two-
dimensional disordered colloidal packings of hard colloidal spheres with short-range attractions
are measured as a function of packing fraction. A crossover from glassy to sparse gel-like states
is indicated by an excess of low-frequency phonon modes. This change in vibrational mode
distribution is found to arise from highly localized vibrations that tend to involve individual
vi

and/or small clusters of particles with few local bonds. These mode behaviors and correspond-
ing structural insights may serve as a useful signature for glass-gel transitions in wider classes
of attractive packings.
A third set of experiments explores the director structures of aqueous lyotropic chromonic
liquid crystal (LCLC) films created on square lattice cylindrical-micropost substrates. The struc-
tures are manipulated by modulating the concentration-dependent elastic properties of LCLCs
via drying. Nematic LCLC films exhibit preferred bistable alignment along the diagonals of the
micropost lattice. Columnar LCLC films form two distinct director and defect configurations: a
diagonally aligned director pattern with local squares of defects, and an off-diagonal configura-
tion with zig-zag defects. We suggest that the formation of these patterns is tied to the relative
free energy costs of splay and bend deformations in the precursor nematic films. The observed
nematic and columnar configurations are understood numerically using a Landau-de Gennes free
energy model. This work provides first examples of quasi-2D micropatterning of LC films in the
columnar phase and the first micropatterning of lyotropic LC films in general; the work also
demonstrates alignment and configuration switching of typically difficult-to-align LCLC films
via bulk elastic properties.
vii

Contents
Dedication ii
Acknowledgements iii
Abstract vi
List of Figures xxxii
1 Introduction 1
1.1 Structure and Melting of Helical Packings . . . . . . . . . . . . . . . . . . . . 3
1.2 Vibrational Signatures of Gel-like and Glassy Colloidal Packings . . . . . . . . 6
1.3 Microscopic Ordering of Lyotropic Chromonic Liquid Crystals . . . . . . . . . 9
1.4 Organization of Thesis . . . . . . . . . . . . . . . . . . . . . . . . . . . . . . 12
2 Helical Packings and Phase Transformations of Soft Spheres in Cylinders 13
2.1 Introduction . . . . . . . . . . . . . . . . . . . . . . . . . . . . . . . . . . . . 13
2.2 Contextual and Theoretical Background . . . . . . . . . . . . . . . . . . . . . 15
2.2.1 Helical Packing Structures . . . . . . . . . . . . . . . . . . . . . . . . 15
viii

2.2.2 Transformations of Helical Structures . . . . . . . . . . . . .. . . . . 19
2.2.3 Phase Transitions . . . . . . . . . . . . . . . . . . . . . . . . . . . . . 21
2.2.3.1 Phase Transitions, Long Range Order and Dimensionality . . 22
2.3 Experimental Methods . . . . . . . . . . . . . . . . . . . . . . . . . . . . . . 28
2.3.1 pNIPAm microspheres . . . . . . . . . . . . . . . . . . . . . . . . . . 28
2.3.1.1 pNIPAm Synthesis and Fluorescent Functionalization . . . . 29
2.3.1.2 pNIPAm Particle Diameter Characterization . . . . . . . . . 30
2.3.2 Microtube Geometry and Sample Configuration . . . . . . . . . . . . . 32
2.3.3 Fluorescence Confocal Microscopy . . . . . . . . . . . . . . . . . . . 33
2.3.3.1 Background on Confocal Microscopy . . . . . . . . . . . . . 34
2.3.3.2 Advantages and Disadvantages of TSM and CLSM . . . . . 36
2.4 Results and Analysis . . . . . . . . . . . . . . . . . . . . . . . . . . . . . . . 38
2.4.1 Characterization of 3D Structure . . . . . . . . . . . . . . . . . . . . . 38
2.4.2 Long-Range Orientational Order in Achiral Packings . . . . . . . . . . 43
2.4.3 Theoretical Model for Long-Range Orientational Order in Helical Packings 45
2.4.4 Orientational Order Parameter, Susceptibility, and Evidence of a Phase
Transition in Experiment . . . . . . . . . . . . . . . . . . . . . . . . . 49
2.4.5 Structural Transformations in Chiral Packings . . . . . . . . . . . . . . 53
2.5 Conclusions . . . . . . . . . . . . . . . . . . . . . . . . . . . . . . . . . . . . 54
3 Low-Frequency Modes as a Hallmark of Structural Crossovers in Quasi-2D Dense
Attractive Colloidal Packings 56
3.1 Introduction . . . . . . . . . . . . . . . . . . . . . . . . . . . . . . . . . . . . 56
ix

3.2 Contextual and Theoretical Background . . . . . . . . . . . . . . .. . . . . . 57
3.2.1 Attractive Glasses . . . . . . . . . . . . . . . . . . . . . . . . . . . . 57
3.2.2 Gels . . . . . . . . . . . . . . . . . . . . . . . . . . . . . . . . . . . . 59
3.2.3 Differences between Gels and Attractive Glasses . . . . . . . . . . . . 60
3.2.4 Phonons in Disordered Solids . . . . . . . . . . . . . . . . . . . . . . 61
3.2.4.1 Conventional Low-Frequency Phonon Behavior: The Debye
Model . . . . . . . . . . . . . . . . . . . . . . . . . . . . . 61
3.2.4.2 Low-Frequency Phonons in Disordered Solids . . . . . . . . 62
3.3 Experimental and Analytical Methods . . . . . . . . . . . . . . . . . . . . . . 65
3.3.1 Sample Preparation . . . . . . . . . . . . . . . . . . . . . . . . . . . . 65
3.3.1.1 Issues Forming Quasi-2D Thermal Attractive Monolayers . . 65
3.3.1.2 Novel Monolayer Spreading From Lutidine Wetting . . . . . 67
3.3.1.3 Temperature Stability . . . . . . . . . . . . . . . . . . . . . 69
3.3.1.4 Monolayer Formation . . . . . . . . . . . . . . . . . . . . . 71
3.3.2 vDOS Calculation from Particle Trajectories . . . . . . . . . . . . . . 71
3.3.3 Analytical Considerations for vDOS calculations . . . . . . . . . . . . 74
3.4 Results and Discussion . . . . . . . . . . . . . . . . . . . . . . . . . . . . . . 76
3.4.1 Conventional Structural Characteristics of Attractive Monolayers . . . 76
3.4.2 vDOS Shape as a Signature of Structural Transition . . . . . . . . . . . 80
3.4.2.1 Comparison of vDOS in Dense Packing to Simulations . . . 82
3.4.3 Localization of Low-Frequency Modes . . . . . . . . . . . . . . . . . 85
x

3.4.4 Qualitative Description of Structural Correlations to Localized Low-Frequency
Modes . . . . . . . . . . . . . . . . . . . . . . . . . . . . . . . . . . . 88
3.5 Conclusion . . . . . . . . . . . . . . . . . . . . . . . . . . . . . . . . . . . . 93
4 Elasticity-Dependent Self-assembly of Micro-Templated Chromonic Liquid Crystal
Films 95
4.1 Introduction . . . . . . . . . . . . . . . . . . . . . . . . . . . . . . . . . . . . 95
4.2 Contextual and Theoretical Background . . . . . . . . . . . . . . . . . . . . . 97
4.2.1 Lyotropic Chromonic Liquid Crystals . . . . . . . . . . . . . . . . . . 97
4.2.2 History of Chromonics . . . . . . . . . . . . . . . . . . . . . . . . . . 100
4.2.3 Emerging Applications of LCLCs . . . . . . . . . . . . . . . . . . . . 101
4.2.4 Barriers to Practical Application of LCLCs . . . . . . . . . . . . . . . 103
4.2.5 Elastic Deformations in LCLCs . . . . . . . . . . . . . . . . . . . . . 106
4.2.6 Defects in Columnar LCLCs . . . . . . . . . . . . . . . . . . . . . . . 108
4.3 Experimental and Numerical Methods . . . . . . . . . . . . . . . . . . . . . . 110
4.3.1 Choice of LCLC Suspensions . . . . . . . . . . . . . . . . . . . . . . 111
4.3.2 Synthesis and Loading of Micropost Arrays . . . . . . . . . . . . . . . 113
4.3.3 Polarizing Imaging and Director Field Analysis . . . . . . . . . . . . . 115
4.3.4 Numerical Modeling of Liquid Crystals in Micropost Arrays . . . . . . 121
4.4 Results and Discussion . . . . . . . . . . . . . . . . . . . . . . . . . . . . . . 124
4.4.1 Nematic Configurations . . . . . . . . . . . . . . . . . . . . . . . . . 124
4.4.1.1 Estimation of Anchoring Strength of Rubbing Alignment . . 127
4.4.2 Columnar Configurations . . . . . . . . . . . . . . . . . . . . . . . . . 129
xi

4.4.2.1 Experimentally Observed Columnar Patterns . . . . . . .. . 129
4.4.2.2 Numerical Reproduction of Columnar Patterns . . . . . . . . 133
4.5 Conclusion . . . . . . . . . . . . . . . . . . . . . . . . . . . . . . . . . . . . 137
5 Preliminary Results: Novel Microstructures in Lyotropic Chromonic Liquid Crys-
tals 138
5.1 Nematic LCLC’s in Micropost Arrays with a Deformed Interface . . . . . . . . 139
5.2 Observations of Chiral LCLC Configurations in Tubes . . . . . . . . . . . . . 143
5.3 Mixtures of CLC and Surfactant Phases . . . . . . . . . . . . . . . . . . . . . 147
5.4 Diblock Copolymer Vesicles Suspended in CLCs . . . . . . . . . . . . . . . . 150
5.5 Summary . . . . . . . . . . . . . . . . . . . . . . . . . . . . . . . . . . . . . 153
6 Conclusions and Future Work 155
6.1 Summary . . . . . . . . . . . . . . . . . . . . . . . . . . . . . . . . . . . . . 155
6.2 Future Work . . . . . . . . . . . . . . . . . . . . . . . . . . . . . . . . . . . . 158
6.2.1 Three Dimensional Dynamics and Self-Assembly of Helical Structures 158
6.2.2 Precise Structural Nature and Generality of the Gel-Glass Crossover . . 161
6.2.3 Further Engineering of LCLC films via Microtemplating . . . . . . . . 162
6.2.4 Continuing Work on Novel LCLC-Facilitated Microstructures . . . . . 163
Bibliography 164
xii

List of Figures
1.1 Helical packings of spheres. (Left) Packings of ballooons at festivals with (0,4,4)
and (0,3,3) structures. (Middle right) Spherical candies arranged in a (0,6,6)
structure in their cylindrical packaging. (Right) Fluorescence confocal microscopy
image of a (2,3,5) packing of thermosensitive, micron-size pNIPAm particles in
a glass microcapillary. . . . . . . . . . . . . . . . . . . . . . . . . . . . . . . 4
1.2 Qualitative phase diagram of disordered packings as a function of packing frac-
tion (�) and inter-particle attraction (U ). Images above illustrate an obviously
sparse gel packing (left), obviously dense glassy packing (right), and an inter-
mediate density packing of indeterminate phase (middle). . . . . . . . . . . . . 7
1.3 Cross-polarizing image of a drying droplet of a dilute DSCG suspension, show-
ing a low-to-high concentration gradient from image top to bottom. Illustrations
depict molecular structure in corresponding isotropic (I, top), nematic (N, mid-
dle) and columnar (M, bottom) regions. . . . . . . . . . . . . . . . . . . . . . 10
xiii

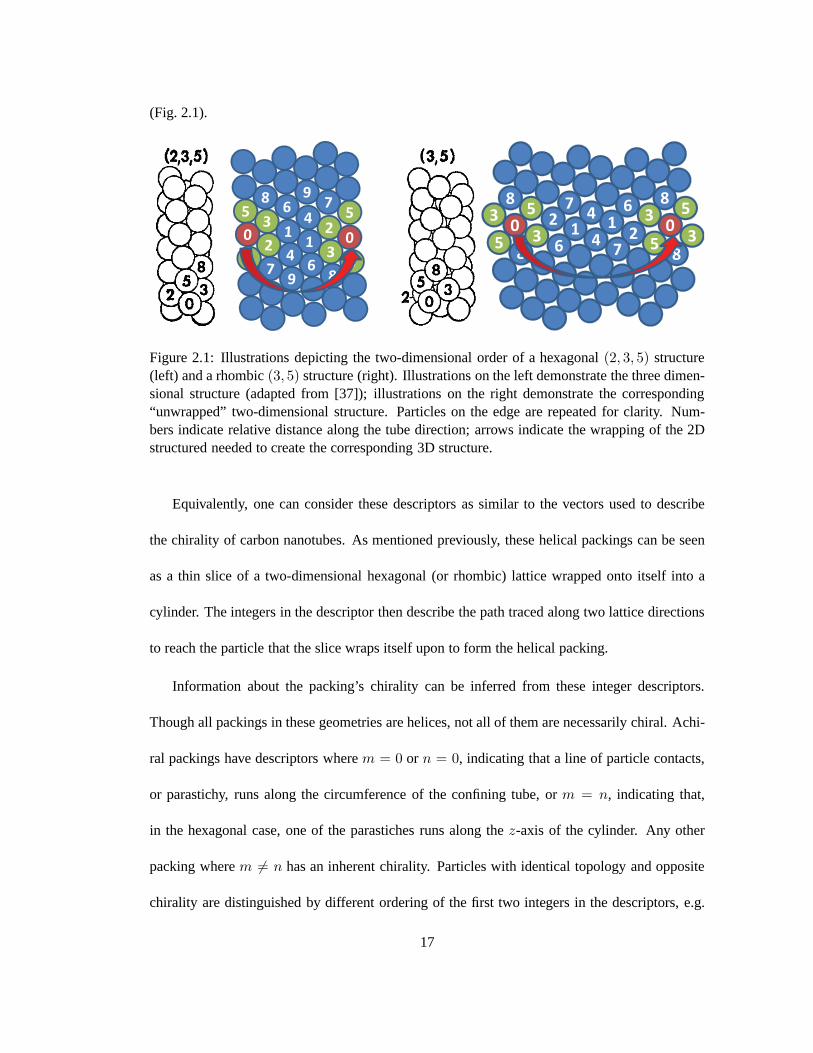
2.1 Illustrations depicting the two-dimensional order of a hexagonal(2, 3, 5) struc-
ture (left) and a rhombic(3, 5) structure (right). Illustrations on the left demon-
strate the three dimensional structure (adapted from [37]); illustrations on the
right demonstrate the corresponding “unwrapped” two-dimensional structure.
Particles on the edge are repeated for clarity. Numbers indicate relative dis-
tance along the tube direction; arrows indicate the wrapping of the 2D structured
needed to create the corresponding 3D structure. . . . . . . . . . . . . . . . . . 17
2.2 Illustration of possible ratios of inter-particle seperationdsep and packing diam-
eterD (Fig. 2.13) at close packing for hexagonal and rhombic helical configura-
tions (based on data from [37,53]). . . . . . . . . . . . . . . . . . . . . . . . . 19
2.3 (Left) Possible transformations between helical, hexagonally ordered states me-
diated by dislocation motion (adapted from [53]), arranged by ratio of packing
diameterD to particle radiusa at close packing. (Right) “Unwrapped” structure
of a helical packing transitioning between a (2, 3, 5) (bottom, blue circles) and a
(1, 4, 5) packing (top, purple circles) via motion of a 5-7 dislocation pair (yellow
circles). . . . . . . . . . . . . . . . . . . . . . . . . . . . . . . . . . . . . . . 20
2.4 Qualitative illustrations of behavior of order parameters and associated suscep-
tibilities with temperature in discontinuous 1st order (left) and continuous 2nd
order phase transitions (right). . . . . . . . . . . . . . . . . . . . . . . . . . . 22
xiv

2.5 Bright field microscopy images of a dense aqueous suspension of pNIPAm mi-
crogel particles at 25∘C (left) and 28∘C (right). Particles deswell with in-
creasing temperature (as depicted in the illustration insets), decreasing packing
fraction, melting the packing from a crystalline packing (left) to an isotropic
disordered fluid (right). Scale bar =10�m. . . . . . . . . . . . . . . . . . . . . 29
2.6 Two-dimensional spatial correlation functions for the two sizes of pNIPAm mi-
crospheres (a, smaller, b, larger) used in helical packings experiments at different
temperatures in a dilute suspension in a quasi-2D cell. Horizontal line indicates
g(r) = 1/e, an effective definition of sphere diameter. Shoulders ing(r) curves
in (a) occur due to the presence of one or two stuck particles in the field-of-view. 31
2.7 Approximate diameters for the smaller (blue∙) and larger (red▲) pNIPAm par-
ticles used in helical packing experiments at different temperatures, with linear
fits. . . . . . . . . . . . . . . . . . . . . . . . . . . . . . . . . . . . . . . . . 32
2.8 Imaging artifacts from confocal scans of helical packings. (a) Illustration of an
xy cross-section of the experimental configuration (not to scale). (b) Brightness
of a confocal scan of a (2, 3, 5) packing averaged along the tube length (z di-
rection) Inset: expectedxy brightness distribution with perfect imaging, given
placement of particles in helical packing outlined by dotted lines. (c)xz slices
of a confocal scan of the same (2, 3, 5) packing close to the objective (bottom),
at the middle of the packing (middle) and far from the objective (top). . . . . . 36
xv

2.9 Confocal scans of a 6�m polystyrene bead with a fluorescent shell, compar-
ing TSM (a-b) and CLSM (c-d) scanning methods (taken from [87]). Note the
slightly increased deformation from the expected circular shape in the CLSM
images. . . . . . . . . . . . . . . . . . . . . . . . . . . . . . . . . . . . . . . 37
2.10 Confocal fluorescence cross-sections of six observed geometries of pNIPAm
packings in microcapillaries (indicated by (m,n,m + n) notation), along with
corresponding reconstructions from particle locations determined using centroid-
locating algorithms on full 3D confocal scans. . . . . . . . . . . . . . . . . . . 39
2.11 3D pair correlation function from positions of≈ 1.7�m colloidal pNIPAm spheres
in a (2,3,5) packing. First peak ing(r) highlighted in red, with Lorentzian peak
fit used to determinedsep is the blue dashed line. The vertical dotted line indi-
cates cutoff for nearest neighbor determination. . . . . . . . . . . . . . . . . . 40
2.12 Example of determination of helical structural integers (m,n,m+ n). (a) Axial
and azimuthal positions of tracked particles in a short axial section. The nearest
neighbors of the green particle are highlighted in blue. Relative axial distance
from the green particle listed to side. Note that the nearest neighbors have rela-
tive axial order of 2, 3 and 5. (b) Histogram of relative axial order for 1st, 2nd
and 3rd closest nearest neighbors in the axial direction in a single packing. Peaks
at values of 2, 3 and 5 indicate that this is a (2,3,5) packing. . . . . . . . . . . . 41
xvi
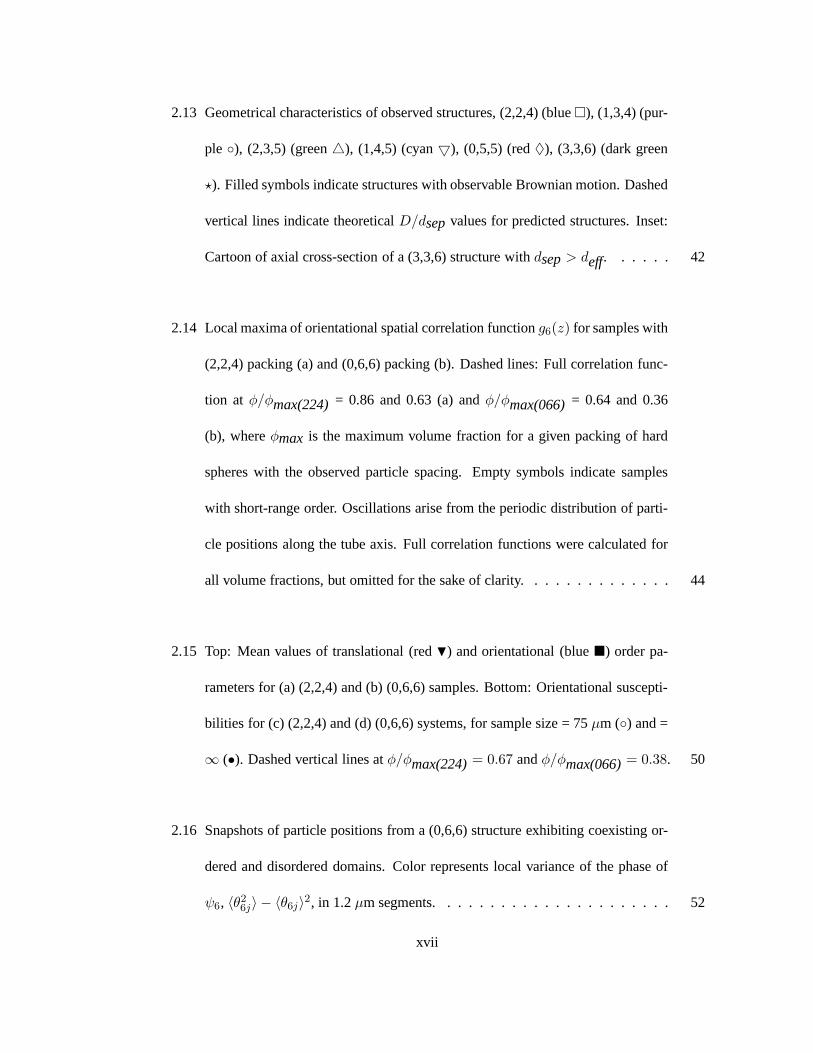
2.13 Geometrical characteristics of observed structures, (2,2,4) (blue□), (1,3,4) (pur-
ple ∘), (2,3,5) (green△), (1,4,5) (cyan▽), (0,5,5) (red♢), (3,3,6) (dark green
★). Filled symbols indicate structures with observable Brownian motion. Dashed
vertical lines indicate theoreticalD/dsep values for predicted structures. Inset:
Cartoon of axial cross-section of a (3,3,6) structure withdsep > deff. . . . . . 42
2.14 Local maxima of orientational spatial correlation functiong6(z) for samples with
(2,2,4) packing (a) and (0,6,6) packing (b). Dashed lines: Full correlation func-
tion at �/�max(224) = 0.86 and 0.63 (a) and�/�max(066) = 0.64 and 0.36
(b), where�max is the maximum volume fraction for a given packing of hard
spheres with the observed particle spacing. Empty symbols indicate samples
with short-range order. Oscillations arise from the periodic distribution of parti-
cle positions along the tube axis. Full correlation functions were calculated for
all volume fractions, but omitted for the sake of clarity. . . . . . . . . . . . . . 44
2.15 Top: Mean values of translational (red▼) and orientational (blue■) order pa-
rameters for (a) (2,2,4) and (b) (0,6,6) samples. Bottom: Orientational suscepti-
bilities for (c) (2,2,4) and (d) (0,6,6) systems, for sample size = 75�m (∘) and =
∞ (∙). Dashed vertical lines at�/�max(224) = 0.67 and�/�max(066) = 0.38. 50
2.16 Snapshots of particle positions from a (0,6,6) structure exhibiting coexisting or-
dered and disordered domains. Color represents local variance of the phase of
6, ⟨�26j⟩ − ⟨�6j⟩2, in 1.2�m segments. . . . . . . . . . . . . . . . . . . . . . 52
xvii

2.17 Snapshots of particle positions from a (2,3,5) structure with emerging domains
of (3,2,5) and (0,4,4) structures. Color represents phase of 6j , �6j, which char-
acterizes packing orientation. Structures corresponding to each�6j given on right. 54
3.1 Qualitative phase diagram of disordered packings as a function of packing frac-
tion � and inter-particle attraction strengthU . . . . . . . . . . . . . . . . . . . 58
3.2 (Left) Illustration of the difference in low-frequency density of statesD(!) in an
ordered Debye solid (black solid line) and a disordered glassy solid (dashed red
line) withd dimensions. Note the boson peak exhibited at low frequencies exhib-
ited by the disordered solid. (Right) vDOS calculated from particle trajectories
in quasi-2D disordered packings of thermal colloidal microgel spheres with soft
repulsive interactions at various area fractions0.840 < � < 0.885, adapted
from [18]. Note low-frequency peak which changes height and frequency loca-
tion with area fraction. . . . . . . . . . . . . . . . . . . . . . . . . . . . . . . 63
3.3 Formation of PS monolayers using water-lutidine phase separation, viewed un-
der bright-field microscopy, with accompanying illustrations below. (Left) Three
dimensional clusters form and sediment to the bottom of the sample cell at
the aggregation temperature. (Middle) Heating sample above the aggregation
regime causes phase separation of water and lutidine, pulling PS spheres into
a monolayer of repulsive particles at the bottom surface. (Right) Lowering the
temperature back to the aggregation regime pins particles to the surface, allowing
them to aggregate from short-range attraction to a stable, percolating monolayer.
Scale bars= 20�m. . . . . . . . . . . . . . . . . . . . . . . . . . . . . . . . . 67
xviii

3.4 Effect of temperature fluctuations in a lower stability objective heater (Bioptechs).
(Bottom) Average particle displacement in a PS monolayer aggregate over the
next 0.2 seconds during a temperature fluctuation of 0.1∘C, taking the sample
out of the aggregation regime. (Top) Bright field microscope images of an attrac-
tive monolayer cluster during the temperature fluctuation. Red arrow indicates a
sub-cluster of particles that undergoes an irreversible rearrangement during the
temperature fluctuation. Scale bar= 10�m. . . . . . . . . . . . . . . . . . . . 70
3.5 Higher stability objective heater setup (Bioscience Tools). (Left) Configura-
tion of Biosciencetools heating objective collar and external temperature probe
placed in sample immersion oil on an upright microscope setup (in experiments,
an inverted microscope is used). (Middle) Temperature readout from external
temperature probe immediately after an increase in set temperature from 33.4
∘C to 33.8∘C. Temperature fluctuations stabilize after about 60 seconds from
the start of the temperature change. (Left) Temperature readout from external
temperature probe several minutes after a temperature change. Note fluctuations
of ±0.03∘C. . . . . . . . . . . . . . . . . . . . . . . . . . . . . . . . . . . . . 70
3.6 Extrapolation of modes to compensate for low statistics in a packing with area
fraction� = 0.84. (Left) 1/! of several modes calculated for several ratios of
Np/Nf , with linear fits extrapolating these modes to the limit ofNp/Nf = 0.
(Right) vDOS calculated forNf = 7000 (red points),Nf = 10000 (green points),
and extrapolationNf → ∞ (black points). Note the increasingly better statistics
do not significantly influence the vDOS curve shape at low frequencies. . . . . 76
xix
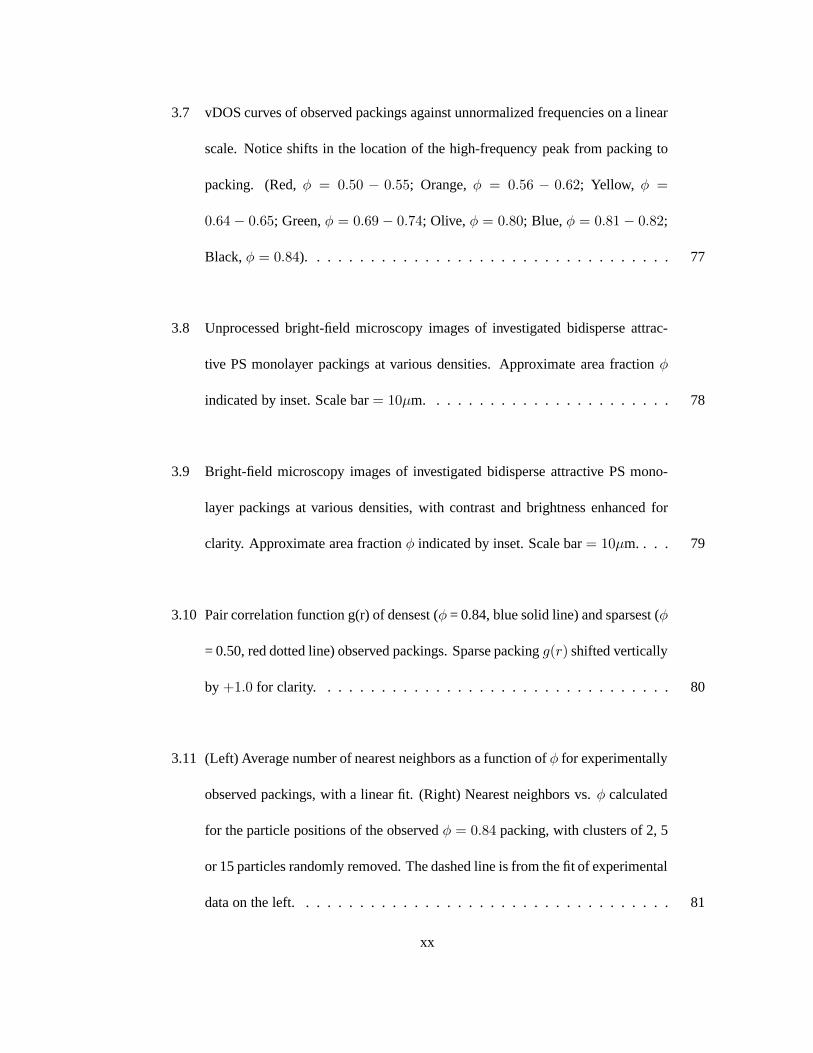
3.7 vDOS curves of observed packings against unnormalized frequencies on a linear
scale. Notice shifts in the location of the high-frequency peak from packing to
packing. (Red,� = 0.50 − 0.55; Orange,� = 0.56 − 0.62; Yellow, � =
0.64 − 0.65; Green,� = 0.69 − 0.74; Olive, � = 0.80; Blue,� = 0.81 − 0.82;
Black,� = 0.84). . . . . . . . . . . . . . . . . . . . . . . . . . . . . . . . . . 77
3.8 Unprocessed bright-field microscopy images of investigated bidisperse attrac-
tive PS monolayer packings at various densities. Approximate area fraction�
indicated by inset. Scale bar= 10�m. . . . . . . . . . . . . . . . . . . . . . . 78
3.9 Bright-field microscopy images of investigated bidisperse attractive PS mono-
layer packings at various densities, with contrast and brightness enhanced for
clarity. Approximate area fraction� indicated by inset. Scale bar= 10�m. . . . 79
3.10 Pair correlation function g(r) of densest (� = 0.84, blue solid line) and sparsest (�
= 0.50, red dotted line) observed packings. Sparse packingg(r) shifted vertically
by +1.0 for clarity. . . . . . . . . . . . . . . . . . . . . . . . . . . . . . . . . 80
3.11 (Left) Average number of nearest neighbors as a function of� for experimentally
observed packings, with a linear fit. (Right) Nearest neighbors vs.� calculated
for the particle positions of the observed� = 0.84 packing, with clusters of 2, 5
or 15 particles randomly removed. The dashed line is from the fit of experimental
data on the left. . . . . . . . . . . . . . . . . . . . . . . . . . . . . . . . . . . 81
xx

3.12 Vibrational density of states as a function of frequency! calculated from eigen-
mode distributions in packings with� < 0.67 (i.e., six packings with� = 0.50,
0.55, 0.56, 0.62, 0.64, and 0.65, each± 0.1) (red lines) and� > 0.67 (i.e., seven
packings with� = 0.69, 0.74, 0.80, 0.80, 0.81, 0.82, and 0.84, each± 0.1) (blue
lines). Thin, faded lines indicate vDOS for individual packings; thicker lines
are the average vDOS for all packings in the sparse (� < 0.67, red) and dense
(� < 0.67, blue) regimes. . . . . . . . . . . . . . . . . . . . . . . . . . . . . 82
3.13 vDOS curves from simulated dense, uniform bidisperse packings (� = 0.95,
black; � = 0.898, purple; � = 0.833, blue; � = 0.816, green), along with
an experimentally calculated vDOS curve from the densest observed packing
(� = 0.84, red curve). Nearest neighbors determined by particle overlap in
simulation indicated in the legend. . . . . . . . . . . . . . . . . . . . . . . . . 83
3.14 Histogram of participation ratiop(!) for low-frequency modes (!/! < 0.1) for
packings with� < 0.67 (open red squares) and� > 0.67 (closed blue squares).
Dashed line indicatesp = 0.2 cutoff for vDOS re-calculations. . . . . . . . . . 85
xxi

3.15 Vibrational density of states re-calculated discounting highly localized modes
(p < 0.2) as a function of frequency! calculated from eigenmode distributions
in packings with� < 0.67 (i.e., six packings with� = 0.50, 0.55, 0.56, 0.62,
0.64, and 0.65, each± 0.1) (red lines) and� > 0.67 (i.e., seven packings with
� = 0.69, 0.74, 0.80, 0.80, 0.81, 0.82, and 0.84, each± 0.1) (blue lines). Thin,
faded lines indicate vDOS for individual packings; thicker lines are the average
vDOS for all packings in the sparse (� < 0.67, red) and dense (� < 0.67, blue)
regimes. . . . . . . . . . . . . . . . . . . . . . . . . . . . . . . . . . . . . . . 86
3.16 Plots of particle locations from a sparser packing (� = 0.64± 0.01) overlaid with
polarization eigenvector components corresponding to two modes with similar
frequency (!/! = 0.019 (a) and 0.021 (b)) and significantly different localization
(p(!) = 0.32 (i.e., a more extended mode) (a), andp(!) = 0.069 (i.e., a more
localized mode) (b)). Scale bar= 10�m. . . . . . . . . . . . . . . . . . . . . . 87
3.17 Histograms of∣ei(!)∣ for all modes with!/! < 0.1 in all observed packings
with � < 0.67 for extended (p > 0.2, solid squares) and localized (p < 0.2,
empty squares) modes. . . . . . . . . . . . . . . . . . . . . . . . . . . . . . . 88
xxii

3.18 (a)Plot of particle locations in a� = 0.64± 0.01 packing, with particles which
have∣ei(!)∣ > 0.2 for any mode where!/! < 0.1 highlighted in red. Scale
bar= 10�m.(b) Histogram of size of clusters of particles which dominate a low-
frequency mode in sparse packings (∣ei(!)∣ > 0.2, !n/! < 0.1, � < 0.67).
(c) Histogram of nearest neighbors per particle of each packing with� < 0.67
(black points) and for particles in all sparse packings which dominate a low-
frequency mode (empty squares,∣ei(!)∣ > 0.2, !n/! < 0.1). . . . . . . . . . 89
3.19 Illustration of single-particle deformations in a linear chain of particles, showing
a particle with two neighbors in a line connected by springs (a) at its equilibrium
position, with inter-particle spacingr, (b) under a longitudinal deformation of
size�x, and (c) under a transverse deformation of size�y. . . . . . . . . . . . 91
3.20 Characterization of linear structure distribution in a packing with area fraction
� = 0.64. (Left) Histogram of∣ 2i∣ for particles in the packing. (Right) Particle
positions for� = 0.64 packing, with particles with∣ 2i∣ ¿ 0.6 highlighted in
purple. Arrows indicate angle given by the complex phase of 2i. Scale bar
= 10�m. . . . . . . . . . . . . . . . . . . . . . . . . . . . . . . . . . . . . . . 92
4.1 Illustration of the mesogen structure in lyotropic chromonic liquid crystals. (Top)
Plank-like LCLC-forming molecules, when suspended in water, form linear ag-
gregates, which act as mesogens for liquid crystal phases. (Bottom) The com-
mon liquid crystal phases of aggregates in chromonic liquid crystals are nematic
(N) at intermediate concentrations and columnar (M) at higher concentrations. . 99
xxiii
4.2 Number of academic articles containing the keyword “chromonic” from Web of
Science (open circles) and Google Scholar (filled squares) per year from the past
few decades. . . . . . . . . . . . . . . . . . . . . . . . . . . . . . . . . . . . . 101
4.3 Nematic DSCG suspension placed between glass slides rubbed with an abra-
sive, creating an aligned film approximately 10�m thick, viewed under crossed-
polarizers. Evaporation proceeds from an open edge beyond the upper right
corner of the image, causing drying into the columnar phase. Though drying is
slow, herringbone textures can be seen in the columnar phase. . . . . . . . . . . 105
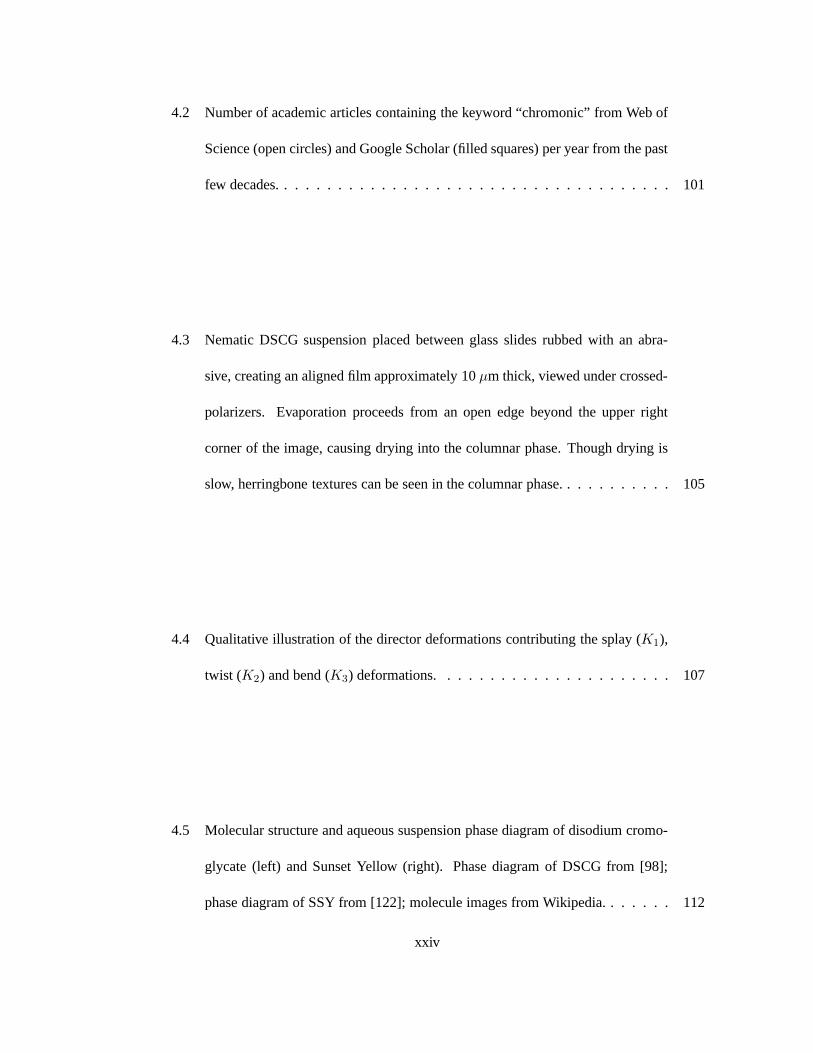
4.4 Qualitative illustration of the director deformations contributing the splay (K1),
twist (K2) and bend (K3) deformations. . . . . . . . . . . . . . . . . . . . . . 107
4.5 Molecular structure and aqueous suspension phase diagram of disodium cromo-
glycate (left) and Sunset Yellow (right). Phase diagram of DSCG from [98];
phase diagram of SSY from [122]; molecule images from Wikipedia. . . . . . . 112
xxiv
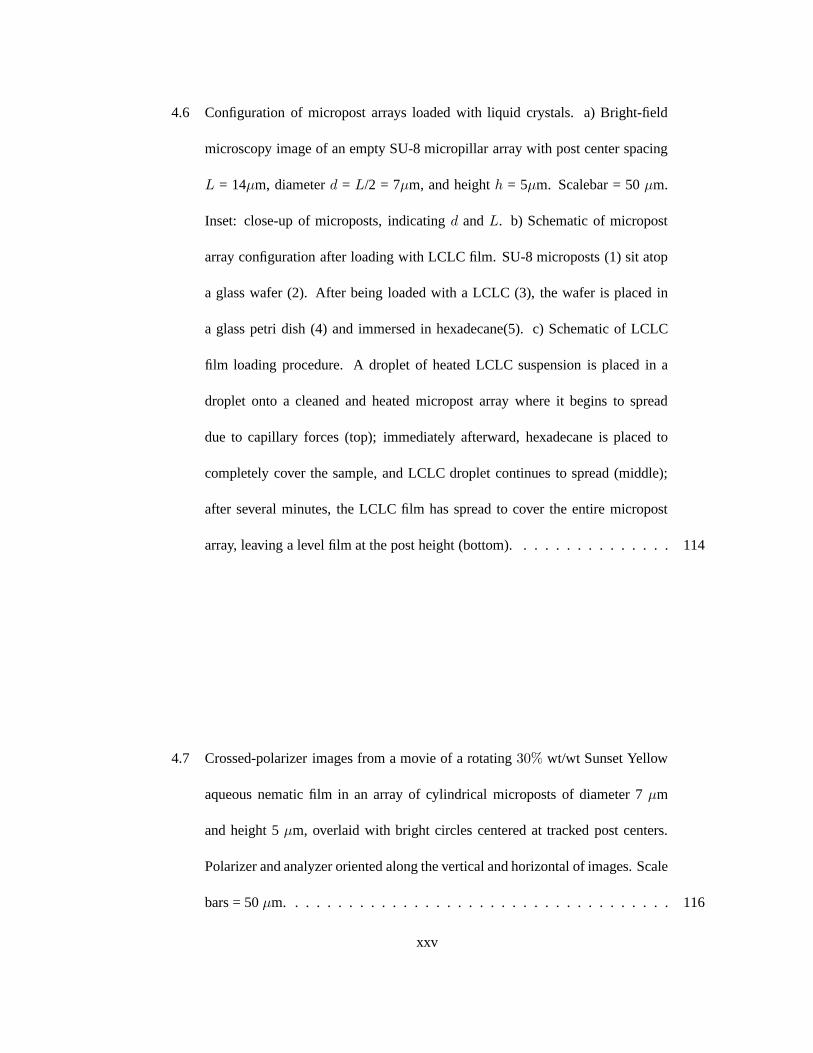
4.6 Configuration of micropost arrays loaded with liquid crystals. a) Bright-field
microscopy image of an empty SU-8 micropillar array with post center spacing
L = 14�m, diameterd = L/2 = 7�m, and heightℎ = 5�m. Scalebar = 50�m.
Inset: close-up of microposts, indicatingd andL. b) Schematic of micropost
array configuration after loading with LCLC film. SU-8 microposts (1) sit atop
a glass wafer (2). After being loaded with a LCLC (3), the wafer is placed in
a glass petri dish (4) and immersed in hexadecane(5). c) Schematic of LCLC
film loading procedure. A droplet of heated LCLC suspension is placed in a
droplet onto a cleaned and heated micropost array where it begins to spread
due to capillary forces (top); immediately afterward, hexadecane is placed to
completely cover the sample, and LCLC droplet continues to spread (middle);
after several minutes, the LCLC film has spread to cover the entire micropost
array, leaving a level film at the post height (bottom). . . . . . . . . . . . . . . 114
4.7 Crossed-polarizer images from a movie of a rotating30% wt/wt Sunset Yellow
aqueous nematic film in an array of cylindrical microposts of diameter 7�m
and height 5�m, overlaid with bright circles centered at tracked post centers.
Polarizer and analyzer oriented along the vertical and horizontal of images. Scale
bars = 50�m. . . . . . . . . . . . . . . . . . . . . . . . . . . . . . . . . . . . 116
xxv

4.8 Intermediate post-processing steps for post tracking a rotating 30 percent Sunset
Yellow aqueous nematic film in an array of cylindrical microposts of diameter 7
�m and height 5�m. (Top) Inverted cross-polarizer images, calculated from sub-
tracting original image pixel values from the maximum pixel brightness. (Bot-
tom) Inverted images convoluted with a uniformly bright disk of diameter equal
to the post diameter, yielding near-gaussian peaks centered at the post centroids.
Scale bar = 50�m. . . . . . . . . . . . . . . . . . . . . . . . . . . . . . . . . 117
4.9 (a) Trajectories of 59 posts tracked through a 360∘ sample rotation. (b) Trajec-
tories with average translational motion per frame removed. . . . . . . . . . . . 118
4.10 Selections of images of the SSY film from Figure 1, with net sample rotation
and translation removed. Polarizer/analyzer are oriented at angles of 0∘ (t = 0
sec), 37∘ (t = 6 sec), and 55∘ (t = 8 sec) with respect to the vertical/horizontal
of images. . . . . . . . . . . . . . . . . . . . . . . . . . . . . . . . . . . . . . 118
4.11 (a) Selection of unprocessed video of SSY film under crossed-polarizers, when
the polarizer/analyzer is oriented at an angle of 0∘ (t = 0 sec) with respect to
the vertical/horizontal of the image. (b-c) Image brightness / transmitted light
intensity at pixels 1 and 2, respectively, as a function of the angle of polar-
izer/analyzer to image horizontal/vertical,�dir. Red lines indicate fits to the
function I = I0 sin2(2(�dir − �pol)) + B, whereI0 is the difference in maxi-
mum and minimum intensity, andB is the minimum intensity value. For (a),
�dir = 42.3∘, and (b),�dir = 30.15∘. . . . . . . . . . . . . . . . . . . . . . . . 120
xxvi

4.12 (a) Relative in-plane director magnitude,I0. Indications of defects at the edges
of posts are shown as small dark spots. (b) In-plane director orientation (red
lines) plotted over grayscale image of in-plane director magnitudeI0. For the
sake of clarity, only every 10th pixel is represented in this image. . . . . . . . . 121
4.13 Micropost arrays filled with nematic DSCG (14% wt/wt) at room temperature.
Crossed-polarizer (a & c) and crossed-polarizer with full wave retardation plate(b
& d) images shown with bottom surfaces rubbed along a lattice diagonal (a & b)
or a post lattice direction (c & d), as illustrated in the insets. Scale bar = 50�m.
The slow axis of the retardation plate is given by the orange arrow in (b & d). . 125
4.14 Average in-plane director orientation (red lines) from a minimization of the LdG
free energy for a generic nematic in cylindrical micropost confinement, overlaid
by the schlieren texture expected when viewed between crossed-polarizers. . . 126
4.15 Nematic films of 14% wt/wt DSCG (a-c) and 30% wt/wt SSY (d-f) in micropost
arrays. Images show schlieren textures under crossed-polarizers (a & d), average
in-plane director magnitude (b & e), and average in-plane director orientation for
a selected region of 4 posts (c & f). Scale bar = 20�m. . . . . . . . . . . . . . 127
xxvii

4.16 Results of LdG numerical modeling with varying planar oriented anchoring strength
along the bottom of the cell. The planar anchoring is parallel to one of the lattice
axes (in this case along thex direction) and has a strengthW . a) Absolute value
of the angle of the stable defect orientation with respect to the bottom surface
anchoring direction∣�d∣, as a function of anchoring strengthW . Each point is
averaged over 10 random initial configurations.Wmax = 1.0×10⁻⁷ J/m2 is set at
the value ofW resulting in∣�d∣ = �min = 40.5∘. Bottom: simulation results for
local director orientation (red lines) and corresponding schlieren textures given
polarizer, analyzer, lattice axes and rubbing direction (dashed lines / red arrow)
given in schematic (e) for (b)W1 = 3.52 × 10⁻¹⁰ J/m2, (c)W2 = 7.04 × 10⁻⁷
J/m2 and (d)W3 = 3.48 × 10⁻⁶ J/m2. . . . . . . . . . . . . . . . . . . . . . . 130
4.17 Columnar film of DSCG dried from a nematic DSCG film of initial concentration
17% wt/wt. Images show (a) crossed-polarizer image of the film; (b) bright
field image of the film (where defects are visible as dark lines); (c) probability
distribution of in-plane director orientations with respect to the horizontal post
lattice spacing direction; (d) average in-plane director orientation for four posts,
colored by angle using the same scheme as (c) and plotted over the average in-
plane director magnitude (bright=in-plane, dark=out-of-plane/disordered). Scale
bar = 10�m. . . . . . . . . . . . . . . . . . . . . . . . . . . . . . . . . . . . 132
xxviii

4.18 Columnar films dried from (left) nematic DSCG film of initial concentration
18% wt/wt and (right) SSY. Images show (a) crossed-polarizer image of the
film; (b) bright field image of the film (where defects are visible as dark lines);
(c) probability distribution of in-plane director orientations with respect to the
horizontal post lattice spacing direction; (d) average in-plane director orienta-
tion for four posts, colored by angle using the same scheme as (c) and plot-
ted over the average in-plane director magnitude (bright=in-plane, dark=out-of-
plane/disordered). Scale bar = 10�m. . . . . . . . . . . . . . . . . . . . . . . 133
4.19 Average in-plane director orientations from expanded LdG free energy mini-
mizations in micropillar confinement for effective Frank elastic constant ratios
K3/K1 = 0.09 (a-c) andK3/K1 = 0.03 (d-f) for in-plane director initializations of
45∘ (a & d), 40∘ (b & e), and 30∘ (c & f) from the horizontal post lattice spacing
direction. Line coloring highlights distinct regimes of director orientation (blue
= close to horizontal, red = most off-horizontal, green = intermediate orienta-
tion); darker backgrounds indicate regions with the 40% greatest contribution to
Frank free energy bend,b = ((n ⋅ ∇)n)2. . . . . . . . . . . . . . . . . . . . . 135
xxix

4.20 Final mean director orientation from expanded LdG free energy minimizations
as a function of deviation of initialized director angle from the lattice diagonal.
Mean director angles> 36∘ correspond to “square” defect wall configurations
(blue area of graph); mean director angles< 36∘ correspond to “zigzag” de-
fect wall configurations (mauve area of graph). Filled circles represent effec-
tive Frank free energy constantsK3/K1 = 0.09; open squares represent effective
Frank free energy constantsK3/K1 = 0.03 . . . . . . . . . . . . . . . . . . . . 136
5.1 Illustration of LCLC film configuration with deformed nematic interfaces. Since
the film is in nematic-isotropic coexistence, though the top of the aqueous film
is level, the isotropic-nematic interface wets the microposts and deforms. . . . . 140
5.2 Cross-polarizing images of a nematic SSY film (polarizer and analyzer vertical
and horizontal, respectively) with a deformed interface. Insets: Enlargements of
cross-polarizer texture between four posts. . . . . . . . . . . . . . . . . . . . . 141
5.3 (Right) Cross-polarizer image of the “pinwheel” texture with corresponding ap-
proximated average in-plane director orientation sketched in red dotted lines.
(Left) Illustration of the presumed shape of the deformed nematic-isotropic in-
terface between four posts. Dark lines trace the surface of the interface. . . . . 142
5.4 (Top) Nematic DSCG in a microcapillary with inner diameter< 10�m under
cross polarizers. (Bottom) Nematic DSCG with added PEG in a microcapil-
lary with inner diameter< 10�m under cross polarizers with a full wavelength
retardation plate. . . . . . . . . . . . . . . . . . . . . . . . . . . . . . . . . . 144
xxx

5.5 DSCG emulsion droplets at 15% wt/wt suspended in mineral oil in glass micro-
capillaries, under cross-polarizers (top) and with a full-wavelength retardation
plate (bottom). . . . . . . . . . . . . . . . . . . . . . . . . . . . . . . . . . . . 145
5.6 Isotropic-nematic coexistence of DSCG in a microcapillary, under cross-polarizers
with a full wavelength retardation plate. . . . . . . . . . . . . . . . . . . . . . 146
5.7 Twisted disclination lines observed in nematic DSCG filled capillaries, several
days after filling. Viewed under cross-polarizer with full wavelength retarding
waveplate. . . . . . . . . . . . . . . . . . . . . . . . . . . . . . . . . . . . . . 147
5.8 Cross-polarizing images of 15% wt/wt SDS/butanol mixture in 10% wt/wt aque-
ous DSCG solution. The system exhibits nematic-isotropic and/or columnar-
isotropic coexistance via crowding effects. . . . . . . . . . . . . . . . . . . . . 149
5.9 Variety of SDS/decanol/water mesophases including 3% wt/wt DSCG (top, cross-
polarizer, bottom, cross-polarizer with full-wavelength retarding waveplate). Left:
SDS/decanol in nematic calamitic (NC) phase (5% decanol, 33.5% SDS). Mid-
dle: SDS/decanol in nematic discotic (ND) phase (5.9% decanol, 31% SDS)/
Right: SDS/decanol in lamellar (L�) phase (9.4% decanol, 29.2% SDS). . . . . 150
5.10 Cross-polarizing images of PEO-PBD vesicle in nematic DSCG shortly after
initial suspension. Top: Temperature increase from 25C to 36C (left to right)
induces swelling of crumpled vesicle. Bottom: Cooling from 36C to 25C (left
to right) causes vesicle to deswell and crumple. . . . . . . . . . . . . . . . . . 151
xxxi

5.11 Vesicles in nematic DSCG 3 days after initial cooling, under cross-polarizers.
Image at the far right demonstrates deformation of vesicle shape by a moving
isotropic-nematic interface. . . . . . . . . . . . . . . . . . . . . . . . . . . . . 152
xxxii
Chapter 1
Introduction
The creation of unique materials through the careful control of microstructure is an exciting new
activity at the forefront of condensed matter physics. Microstructured photonic metamaterials,
for example, exploit micron-size refractive patterns to create substances with unusual optical
properties, e.g., superlenses which defeat the conventional diffraction limit. Biomimectic mate-
rials replicate micro-textures observed in the natural world, for example, in order to synthetically
reproduce the hydrophobicity of lotus leaves, the adhesive feet of geckos, and the brilliant struc-
tural colors of butterfly wings. Such materials have exciting emerging applications in robotics,
display, and energy technologies.
The implementation of such sophisticated concepts and technologies requires detailed con-
trol of materials at a micro- and nano-scale. Fabrication of two- and three-dimensional (2D,
3D) microstructures, for example, has been facilitated by the refinement of techniques such as
photolithography and high-resolution 3D printing. Similarly, recent strides have been made to-
wards creation of self-assembling colloidal microstructures [40, 103], which could eventually
1

lead to more scalable methods for microstructure production. An attractive and possibly simpler
approach towards the same goal is to grow complex material structures starting with surface tem-
plates or micro-patterns. In principle, these micro-patterns could be modulated which, in turn,
could manipulate structure of the coupled three-dimensional material.
The study of microstructured materials has been stimulated not only by our increased abil-
ity to create microstructures, but also by the growing portfolio of innovative methodologies
to quantitativelyobserve these structures. In particular, digital recording technology and com-
puter processing power have evolved dramatically over the past few decades and have made it
possible to precisely quantify and analyze the microscopic structure and dynamics of soft ma-
terials via video microscopy [26]. Precise quantification of particle trajectories, for example,
has facilitated the technique of microrheology [17] and the measurement and study of vibra-
tional modes [18, 43, 54, 72]. These techniques, in turn, have brought deeper understanding of
the microscopic origins of the glass transition [18, 43, 72], melting [1, 51], and other interesting
materials physics.
This dissertation investigates the behavior of a variety of soft materials. The research in-
volves fabrication of novel microstructures and then rigorous measurement and analysis of their
configurations and dynamics. For example, by creating helical packings of thermal colloidal
spheres in hollow cylindrical micro-capillaries, we gained fresh insight into the structural sta-
bility and melting physics of quasi-1D helical materials [94]. In a different vein, we investi-
gated a largely unexplored area of the colloidal “phase diagram,” wherein a so-called attractive
glass can cross over to become a gel; the experiments developed a novel method for creating
2

and manipulating colloidal monolayers, and then used the resulting packings to identify vi-
brational (and microstructural) signatures of the gel-glass transition. Finally, we investigated
the substrate-induced self-assembly of a relatively unexplored class of soft materials called ly-
otropic chromonic liquid crystals (LCLCs). We made significant progress using micropost arrays
to template LCLC films with microstructures that affected the LCLCs via the materials’ elastic
properties [95]. Besides the work discussed in this thesis, the author played acontributing role
on several other projects in the Yodh lab. These experiments were concerned with the evaporative
deposition of colloidal particles, and particularly how capillary interactions between anisotropic
microscopic particles can modify their deposition behavior during drying [175–177].
The remainder of this chapter will provide a brief introduction to the primary topics explored
in this dissertation. Though the projects described address different fundamental physical prob-
lems (melting and structure in confinement, glass-gel “phase behavior”, and templated liquid
crystal structures), all of these experiments share state-of-the-art experimental techniques and
analysis to understand soft matter phenomenology and phase transitions.
1.1 Structure and Melting of Helical Packings
Helical packings arise from a fairly simple geometrical constraint. When uniform spheres are
confined at high densities to the interior of a cylinder whose diameter is of the same order as the
sphere diameter, they then form an ordered packing of intertwining helices of adjacent particles.
The structure of these packings resembles a two-dimensional hexagonal lattice wrapped into a
tight cylinder. Though such structures can be produced at any size, only during the past decade
have researchers been able to create such helical packings on the micro- [66, 92, 109, 161] and
3

nano-scale [75,171], wherein thermal fluctuations become important.
Figure 1.1: Helical packings of spheres. (Left) Packings of ballooons at festivals with (0,4,4)and (0,3,3) structures. (Middle right) Spherical candies arranged in a (0,6,6) structure in theircylindrical packaging. (Right) Fluorescence confocal microscopy image of a (2,3,5) packing ofthermosensitive, micron-size pNIPAm particles in a glass microcapillary.
Thus, the stability of such structures in the presence thermal fluctuations was largely un-
considered until recently, with most research being content to study athermal varieties of such
systems [9, 10, 53, 132, 133]. Further, since there exists a widely held assumption that stable
crystalline packings with long-range order cannot exist in one dimensional systems [126, 162],
it is reasonable to suspect that helical packings might not be stable. In practice, the helical mi-
crostructures we explore experimentally (and indeed many analogous structures) are not truly
one-dimensional; rather, they resemble a tightly wrapped periodic two-dimensional pattern.
Thus, the exact helical microstructures that thermal colloids form under confinement, their sta-
bility, and their phase behavior are not intuitively apparent.
Chapter 2 of this thesis describes work identifying helical colloidal packings at the mi-
croscale and examining the thermal stability of such structures. The colloids employed are
packings of fluorescently-labeled thermoresponsive microgel spheres in glass microcapillaries.
By imaging this system with fluorescence confocal microscopy (a non-trivial task, due to the
4

highly curved and index-mismatched interfaces of these samples), we quantified both the struc-
tural properties and their Brownian dynamics at multiple particle-to-tube-diameter ratios, and
as a function of the particle volume fraction. We observed that this system forms helical pack-
ings, and that these packings remained stable in the presence of thermal fluctuations at volume
fractions significantly below close packing. Then, by decreasing the particle diameter (i.e., by
increasing the sample temperature), and thus decreasing the overall volume fraction, we were
able to observe the melting of these helical crystals. Careful examination of the dynamics and
fluctuations of local order parameters around the melting transitions provided evidence of a
phase-transition-like crossover between long-range orientationally ordered and fluid states. To
some degree, these observation provide a counterexample to the widely accepted idea that one
cannot observe stable phases in one dimension (e.g., in the limit of infinitely long samples).
Though translational order in such packings should still not be stable, we observe evidence of
stable orientationally ordered phases, and further, we observe transitions from one phase to an-
other. We used orientational order parameters to locally identify helices of different pitch and
to discover how helical structures can transform between different local pitches and chiralities
prior to melting in a manner inconsistent with well-understood dislocation-mediated structural
transitions of athermal packings. This work has been published [94]. InChapter 2 we discuss
the background, experimental challenges, results and analysis with greater depth than we have
presented in [94].
5

1.2 Vibrational Signatures of Gel-like and Glassy ColloidalPack-
ings
The relationship between the microscopic structure and macroscopic properties of a solid is an
exciting issue in the current study of disordered materials [4, 29, 36, 62, 142]. For example,
regions prone to mechanical failure are difficult to identify from structure alone in amorphous
solids, though they are readily apparent in crystalline solids as micro-structural defects and grain
boundaries [1]. Nevertheless, subtle structural signatures can be helpful for characterizing the
behavior of disordered materials. In fact, recent studies in disordered dense colloidal packings
have made progress identifying signs of structural order at the onset of the glass transition [152,
187], and identifying rearrangement-prone “soft spots” in glassy packings from quasi-localized
low-frequency vibrational modes [12,13,19,42,101,165] and regions with smaller-than-average
local bond coordination [174].
Packings of particles with short-ranged attraction are typically described by two kinds of
dynamically arrested states [160,181,182]. The term “attractive glass” is used to denote a dense
packing of particles with uniform structure, while the term “gel” is used to describe a broad
class of sparse dynamically arrested packings. Despite such fundamentally different qualitative
descriptions, gels and attractive glasses are difficult to distinguish in systems with strong inter-
particle attractions and intermediate densities. Typically, gels are qualitatively distinguished
from glasses by obvious structural inhomogeneities, a task made very difficult innearly uniform
packings. Additionally, gels share some dynamical traits of glassy materials, such as dynamical
heterogeneity [24], and a prevalence of low-frequency vibrational modes compared to ordered
solids [139]. Some recent studies have characterized this transition through the observation of
6

U (
Inte
r-p
ar�
cle
A�
rac�
on
)
Packing Frac�on ф
Gel
Repulsive Glass
A�rac�ve GlassFluid/
Cluster
Fluid
?
Dense Gel?
Dilute A�. Glass?Gel
A�rac�ve
Glass
Figure 1.2: Qualitative phase diagram of disordered packings as a function of packing fraction(�) and inter-particle attraction (U ). Images above illustrate an obviously sparse gel packing(left), obviously dense glassy packing (right), and an intermediate density packing of indetermi-nate phase (middle).
7

two-step rheological yielding [86], changes in slow relaxation times [182], scaling of bulk elastic
properties [183], and deviation of a phase boundary line from percolation theory [34]. However,
there has not yet been a distinct microstructural or localized dynamical signature of the gel-
to-glass crossover in a static experimental sample (i.e., a sample of thermal particles which is
dynamically arrested and not experiencing external shear) with strong inter-particle attractions.
Chapter 3 examines the crossover from glassy to gel-like dynamics and structure in quasi-
2D colloidal packings with short-ranged attraction. We create monolayers of bidisperse micron-
sized polystyrene colloids by exploiting a novel spreading behavior of binary water-lutidine
mixtures refined through careful experimentation. Using this method, we can track vibrations
in even the densest, most uniform glassy packings. Starting from these particle trajectories, we
apply a well-implemented method for calculating the vibrational density of states (vDOS) [18,
43,54,72] for the first time in spatially heterogeneous, attractive colloidal packings. The shape of
the resulting vDOS curves demonstrates a distinctive crossover from typically glassy behavior at
high area-fractions to curves demonstrating an excess of low-frequency vibrational modes below
a certain density threshold. The shape of the characteristically “gel-like” curves is attributed to
the appearance of low-frequency phonon modes localized to individual/small clusters of low-
coordination particles. Though the exact structures surrounding these individual particles are
not always the same, this vibrational behavior helps us to elucidate the microstructural origin
of the differences between attractive glasses and gels. This work is complete, and we are in the
process of submitting it for publication.
8

1.3 Microscopic Ordering of Lyotropic Chromonic Liquid Crys tals
While liquid crystals (LCs) have been extensively utilized in display technologies for the past
several decades, scientists and engineers are now turning to new implementations of this broad
class of materials for photonic, mechanical, and sensory applications. Many of these applications
require a sophisticated control of liquid crystalline order at the microscopic scale. For example,
recent mechanisms have been proposed that employ emulsion droplets of thermotropic LC’s as
highly sensitive sensors for endotoxins [93]. Further, recent theoretical studies have proposed
that films carefully assembled from tiles with liquid crystalline order and mechanical anisotropy
could form self-folding materials [107, 108]. Micropatterned polarizing materials from liquid
crystals are also crucial to the development of new holographic display technologies [102,151].
Lyotropic chromonic liquid crystals (LCLCs) are a relatively unexplored class of anisotropic
fluids conducive to microscale self-assembly [98, 99, 150]. LCLCs are typically composed of
molecular aggregates of plank-like polyaromatic compounds with ionic side-groups in an aque-
ous suspension. As the concentration of such a suspension increases, the density and average
length of these aggregates increases, eventually forming a nematic (N) and then a columnar (M)
phase. These mesophases are thus significantly different from more commonly utilized ther-
motropic and amphiphilic lyotropic liquid crystals.
Because of their aqueous nature, low toxicity, and low cost, LCLCs are promising for uti-
lization in a variety of applications. Micropatterned films of LCLCs, specifically, have a wide
variety of emerging applications distinct from other types of liquid crystals, including inex-
pensive polarizing films [32, 98, 99], holographic displays [102, 151], organic electronics and
9

I
N
M
PA
Figure 1.3: Cross-polarizing image of a drying droplet of a dilute DSCG suspension, showinga low-to-high concentration gradient from image top to bottom. Illustrations depict molecularstructure in corresponding isotropic (I, top), nematic (N, middle) and columnar (M, bottom)regions.
solar cells [115, 119], biosensors [144, 168], aqueous colloidal, nanotube and bacterial assem-
bly [38, 113, 120, 146, 188], and precursors to structured graphene-based materials [49, 110].
LCLCs also offer useful attributes for fundamental investigation of the effects of elasticity on
self-assembly behavior, since their elastic properties can be tuned via control of mesogen con-
centration [189], depletants, and ions [121]. Indeed, studies have demonstrated that LCLCs in
micro-scale confinement form unique, elastic-property-dependent configurations [64,158].
In this thesis, we describe the manipulation of aqueous LCLC suspensions in an effort to ob-
serve novel finely tunable microstructure assemblies.Chapter 4 reviews and elaborates on our
published work examining the assembly of microstructure in LCLC films templated by cylindri-
cal micropost arrays [95]. A fundamental understanding of the detailed microstructure in these
films is enabled by a novel method for high-resolution director field determination that combines
polarizing microscopy, video microscopy and particle tracking techniques. This work is also fa-
cilitated by numerical free energy solutions for a liquid crystal under micropost confinement.
The presence of a square lattice of cylindrical microposts is discovered to create a significant
10
alignment/anchoring effect on nematic films, biasing a bistable alignment along lattice diago-
nals. Drying the film to the columnar state results in two classes of defect wall “tile” patterns,
i.e., depending on the type and initial concentration of the LCLC used. By pushing numerical
models for nematic LCLC’s to a columnar limit, and comparing our results with known charac-
teristics of nematic LCLC suspensions, it is shown that the difference in columnar patterns arises
from a competition of bend and splay elastic deformations as the nematic approaches the colum-
nar phase. A new method for templating microstructure in liquid crystal films by modulating
their elastic properties is thus discovered.
Chapter 5 describes additional preliminary work exploring novel LCLC configurations. It
was hoped that LCLCs may assemble into unique and useful configurations by placing them in
new microscale confinement geometries, as well as observing how they interact with ordered am-
phiphile structures. Indeed, both thin nematic LCLC films, with varying thickness and LCLCs,
confined to narrow cylinders, appear to demonstrate novel twisted configurations due to coupling
between nematic elastic deformations and confining surfaces. Additionally, dense surfactant-
based lyotropic LCs were observed to drive LCLC-forming molecules into columnar structures
which co-organize with the surrounding LC structure, and self-assembled diblock copolymer
vesicles were observed to deform in novel ways when suspended in nematic LCLCs. These re-
sults are not yet published, but they should serve as starting points for new and exciting studies
with novel LCLC assemblies.
11

1.4 Organization of Thesis
This remainder of this thesis is organized into several chapters, each elaborating on the context,
theory, experimental details, and the results of the separate studies discussed above.Chapter
2 describes work on helical packings of thermoresponsive colloidal spheres in glass capillaries
which has been published [94].Chapter 3 describes a study of the vibrational modes of quasi-
two dimensional attractive packings of colloidal spheres; this study is currently being written
and submitted for publication.Chapter 4 describes published work on elasticity-dependent
configurations of LCLC films in micropost arrays [95]. Additionally, the results of preliminary
(but unpublished) experiments on novel microstructured chromonic liquid crystal systems are
briefly summarized inChapter 5; though unpublished, these experiments should nucleate future
work. Finally,Chapter 6 summarizes the results presented in previous chapters and elaborates
on directions for future study.
12

Chapter 2
Helical Packings and Phase
Transformations of Soft Spheres in
Cylinders
2.1 Introduction
“Crystalline” or “ordered” materials are composed of particles with even, periodic spacing over
large length scales. Long-range translational order is a common signature of stable solid phases
of matter, whether in ordered packings of the atoms in metals or colloidal spheres packed in a
FCC or BCC lattice. Such phases are common in three-dimensions (3D), though the physics of
lower dimensionality materials can diminish such order. Crystalline packings in two-dimensions
13

(2D), for example, only display quasi-long-range translational order, and the uniformity of par-
ticle spacings decays algebraically over long distances [85, 117, 173]. One-dimensional mate-
rials are prohibited from exhibiting translationally ordered phases, as there exists no signficant
free energy barrier between translationally ordered and disordered phases [162], and ordered
phases themselves are unstable to fluctuations [126]. These concepts imply that ordered one-
dimensional materials are not stable, which would suggest the formation of crystalline nanowires
are problematic at best.
Order, however, is not necessarily restricted to the uniform spacing of particles as defined
by translational order. Orientational order, based on the local arrangments of particles rather
than their spacing, does not follow the same dimensional restrictions as translational order. For
example, two-dimensional crystals exhibit truly long-range orientational order, and proposed
two-dimensional phases with no translational order still exhibit quasi-long-range orientational
order [85, 117, 173]. Additionally, both quasi-crystals and liquid crystals are structured, stable
phases of matter which exhibit orientational order without regular spacings of constituent parti-
cles. Thus, a quasi-one dimensional (1D) material which exhibits some degree of orienational
order might demonstrate phases that are stable against thermal fluctuations.
To this end, packings of soft colloidal spheres in cylinders provide a fascinating and use-
ful model experimental system to quantitatively investigate order and phase transformations in
quasi-1D. At high densities, spheres in cylindrical confinement form helical crystalline struc-
tures [37, 53]. Such packings are observed in foams [9, 10, 132, 133], biological microstruc-
tures [37], colloids in micro-channels [66, 92, 109, 161] and fullerenes in nanotubes [75, 171].
14

Simulations suggest that transitions between different helical ordered states [84, 131] and be-
tween quasi-1D ordered and disordered states [33, 46, 61] should exist in thermal systems, but
such transitions have not been investigated experimentally. To date, research on this system class
has been limited to static snapshots and athermal media.
In this chapter, we explore ordered and disordered structures in a quasi-1D thermal system
of soft particles with adjustable diameter and volume fraction. In particular, we create helical
packings of thermoresponsive particles in glass microcapillaries. We show theoretically that
phases with long-range orientational order can exist in quasi-1D, and we demonstrate experi-
mentally that such phases with long-range orientational order exist at volume fractions below
maximal packing. Then, we study volume-fraction induced melting of these orientationally or-
dered phases into liquid phases. The orientational order parameters and susceptibilities that char-
acterize these phases and the crossover between phases are measured and analyzed. Coexisting
regions of ordered and disordered states and coexisting ordered domains with different pitch and
chirality are observed. Such coexistence effects suggest the presence of abrupt or discontinuous
volume-fraction driven transitions between the quasi-1D helical structures. Interestingly, these
orientationally ordered phases in quasi-1D share physical features with orientationally ordered
phases observed [51,112,184] and predicted [85,117,173] in 2D.
2.2 Contextual and Theoretical Background
2.2.1 Helical Packing Structures
From the placement of atoms in the alpha helix of a protein molecule, to the placement of
leaves on the stem of a flower, to the pillars of balloons festooning a graduation ceremony,
15

helices of discrete particles are common to find among quasi-linear structures of all sizes. In
the soft matter community, recent work has observed formation of helical structures via self-
assembly of micro- and nano-scale chiral filaments of bent-core molecules [60], and dipolar
Janus particles [56]. Despite the complicated self-assembled nature of such systems, complex
inter-particle interactions need not be required to form helical structures.
In fact, such helical structures are readily formed by isotropic particles confined to the sur-
face or interior of similarly sized cylinders. These structures have been found in experiments
with granular materials [53], foams [9, 10, 132, 133], colloidal suspensions [66, 92, 109, 161]
and carbon fullerenes [75, 171], as well as in computer simulations [33, 46, 61, 84, 131, 167].
When isotropic particles are packed into such a geometry, the resulting placement of particles
at the surface resembles a two-dimensional hexagonal or rhombic packing of circles on a plane
wrapped onto a cylinder (Fig. 2.1). The pitch of these structures at maximal packing is deter-
mined by the ratio of sphere diameter to the diameter of the confining cylinder. For athermal or
close packed structures, hexagonal surface packings occur only at discrete ratios of cylinder and
sphere diameter, with rhombic structures filling intermediate ratio geometries (Fig. 2.2).
A formal notation for distinguishing these geometries was originally developed to describe
phyllotactic structures [37, 53]. Hexagonal surface packings are given a three integer label
(m,n,m + n), while rhombic packings have a two integer label (m,n). These descriptors
include detailed information about the topology and geometry of these packings, and can be
interpreted in several ways. Most simply, if one looks at a single particle in the packing and
labels all other particles in the packing by their relative distance along the cylinder axis direction
z, the descriptor is given by the integers associated with the neighbors of the selected particle
16
(Fig. 2.1).
58
83 5
0
72
3
41
6
83
27
50
5 38
61
4
Figure 2.1: Illustrations depicting the two-dimensional order of a hexagonal(2, 3, 5) structure(left) and a rhombic(3, 5) structure (right). Illustrations on the left demonstrate the three dimen-sional structure (adapted from [37]); illustrations on the right demonstrate the corresponding“unwrapped” two-dimensional structure. Particles on the edge are repeated for clarity. Num-bers indicate relative distance along the tube direction; arrows indicate the wrapping of the 2Dstructured needed to create the corresponding 3D structure.
Equivalently, one can consider these descriptors as similar to the vectors used to describe
the chirality of carbon nanotubes. As mentioned previously, these helical packings can be seen
as a thin slice of a two-dimensional hexagonal (or rhombic) lattice wrapped onto itself into a
cylinder. The integers in the descriptor then describe the path traced along two lattice directions
to reach the particle that the slice wraps itself upon to form the helical packing.
Information about the packing’s chirality can be inferred from these integer descriptors.
Though all packings in these geometries are helices, not all of them are necessarily chiral. Achi-
ral packings have descriptors wherem = 0 or n = 0, indicating that a line of particle contacts,
or parastichy, runs along the circumference of the confining tube, orm = n, indicating that,
in the hexagonal case, one of the parastiches runs along thez-axis of the cylinder. Any other
packing wherem ∕= n has an inherent chirality. Particles with identical topology and opposite
chirality are distinguished by different ordering of the first two integers in the descriptors, e.g.
17

(2,3,5) and (3,2,5).
The integer descriptors also indicate the number of individual particle helices which can be
observed in the packing. As stated previously, each integer in this descriptor indicates a particular
neighboring particle of any particle in the packing, based on its relativez-distance. The helical
line of adjacent particles connecting particle 0 and particlem is referred to as them-parastichy
(in the parlance of phyllotaxis). In a given packing, there will bem distinctm-parastichies;
as such, the smallest integer in the descriptor gives the minimum number of particle helices
which can characterize a packing. For example, in a (1,3,4) packing, a 1-parastichy characterizes
the entire packing, while the minimum number of distinct helices in a (2,3,5) packing are two
interlacing 2-parastichies.
Though this integer descriptor yields a decent amount of information about these packings,
they do not by themselves serve to describe every geometrical quantity. To learn the ratio of par-
ticle diameter/separation to cylinder diameter, or the angular pitch of a particular parastichy/helix
in the packing, one needs additional information. From the integers described above, one can
construct a relationship to describe additional geometrical parameters. For example, follow-
ing [53], one can relatem andn to the divergence angle� (the relative angle separating neigh-
boring particles in cylindrical coordinates) by the following relation:
(m+ n)(n−m)
m(m+ 2n)=sin(12(m+ n)�)sin(12 (n−m)�)
sin(12(m+ 2n)�)sin(12m�). (2.1)
Though the above equation is not analytically solvable, numerical solutions of such equa-
tions yield well-defined geometrical characteristics for each packing which are consistent with
experimental studies.
18

1 1.51.25
(022) (123) (033) (224) (134) (044) (235)
(2,3)
(1,3)
(2,2)
(3,4)
(2,4)R
ho
mb
icH
ex
D/d sep
Figure 2.2: Illustration of possible ratios of inter-particle seperationdsep and packing diameterD (Fig. 2.13) at close packing for hexagonal and rhombic helical configurations (based on datafrom [37,53]).
2.2.2 Transformations of Helical Structures
Movement of athermal particles in dense packings confined to a cylindrical boundary which is
stretched or compressed yields information about how helical packings can change pitch and
chirality [53]. Transformations between different helical structures in such systems can occur as
continuous deformations mediated through an intermediate rhombic phase, or as discontinuous
changes in structure mediated by defects. In either case, the transformations adhere to rules
related to the topology of packings.
Continuous transformations between such packings are mediated by deformations of the
hexagonal structure through an intermediate rhombic phase. Generally, a (m, n,m+n) packing
can transform to a packing sharing two of the same integers. For example, the (2, 3, 5) packing
depicted in Fig. 2.1 can deform continuously to a (3, 5, 8) packing through an intermediate
rhombic (3, 5) packing. During this transformation, particles 0 and 3 (along the 3-parastichy)
and particles 0 and 5 (along the 5-parastichy) remain in contact. As the contact between the
particles labeled 0 and 2 is broken and these pairs move apart, the 0 and 8 particles move closer
19

together, until they come into contact. During this deformation, the particle packing continuously
increases in diameter. In terms of the two-dimensional “unwrapping” of these packings, this
deformation can be considered as the continuous stretching of a rhombic packing along the
azimuthal direction. Through such deformations, any (m, n,m+ n) packing can transform to a
(n,m+n,m+2n) through an intermediate rhombic (n,m+n) packing, or to a (n−m,m, n)
packing through an intermediate rhombic (m, n) packing.
Discontinuous transformations between helical packings are mediated by the propagation of
defects. Consistent with a conceptual understanding of these geometries as wrapped packings of
2D hexagonal lattices, a defect in this system consists of a dislocation, or a pair of particles with 5
and 7 nearest neighbors. A dislocation moving through one of these packings will cause a change
in the orientation in the local hexagonal orientation, or equivalently, a change in the packing
structure (as depicted in Fig. 2.3). Dislocations can thus mediate a change in a (m,n,m + n)
structure to a (m± 1, n,m+ n±1), (m,n ± 1,m+ n±1), or (m± 1, n ∓ 1,m+ n) packing.
112022
123
224 033
134
044235145
055336
246156
066347257
167077
213
325
437
Incr
ea
sin
g D
/a
Figure 2.3: (Left) Possible transformations between helical, hexagonally ordered states mediatedby dislocation motion (adapted from [53]), arranged by ratio of packing diameterD to particleradiusa at close packing. (Right) “Unwrapped” structure of a helical packing transitioningbetween a (2, 3, 5) (bottom, blue circles) and a (1, 4, 5) packing (top, purple circles) via motionof a 5-7 dislocation pair (yellow circles).
20

Though these aforementioned transformations are geometrically intuitive, they may not de-
scribe all physical systems. For example, they often necessitate dramatic changes in packing di-
ameter or linear particle density, and they may completely skip over phases which might be more
energetically favorable given the confining geometries. Indeed, simulations indicate that transi-
tions in thermal packings of spheres in cylinders are mediated by different mechanisms [61].
2.2.3 Phase Transitions
In the study of condensed matter physics, the crossover between states of different degrees of or-
der and symmetry is a fundamental and important field of study. The physics of such crossovers
is particularly interesting when the transition between two states exhibits some discontinuity in
free energy, often reflected by a discontinuous change in order parameter. Such an occurrence
is known as aphase transition. Though the term phase transition might be used informally by
a layperson to indicate a gradual change in matter, its use in the physics community specifically
indicates crossovers exhibiting some discontinuity in free energy or order.
Phase transitions are typically categorized as first or second order. First order phase transi-
tions exhibit a discontinuous jump in free energy/order with temperature as the system moves
between phases. Consequently, these transitions are characterized by a latent heat which is
absorbed/released by the system. Additionally, an additional hallmark of first order phase transi-
tions is the stable coexistence of phases. A common physical example used to illustrate discon-
tinuous transitions is the phase behavior of water between its vapor and liquid states or its liquid
and ice states.
Second order phase transitions, on the other hand, exhibit a continuous change in free energy
or order with temperature. However, therate of change in free energy or order parameter with
21

temperature will change discontinuously at the transition temperature. As there is no latent heat
in this type of transition, phase coexistence is not observed. These transitions are characterized
by a divergence in the susceptibility of the order parameter at the transition temperature (in first
order transitions, the susceptibility of the order parameter jumps discontinuously). A common
example of continuous phase transitions is the ferromagnetic transition, as is captured by the 2D
Ising model.
Ord
er
Pa
ram
ete
rS
usc
ep
�b
ilit
y
Ord
er
Pa
ram
ete
rS
usc
ep
�b
ilit
y
Temperature Temperature
Tc Tc
Figure 2.4: Qualitative illustrations of behavior of order parameters and associated susceptibili-ties with temperature in discontinuous 1st order (left) and continuous 2nd order phase transitions(right).
2.2.3.1 Phase Transitions, Long Range Order and Dimensionality
Phase transitions and the stability of long range order are properties of packings closely tied
to dimensionality. In three dimensions, it is well known that crystalline particle packings have
long-range translational and orientational order. In colloidal systems, evidence of the first-order
solid-fluid transition is seen as fluid-solid coexistence in ordered packings [1,3,41,135,136,190].
Phase transitions and long-range order in two-dimensional packings are more complex and
22

are not entirely understood. There are several proposed mechanisms for melting in two di-
mensions, including grain-boundary induced melting [21, 81], or geometrical defect condensa-
tion [44], but the most widely-cited theory for phase transitions of packings in two dimensions
is known as Kosterlitz-Thouless-Halperin-Nelson-Young (KTHNY) theory [85, 117, 173]. In
this framework, ordered two dimensional solids experience a two-step melting process. At low
temperatures, the two-dimensional crystal phase is stable; this phase has quasi-long-range trans-
lational order (which decays algebraically with distance or system size), and long-range orienta-
tional order. Then, above some transition temperatureTm, thermally activated dislocation pairs
break into free dislocations, destroying translational order. Interestingly, however, the system
still retains quasi-long-range orientational order, and is thus termed the “hexatic” phase. Fi-
nally, above a second higher transition temperatureTi, the free dislocations dissociate into free
disclinations, destroying orientational order, and leading to an entirely disordered isotropic fluid
phase. These effects were first observed experimentally by [112]. Relatively more recently, the
two-step melting processes have been clearly observed in systems of colloidal particles interact-
ing via long-range repulsive dipolar forces [184] and colloidal particle systems with short range
repulsive interactions so that the transition is purely mediated by volume-fraction [51], though
the exact order of these transitions is not necessarily clear [51].
It is perhaps common knowledge (among condensed matter physicists) that an infinite one-
dimensional system of particles does not exhibit a stable translationally ordered phase, nor a
true phase transition. Arguments to these effects are typically made by disproving the stabil-
ity of a long-range ordered phase to thermal fluctuations, or by showing that there cannot be
discontinuous change in free energy between ordered and disordered phases.
23

The most well-known argument against 1D phase transitions comes from the work of van
Hove [162]. To paraphrase a critique of this work by [27]: this argument is carried out by
treating a 1D system of pair-wise interacting hard-core particles as an eigenvalue problem. Af-
ter re-writing the system’s partition function as a transfer operator, van Hove finds its largest
eigenvalue, which turns out to be the only relevant contributor to the free energy of the system.
Using functional analysis, van Hove demonstrates that this free energy can be written as an ana-
lytic function of temperature. As phase transitions by their very definition need to exhibit some
discontinuity in free energy, this effectively disproves the presence of a phase transition in this
system.
Another famous argument, originally made by Peierls, indicates that a one-dimensional sys-
tem can not exhibit stable long-range translational order. Following [125] and [16], we imagine a
one-dimensional line of particles spaced evenly, with an inter-particle spacinga, and we assume
a harmonic interaction between particles. In this case, when thenth particle in the chain deviates
from its equilibrium position byun, it will have an increase in energy,U , defined by
U =1
2Ku2n. (2.2)
Here,K acts as a stiffness constant defining energy/force relationships to a stretched spring
between particles. That is, a particle moved from its equilibrium position byun will experience
a restoring forcef = −Kun. K is related to the Young’s modulusY ; a forceF applied to
a such chain ofN particles of lengthL = Na will cause a change in lengthΔL, given by
F = YΔL/L, whereY = KL. Decomposing these displacements into normal modes of the
24

periodic array, we can write
un =∑
q
cqeiqna. (2.3)
Here theq denote different normal modes of the system; q is the wavenumber of the wave-
like phonon modes for the described periodic chain or particles. Using this expansion, we can
evaluate the average squared difference in fluctuations of particles separated by a distancena.
By implementing equipartition theory, and also assuming a chain long enough so that we can
make contiunuum approximations, we find the mean-squared difference in displacements of the
first and thenth particles in the chain, given by
⟨(un − u0)2⟩ ∝ kBT
K
∫
dq
2�
1
q2≈ kBT
Kna, (2.4)
where<> indicates an ensemble average,u0 is the displacement of the first particle in the
chain from its equilibrium position,kB is the Boltzmann constant andT is the temperature
of the system. We see from this relationship that mean square fluctuations from equilibrium
particle positions will increase proportional to the system lengthNa. Thus, long-range periodic
translational order will be unstable to fluctuations in a 1D chain of infinite length, i.e., thermal-
induced fluctuations in position will eventually exceed the lattice spacing. However, we note
that the fluctuations are also directly proportional to temperature and inversely proportional to the
effective spring constant between particles. Thus, these fluctuations will not appear significant in
a chain with inter-particle interactions very strong compared to the temperature and the system
length, that is, whereK >> kBTNa. This could explain the apparent stability of periodic
structures in quasi-1D materials. For example, in carbon nanotubes, the covalent bonds between
25

atoms are strong enough so that the length necessary to observe significant fluctuations in atomic
spacing is longer than the tubes themselves.
Quasi-1D systems are generally not be “immune” to this argument. For example, in a pe-
riodic helix of particles (with the location of particlen at cylindrical coordinates [r,n�0, nz0],
one could perform a similar calculation for fluctuations in both the vertical position of particle
n, zn = nz0, and the angular position of particlen, �n = n�0). In both cases, the integrand in
Equation 2.4 would lead to thermal fluctuations which scale with the length of the chain.
However, as is explored in more detail in section 2.4.3, this growth of fluctuations with
system size is different for particle packingorientation as compared to particleposition. The
robustness of orientational order to fluctuations is due to a coupling of the local orientation of
the packing to the positions of the surrounding particles. To put it in more mathematical terms,
the local orientation� of a particle packing is proportional to a local gradient in the particle
positions; that is,� ∝ ∇ × u. If fluctuations in the local orientation were evaluatated using a
method similar to the one above (as is done in section 2.4.3), then an extra factor ofq arises in
the integrand which (after integration) keeps the fluctuations from diverging with system size.
Furthermore, simulations of simple quasi-1D systems with an orientational degree of freedom
(i.e., rods, ellipses, needles, or rectangles with centers fixed on a one-dimensional line) not
only exhibit long-range orientational order, they imply that a “melted” statewithout long-range
orientational order may not exist for this specific system class [50,70].
As pointed out by [27], arguments against one-dimensional phase transitions and long-range
26

order also do not apply for quasi-1D systems with more complicated interactions, that is, par-
ticles with long-range and cooperative/many-body interactions. For example, in a model de-
scribed in [80], a zipper of N links that can only be opened from one end is one dimensional
system which has been proven to exhibit a phase transition.
Thus, the most appropriate dimensional perspective for approaching ordered helical pack-
ings of colloidal particles in cylinders is not immediately clear. Though the particles are largely
confined to one dimension, it cannot be ignored that these packings have some three dimen-
sional structure. Additionally, the structure of the helical packings, as described in Section 2.2.1,
resembles a two-dimensional hexagonally packed crystal with a very short periodicity in one
dimension.
Finally, the confining cylindrical boundary of these helical packings may also play an im-
portant role in influencing local order and phase behavior. For example, the local orientation of
particles in a three-dimensional crystal grown on a flat surface would couple to the orientation of
said plane. As we discuss in section 2.2.1, the helical pitch (or local packing orientation) of these
structures is strongly coupled to their diameter. Confinement of spheres in a cylinder of fixed
diameter might then bias the preferred pitch of the packing formed within. The curvature of the
confining cylindrical boundary may thus enhance the orientational order of these structures.
Quantification of long-range order and phase behavior in these packings is an important
aspect of the experimental work described later in this chapter. Excitingly, it does seem that we
have found experimental evidence of both long-range orientational order and for discontinuous
phase transition behavior in these helical structures.
27

2.3 Experimental Methods
To study the thermal stability and volume-fraction mediated melting of crystalline helical pack-
ings in cylindrical confinement, we employ a novel experimental system of thermoresponsive
colloidal particles confined to glass microcapillaries. We faced many unique experimental chal-
lenges when assembling, imaging and analyzing this particular system, which are detailed in the
following section.
2.3.1 pNIPAm microspheres
The colloidal particles used in these experiments are aqueous microgels of poly-N-isopropylacrylamide
(pNIPAm). These particles are composed of a sparse crosslinked pNIPAm network; in fact, a
given particle’s mass is only taken up by approximately 3% polymer. As a result, the particles
have soft sphere interactions, deforming under pressure or crowding. This softness makes pNI-
PAm particles quite useful for creating and then controlling dense packings in tight confinement.
In geometries where more commonly used hard-sphere colloidal particles (i.e. polystyrene, poly-
methylmethacrylate) will easily jam, pNIPAm particles will deform, flow and re-arrange. Addi-
tionally, the composition of pNIPAm gives them an index of refraction closely matched to that
of water, making them useful for three dimensional imaging applications.
The primary experimental benefit of pNIPAm microspheres compared to other commonly
used colloids is their thermo-responsive diameter. The polymer pNIPAm undergoes a tempera-
ture induced phase transition in water from being largely hydrophilic to largely hydrophobic at
a lower critical solution temperature (LCST) of32 − 34∘ C. When crosslinked into a microgel
sphere, this results in a swollen, larger-diameter sphere at temperatures below the LCST, and
28

a collapsed, small-diameter sphere at temperatures above the LCST. Approaching the LCST,
the aqueous solvent quality gradually decreases. This effect causes a gradual and predictable
deswelling of the particles, leading to a near-linear change in diameter with temperature. This
predictable and reversible change in particle diameter has led to these particles becoming widely
used in experimental studies of volume-fraction mediated phase behavior [178].
Figure 2.5: Bright field microscopy images of a dense aqueous suspension of pNIPAm micro-gel particles at 25∘C (left) and 28∘C (right). Particles deswell with increasing temperature(as depicted in the illustration insets), decreasing packing fraction, melting the packing from acrystalline packing (left) to an isotropic disordered fluid (right). Scale bar =10�m.
2.3.1.1 pNIPAm Synthesis and Fluorescent Functionalization
The pNIPAm particles used were synthesized using a surfactant-mediated emulsion polymer-
ization method, which has been well characterized elsewhere [100, 127, 140, 178]. In order
to image these particles using fluorescence confocal microscopy, they are functionalized with
a fluorophore. Specifically, an additional copolymer, 2-aminoethylmethacrylate hydrochloride
(AEMA), is added to the pNIPAm microgels during the synthesis process. This provides the
microgels with additional free amine groups, i.e., more than if they were made using NIPAm
monomer alone. After synthesis, the particles are swollen in a suspension of a rhodamine-based
29

fluorescent dye, 5-(6)-carboxytetramethylrhodamine, succinimidyl ester (TAMRA), which cova-
lently bonds to the free amine groups in the microgels. The particles are then thoroughly washed
and re-suspended in an aqueous solution.
2.3.1.2 pNIPAm Particle Diameter Characterization
Though dynamic light scattering is a prolific and useful technique for characterizing the size of
colloidal particles, and it certainly captures the linear changes in particle diameter with tempera-
ture expected for pNIPAm particles, light scattering does not yield a particularly useful diameter
value for characterizing dense colloidal packings. Dynamic light scattering extracts a hydro-
dynamic diameterdℎ for particles, derived from the particle diffusion coefficient,D, which is
measured by laser intensity fluctuations scattered through a dilute suspension of particles and
defined via the Stokes-Einstein relation:
dℎ =kBT
3��D. (2.5)
Here,� is the fluid viscosity. The resulting hydrodynamic diameterdℎ is typically only 80%-
90% of the inter-particle separation observed in close-packed, dynamically arrested packings of
pNIPAm spheres. There are multiple reasons for this difference, including the porous nature of
the pNIPAm particles, as well as the difficulties in defining a discrete “diameter” for a particle
with a soft inter-particle potential.
We derive a more useful “value” of particle diameter from direct microscopic observations of
inter-particle interactions. Dilute suspensions of the same pNIPAm particles used in the helical
packing experiments were placed between glass coverslips such that the gap between coverslips
30

Figure 2.6: Two-dimensional spatial correlation functionsfor the two sizes of pNIPAm micro-spheres (a, smaller, b, larger) used in helical packings experiments at different temperatures in adilute suspension in a quasi-2D cell. Horizontal line indicatesg(r) = 1/e, an effective definitionof sphere diameter. Shoulders ing(r) curves in (a) occur due to the presence of one or two stuckparticles in the field-of-view.
was slightly larger than the diameter of the pNIPAm particles, creating a quasi-2d monolayer.
Videos of these particles diffusing in two dimensions were taken using a 100× oil-immersion
objective (N.A. = 1.4) at five temperatures from 24 to 28∘C. Particle centers were tracked using
standard particle tracking routines [26]. The two dimensional pair correlation functiong(r) of
the particle locations was then calculated from the particle tracks. At each temperature, the
approximate diameter of the particles taken to be the first valuer whereg(r) = 1/e, since, in
the first approximation,g(r) = e−U(r)/kBT , and the effective diameter of particles is often taken
as the value ofr for whichU(r) = kBT .
We take a linear fit of these data points to find a functional relationship between effec-
tive particle diameter and temperature (shown in Fig. 2.7), since previous studies have ob-
served a linear relationship between diameter and temperature for pNIPAm particles in this
temperature range [1, 51, 52, 174, 187]. For the larger species used in this experiment, we find
the relationshipdeff = 2.52�m−0.037(�m/∘C) × T , and for the smaller species, we find
31

deff = 2.41�m−0.054(�m/∘C)× T .
Figure 2.7: Approximate diameters for the smaller (blue∙) and larger (red▲) pNIPAm particlesused in helical packing experiments at different temperatures, with linear fits.
2.3.2 Microtube Geometry and Sample Configuration
We create glass microtubes through a multi-step stretching process. We start with borosilicate
tubes with outer diameter of 5 mm and inner diameter of 1 mm. We heat and melt this tube
over a propane / oxygen flame, remove the tube from the flame, and stretch the glass quickly
by hand. This stretching extends a several centimeter-long region to a length of several feet.
This thinner tube is then stretched a second time on a micropipette puller (Sutter Instrument
Co.). This process creates a final tube with an outer diameter of 20-100�m, and an inner
diameter of one to several�m. The final inner diameter of the tube depends largely on the fine
details of the pulling process. Though micron-sized capillaries can surely be made in an easier
manner, this multi-step melting and pulling process serves to clean the inner diameter of the tube
32
through repeated melting which prevents aggregation of the pNIPAm particles on the walls of
the capillary (pNIPAm microgels tend to irreversibly stick to untreated glass surfaces).
A dense suspension of pNIPAm microspheres is then carefully loaded into a glass microcap-
illary. After a second round of pulling, the ends of each capillary are broken such that the newly
pulled area with outer diameter of approximately 100�m is left with slightly thicker ends (outer
diameter approximately 1 mm). One of these ends is connected to a vacuum pump, while the
other end is immersed in a dense suspension of pNIPAm microspheres (� > 0.3). The vacuum
draws in the pNIPAm suspension until the capillary is entirely filled (≈ 10 minutes). After fill-
ing, the thick ends of the capillary are broken, and it is placed on a glass microscope slide. It
is completely covered with UV-curable epoxy and a large glass coverslip. This seals the ends
of the tube, prevents evaporation of the sample, creates a refractive-index matched geometry,
and restricts movement of the hair-thin capillary. The temperature of the sample is then cycled
from room temperature (22 - 25∘C) to 29∘C multiple times over a period of several hours. This
permits jammed areas of the microsphere packing to melt and re-form and thereby converge to
an equilibrium configuration.
2.3.3 Fluorescence Confocal Microscopy
In the following subsection, we discuss the advantages and drawbacks of several fluorescence
confocal microscopy methodologies for acquiring three-dimensional images of the helical col-
loidal packings.
33

2.3.3.1 Background on Confocal Microscopy
Confocal microscopy has existed for nearly a half century, though decades of engineering and
analysis have yielded many improvements with respect to speed and, to a lesser extent, resolu-
tion [111,124]. The distinguishing feature of a confocal microscope is the presence of a pinhole
in front of the detector. This pinhole is located at a conjugate focal point, or “confocal” point,
of the focal point located in the sample. This pinhole blocks light emitted from an out-of-focus
plane, thereby improving the axial resolution of images and blocking background fluorescence.
In addition, the existence of the confocal pinhole greatly improves the in-plane (lateral) resolu-
tion of the image, making confocal microscopy ideal for a variety of high-resolution scanning
techniques.
The original confocal setup used a stage-scanning mechanism to create complete images; the
sample was moved to expose its entire volume to a single illumination point. This mechanism
not only hindered the speed of scanning, but the rapid motion of the stage can interfere with the
sample. Since confocal microscopy techniques are extensively used to image fragile biological
samples, most modern commercial confocal systems use techniques which involve scanning
the illumination point/apertures, rather than the sample. These can be generally categorized as
either spinning disk/tandem scanning confocal microscopes (TSM), or confocal laser-scanning
microscopes (CLSM).
Tandem-scanning confocal microscopy was first developed by Egger and Petran in 1967.
This technique was based off a variation of an early video-formation technique developed by
Paul Nipkow in 1884, the Nipkow disk. This disk contains a series of pinholes distributed at
uniform angular and radial spacing; when placed in front of an image, a single rotation of this
34

disk allows a full scan of the image, converting the original two-dimensional image into a one
dimensional series of intensities. The revised Nipkow/Petran disk used in TSM is employed in
place of the single confocal aperture in the confocal microscope. Though the confocal image is
taken only in discrete points, the spinning of the disk allows a fullxy scan of the image, and the
distribution of the pinholes enables multiple points to be imaged in tandem. The development of
this scanning technique led to an exponential increase in the scanning speed compared to other
confocal microscopes at the time, providing video-rate image sampling (30 frames/sec).
Confocal laser-scanning microscopy (CLSM) is a more recent technology that utilizes a
single confocal pinhole (or, in some cases, a slit), but employs mirrors to shift the lateral position
of the focused beam within the sample. Though this seems like a more sophisticated technology
than TSM, CLSM has both relative advantages and disadvantages compared to spinning-disk
microscopies. CLSM is often preferred in biological applications, since it has a much higher
lateral and axial resolution than spinning-disk methods due to its use of a single pinhole. In
addition, since an entire beam is focused to a single point on a sample, CLSM has much more
efficient illumination than TSM. Historically, most CLSM setups provided much slower scans
than TSM, but increased innovations have given CLSM setups faster scanning speeds over the
past decade or so. However, the increased intensity of the excitation beam can result in dye
saturation, which decreases the relative fluorescence of the in-focus plane. In addition, since
they require high-quality lasers, CLSM setups typically cost several orders of magnitude more
than spinning-disk optical systems (which don’t require laser sources, though they are often
required for quality fluorescence images).
35

epoxy
glass
glass
pNIPAm
suspension
glass
y
xv
a b c
xz
y
x
Figure 2.8: Imaging artifacts from confocal scans of helicalpackings. (a) Illustration of anxycross-section of the experimental configuration (not to scale). (b) Brightness of a confocal scanof a (2, 3, 5) packing averaged along the tube length (z direction) Inset: expectedxy brightnessdistribution with perfect imaging, given placement of particles in helical packing outlined bydotted lines. (c)xz slices of a confocal scan of the same (2, 3, 5) packing close to the objective(bottom), at the middle of the packing (middle) and far from the objective (top).
2.3.3.2 Advantages and Disadvantages of TSM and CLSM
Though both TSM and CLSM setups were available in our laboratory, our TSM setup (QLC-
100, Visitech Int.) provided slightly higher quality images and video compared to our CLSM
system (VT-Eye, Visitech Int.) for this particular geometry of microgel packings in cylinders.
This difference may seem counterintuitive, considering the increased sophistication and newness
of the CLSM system, but there are a few potential explanations. As previously mentioned, the
CLSM setup requires higher intensity sample illumination, and it was thus more prone to cause
photobleaching in our samples, which was problematic when trying to track particle dynamics
in real-time videos that lasted for at least several minutes.
Additionally, aberrations in the three-dimensional structure apparent in all confocal images
were amplified in the CLSM scans. Though the microcapillary was immersed in index-matched
UV epoxy, the index mismatched, highly curved boundary between the glass tube (n = 1.52)
and the interior aqueous suspension (n = 1.33), as well as a slight index mismatch between
36

pNIPAm particles and the surrounding aqueous media, caused significant distortions in scans
for three-dimensional structure. As mentioned previously, TSM utilizes multiple pinpoints of
light passing straight though the sample, while CLSM utilizes a single point, or line of light,
coming into the sample at an angle. In an index-matched and/or isotropic geometry, there should
not be a difference in these imaging techniques. However, as shown in the imaging of the
fluorescent surface of a polystyrene bead in Fig. 2.9 [87], differences in the imaging of curved,
index mismatched interfaces are apparent.
z
x
a
b
c
z
x
z
y
z
y
d
Figure 2.9: Confocal scans of a 6�m polystyrene bead with a fluorescent shell, comparingTSM (a-b) and CLSM (c-d) scanning methods (taken from [87]). Note the slightly increaseddeformation from the expected circular shape in the CLSM images.
37

2.4 Results and Analysis
2.4.1 Characterization of 3D Structure
At high densities (low temperature), we observe crystalline helical packings with varying pitch
and chirality dependent upon particle- and tube-diameter. The observation of large ordered do-
mains is consistent with the tendency for these nearly monodisperse particles to form uniform
crystals in 2D [51] and 3D [1].
We analyze the three-dimensional structure of these packings from the particle center loca-
tions tracked to subpixel resolution from tandem-scanning/spinning disk confocal fluorescence
microscopy scans using common particle tracking routines [26]. There are some imaging aberra-
tions from highly curved, index mismatched interfaces in these samples. One of these aberrations
results in a slight stretching of the image in the vertical (scan) direction, which we correct by es-
timating the extent of the tube packing in they direction and then re-scaling it to the extent of the
packing image in thex direction. Tracking using just the routine defined in [26] is not sufficient
to locate particle centroids; increasing the contrast and defining a brightness threshold is usually
necessary to distinguish between the individual particles in packings this dense. Even with these
corrections, due to the inherent difficulties of 3D confocal imaging of index mismatched tubes,
some particles furthest from the objective are not detected by this algorithm.
Though the 3D tracking is not completely precise, it does yield sufficient information to
identify important structural parameters in these packings. The average inter-particle spacing
dsep is determined from the 3D pair correlation function,g(r). Since each structure contains
approximately100 particles, the resolution of this correlation function is fairly poor. Thus, we
determinedsep by fitting a Lorentz peak,f(r) = f0 +A(!/(4(r − r0)2 + !2)) to the first peak
38

(224)
(134)
(235)
(145)
(336)
(055)
Figure 2.10: Confocal fluorescence cross-sections of six observed geometries of pNIPAm pack-ings in microcapillaries (indicated by (m,n,m + n) notation), along with corresponding re-constructions from particle locations determined using centroid-locating algorithms on full 3Dconfocal scans.
in g(r) (see Fig. 2.11). The center of this function,r0, gives us the values fordsep. The value for
structure diameterD was taken as twice the average value of the radial positions of the particles
in the structure in cylindrical coordinates, with the center of the tube given by the averagex and
y positions of the particles. Note, this parameter is not thetube inner diameter; the tube diameter
Dtube is related to the structure diameterD and the effective diameter of spheres in the tubedeff
byDtube = D + deff . The relationship betweenD, dsep anddeff is illustrated in Fig. 2.13.
We use 3D positions of particles to identify packings by the sets of phyllotactic integers
(m,n,m+ n) described in Section 2.2.1. As mentioned previously, particles in hard-sphere he-
lical packings predicted for cylinders [5] have six nearest neighbors whose relative order along
the tube axis corresponds to a characteristic set of three integers (m,n,m + n). The indices
indicate the unit vectors in the unwrapped triangular lattice connecting any point to itself in the
helical structure. Alternatively, one notices that the three indices indicate the relative distance
39

Figure 2.11: 3D pair correlation function from positions of≈ 1.7�m colloidal pNIPAm spheresin a (2,3,5) packing. First peak ing(r) highlighted in red, with Lorentzian peak fit used to deter-minedsep is the blue dashed line. The vertical dotted line indicates cutoff for nearest neighbordetermination.
of a particle’s nearest neighbors along the axis of the cylinder. For example, if any given parti-
cle’s nearest neighbors are the second, third or fifth closest particles in the axial direction, it is
described as a (2,3,5) packing.
We use this latter definition of the phyllotactic indices to categorize the structures. Af-
ter identifying particle centers in 3D using common particle tracking routines [26], the nearest
neighbors of each particle in an image are identified as those closer than the far end of the first
maximum in the 3D pair correlation functiong(r) (see Fig. 2.11). After an individual particle
in the packing is selected, all other particles are given integer values based on the order of their
axial distance from the selected particle in either direction. The integer values of the nearest
neighbors are then recorded. This process is repeated for every particle in the structure. This
creates histograms of the relative axial order of the neighboring particles. The peaks in these
histograms then identify the integers(m,n,m+ n) describing the ideal packing (Fig. 2.12).
We observe all varieties of predicted helical packings with a tube-diameter-to-particle-spacing
40

ab
Figure 2.12: Example of determination of helical structuralintegers (m,n,m + n). (a) Axialand azimuthal positions of tracked particles in a short axial section. The nearest neighbors ofthe green particle are highlighted in blue. Relative axial distance from the green particle listedto side. Note that the nearest neighbors have relative axial order of 2, 3 and 5. (b) Histogram ofrelative axial order for 1st, 2nd and 3rd closest nearest neighbors in the axial direction in a singlepacking. Peaks at values of 2, 3 and 5 indicate that this is a (2,3,5) packing.
41

ratioD/dsep < 3 in 15 samples (Fig. 2.13), with the exception of the structure (0,4,4). The ratio
D/dsep fell within experimental error of the predicted maximally packed hard-sphere values.
Granted, the experimental error is fairly large, but this error is mostly due to the artifacts of
confocal scanning of an optically distorted sample.
Figure 2.13: Geometrical characteristics of observed structures, (2,2,4) (blue□), (1,3,4) (purple∘), (2,3,5) (green△), (1,4,5) (cyan▽), (0,5,5) (red♢), (3,3,6) (dark green★). Filled symbolsindicate structures with observable Brownian motion. Dashed vertical lines indicate theoreti-cal D/dsep values for predicted structures. Inset: Cartoon of axial cross-section of a (3,3,6)structure withdsep > deff.
Importantly, ordered structures were found to exist over a range of volume fractions below
maximal packing. When the effective particle diameterdeff was such thatdsep/deff < 0.95,
the particles did not appear to move (i.e., motions greater than 0.2�m were not observed during
the 10-second 3D confocal scan). In such cases, we consider the particles to be packed closer
than their effective diameters. Fordsep/deff > 0.95, particles fluctuate significantly about their
equilibrium positions. Though helical structures have been observed in many athermal systems
(i.e. foams, granular packings, etc), we believe our observations to be the first direct observation
42

of thermal helical crystalline structures existing at volume fractions below close packing.
2.4.2 Long-Range Orientational Order in Achiral Packings
The volume fractions of such samples were lowered further to determine how the packings trans-
form to isotropic states. Two uniformly ordered achiral packings were chosen and are presented
here for careful analysis: a (2,2,4) packing of larger microspheres (deff ≈ 1.71�m at 22∘C) and
a (0,6,6) packing of smaller microspheres (deff ≈ 1.23�m at 22∘C). The sample temperature
was increased in steps of 0.2 - 0.7∘C. At each temperature step, after allotting ample time for
the sample to reach thermal equilibrium (e.g., at least 5 minutes), videos of two-dimensional
cross-sections of the packings were taken at 15 - 30 frames per second for approximately 5 min-
utes. Though these two-dimensional videos lose some of the structural information available in
three dimensional scans, they provide data at much higher speeds and yield better axial position
tracking of particles in view.
A local orientational order parameter, 6j =∑Nnn
k e6i�jk/Nnn, quantifies helical order in
these systems. Here,�jk is the angle between the axis of the tube and the bond between particles
j andk, andNnn is the number of nearest neighbors of particlej. Though this order parameter
is typically used for two-dimensional planar systems, it is acceptable to use in the analysis of
two-dimensional slices of helical packings. Helical packings are effectively two-dimensional
triangular lattices wrapped onto cylinders, and the observed cross-sections of these particular
packings exhibit only slight variation from the ideal two-dimensional hexagonal lattice.
We examined the spatial extent of orientational order along the tube by calculating the orien-
tational spatial correlation function,g6(z = ∣zj−zk∣) = ⟨ ∗6j 6k⟩, wherezj is the axial position
of particlej. As depicted in Fig. 2.14, the resulting correlation functions decrease quickly at low
43

volume fractions, as expected in a disordered state. However, at high volume fractions, these
functions exhibit long-range order within the experiment’s field of view. These experimental
observations are consistent with an expectation of long-range orientational order. Granted, the
finite size of the system restricts observations of correlations beyond much more than an order
of magnitude is separation distance, so it is difficult to declare with certainty that these corre-
lation functions do not drop off exponentially at longer distances, or decay algebraically (as is
the case with quasi-long-range orientaional order in 2D hexatic phases). However, though long-
rangetranslational order is impossible in a one dimensional system at finite temperature [162],
as discussed in Section 2.2.3, long-rangeorientational order could be possible, just as it is in the
much-storied theory of two-dimensional melting [117].
Figure 2.14: Local maxima of orientational spatial correlation function g6(z) for sampleswith (2,2,4) packing (a) and (0,6,6) packing (b). Dashed lines: Full correlation function at�/�max(224) = 0.86 and 0.63 (a) and�/�max(066) = 0.64 and 0.36 (b), where�max is themaximum volume fraction for a given packing of hard spheres with the observed particle spac-ing. Empty symbols indicate samples with short-range order. Oscillations arise from the periodicdistribution of particle positions along the tube axis. Full correlation functions were calculatedfor all volume fractions, but omitted for the sake of clarity.
To our knowledge, the existence of long-range orientational order has not been character-
ized in previous studies of packing in cylindrical systems [33, 46, 61, 84, 131]. At low volume
44

fractions, one expects long-range orientational correlations to disappear, and this behavior is
observed in our experiment. It is important to consider, however, that this analysis requires a
2D projection of a three-dimensional structure. Since our three dimensional confocal imaging
is rather limited, it is difficult to tell the exact degree to which these particles are localized to
the surface of the cylinder. Thus, we emphasize that further analysis of the three-dimensional
structure would elucidate whether a generalization of the two-dimensional KTHNY theory [117]
is truly appropriate for this system.
We also note that, though the observed correlation functions are persuasive evidence for
long-range orientational order, the true nature of this ordering could be quite complicated. For
example, the orientational order might just persist in this system to outside the scope of the
experimental field of view, and thus might not actually be truly long-ranged. Or, if it is truly
long-range, orientational order could be enhanced, by interactions of the packings with the highly
curved boundary. As mentioned in section 2.2.1, the helical structures we observe have a very
well-defined geometrical relationship between packing diameters and pitch (which is related to
the local packing orientation). Thus, the diameter of the confining tube could be considered as
an “ordering field”, causing a preference for packings with a certain local orientation.
2.4.3 Theoretical Model for Long-Range Orientational Order in Helical Packings
Here we now present a theoretical argument, which was worked out largely by B. G. Chen with
guidance from Prof. R. Kamien, wherein we show that long-range orientational order could
persist even in this quasi-one-dimensional system. We do this by evaluating the orientational
correlation functiong6(r) using the isotropic elasticity free energy [117] in an “unwrapping” of
the particles on the cylinder surface onto a two-dimensional infinitely long strip. We assume that
45

particles are packed densely enough so that fluctuations along the radial direction of the cylinder
may be neglected. In this discussion, we refer to the direction along the length of the cylinder as
thex direction. Asx → ∞, g6 approaches a constant. Thus, finite correlations exist at infinite
distance, a hallmark of a phase with long-range order.
The above argument is performed by following the same strategy used by Nelson and Halperin
in [117], but this time applied to a quasi-one-dimensional system to show that there is long-
range orientational order in such systems at low temperatures. The system we consider is a
two-dimensional box which is infinite in thex direction and periodic with lengthL in the y
direction. Note that such a system applies to the problem of spherical particles in a cylinder
if we assume that at high densities, the outer layer of spheres in the cylinder behave as if they
were disks lying in a two-dimensional strip with periodic boundary conditions – that is, we “un-
wrap” the spheres onto a plane and neglect the radial (which become out-of-plane) fluctuations.
This maps 6 defined in the quasi-one-dimensional system approximately onto the 6 that was
measured on the surface of the cylinder.
We calculate a few quantities in the low-temperature (“solid” phase) by using an isotropic
Lame elasticity free energy. The following expression is appropriate for the elasticity of a trian-
gular lattice with the given geometry:
F =1
2
∫ ∞
−∞dx
∫ L
0dy[
�u2ii + 2�uijuij]
(2.6)
Hereuij = 12 (∂iuj + ∂jui) is the displacement from the (zero-temperature, hexagonal)
ordered state. This free energy assumes that there exist nonzero elastic moduli� and�, a natural
assumption we must make.
46

As in two-dimensions, at finite temperatures, there can be no long-range positional order
in this system, so fluctuations drive the correlations of G = eiG⋅u (the density amplitude at
reciprocal lattice vectorG) to zero at largex. This can be seen by evaluating⟨ G(x) ∗G(0)⟩:
⟨ G(x) ∗G(0)⟩ = ⟨eiG⋅(u(x)−u(0))⟩
= exp(
−G2[⟨u(0)2⟩ − ⟨u(x)u(0)⟩])
= exp
(
−G2kBT
L
N∑
n=−N
∫ Λ
−Λ
dqx2�
)
. (2.7)
To calculate the correlation function of orientational order, we first define 6 = e6i�, where
� measures the bond angles between nearest neighbor particles (the factor of 6 arises from the
triangular symmetry of the lattice). Furthermore, we will use the fact that the angle� can be
shown to be12∇× u.
The fact that the theory is quadratic allows us to take two shortcuts. First, we can evaluate
⟨ 6(r) ∗6(0)⟩ (wherer = (x, y)) as the exponential of an average. Second, this average can
be evaluated simply since the inverse of the elasticity dynamical matrix is known [6,8] to be
D−1jn =
{
1�q2
(
�jn − qjqnq2
)
+ 1�+2�
qjqnq4
}
.
It may be worthwhile to point out that we can guess the result from “counting powers of
q”. We can see that translational order is destroyed in this system by estimating the scaling
of the (Fourier-space) correlation function ofu at low q. To do this, we integrateD−1jn in one
dimension. ButD−1jn scales asq−2, so the result
∫
q−2dq scales like1/q. This diverges at lowq,
meaning that long-wavelength fluctuations drive positional correlations to zero.
47

However, since� is related to thederivative of u, the (Fourier-space) correlation function of
� will involve an extra factor ofq for each� = ∇× u. We thus expect the two-point correlation
function to scale as∫
dq(q2)(q−2) ∼ q, which is finite at lowq, indicating long-range order at
infinity.
We now proceed with a more detailed calculation of the real-space orientational order corre-
lation function:
⟨ 6(r) ∗6(0)⟩ = exp[−36(⟨�2(0)⟩ − ⟨�(r)�(0)⟩)]
= exp
[
−9kBT
2�L�ij�mn
N∑
n=−N
∫ Λ
−Λdqxqiqm
(
1− ei(qxx+2�ny/L))
D−1jn
]
= exp
[
−9kBT
2��L
N∑
n=−N
∫ Λ
−Λdqx
(
1− ei(qxx+2�ny/L))
]
= exp
[
−9kBT
2��L
N∑
n=−N
(
2Λ− ei2�ny/LeiΛx − e−iΛx
ix
)
]
= exp
[
−9kBT
2��L
(
2Λ(2N + 1)− sin(2�(N + 1/2)y/L)
sin(�y/L)
2 sin(Λx)
x
)]
. (2.8)
We now let the cutoffΛ be2�(N + 1/2)/L and use the sinc function (sinct = (sin t)/t):
⟨ 6(r) 6(0)⟩ = exp
[
−9kBT
�2�
(
Λ2 − Λ2�y
L
sin(Λy)
sin(�y/L)Λy
sin(Λx)
Λx
)]
= exp
[
−9kBTΛ2
�2�
(
1− sinc(Λx)sinc(Λy)sinc(�y/L)
)]
. (2.9)
48

For largex, this quantity approaches the constantexp(
−9kBTΛ2
�2�
)
, and hence this quasi-
one-dimensional system has long-range orientational order. This result suggests that our experi-
mentally observed long-range correlations in the orientational order parameter at high densities
are real.
We emphasize that the above relation should not be fit to experimental or simulation data
in the present form for the following reasons. First, the elastic field theory describes the sphere
systems at large wavelengths. This approach is fine for the purposes of searching for long-range
orientational order, but it is inappropriate for extraction of quantitative correlation functions.
Another issue is that the precise functional form of the above relation arises from the cutoff
scheme chosen. Ideally, one would apply a physical theory which describes the higher wave-
length modes and how the system responds to them (in the case of spheres, part of this scheme
could be a density functional-like theory), which would be more suitable for capturing the be-
havior of the correlation function over short distances than the hard cutoff that we used. Thus the
primary experimentally accessible result for comparison to theory is the fact that the correlation
function remains finite at infinity.
2.4.4 Orientational Order Parameter, Susceptibility, and Evidence of a Phase
Transition in Experiment
To quantify the crossover from long-range to short-range order in the experimental system, an
average orientational order parameter∣ 6∣ is defined for each frame, where 6 = 1N
∑Nj 6j .
The height of the first peak of the one-dimensional axial structure factorS(kmax), whereS(k) =
[N(N − 1)]−1∣
∣
∑∑
eik∣zl−zm∣∣
∣, is used as a translational order parameter. Here,z denotes the
49

axial position of each particle,N is the number of particles in the field of view at a given time,
andkmax is chosen iteratively for each volume fraction.
Figure 2.15: Top: Mean values of translational (red▼) and orientational (blue■) order parame-ters for (a) (2,2,4) and (b) (0,6,6) samples. Bottom: Orientational susceptibilities for (c) (2,2,4)and (d) (0,6,6) systems, for sample size = 75�m (∘) and =∞ (∙). Dashed vertical lines at�/�max(224) = 0.67 and�/�max(066) = 0.38.
In Fig. 2.15, it is evident that both the average translational and orientational order param-
eters cross from an ordered state at high volume fraction to a disordered state at low volume
fraction, though the change in∣ 6∣ is significantly sharper than the change inS(kmax). The
orientational crossover complements a recent simulation which finds a similar crossover in hard
sphere packings with decreasing density [33].
While such order parameters help to qualitatively identify a crossover, this type of analysis
by itself is sensitive to finite-size and finite-time ambiguities. Previous work has shown that
fluctuations in order parameter are more useful for identifying phase transition points and are
50
therefore less susceptible to such finite-size effects [51].To characterize fluctuations in orien-
tational order, we calculate the orientational susceptibility,�6 = ⟨∣ 6∣2⟩ − ⟨∣ 6∣⟩2, where⟨⟩
represents the time average. Statistical effects of the finite size of the system are accounted for
by calculating the susceptibility of different sub-segments of lengthL in the system and extrap-
olating to the limitL → ∞, similiar to the calculations in [51]. Specifically, we calculated
�6 in different size sub-boxes within the sample and extrapolated to�6∞, thus attaining the
thermodynamic limit.
Plots of�6 and�6∞ in Fig. 2.15 clearly demonstrate a peak in the orientational susceptibility.
The location of this peak coincides with the onset of both orientational and translational order in
the system. Translational susceptibilities were also calculated, but did not exhibit clear peaks or
trends with respect to the order parameters or volume fraction. We do not expect any transition-
like behavior from translational susceptibilities, due to arguments from [162] against long-range
translational order, which apply in quasi-1D.
The existence of a diverging susceptibility of an order parameter typically indicates a phase
transition [70]. However, it is difficult from the given data points to determine if this data truly
diverges, and whether this divergence would indicate a first-order (asymmetrically diverging at
different temperatures from either side) or second-order (symmetrically diverging at one tem-
perature) phase transition. One of the most obvious indicators distinguishing a first-order and
second order transition is the existence of stable coexistence between ordered and disordered
phases. Qualitative observation of the melting of these packings shows evidence of more and
less ordered states coexisting. However, quantification of structural order parameters does not
show distinct regions quite as easily. Specifically, the local magnitude of the the orientational
51
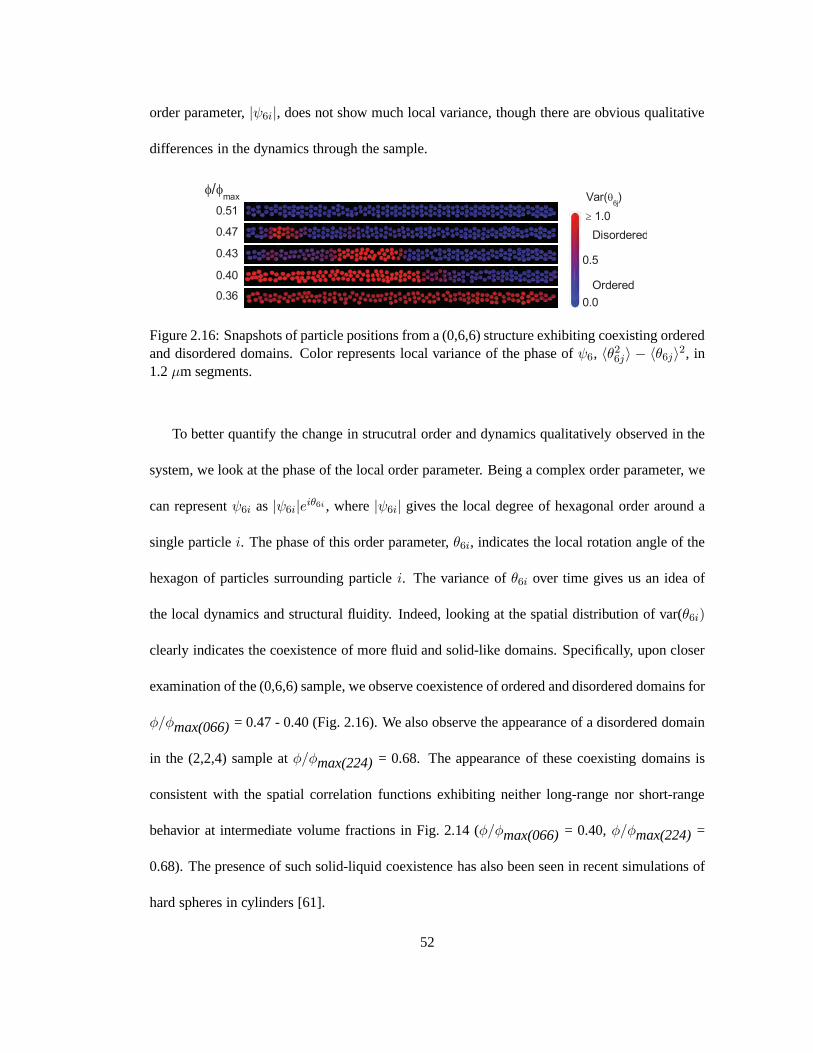
order parameter,∣ 6i∣, does not show much local variance, though there are obvious qualitative
differences in the dynamics through the sample.
Figure 2.16: Snapshots of particle positions from a (0,6,6) structure exhibiting coexisting orderedand disordered domains. Color represents local variance of the phase of 6, ⟨�26j⟩ − ⟨�6j⟩2, in1.2�m segments.
To better quantify the change in strucutral order and dynamics qualitatively observed in the
system, we look at the phase of the local order parameter. Being a complex order parameter, we
can represent 6i as∣ 6i∣ei�6i , where∣ 6i∣ gives the local degree of hexagonal order around a
single particlei. The phase of this order parameter,�6i, indicates the local rotation angle of the
hexagon of particles surrounding particlei. The variance of�6i over time gives us an idea of
the local dynamics and structural fluidity. Indeed, looking at the spatial distribution of var(�6i)
clearly indicates the coexistence of more fluid and solid-like domains. Specifically, upon closer
examination of the (0,6,6) sample, we observe coexistence of ordered and disordered domains for
�/�max(066) = 0.47 - 0.40 (Fig. 2.16). We also observe the appearance of a disordered domain
in the (2,2,4) sample at�/�max(224) = 0.68. The appearance of these coexisting domains is
consistent with the spatial correlation functions exhibiting neither long-range nor short-range
behavior at intermediate volume fractions in Fig. 2.14 (�/�max(066) = 0.40,�/�max(224) =
0.68). The presence of such solid-liquid coexistence has also been seen in recent simulations of
hard spheres in cylinders [61].
52

2.4.5 Structural Transformations in Chiral Packings
In certain observed samples, domains with different local pitch and structure often appear as
volume fraction decreases (Fig. 2.17). The appearance of these domains was difficult to quantify,
since domains would grow, shrink and/or disappear with decreasing volume fraction. Also, since
each domain was equally ordered, just with a different crystal lattice orientation relative to the
cylinder geometry, conventional order parameters were not helpful distinguishing structures (for
example,∣ 6i∣ would have practically the same local value between two structures of different
pitch or chirality).
Therefore, we again turn to the phase of the local orientational order parameter 6i, �6i, to
characterize the local structural pitch. As mentioned in the previous section,�6i indicates the
local rotations of hexagons with respect to the long axis of the cylinder. More specifically,�6i =
0 indicates a lattice vector running along the long axis of the cylinder, while�6i = ±� indicates
a lattice vector running around the circumference of the cylinder. When the helical hexagonal
packings are “unrolled” onto a plane, each packing(m,n,m+ n) will have a unique character-
istic �6i. For example, in the regime of structural diameters observed in our experiments,�6i =
0.67 indicates a (2, 3, 5) structure. Additionally, the magnitude of�6i will indicate the topology
of the structure, and its sign will indicate its chirality. For example, while�6i = 0.67 indicates a
(2, 3, 5) structure,�6i = −0.67 indicates a (3, 2, 5) structure.
The structures observed in coexisting states were those with most similar predicted linear
densities andD/dsep values. Specifically, as shown in Fig. 2.17, a structure starting in a (2, 3, 5)
configuration transitions to domains with local structures of (3, 2, 5) and (0, 4, 4). Additionally,
a second sample starting in the (0,6,6) structure was seen to transition to (2, 4, 6) and (1, 5, 6)
53

Figure 2.17: Snapshots of particle positions from a (2,3,5) structure with emerging domains of(3,2,5) and (0,4,4) structures. Color represents phase of 6j , �6j, which characterizes packingorientation. Structures corresponding to each�6j given on right.
domains. A third packing saw transitions between (2, 5, 7) and (1, 6, 7) domains. These results,
specifically, transitions between structures with similarD/dsep values, are consistent with hard
sphere simulations [84,131].
This coexistence of ordered structures should not be confused with dislocation-mediated
structural transformations theoretically studied [53] and observed [9, 10, 132, 133] in athermal
helical crystals, and described in more detail in Section 2.2.2. This is largely because certain
observed boundaries between coexisting structures, specifically, (2, 3, 5) and (0, 4, 4) structures,
as well as (0, 6, 6) and (2, 4, 6) cannot be mediated by the presence of a single dislocation. If
transitions and coexistence of such packings are mediated by the formation and glide / climb
of multiple dislocations, it is difficult to observe from this data, as three dimensional packing
geometries and dislocation configurations are difficult to extract.
2.5 Conclusions
In summary, we created ordered helical packings of thermoresponsive colloids and observed the
presence of long-range order resilient to thermal fluctuations. Sharp crossovers from orientation-
ally ordered to disordered phases with decreasing volume fraction were observed. In addition,
54

we find basic evidence for abrupt volume-fraction driven structure-to-structure transitions. These
findings raise and elucidate fundamental questions on the subject of melting in 1D.
Even so, the nature of this crossover is complicated, and merits further study. For example,
there is some uncertainty whether it is truly appropriate to treat phase behavior in this system as
“quasi-2D”, or whether the apparent stability of orientational order stems from interactions of
the packing with its confining boundary. Such questions could be answered with an improved
experiment using higher-resolution 3D particle tracking to observe radial fluctuations of parti-
cle positions in ordered and disordered phases. Also, if the observed long-range orientational
order is, in actuality, only of the order of the system size, it would be useful to perform further
experiments probing the relationship between inter-particle interactions and order lengthscales.
A more sophisticated theoretical treatment which includes effects of system boundaries
would also help clarify such questions. Additionally, examining other quasi-1D systems with
orientational order theoretically and experimentally, i.e. liquid crystals or anisotropic particle
packings in confinement, might clarfiy the robustness of orientational order in restricted dimen-
sions. It might be particularly interesting to create experimental realizations of simulated 1D
systems which always demonstrate long-range orientational order (i.e., rotating anisotropic par-
ticles with centers on a fixed line) [50,70].
55

Chapter 3
Low-Frequency Modes as a Hallmark
of Structural Crossovers in Quasi-2D
Dense Attractive Colloidal Packings
3.1 Introduction
Philip W. Anderson stated in 1995 that “the deepest and most interesting unsolved problem in
solid state theory is probably the theory of the nature of glass and the glass transition” [2]. Most
experimental, numerical and theoretical work in the subsequent two decades has focused on
dense, disordered packings of repulsive particles [36, 62]. Far less is known about the struc-
tural and vibrational properties of disordered packings of particles with attractive interactions.
Broadly, packings of particles with short-ranged attractions are described by two classes of dy-
namically arrested states [160, 181, 182]. The terms “attractive glass” and “bonded repulsive
56

glass” are used to denote a dense packing of attractively-interacting particles with uniform struc-
ture, and the term “gel” is used for a class of more dilute, yet still dynamically arrested, pack-
ings. These two “states” of matter are typically distinguished by a qualitative description of their
structure and dynamics. Though some work has been done to try to characterize the crossover
between attractive glasses and gels [34, 86, 182, 183], to date no precise (i.e., universal) mi-
crostructural or dynamical signature of the gel-to-glass crossover had been identified.
In this chapter, we investigate this packing-fraction driven crossover. In particular, we study
the vibrational modes of quasi-2D dynamically arrested samples of thermal colloidal particles
with attractive inter-particle interactions. We find that a crossover from glassy to gel-like states is
indicated by a significant increase in low-frequency vibrational modes at sufficiently low pack-
ing fraction. These modes appear to be highly localized to regions of the sample with low local
coordination. Though these modes do not obviously correlate to a specific feature, the distinct-
ness in the change in vibrational modes suggests a significant structural change which might
serve as a signature of gel-like and glassy packings of attractive particles.
3.2 Contextual and Theoretical Background
3.2.1 Attractive Glasses
The so-called attractive glass (or bonded repulsive glass, to use a recent parlance [182]) is a
disordered state of matter with high density and spatially uniform structure. Its dense structure is
thus similar to the (non-bonded) repulsive glass, though the attractive glass is also characterized
by strong inter-particle attractions. Note, herein, we use the term attractive (repulsive) glass
or colloid to denote an ensemble wherein interparticle attractions are attractive (repulsive). A
57

U(I
nte
rpa
r�cl
e A
�ra
c�o
n)
Packing Frac�on ф
Gel
Repulsive Glass
A�rac�ve GlassFluid/
Cluster
Fluid
Figure 3.1: Qualitative phase diagram of disordered packings as a function of packing fraction� and inter-particle attraction strengthU .
distinct transition between repulsive and attractive glasses as a function of increasing attraction
strength has been predicted by mode coupling theory (MCT) [7,39]. In less dense, but still glassy
packings, changes in inter-particle attraction can even produce re-entrant melting phenomena.
For example, adding interparticle attractions to a purely repulsive glass causes particles to cluster
together and thereby frees up more room for particle rearrangments; as a result, the glass melts
into a fluid phase. A continued increase in interparticle attraction, however, can drive the fluid
into dynamic arrest again, i.e., it drives formation of the attractive glass phase. This re-entrant
phenomena has been observed in several experiments [35,89,130].
Additional phenomenological differences in repulsive and attractive glasses arise as a result
of slightly different dynamical arrest mechanisms. In a repulsive glass, for example, particle
dynamics slows due to local crowding, and in the attractive glass, there is an additional slowing
of dynamics caused by strong inter-particle attractive bonds. These effects give rise to differences
in bulk rheological properties, specifically, two-step yielding in attractive glasses [86,128,129].
58

3.2.2 Gels
Though gels are a common component of consumer products and biological systems, they are a
poorly defined “state” of matter from a physics perspective [182]. The term “gel” can be used
to describe any low-density, spatially heterogeneous material with solid-like properties. Such
materials can form from any collection of particles with sufficiently strong attraction, be they
colloidal particles in a polymer solution aggregating from depletion forces [96], clay disks with
anisotropic electrostatic interactions [88], or carbon nanotubes in solution interacting through
nonspecific bonding interactions [59].
As a consequence, so-called gel structures can vary significantly depending on inter-particle
interactions and assembly dynamics [182]. In the limit of strong inter-particle attraction, par-
ticles will stick and freeze in place as soon as they come into contact. The resulting states,
called irreversible or “chemical” gels, are well described by percolation theory. Such structures,
formed by a rapid quench, are described by diffusion-limited cluster aggregation (DLCA, frac-
tal dimensiondf ≈ 1.8); similar structures, which are formed more slowly, are described by
reaction-limited cluster aggregation (RLCA,df ≈ 2.3). If, on the other hand, inter-particle at-
traction is on the order of the thermal energykBT , then a more compact “physical” gel with
frequent bond relaxations and rearrangements will form. Additionally, there is a significant
structural difference between systems with only short-range attraction versus systems stabilized
at lower densities by repulsive barriers or by limited attractive valences. The former systems typ-
ically phase separate into locally dense clusters; the latter systems typically approach percolation
through well-dispersed equilibrium fluid states [182].
59

3.2.3 Differences between Gels and Attractive Glasses
Gels and attractive glassy phases are quite difficult to distinguish in systems with strong inter-
particle attraction and intermediate densities. Gels are typically qualitatively distinguished from
glasses by obvious structural inhomogeneities, but this approach is a difficult task in packings
that are dense enough to be nearly, but not entirely, uniform. Additionally, gels share quite a few
of the dynamical traits of glassy materials. For example, dynamical heterogeneity is observed in
both glasses and gels [24], though its presence in gels can sometimes be attributed to structural
heterogeneity, depending on gel morphology [30,31]. Also, as in glasses, the relaxation dynam-
ics of gels are often well described by stretched exponential decays [181]. Finally, as will be
discussed in a later section, both glasses and gels exhibit an excess of low-frequency vibrational
modes compared to predictions for ordered solids [18,139].
This is not to say that there have been no previous attempts to find a hallmark of the gel-to-
glass transition. Simulations of attractive systems have found differences in gels and attractive
glasses in their relaxation dynamics, e.g., evident in an upturn in the gel mean-squared dis-
placement (MSD) at long timescales [182]. A simplified theoretical model has predicted that
the elastic modulus of a glass should be dominated by inter-particle elasticity, while the struc-
tural inhomogeneities in a gel will cause the elastic modulus to be dominated by inter-cluster
elasticity [183]. Further, rheological experiments on attractive colloidal suspensions have ob-
served a transition from two-step yielding in attractive glasses to one-step yielding invery sparse
gels [86]. Other recent experiments combined light scattering and rheology to determine a dy-
namic arrest transition line in ensembles of thermally tunable attractive nanoparticles [34]. These
experiments found that this line deviates from a percolation-based prediction at the low-attraction
60

border of the gel-to-glass transition.
Nevertheless, despite the breadth and rigor of this preceding work, a specific microstructural
or dynamical signature of the gel-to-glass crossover in a static experimental sample with strong
attractions has yet to be determined. In addition, a fair amount of this previous work relies on
rheological properties to distinguish phases. Though rheology is useful for probing the bulk
properties of materials, the identification of phase behavior in anunperturbed or “static” sample
(that is, a dynamically arrested structure not under shear) would enable categorization without
significantly changing the morphology of the structured material (e.g., as shearing has been
shown to do in marginally sparse attractive packings) [90].
3.2.4 Phonons in Disordered Solids
In recent years, experimental calculations of the vibrational modes of colloidal materials have
become a useful tool for investigating phase behavior, bulk properties and local structure in
ordered and disordered packings [18–20, 42, 43, 47, 54, 72, 101, 147, 179, 180]. We discuss the
details of this technique in Section 3.3.2. Here, we briefly touch on the motivations for applying
this analysis to attractive disordered packings.
3.2.4.1 Conventional Low-Frequency Phonon Behavior: The Debye Model
A traditional theory for describing vibrational modes in a solid material is the so-called De-
bye model. This model assumes a continuous elastic medium, where vibrational modes at low
frequencies are described as plane waves with a dispersion relation! = c∣⇀k ∣; here! is the
frequency of a given mode,⇀k is its wavevector, andc is the speed of sound at that particu-
lar frequency. In ad-dimensional system, one can determine the vibrational density of states
61

(vDOS) by calculating the number of vibrational modes in an infinitesimal frequency interval
[!, ! + d!]. For example, given a periodic array of constituent particles, the Debye model
assumes an even distribution of modes ink-space. Then, for a given frequencyw = c∣⇀k ∣, there
exists a degeneracy of modes proportional to the area of a surface with constant∣⇀k ∣. For ad-
dimensional system, this yields a density of states∝ !d−1. This prediction turns out to be an
accurate descriptor for many solid materials at low frequencies, and it is typically used to model
the temperature dependence of specific heat (CV ) in crystalline solids at low temperature (i.e.,
CV ∝ T 3).
3.2.4.2 Low-Frequency Phonons in Disordered Solids
A puzzling property of amorphous solids is that the density of low-frequency vibrational modes
can significantly exceed the Debye prediction. When a vDOS (orD(!)) curve is normalized by
the expected Debye behavior, i.e.D(!)/!d−1, this excess is apparent as a “bump” commonly
referred to as the “Boson peak.” Though the height and position of this Boson peak has been used
as an indicator of the glass transition in disordered materials [18, 169], the exact nature of this
excess of low-frequency modes remains a current topic of theoretical and experimental investi-
gation. Besides being observed in dense glassy systems, for example, features resembling the
Boson peak have been observed in sparser gel-like systems [139], as well as structural crystals
with bond-strength disorder [47,48]. Recent studies have made progress in clarifying properties
of this Boson peak, if not a universal mechanism behind it. It appears that many modes near
and below this frequency tend to be quasilocalized [18, 170]. Additionally, the Boson peak has
been observed to evolve into the Van Hove singularity of crystals in disordered packings that are
62

evolving into a more ordered configuration [22]. Several recent studies have come to the con-
clusion that that Boson peak frequency represents the high-frequency limit of transverse modes
propagating in a disordered material [143,153].
Figure 3.2: (Left) Illustration of the difference in low-frequency density of statesD(!) in anordered Debye solid (black solid line) and a disordered glassy solid (dashed red line) withddimensions. Note the boson peak exhibited at low frequencies exhibited by the disordered solid.(Right) vDOS calculated from particle trajectories in quasi-2D disordered packings of thermalcolloidal microgel spheres with soft repulsive interactions at various area fractions0.840 <� < 0.885, adapted from [18]. Note low-frequency peak which changes height and frequencylocation with area fraction.
Low-frequency modes in disordered packings also highlight otherwise unobservable struc-
tural features. Specifically, experimental [19, 42] and numerical [12, 13, 101, 165] studies have
observed that quasi-localized low-frequency modes show enhanced participation in areas that
are particularly prone to irreversible rearrangements with the application of shear. These ar-
eas, termed “soft spots”, are thus considered the amorphous equivalent of dislocation or grain
boundary defects in ordered media which (in polycrystalline materials) move in response to me-
chanical forces. Though the exact structural properties of these “soft spots” are not entirely clear,
previous work has observed that particles in “soft spot” regions exhibit increased local motion
and are to some degree associated with local structural order and free volume [71].
63

While an excess of low-frequency vibrational modes have beenobserved in gel-like materi-
als, the nature of these modes is complicated by the heterogeneous structure of the gel. Recent
simulations of sparse, stringy gels of patchy particles observe an excess of low-frequency modes
which are tentatively labeled a “boson peak” and are associated with long-wavelength transverse
modes of long linear particle chains and related rotational/translational mode coupling [139].
Direct acoustic measurements of ultrasonic vibrational modes in particle gels predict non-Debye
behavior in a “diffusive” regime where plane mode wavelengths exist on the size scale of struc-
tural heterogeneities and thus scatter diffusively [25, 186]. Additionally, it has been shown that
structural heterogeneity in gels has varying correlations to dynamic heterogeneity depending on
its overall morphology [30, 31]. One such specific effect is that particles at surfaces in sparse
gels will exhibit enhanced motion compared to more closely packed regions. One could imagine
that such relationships between structure and dynamics would be reflected in vibrational modes.
Our experimental work is motivated, in large part, by an effort to make connections (or dis-
tinctions) between the low-frequency vibrational behavior observed in dense glassy phases, i.e.,
boson peaks and soft spots, and the structure-induced prevalence of low-frequency modes ob-
served in sparse gels. If the low-frequency behavior were to change continuously from attractive
glasses to gels, than perhaps an obvious structural feature of low-frequency modes in gels could
be extrapolated to denser packings and could further elucidate the structural nature of soft spots
or the boson peak. If, on the other hand, one were to observe very different low-frequency behav-
ior in sparse and dense colloidal packings, then one might surmise that there exists a distinction
between the low-frequency effects caused by structural heterogeneities and those caused by local
disorder. In this case, one might become disinclined to apply the broad term of “boson peak” to
64
any deviations from Debye behavior.
3.3 Experimental and Analytical Methods
3.3.1 Sample Preparation
We create attractive colloidal monolayers in a manner that ensures observable Brownian motion
in dense, attractive packings. Bidisperse suspensions of carboxyl-modified polystyrene (PS)
colloidal spheres (1 um and 1.4 um, Invitrogen) in a 1:1 number ratio are suspended in a mixture
of water and 2, 6 lutidine near its critical composition, i.e., with a lutidine mass fraction of 0.28.
At a critical temperature of 306.5 K, this solvent mixture induces a wetting-mediated short-range
attractive interaction between particles with a strength of≈ 4kBT [8, 179, 180, 185]. We place
dilute suspensions of these particles (1% wt/wt) between two hexamethyldisilazane (HMDS)
functionalized glass coverslips separated by a 25�m spacer, and we then place the sample on
an inverted microscope with an oil-immersion objective, and finally we heat the sample to the
colloidal aggregation temperature using a high-stability objective heater (Bioscience Tools).
3.3.1.1 Issues Forming Quasi-2D Thermal Attractive Monolayers
Though the described method might appear fairly straightforward, many subtleties arise and need
to be considered in order to create a dynamically arrested, stable, thermal, attractive, dense, and
quasi-2D packing. One might, for example, question the use of a binary solvent as a means of
inducing attraction between particles, especially since depletion-induced aggregation is simpler
65

to understand and more straightforward to prepare experimentally. However, by using water-
lutidine based wetting instead of a depletion-induced attraction, we are able to keep the vis-
cosity of the solvent low, which minimizes dampening of vibrations in the packings (as noted
by [185]). Additionally, a thermally tunable attraction is an important experimental feature for
creating very dense, attractive colloidal packings, since one can easily create a dense packing
with low attraction and then “turn on” attractive interactions. By contrast, a sample with a con-
stant, strong attraction would dynamically arrest into a gel-like phase at low packing fractions,
making attractive glasses difficult to realize experimentally. Further, though temperature-tunable
depletants exist, it is difficult to make them tunable from a range of zero attraction to a strong
enough attraction to stabilize sparse packings at low densities. Lastly, depletion-based attraction
becomes less predictable (and is less well understood) in dense suspensions of particles with
little free volume and many-body interactions.
This is not to say that use of the water-lutidine based attraction is entirely straightforward.
Our initial experiments in a quasi-2D cell (i.e., two glass slides separated by a space slightly
larger than the particle diameter) showed damped motion of particles due to confinement, fre-
quent sticking of particles to surfaces, and huge random particle flows due to water-lutidine
phase separation outside the field of view. To prevent irreversible aggregation of colloids onto
the surfaces, we silanized the surfaces with a coating of hexamethyldisilazane (HMDS). HMDS
has been also been shown to modify the attraction of colloids to surfaces in these binary sys-
tems [55]. We do this by placing glass coverslips cleaned with methanol in a closed container
with a shallow, open vial of 750�L of HMDS overnight. Unfortunately, though this coating
66

procedure prevents particle sticking, the increased hydrophobicity of the slides from this treat-
ment made it more difficult to create sufficiently thin chambers for creating quasi-2D colloidal
packings.
3.3.1.2 Novel Monolayer Spreading From Lutidine Wetting
We averted several of these aforementioned problems by making our packings on a single surface
of a three dimensional cell. This scheme used a previously unrealized phenomenon in the water-
lutidine system. At certain concentrations near the critical lutidine mass fraction, raising the
temperature of the suspension slightly into the water-lutidine phase separation regime results in
a thin layer of lutidine covering the top and bottom surfaces of the cell. If colloids are near the
surface, they are pulled into a quasi-2D monolayer by the lutidine layer. Upon cooling back to the
colloidal aggregation regime, attraction to the surface keeps the colloids in a surface monolayer
as they aggregate into a quasi-2D, dynamically arrested packing.
Figure 3.3: Formation of PS monolayers using water-lutidinephase separation, viewed underbright-field microscopy, with accompanying illustrations below. (Left) Three dimensional clus-ters form and sediment to the bottom of the sample cell at the aggregation temperature. (Middle)Heating sample above the aggregation regime causes phase separation of water and lutidine,pulling PS spheres into a monolayer of repulsive particles at the bottom surface. (Right) Lower-ing the temperature back to the aggregation regime pins particles to the surface, allowing themto aggregate from short-range attraction to a stable, percolating monolayer. Scale bars= 20�m.
67

This technique, though useful for creating dense attractivepackings with undamped thermal
motion, is very sensitive to preparation. In order to observe this effect, the water and lutidine
mixture needs to be made the day of the experiment. Also, the ratio of solvent volume to colloidal
and cell surface area seemed to significantly affect whether a stable wetting layer of lutidine
forms in the phase separation regime. For example, a given suspension might exhibit this wetting
effect in a 20�m thick chamber, but would not show monolayer formation in a 10�m or 50�m
chamber. Likewise, suspensions with the same ratio of water-to-lutidine and slightly different
colloidal densities in identically thick chambers would show different propensities for forming a
colloidal monolayer upon water-lutidine phase separation.
We address the sensitivity of this technique by using a repeatable sample preparation pro-
cedure with room for slight variations in composition. We first centrifuge a dilute suspension
of bidisperse PS spheres (≈ 10% wt/wt) and remove supernatant to create a more concentrated
suspension ( to≈ 45% wt/wt ). We then separately prepare a mixture of Millipore-filtered water
and lutidine at a volume ratio of 2:1 (31.6 % wt/wt lutidine). We mix 100�L of the water-
lutidine mixture with 5-10�L of the dense colloidal suspension (resulting in a lutidine weight
fraction of 28.7 - 30.1 %, close to the critical fraction of 28%). Then, 10-15�L of suspension is
sandwhiched between two HMDS coated slides with a single 25�m spacer on one edge of the
cell. The edges are immediately sealed with UV epoxy. While the epoxy is cured under a UV
lamp, a small piece of cardboard is used to cover the center of the sample (as it appears intense
UV absorption can affect the water-lutidine monolayer formation phenomenon). Variation of the
concentration of colloids in suspension and the volume of suspension in the cell (which effects
the thickness) changes the area fraction of the resulting attractive monolayer. With each sample
68

preparation, each factor (including the water/lutidine ratio) must be carefully tuned through trial
and error to observe appropriate monolayer formation.
3.3.1.3 Temperature Stability
Once a suitable sample is prepared, it is placed on an inverted microscope stage on a 100x oil-
immersion objective. The temperature is controlled through a collar that heats the objective,
which is in thermal contact with the sample through immersion oil. Initial experiments used
an objective heater with±0.1∘ C stability (Bioptechs). Though this level of temperature control
offers sufficient stability for many temperature-dependent colloid experiments, the current set-up
can cause significant fluctuations in interaction strength and film stability. This results in particle
rearrangements with a period of approximately 60 seconds, the same period of fluctuations seen
in the objective heater readout.
To resolve these temperature sensitivity issues, we obtained and utilized a high-temperature
stability objective heater (Bioscience Tools). In addition to having a temperature sensor in the
heating collar, this heating system includes an external temperature probe, which we place in
the immersion oil that is in contact with the objective. With proper adjustment of background
heating and feedback sensitivity, this objective heater showed a temperature stability of±0.03∘
C (though we found that the temperature fluctuates slightly during the 60 seconds following a
temperature change). Though the advertised stability was±0.01∘ C, the measured±0.03∘C was
sufficient to prevent fluctuations in particle interaction and resulting rearrangements.
69

0 10 20 30 40 50 600
20
40
60
80
AggregationPhaseSep.Aggregation
31.8° C31.7° C31.7° C
Ave
rage
Dis
pace
men
t in
nex
t 0.2
sec
onds
(nm
)
Time (seconds)
Figure 3.4: Effect of temperature fluctuations in a lower stability objective heater (Bioptechs).(Bottom) Average particle displacement in a PS monolayer aggregate over the next 0.2 secondsduring a temperature fluctuation of 0.1∘C, taking the sample out of the aggregation regime.(Top) Bright field microscope images of an attractive monolayer cluster during the temperaturefluctuation. Red arrow indicates a sub-cluster of particles that undergoes an irreversible rear-rangement during the temperature fluctuation. Scale bar= 10�m.
0 20 40 60 80 10033.4
33.5
33.6
33.7
33.8
33.9
34.0
34.1
Tem
pera
ture
(°C
)
Time (sec)0 100 200 300 400 500 600
33.70
33.75
33.80
33.85
33.90
33.95
34.00
34.05
34.10
Tem
pera
ture
(C
)
Time (sec)
Figure 3.5: Higher stability objective heater setup (Bioscience Tools). (Left) Configurationof Biosciencetools heating objective collar and external temperature probe placed in sampleimmersion oil on an upright microscope setup (in experiments, an inverted microscope is used).(Middle) Temperature readout from external temperature probe immediately after an increasein set temperature from 33.4∘C to 33.8∘C. Temperature fluctuations stabilize after about 60seconds from the start of the temperature change. (Left) Temperature readout from externaltemperature probe several minutes after a temperature change. Note fluctuations of±0.03∘C.
70

3.3.1.4 Monolayer Formation
With temperature fluctuations and formulation issues resolved, we were able to develop a con-
sistent method for creating the samples (Fig. 3.3). After a sample was placed on the inverted
microscope objective, the sample was heated to a temperature corresponding to the aggregation
regime. We then allow at least 10 minutes for 3D particle aggregates to form and sediment to
the bottom surface of the objective. The sample is then heated to0.1∘C above the water-lutidine
phase separation temperature for just enough time for a monolayer to spread on the bottom
surface (typically 3-10 seconds). The system is then cooled back to the original aggregation
temperature, forming an attractive monolayer of particles. Depending on the initial concentra-
tion of colloids in suspension, the resulting monolayer packing can resemble a sparse, barely
percolating structure with area fraction� = 0.50± 0.01 or a homogeneous, dense packing with
area fraction� = 0.84± 0.01
3.3.2 vDOS Calculation from Particle Trajectories
In contrast to previous studies which calculate the vDOS of crystalline packings by assuming
plane-wave behavior [74] or calculate vDOS from particle velocity autocorrelations which lose
all spatial information [163, 166], we calculate vibrational modes directly from correlations of
particle displacements with respect to their equilibrium positions [18,43,54,72].
To gain a fundamental understanding of this method, first imagine a single thermal particle in
N -dimensional space with coordinatesx1, x2, . . . xN sitting in a potentialV (x1, x2, . . . xN ). As
this particle exploresN -dimensional space, its likelihood of being at any position will be related
to the underlying potential. By analyzing the statistics of particle positions inN -dimensional
71

space over a long enough time, we can derive the shape of the underlying potential in the N-
dimensional space.
The physics ofN particles ind dimensions interacting via multiple inter-particle poten-
tials can be derived in a similar manner by understanding the system as a single “configura-
tion particle” exploringN × d dimensional space. Say, for example, we have a system of
three particles confined to a single dimension at positionsxi and interacting via inter-particle
potentials between particlesi and j, Vij(xi, xj). We can re-interpret the entire system as a
“kind of” single particle moving in three dimensionsx1, x2, x3 in a three-dimensional potential
V (x1, x2, x3) = V12+V23+V13. By observing sufficient numbers of configurations of the three
particles over time, we can thus map out the three-dimensional potentialV (x1, x2, x3) which
describes the entire system.
Likewise, by observing the positions of particles in anN -particle packing at many different
times, we can map out aN × d - dimensional potential which describes the system. From this,
we can calculate the vibrational modes of our system. This approach offers us an advantage
over some other methods for calculating vibrational modes. For example, we do not require the
high frame-rates and the tracking precision necessary for determination of instantaneous parti-
cle velocities. Additionally, we can extract vibrational information about our packings without
knowing the exact details of the inter-particle potentialsa priori.
We follow previous experimental work calculating vibrational modes from particle trajecto-
ries [18, 43, 54, 72]. Given a 2D colloidal system ofN particles in thermal equilibrium, we de-
fine a displacement vectoru for the system such thatu = [dx1, dx2, ..., dxN , dy1, dy2, ..., dyN ],
wheredx1 anddy1 are particle1’s x andy displacements from its average/equilibrium position,
72

dx2 anddy2 are particle2’s x andy displacements from its average/equilibrium position,etc. We
then calculate a time-averaged covariance matrix of these displacementsCij =< ui(t)uj(t) >t.
In the harmonic approximation, the2N -dimensional inter-particle potentialV is given by the
relation
V =1
2uTKu, (3.1)
whereK is the2N by 2N matrix of effective spring constants between all pairs of particles,
with elements defined as:
Kij =∂2V
∂ui∂uj. (3.2)
This form of the2N -dimensional potentialV yields a partition function of
Z ∝∫
du e−�( 12uTKu), (3.3)
where� = 1/kBT . Calculating the correlation function from this partition function yields
Cij = kBT (K−1)ij , or equivalently,Kij = �(C−1)ij . Thus, in the harmonic approximation,
the equation of motion for a “shadow system” of particles with the same interactions as our
system, but without damping, is
u+Du = 0. (3.4)
HereDij = Kij/mij is the2N by 2N dynamical matrix of the system, andmij =√mimj ,
wheremi is the mass of particlei. We thus find theitℎ vibrational mode of this shadow system
by solving for the eigenvectors ofDij : De = �e, with the frequencies of these modes given
by !i =√�i. The components of the eigenvector of modei, e(!i)jx, represent the relative
73

participation of particlej moving along thex direction in modei with frequency!i.
After calculating the! values, we derive the vibrational density of states by creating a
histogram of these modes as a function of!. In order to compensate for varying statistics at
different frequencies, we calculate each point on the vDOS curve fromM consecutive modes
(typically). For a set ofM modes of consecutive frequency[!i, !i+M ], we define!avg,i =
(1/M )∑
j = ii +M!j. We then define the corresponding vDOS value at frequency!avg,i as
M/(!i+M − !i).
3.3.3 Analytical Considerations for vDOS calculations
After acquiring bright-field microscopy video of the 2D samples, i.e., images of a 60�m × 80
�m section of the packing (1500-3000 particles, depending on�) at 60 frames per second, we use
sub-pixel particle tracking algorithms to calculate each particle’s trajectory [26]. To negate any
drift in the sample and to study the collective motion of areas smaller than the full field-of-view,
we subtract the average motion of all particles between time frames.
Though there are no obvious particle displacements greater than a fraction of a particle di-
ameter in these tracks, there may be collective “irreversible” particle rearrangements wherein
particles shift position. These motions are not equilibrium vibrations of the system; rather, they
are rearrangements which evolve the system to an entirely new packing. In fact, the vDOS analy-
sis we have described above will, strictly speaking, only work if there are no internal rearrange-
ments during the measurement time. Even though there might not seem to be any noticeable
change in the structure of the packing, these rearrangements will be interpreted by the vDOS
analysis (described above) as low-frequency modes. Since low-frequency modes are important
features for characterizing glassy and disordered packings, it is important that such errors in the
74

mode calculation are minimized. This minimization of error entails careful selection of regions
of particle tracks without observable rearrangements.
Our primary data includes tracks of 30,000 - 100,000 time frames at 60 fps (8 - 28 minutes).
For processing, we typically select only the 10,000 frame region of the track with the slowest,
most consistent average motion. While this data selection effectively decreases the statistics for
our vDOS calculation, it gives us confidence in the low-frequency shape of the vDOS curves,
etc. Previous work has shown that vDOS curves will deviate from their ideal shape if the number
of frames used to calculate modes,Nf , is less than5Np, whereNp is the number of particles in
the system [43]. Though shortening the number of frames affects the higher frequency modes
(which, as stated in the previous paragraph, are not quite as important in our analysis as the low-
frequency modes), we can readily perform a fit that compensates for low statistics by linearly
extrapolating eigenfrequencies to their expected values, i.e., which would be derived from an
infinitely long time-track [20, 47, 141, 147]. Specifically, we calculate the vibrational modes for
several different numbers of time framesNf (ranging from 6,000 to 10,000). As can be seen
from Fig. 3.6,1/! exhibits a linear trend with1/Nf , with larger slopes at high frequencies. By
fitting a line to each trend and extracting the infinite frame limit, i.e., the predicted!(1/Nf = 0)
value for each mode, then we can estimate an adjustment to derive the infinite time-frame limit
frequency for each mode. Data post-processed with this procedure results in sharper, higher fre-
quency peaks in the vDOS, while the low-frequency tail of the vDOS, though slightly improved,
remains largely unchanged.
A preliminary observation of vDOS curves (normalized by the total number of modes in the
system) reveals high-frequency peaks occurring at different frequencies (Fig. 3.7). These shifts
75

0.0 0.2 0.4 0.6 0.8 1.00.00
0.01
0.02
1/ω
(a.
u.)
2Np/N
f
1 10 1000
50
100
150
200
T = In!nity T = 10k T = 7k
DO
S (
a.u.
)
ω (a.u.)
Figure 3.6: Extrapolation of modes to compensate for low statistics in a packing with area frac-tion � = 0.84. (Left) 1/! of several modes calculated for several ratios ofNp/Nf , with linearfits extrapolating these modes to the limit ofNp/Nf = 0. (Right) vDOS calculated forNf =7000 (red points),Nf = 10000 (green points), and extrapolationNf → ∞ (black points). Notethe increasingly better statistics do not significantly influence the vDOS curve shape at low fre-quencies.
are most likely due to slight changes in the ratio of large to small particles in each packing.
Though initial mixtures of colloids were made to have an equal number of large (d = 1.4�m)
and small (d = 1.0�m) particles, the exact ratio varies significantly from sample to sample. To
enable optimal comparison between packings, we normalize phonon frequencies by the mean
frequency of that particular packing!. After this normalization, the vDOS peaks overlap nicely
at!/! = 1.0 (as can be seen in Fig. 3.12). A similar re-scaling is performed in [48] to account
for changes in local packing fraction.
3.4 Results and Discussion
3.4.1 Conventional Structural Characteristics of Attractive Monolayers
We examine 13 different packings with area-fractions ranging from� = 0.50 to� = 0.84 (specif-
ically, � = 0.50±0.1, 0.55±0.1, 0.56±0.1, 0.62±0.1, 0.64±0.1, 0.65±0.1, 0.69±0.1, 0.74±
76

0 50 100 150 200 2500.0
0.2
0.4
0.6
0.8
1.0
1.2
1.4
vDO
Sω (a.u)
Figure 3.7: vDOS curves of observed packings against unnormalized frequencies on a linearscale. Notice shifts in the location of the high-frequency peak from packing to packing. (Red,� = 0.50− 0.55; Orange,� = 0.56 − 0.62; Yellow, � = 0.64− 0.65; Green,� = 0.69− 0.74;Olive,� = 0.80; Blue,� = 0.81 − 0.82; Black,� = 0.84).
0.1, 0.80±0.1, 0.80±0.1, 0.81±0.1, 0.82±0.1, and0.84±0.1). By analyzing the equilibrium
positions of particles with common structural parameters, a discontinuous change in structure
with area fraction is not immediately apparent. For example, as packings become continuously
more spatially heterogeneous with decreasing�, the pair correlation functionsg(r) remain qual-
itatively similar (see Fig. 3.10).
Additionally, we find that the average coordination of particles in these packings decreases
fairly linearly with volume fraction (Fig. 3.11). We determine nearest neighbors by identifying
those particles whose equilibrium positions are closer than the “dip” after the firstg(r) peak
associated with that particular particle pair. This linear change in coordination number with
volume fraction can be modeled by the removal of particle clusters from a dense packing. Indeed,
if we start with our densest observed packing (� = 0.84 ± 0.1) and randomly remove adjacent
particle clusters of 5 particles, and then re-calculate the average coordination number, we observe
a trend very similar to what we observe in experiment. Thus, though each experimental sample is
77

φ = 0.50 φ = 0.55 φ = 0.56
φ = 0.62 φ = 0.64 φ = 0.65
φ = 0.69 φ = 0.74 φ = 0.80
φ = 0.80 φ = 0.81 φ = 0.82
φ `= 0.84
Figure 3.8: Unprocessed bright-field microscopy images of investigated bidisperse attractive PSmonolayer packings at various densities. Approximate area fraction� indicated by inset. Scalebar= 10�m.
78

φ = 0.50 φ = 0.55 φ = 0.56
φ = 0.62 φ = 0.64 φ = 0.65
φ = 0.69 φ = 0.74 φ = 0.80
φ = 0.80 φ = 0.81 φ = 0.82
φ `= 0.84
Figure 3.9: Bright-field microscopy images of investigated bidisperse attractive PS monolayerpackings at various densities, with contrast and brightness enhanced for clarity. Approximatearea fraction� indicated by inset. Scale bar= 10�m.
79

1 2 3 4 5 60
2
4
6
8
g(r)
r (µm)
φ = 0.50 φ = 0.84
Figure 3.10: Pair correlation function g(r) of densest (� = 0.84, blue solid line) and sparsest (�= 0.50, red dotted line) observed packings. Sparse packingg(r) shifted vertically by+1.0 forclarity.
prepared separately through a non-equilibrium process, the morphology across samples appears
consistent enough to merit comparison.
3.4.2 vDOS Shape as a Signature of Structural Transition
The resulting vibrational densities of states (vDOS) for the observed packings demonstrates a
pronounced variation in the distribution of low-frequency modes with respect to changes in pack-
ing concentration (Fig. 3.12). Specifically, a drastic increase in the presence of low-frequency
modes in the sparser packings (� < 0.67) indicates a crossover from a glassy to a gel-like state.
Though all vDOS plots show a peak at the mean frequency! and a plateau at slightly lower
frequencies (0.1 < !/! < 0.4), one of two behaviors is seen at the lowest observed frequencies
(!/! < 0.1). For all packings with� > 0.67, the density of states decreases with decreasing
frequency, while for all packings with� < 0.67, the density of states increases with decreasing
frequency. The general shape of the vDOS curve for denser packings qualitatively resembles
80

0.5 0.6 0.7 0.8
4.0
4.2
4.4
4.6
4.8
5.0
NN
φ0.5 0.6 0.7 0.8
4.0
4.2
4.4
4.6
4.8
5.0
Pore S ize = 15 Pore S ize = 5 Pore S ize = 2
NN
φ
Figure 3.11: (Left) Average number of nearest neighbors as a function of� for experimentallyobserved packings, with a linear fit. (Right) Nearest neighbors vs.� calculated for the particlepositions of the observed� = 0.84 packing, with clusters of 2, 5 or 15 particles randomlyremoved. The dashed line is from the fit of experimental data on the left.
the vDOS for a model packing slightly above the jamming transition [118, 169]; it has a high-
frequency peak, a plateau, and a drop off below a characteristic frequency. While this result
might be expected for the densest, spatially uniform (but disordered) packings, it is surprising
that this result extends to samples with observable gaps, holes and spatial heterogeneity larger
than a single particle diameter (see packing structures at0.69 < � < 0.80 in Fig. 3.8).
Indeed, the vDOS of sparser packings does not closely resemble a conventional dynamically
arrested packing mode distribution. The vDOS increases for!/! < 0.1. In simulations of
uniform glassy packings in stable “lowest density” configurations, a dropoff at low frequencies
is not always observed [118, 169]. However, in these simulations, the vDOS remains at the
same plateau value observed at intermediate frequencies (for our experiments, this range of
frequencies is for0.1 < !/! < 0.4). An increase in vDOS above this plateau value is thus not
previously observed, nor easily understood, in the context of uniform packings.
Additionally, the low-frequency vDOS curves have similar slopes for all sparse (� < 0.67)
81

and dense (� > 0.67) packings, with no apparent monotonic changes in slope as a function of
�. This property indicates that this appearance of additional low-frequency modes is likely not
directly related to continuous changes in density, coordination number, and/or spatial hetero-
geneity.
0.01 0.1 1
vDO
S
ω/ω
φ < 0.67
φ > 0.67
Figure 3.12: Vibrational density of states as a function of frequency! calculated from eigen-mode distributions in packings with� < 0.67 (i.e., six packings with� = 0.50, 0.55, 0.56, 0.62,0.64, and 0.65, each± 0.1) (red lines) and� > 0.67 (i.e., seven packings with� = 0.69, 0.74,0.80, 0.80, 0.81, 0.82, and 0.84, each± 0.1) (blue lines). Thin, faded lines indicate vDOS forindividual packings; thicker lines are the average vDOS for all packings in the sparse (� < 0.67,red) and dense (� < 0.67, blue) regimes.
3.4.2.1 Comparison of vDOS in Dense Packing to Simulations
In this subsection, we compare the observed vDOS with the vibrational modes calculated from
simulations of dense, short-range repulsive hard sphere packings, following methods similar
to [45]. We find that the resulting simulated vDOS curves resemble the shape of the experimental
vDOS curves calculated from dense packings. This correspondence confirms the validity of
82

our analytical methods for capturing the qualitative vDOS for the better-understood, spatially
uniform packings.
The simulated packings are created by randomly placing 3000 bidisperse disks in a box
with periodic boundary conditions and evolving their positions to minimize the total interaction
energy of the system. Inter-particle bonds and interactions are then defined by the overlap of
particles. All “floppy” particles with insufficient bonds to create local stability are removed from
the packing; this removal ensures an entirely rigid packing is produced without zero-frequency
modes. From the remaining particle overlaps, one creates a interaction matrixKij from which
the vibrational modes can be calculated according to the method outlined in Section 3.3.2.
0.01 0.1 1
φ = 0.95, NN = 5.2φ = 0.898, NN = 4.88φ = 0.833, NN = 4.28φ = 0.816, NN = 4.12 Densest Experiment, φ = 0.84
vDO
S
ω/ω
Figure 3.13: vDOS curves from simulated dense, uniform bidisperse packings (� = 0.95, black;� = 0.898, purple;� = 0.833, blue;� = 0.816, green), along with an experimentally calculatedvDOS curve from the densest observed packing (� = 0.84, red curve). Nearest neighborsdetermined by particle overlap in simulation indicated in the legend.
As noted in previous work, all simulated packings show a vDOS peak at high-frequency,
a plateau at intermediate frequencies, and a drop off below a characteristic!★, which scales
with the “distance” of the packing from isostaticity (in 2D hard sphere packings,Zc = 4) [118,
83

169]. In Fig. 3.13, we compare simulated vDOS curves at different densities to the most dense
packing observed in experiment. A relatively sparse (though still uniform) simulated packing
with average coordination number ofNN = 4.12 yields the most similar vDOS curve to the
most spatially uniform packing from experiment (� = 0.84). The average nearest neighbor
coordination calculated fromg(r) peaks for the densest experimental packing isNN ≈ 5.0. It
is surprising that though these curves have very similar vDOS curves, since they have a very
different number of bonds per particle. This difference could be due to theg(r) method for
calculating bonds overestimating the bond density in our experiments.
It is worth noting that, though changing the average coordination number has a dramatic
effect on the shape of the vDOS curves in simulations, this effect is not observed in spatially het-
erogeneous attractive-colloid experimental samples with� > 0.67. These differences could also
be due to the definition of “bonds” used in our experimental analysis. While theg(r) method
for defining bonds yields expected results in the analysis of modes in small clusters [179, 180],
this “effective” bond definition may not be sufficient for comparison with larger, denser simu-
lated packings. Additionally, the interactions in simulations are short-range repulsive, instead of
short-range attractive; these differences could cause significant changes in the predicted vDOS
as well.
In short, well-used simulation techniques for studying dense glassy packings qualitatively
reproduce the vDOS curves we calculate in our densest experimental sample. Though there are
some noticable differences between these simulations and our experiments, this finding gives us
confidence that our method for calculating vDOS produces reasonable results.
84

3.4.3 Localization of Low-Frequency Modes
0.0 0.2 0.4 0.60.00
0.02
0.04
0.06
0.08
0.10
0.12
PD
F
p (ω/ω < 0.1)
Figure 3.14: Histogram of participation ratiop(!) for low-frequency modes (!/! < 0.1) forpackings with� < 0.67 (open red squares) and� > 0.67 (closed blue squares). Dashed lineindicatesp = 0.2 cutoff for vDOS re-calculations.
Quantification of the spatial distribution of low-frequency modes provides insight into the
structural nature of the�-mediated change in the vDOS curve. Specifically, we find that the
increase in low-frequency modes in sparse packings can be attributed to the appearance of highly
localized modes. These modes appear to be highly localized to individual or small clusters of
particles which have only a few nearest neighbors.
We find the relative localization of each mode by calculating its participation ratiop(!n) =
(∑
i ∣⇀e i(!)∣2)2/(
∑
i ∣⇀e i(!)∣4). This parameter has a value close to 1 for extended modes,
and lower values when modes are localized. When we compare the distributions ofp in low-
frequency modes (!/! < 0.1) for different packings, it is apparent that sparser packings have
more modes with lowerp (Fig. 3.14). Equivalently, these sparser packings have more highly
localized low-frequency modes than their denser counterparts. To determine how these highly
localized modes contribute to the shape of the vDOS curves, we re-calculate the density of states
85

for both sparse and dense packings, but this time we neglect all modes with ap < 0.2 (Fig.
3.15). While the shape of the vDOS curves for dense packings remains largely unchanged, the
low-frequency vDOS increase observed in sparse packings disappears, yielding curves similar in
shape to those of the denser packings. This observation implies that the excess of low-frequency
modes seen in sparse packings arises exclusively from the prevalence of highly localized vibra-
tional modes.
0.01 0.1 1
φ < 0.67
vDO
S
ω/ω
φ > 0.67
Figure 3.15: Vibrational density of states re-calculated discounting highly localized modes (p <0.2) as a function of frequency! calculated from eigenmode distributions in packings with� < 0.67 (i.e., six packings with� = 0.50, 0.55, 0.56, 0.62, 0.64, and 0.65, each± 0.1) (redlines) and� > 0.67 (i.e., seven packings with� = 0.69, 0.74, 0.80, 0.80, 0.81, 0.82, and 0.84,each± 0.1) (blue lines). Thin, faded lines indicate vDOS for individual packings; thicker linesare the average vDOS for all packings in the sparse (� < 0.67, red) and dense (� < 0.67, blue)regimes.
By closely examining the distribution and placement of the localized vibrations in the sparse
packings, we gain insight into the structural features associated with these modes. We observe
a qualitative difference in mode distributions in the same packing with similar frequencies, but
86

with significantly different participation ratio (Fig. 3.16). Specifically, a mode with lowerp
appears concentrated to fewer particles with greater local participation. In other words, lowp
vibrations appear to be localized to small clusters of particles.
a b
Figure 3.16: Plots of particle locations from a sparser packing (� = 0.64± 0.01) overlaid withpolarization eigenvector components corresponding to two modes with similar frequency (!/!= 0.019 (a) and 0.021 (b)) and significantly different localization (p(!) = 0.32 (i.e., a moreextended mode) (a), andp(!) = 0.069 (i.e., a more localized mode) (b)). Scale bar= 10�m.
We observe this degree of localization more quantitatively by looking at the distribution
of single-particle eigenvector component magnitudes,∣⇀e i(!)∣. These distributions for extended
(p > 0.2) and localized (p < 0.2) modes at low frequencies (!/! < 0.1) are plotted in Fig. 3.17.
It can be seen that the peak∣⇀e i(!)∣ value does not change much between extended and localized
modes. The major difference is seen in component values an order of magnitude greater than
this peak value. Modes withp > 0.2 show a probability distribution function (PDF) that drops
off with a nearly exponential tail. Modes withp < 0.2, however, show a significant increase in
the presence of high-participation particles above a value of∣⇀e i(!)∣ = 0.1.
By identifying particles which “dominate” in spatially localized, low-frequency modes, we
identify geometries and structures which influence the low-frequency vDOS . In Fig. 3.18, we
87

0.0 0.1 0.2 0.3 0.4
1E-6
1E-5
1E-4
1E-3
0.01
p < 0.2 p > 0.2
PD
F
|ei| (ω /ω < 0.1)
Figure 3.17: Histograms of∣ei(!)∣ for all modes with!/! < 0.1 in all observed packings with� < 0.67 for extended (p > 0.2, solid squares) and localized (p < 0.2, empty squares) modes.
plot the distribution of cluster sizes of these particles. For the most part, it appears these “domi-
nating” modes are centered around single particles, or around and within clusters smaller than a
few particles. A telling feature of the structure surrounding these particles is each particle’s local
bond number. A histogram in Fig. 3.18 compares the number of nearest neighbors of all parti-
cles in sparse packings to those of particles which dominate the localized, low-frequency modes.
This comparison shows that these “dominating” particles have relatively low-coordination, with
a peak at NN = 2.
3.4.4 Qualitative Description of Structural Correlations to Localized Low-Frequency
Modes
After deriving a correlation between particles with few nearest neighbors and those in localized,
low-frequency modes appearing in the sparse packings, we attempt to explain the correlation and
clarify the precise geometries surrounding these particles. We hypothesize and give a qualitative
88

2 3 4 5 6 70.00
0.05
0.10
0.15
0.20
0.25
0.30
0.35
PD
F
Nearest Neighbors1 2 3 4 5
0.0
0.2
0.4
0.6
0.8
1.0
PD
F
Cluster S ize (# of particles)
a b c
Figure 3.18: (a)Plot of particle locations in a� = 0.64± 0.01 packing, with particles which have∣ei(!)∣ > 0.2 for any mode where!/! < 0.1 highlighted in red. Scale bar= 10�m.(b) His-togram of size of clusters of particles which dominate a low-frequency mode in sparse packings(∣ei(!)∣ > 0.2, !n/! < 0.1, � < 0.67). (c) Histogram of nearest neighbors per particle of eachpacking with� < 0.67 (black points) and for particles in all sparse packings which dominate alow-frequency mode (empty squares,∣ei(!)∣ > 0.2, !n/! < 0.1).
explanation for why particles in “bridging” structures could give rise to such modes. However,
quantification of such structures does not yield a one-to-one correlation with particles dominating
localized low-frequency modes. The structural nature of these vibrations is more complicated
than they initially appear.
The localization of low energy vibrational modes at particles with low-coordination is a re-
sult consistent with basic intuition, as well as with recent work studying vibrational modes in
related systems [28, 139, 179, 180]. Fewer constraining bonds on a particle leads to lower con-
fining energies, which would logically result in lower-frequency localized modes. Additionally,
experimental work has shown that the mean frequency of modes in small colloidal clusters scales
with their average coordination number [179]. Similarly, recent simulations of sparse gels of
“patchy” particles demonstrate an increase in low-frequency modes in packings with increasing
sparsity, which is related to the appearance of low-energy transverse vibrations in linear particle
chains [139].
By highlighting particles which dominate localized low-frequency modes in sparse packings
89

(as in Fig. 3.18), we obtain an indication that low-frequencymodes are often localized to linear
structures susceptible to such low-energy transverse vibrations. Such an observation is consistent
with work that characterizes the boson peak frequency in glassy packings as an upper limit of
transverse modes [143, 153]. Under this assumption, the low-area fraction emergence of poorly
coordinated structures susceptible to localized transverse vibrational modes would only effect
the shape of the vDOS curve below a characteristic frequency, as seen in Fig. 3.12.
A specific recurring structure of these “dominators” is a single particle bridging two non-
adjacent particles. Qualitative observations of eigenmodes localized at such particles reveal
large-amplitude fluctuations perpendicular to the local bonding of particles. A qualitative un-
derstanding of localized low-frequency modes emerging from such “bridge” structures can be
gleaned from a comparison of longitudinal and transverse modes in such a geometry. Given
a line of three particles along thex direction with harmonic spring interactions of strengthk,
and with an inter-particle spacingr (as depicted in Fig. 3.19), the energy cost of a longitudinal
displacement of the center particle from its equilibrium position,�x, is given as
U(�x) = k(�x)2. (3.5)
90

A significantly small transverse deformation of the same magnitude, �y << r will have a sig-
nificantly lower energy cost,
U(�y) = 2
(
1
2k√
r2 + (�y)2 − r
)2
= k
(
−r + r
(
1 +1
2
(
�y
r
)2
− 1
8
(
�y
r
)2))2
=k
4
(�y)4
r2+O(�y)6. (3.6)
The resulting energy cost of a transverse deformation is not only drastically lower than that of
the longitudinal deformation; in fact, the energy cost is negligible in the harmonic approxima-
tion! Thus, it makes sense that such structures would create low-frequency (that is, low energy)
transverse vibrations that do not necessitate movement of adjacent particles.
r
(a)
(b)
(c)
δx
δy
r+δx r-δx
xy
Figure 3.19: Illustration of single-particle deformationsin a linear chain of particles, showing aparticle with two neighbors in a line connected by springs (a) at its equilibrium position, withinter-particle spacingr, (b) under a longitudinal deformation of size�x, and (c) under a trans-verse deformation of size�y.
91

However, such low-coordination, “dangling” structures do not account for all highly lo-
calized modes in these packings. As can be seen in Fig. 3.18, locally rigid particles with
up to 4 nearest neighbors can exhibit highly localized low-frequency modes. Additionally,
not all particles with a locally linear structure contribute to highly localized, low-frequency
modes. We can identify such locally linear structures using a local linear order parameter
2i =1
NN
∑
j=NN exp(−i2�ij), where�ij is the angle between a given direction and the bond
between particlesi andj. Particles with a high∣ 2i∣ exist in locally linear structures, with the
local linear orientation of neighbors given by the complex phase of 2i. As can be seen by
comparing Fig. 3.20 to Fig. 3.18, not all particles with local linear structure necessarily exhibit
highly localized, low-frequency vibrational modes.
0.0 0.2 0.4 0.6 0.8 1.0
PD
F
|ψ2|
Figure 3.20: Characterization of linear structure distribution in a packing with area fraction� = 0.64. (Left) Histogram of∣ 2i∣ for particles in the packing. (Right) Particle positions for� = 0.64 packing, with particles with∣ 2i∣ ¿ 0.6 highlighted in purple. Arrows indicate anglegiven by the complex phase of 2i. Scale bar= 10�m.
92
3.5 Conclusion
It appears that decreasing the area fraction of a quasi-2D packing of attractive colloidal particles
below a certain threshold results in a distinct crossover into a new structural state characterized
by additional low-frequency vibrational modes. These additional modes are associated with mo-
tions that are highly localized to particles with low-coordination. The change in the shape of the
low-frequency tail of the vDOS of these packings due to the addition of these localized modes
provides a straightforward method of distinguishing similar looking attractive packings. Once
the underlying mechanisms of this crossover are better understood, this change might even be
used as a method for distinguishing glass and gel states in attractive packings of intermediate
density. Since previous work has correlated spatially localized modes to rearrangement-prone
regions in disordered packings [12,13,19,42,101,165], this increase of localized low-frequency
modes could correlate with variation in macroscopic rheological properties of the system. Fur-
ther experiments combining the vDOS analysis described above with rheological techniques
could directly observe such correlations.
Additionally, though particles with low-coordination appear to be dominate these character-
istic low-frequency modes, further study is required to identify the exact microstructures which
permit these modes to arise. Thus far, these experiments have been performed in a specific class
of quasi-2D packings with short-range attractions and fairly consistent topology (as discussed
in section 3.2.2). The precise packing fraction at which these modes (and their correlated mi-
crostructures) arise, however, is sure to depend strongly on the dimensionality and morphology
of the system. It should be interesting to investigate this same low-frequency behavior in vari-
ous types of attractive colloidal systems, i.e., 2D and 3D particle gels formed at different rates
93

under different strength potentials, or under anisotropic or long-range repulsive potentials. Such
studies will facilitate investigation of the generality of the gel-glass crossover we have observed.
94

Chapter 4
Elasticity-Dependent Self-assembly of
Micro-Templated Chromonic Liquid
Crystal Films
4.1 Introduction
The engineering of novel metamaterials and biomimectic structures demands increasingly cre-
ative methods for shaping materials at the microscale. In recent years, self-assembly has been
explored as a route to the creation of complex structure in various soft materials. Promising
methods of self-assembly include programmed assembly of colloidal particles with designed in-
teractions [40,103] and controlled buckling in thin films due to competing stresses [11,76,172].
In the latter case, the interplay of bulk elastic properties guided by structured templates can give
rise to varied and complex microstructures [11].
95

In a similar vein, self-assembly via templating of elastically anisotropic media has recently
been demonstrated in liquid crystal films confined by micropillar arrays. Some such experiments
employed microstructured templates to create arrays of defects in liquid crystal films. [15,57,58]
These kinds of structures have been shown to be useful for the nucleation of novel bulk (3D) LC
phases [57, 58] and for manipulation of colloidal configurations at surfaces. [15] Related work
has induced bistable local director alignment in liquid crystals, yielding applications for low-
energy display technologies. [77–79] However, to date such methods have only been applied to
thermotropic nematic and smectic liquid crystals.
Lyotropic chromonic liquid crystals (LCLCs) are an important and relatively unexplored
class of anisotropic fluids conducive to microscale self-assembly and compatible with aqueous
media. As opposed to thermotropic liquid crystals (TLCs), which are fluids composed of a single
species of anisotropic molecule, lyotropic liquid crystals form from anisotropic molecules or
particles suspended in a solvent. Lyotropicchromonic liquid crystals are composed of plank-
like aromatic molecules which, in turn, act as primary mesogens that stack into multi-molecular
linear aggregates which form liquid crystal phases.
Patterned films of LCLCs have a wide variety of emerging applications distinct from other
types of liquid crystals, including inexpensive polarizing films, [32,98,99] holographic displays,
[102,151] organic electronics and solar cells, [115,119] biosensors, [144,168], aqueous colloidal,
nanotube and bacterial assembly, [38,113,120,146,188] and precursors to structured graphene-
based materials. [49,110] Besides these potential applications, LCLCs also offer useful attributes
for fundamental investigation of the effects of elasticity on self-assembly behavior since their
elastic properties can be tuned via control of mesogen concentration, [189] and via depletants
96

and ions. [121] Indeed, studies have demonstrated that LCLCsin micro-scale confinement form
unique, elastic-property-dependent configurations. [64,158]
In this chapter, we describe the patterning of LCLC films within micropost arrays. The pat-
terns are formed via modulation of the LCLC mesophases and LCLC elastic properties by con-
centration changes during drying. We discover a preferred alignment in nematic films governed
by elastic interactions with post-placement geometry, and we observe multiple patterned states
of the columnar phase. This templating scheme has not been applied previously to lyotropic LC
systems, and this contribution provides a first example of quasi-2D micropatterning of columnar
LC films. We develop a numerical model to understand observed differences in patterning, and
this model suggests that such effects are due to the inherent anisotropic elastic properties of films
that evolve during a slow “concentrating” process. Thus, the multiple configurations that form
are based on changes in bulk elastic properties, rather than changes in applied fields [77, 79] or
changes in confinement geometry [78].
4.2 Contextual and Theoretical Background
4.2.1 Lyotropic Chromonic Liquid Crystals
Liquid crystals (LC’s) are fluid materials of anisotropic components (ormesogens) which lack
sufficient translational order to form a true solid, but still retain some degree of orientational
order. Most commonly, the mesogens are rod-like or plate-like in shape. Nematics, which are
composed of mesogens oriented along the same direction but with no additional structuring, are
arguably the prototypical example of a liquid crystal phase. Other common mesophases include
smectic phases, wherein the orientationally aligned molecules also have translational order in a
97

single dimension and form layers, as well as columnar phases,wherein mesogens form “stacks”
which acquire translational order in two dimensions.
Liquid crystal mesophases occur in a broad spectrum of materials.Thermotropic LC’s are
fluids composed of a single anisotropic molecular mesogen, whose phase behavior depends pri-
marily on temperature. Liquid crystal phases can also occur in suspensions of anisotropic meso-
gens in a solvent. These are referred to aslyotropic liquid crystals. Lyotropic LC phases can
be formed from suspensions of sufficiently small and anisotropic colloids or molecules, (i.e.
nanotubes [63], viruses [164], and polymers [164], but the term “lyotropic liquid crystal” is typ-
ically associated with suspensions of amphiphilic molecules. Amphiphiles have especially rich
phase behavior, since they can self-assemble into structured micelles and vesicles even at low
concentrations. At higher concentrations, they form nematic phases of distorted micelles, cylin-
ders assembled in columnar phases, lamellar phases of bilayer sheets, and complicated gyroid or
“plumbers nightmare” phases [14,145].
Lyotropic chromonic liquid crystals (LCLCs), are a subset of lyotropic LC’s with unique
structure and phase behavior [98, 99, 150]. LCLCs are typically composed of plank-like pol-
yaromatic compounds with ionic side-groups. When suspended in water (or in similar polar
solvents), these molecules stack to form linear aggregates. Conventional knowledge indicates
that in most LCLC suspensions, these molecules aggregate face-to-face, via interactions facili-
tated by pi-pi interactions between benzene groups and the relative hydrophilicity of ionic side
groups. This broad explanation is not necessarily true for all LCLC forming molecules, and
debate and research into the mechanisms and dynamics of aggregate formation, as well as their
most basic structure, is still ongoing [98,99,150]. Unlike the formation of micelles in amphiphile
98

suspensions, the aggregation of molecules in LCLC systems isisodesmic, meaning the energy
cost of adding molecules to an aggregate is constant and independent of aggregate size. Conse-
quently, there exists no Krafft point, or point equivalent to the critical micelle concentration, in
these suspensions. As a result, aggregates form even in very dilute suspensions.
Nema�c (N) Columnar (M)Isotropic
Figure 4.1: Illustration of the mesogen structure in lyotropic chromonic liquid crystals. (Top)Plank-like LCLC-forming molecules, when suspended in water, form linear aggregates, whichact as mesogens for liquid crystal phases. (Bottom) The common liquid crystal phases of aggre-gates in chromonic liquid crystals are nematic (N) at intermediate concentrations and columnar(M) at higher concentrations.
As the suspended LCLC-forming molecules become more concentrated, the length and con-
centration of molecular aggregates grows to a point where the aggregates act as the mesogens
of liquid crystal phases. Most LCLC’s exhibit qualitatively similar phase behavior. At a high
enough concentration, there is a transition to a nematic phase of aggregates (denoted as N on
phase diagrams). At still higher concentrations, the aggregates will grow long enough and
crowded enough to form “columns” ordered in two dimensions in a so-called columnar phase
(denoted as C or M on phase diagrams). Additionally, there will typically be coexistence of
99

I-N and N-M phases over some concentration range. Raising thetemperature of these systems
will cause the average aggregate size to decrease, and it can cause the N or M phases to “melt”
into the isotropic phase (at sufficiently high temperatures). Though the average aggregate size in
these suspensions plays a major role in governing the liquid crystal phase behavior, the aggregate
size at a given concentration and temperature is significantly polydisperse, making it difficult to
form certain common liquid crystal mesophases (e.g., smectics).
4.2.2 History of Chromonics
LCLCs have been observed and studied continuously over the past century [98,99,150]. The first
reported observation of a LCLC phase is given by Sandquist in 1915, when a nematic texture
was observed in an aqueous suspension of phenanthrene sulfonic acid. Similar phases, with
their accompanying structure of “stacked” molecular aggregates, were observed in a variety of
dye-based suspensions over the next several decades. A significant leap in understanding of
these materials was reached with the discovery of LCLC phases in the asthma drug disodium
cromoglycate (DSCG, marketed as Cromolyn) in the early 1970’s , and subsequent studies into
its molecular and mesophase structure. The term “chromonic” was coined shortly thereafter by
John Lydon and co-workers to describe this class of liquid crystals. This descriptor originated as
a reference to the bis-chromone structure of DSCG (in a similar manner to how “cholesteric” is
used to describe a broad class of chiral nematic phases first observed in cholesterol). However,
this term ended up being a coincidentally appropriate term, as it also described similar phases
discovered in aqueous suspensions of various dyes (chromo- being a common prefix referring to
color) and nucleic acids (e.g.,chromosomes).
Over the past several decades, dozens of molecules have been discovered which form chromonic
100

liquid crystal phases. The past decade in particular has seena significant spike in interest in the
phase behavior and structural properties of this class of materials. As can be seen from the plot
in Fig. 4.2, there has been a drastic increase in the number of scientific publications referencing
LCLCs since the turn of the millennium.
1980 1985 1990 1995 2000 2005 2010 2015
0
2
4
6
8
10
12
14
16
18
Web of Science
Cita
tions
from
Web
of S
cien
ce
Year
0
20
40
60
80
100
120
140
Google Scholar
Cita
tions
from
Goo
gle
Sch
olar
Figure 4.2: Number of academic articles containing the keyword “chromonic” from Web ofScience (open circles) and Google Scholar (filled squares) per year from the past few decades.
4.2.3 Emerging Applications of LCLCs
The aforementioned spike in interest in LCLC’s may have to do with emerging ideas for unique
applications for these materials. Since these molecules form lyotropic LC’s at relatively low
weight concentrations, and since they are fairly easy to work with, many potential applications
have to do with creating simple optically patterned materials. One of the oldest and most popu-
lar ideas is the fabrication of polarizing films. Since a film of a well-aligned LCLC nematic or
columnar retains its birefringence when dried, researchers have proposed using it as a replace-
ment for more costly methods for producing polarizing films, e.g. Polaroid, which involves the
101

inclusion of birefringent iodine crystals in an aligned polymer matrix [98, 99, 123]. This idea
dates back at least to the 1940’s, when John Dreyer submitted a patent for creating polarizers
from dried aligned dye films [32], i.e., well before the details of LCLC phases were well under-
stood. Additionally, studies which have created micropatterns of LCLC’s have posited that such
optically micropatterned materials would be useful in holographic displays [102,151].
The multi-molecular stack structure of mesogens in LCLC’s gives them unique optical, elec-
trical and structural properties. Since the mesogens in LCLC’s are stacked aggregates of plank-
like molecules, the optically anisotropic molecules are aligned perpendicular to the local LC
director field. This gives LCLC’s negative bifrefringence, a property of the index of refrac-
tion of a material for light polarized along a material’s extraordinary axis (in the case of liquid
crystals, along the director); in this case, the index along the extraordinary direction,ne, is
lower than the index observed for light polarized along the ordinary axis (perpendicular to the
director), no. Materials with negative birefringence are useful for making compensators for
wide-angle viewing aberrations in liquid crystal displays [98]. Additionally, the pi-pi stack-
ing of molecules within aligned molecular aggregates in LCLCs gives them some anisotropic
conductivity, which has been studied for potential application in organic electronics and solar
cells [115, 119]. These molecular stacks are similar enough in structure to graphitic phases of
carbon that aligned LCLC films can be chemically treated so that the LCLC-forming molecules
transform into vertically aligned graphene layers. These surfaces have potential applications as
conductive transparent films, superhydrophilic surfaces, and high speed, high storage lithium
battery electrodes [49,110].
Though both amphiphilic and chromonic lyotropic liquid crystals can be made in aqueous
102

suspensions, LCLCs have been shown to have significantly lower toxicity to micro-organisms
[168]. As a result, patents have been written for using LCLCs as components in devices for op-
tical detection of biological impurities in solution [144]. Additionally, since bacteria can survive
safely in these materials, LCLCs can be potentially used to manipulate and order suspensions
of micro-organisms [113, 146, 188]. It has been shown that LCLCs are also effective for the
alignment of other hydrophilic colloidal materials, e.g., gold nanoplates [38] and carbon nan-
otubes [120], which could lead to the production of unique, water-based meta-materials.
4.2.4 Barriers to Practical Application of LCLCs
In order for LCLCs to be realized in the applications described in the previous section, there are
significant engineering issues that must first be overcome. Two of the most prominent obstacles
are the lack of consistent alignment methods and instabilities during the drying process.
Though alignment of thermotropic LCs has been mastered for decades, the alignment of
LCLCs by adjacent surfaces is significantly more difficult, in part because LCLC mesogens
are large multi-molecular aggregates instead of single molecules. Creating a surface that in-
duces strong planar alignment of TLCs is as easy as rubbing a polymer film with a fine fab-
ric. Such a technique, however, has only been successfully deployed to induce strong planar
alignment in LCLC suspensions using a certain polyimide polymer, SE-7511 (Nissan Chem-
ical, Japan), whose manufacture has been discontinued [144]. A planar alignment method
for LCLCs implemented recently covers a glass surface in nano-grooves by rubbing it with
103

a fine abrasive [104, 189]. However, this method has been shownto induce planar anchor-
ing energies on the order ofW = 3 × 10⁻⁷J/m2, which are weak compared to the align-
ment energies necessary for practical applications (in typical applications utilizing thermotrop-
ics, W = 10−6 − 10−5J/m2) [104]. Studies have shown that silanization of a glass surface
using octadecyldimethyl(3-trimethoxysilylpropyl) ammonium chloride (DMOAP), a molecule
which induces strong homeotropic (perpendicular) anchoring in many TLC’s, can only induce
transient homeotropic alignment in LCLCs at best [116]. Only very recently has it been shown
that homeotropic alignment of LCLCs can be induced by noncovalent interactions with sur-
faces containing molecules with similar polyaromatic structure, i.e., graphene, parylene films,
poly(methyl methacrylate) films, and fluoropolymer films [65], as well as polybutadiene and
polydimethylsiloxane [156,157].
In a related vein, many potential applications of LCLCs involve drying these films, which
can cause the random formation of defects throughout the sample. Fig. 4.3 shows a nematic
DSCG suspension placed between glass slides rubbed with an abrasive, creating an aligned film
approximately 10�m thick. Then, as water evaporates from the open edges of the cell, the
suspension becomes more concentrated and enters the columnar phase. Rather than remaining
consistently aligned, the director in the columnar phase buckles throughout the sample, forming
what is commonly called a “herringbone” texture when viewed under crossed polarizers. This
behavior is a common phenomenon in LCLCs, as well as in other liquid crystals transitioning to
the columnar phase. As solvent leaves the system and the individual aggregates grow in length
in a confined geometry, a buildup of stress causes the columns to buckle. If aligned films are
prepared through a “doctor blade” spreading method, where a nematic drop of LCLC is slowly
104

scraped along a surface with a narrow blade, this effect can beminimized, as the shear from the
movement of the blade serves to align the film as it evaporates. However, even carefully prepared
LCLC films stabilized by polymer additives can show some evidence of director buckling at the
microscale [123].
Nema�cColumnar
PA
Open edge
Figure 4.3: Nematic DSCG suspension placed between glass slides rubbed with an abrasive, cre-ating an aligned film approximately 10�m thick, viewed under crossed-polarizers. Evaporationproceeds from an open edge beyond the upper right corner of the image, causing drying into thecolumnar phase. Though drying is slow, herringbone textures can be seen in the columnar phase.
The work described in this chapter is partially motivated by the desire to control the afore-
mentioned issues in LCLCs using micro-templating. As mentioned in the introduction to this
chapter, work on TLCs in square micropost arrays has induced bistable local director alignment
in liquid crystals, yielding applications for low-energy display technologies [77–79]. Microp-
osts may then be an effective method for inducing strong in-plane alignment in LCLC films.
Additionally, several recent experiments at the University of Pennsylvania have employed mi-
crostructured templates to create arrays of defects in TLC films [15,57,58]. Though our scheme
105

may not serve as a method to completely eliminate defect formation in columnar films, we be-
lieve it may (at least) be an effective method for controlling the placement and topology of these
defects, i.e., rather than allowing them to nucleate randomly throughout the sample.
4.2.5 Elastic Deformations in LCLCs
The free energy cost of deformations in a nematic can be stated in a very general form as
F =1
2Kijkl∇inj∇knl, (4.1)
wheren is a unit vector representing the local director [16]. Under several geometrical as-
sumptions, including the mesogens being nonpolar (or,n → −n) and the mesogens not having
chirality and thus being invariant under reflections (x → −x), this reduces to the well-known
elastic energy of deformations in a nematic liquid crystal, the so-called Frank free energy:
FFrank =K1
2(∇ ⋅ n)2 +
K2
2(n ⋅ ∇ × n)2 +
K3
2((n ⋅ ∇)n)2. (4.2)
This equation breaks down elastic deformations of a director field in a nematic LC into three
fundamental geometrical distortions depicted qualitatively in Fig. 4.4, namely,splay (∇ ⋅ n),
twist (n ⋅ ∇ × n), andbend ((n ⋅ ∇)n). The elastic constantsK1, K2 andK3 are thus spring-
constant-like parameters associated with the free energy cost of each of these deformations,
respectively.
Experimental observations of thermotropic nematic liquid crystals show that many of them
tend to have Frank elastic constants of the same order of magnitude. Thus, theoretical and
106

Splay (K1) Twist (K
2) Bend (K
3)
Figure 4.4: Qualitative illustration of the director deformations contributing the splay (K1), twist(K2) and bend (K3) deformations.
numerical models of director configurations of nematic liquid crystals often use the assumption
thatK1 = K2 = K3, such that the Frank free energy reduces to:
FFrank =K
2((∇ ⋅ n)2 + (∇× n)2). (4.3)
Lyotropic chromonic liquid crystals in the nematic phase, as well as polymer-based liquid
crystals, are not well modeled by this assumption. ThoughK1 andK3 typically have similar
values, they are an order of magnitude larger thanK2 in these materials. A consequence of
this relative ease of twist deformation is that confined droplets of LCLC’s form stable director
configurations which break chiral symmetry [64,158].
The Frank elastic constants in LCLCs can be modified by formulation of the suspension.
The overall and relative magnitude of theseK ’s varies with temperature and solute concentration
[114,189]. It has also been shown that adding a non-adsorbing polymer, (e.g., PEG) to a LCLC
suspension in isotropic-nematic coexistence will locally concentrate nematic tactoids, and will
induce crowding and lengthening of linear aggregate mesogens which, in turn, raises the ratio of
K1/K2 [121,158]. Also, the addition of salt can effect the phase behavior and elastic constants
of LCLCs, generally increasingK1 and decreasingK3 [121].
107

The effects of formulation on elastic behavior of LCLCs can beexplained by the relationship
between lyotropic mesogens and bulk elastic liquid crystal properties. According to [23], in a
lyotropic liquid crystal,K1 ∝ L, whereL = L0eEakBT is the average aggregate length, andEa is
the energy needed to split an aggregate in two. As a LCLC becomes more concentrated,L will
increase (as discussed in Section 4.2.1), as willK1. Addition of salt will screen charges between
individual molecules, making them more likely to aggregate (or, equivalently, increasingEa).
This will also increaseL and consequently increaseK1. LCLCs have been seen to fit well to
theories for nematics of semi-flexible rods, and in this case,K3 ∝ P , whereP is the persistence
length of a linear aggregate. AsP is independent ofL, concentration does not have as drastic
an effect onK3 as it does onK1. However, additional salt serves to screen the aggregate chains
from themselves, giving them additional flexibility, decreasingP , and consequently decreasing
K3.
4.2.6 Defects in Columnar LCLCs
Defects in columnar liquid crystals are distinct from their counterparts in nematics due to very
different costs of certain elastic deformations. Specifically, bend deformations of the director
become much less energetically costly than splay or twist, since they best preserve columnar
order. From another point of view, as a nematic transitions into the columnar phase, there is a
necessary coupling between the density and the director [67,69,154] that results in a lengthscale
dependence ofK1, as well as a coupling between the crystalline order and the director, resulting
in a lengthscale dependence ofK2 [68]. In both cases these elastic constants diverge for distor-
tions at long wavelengths. Moreover, even in the nematic phase, fluctuations near the nematic to
columnar transition strongly renormalize the elastic constants. [149] Without implementing the
108

full theory of the columnar phases, we can view columnar liquid crystals as a limit of nematics
whereK1 andK2 grow in comparison toK3.
Qualitatively, this idea implies that splay and twist deformations in columnar LC’s are ex-
tremely energetically costly compared to bend deformations. This would also be expected from
the two-dimensional translational order in columnar systems; splay or twist deformations change
the inter-pillar spacing in these packings, bend deformations preserve the two-dimensional lat-
tice. As a result, the only defects observed in columnar liquid crystals are entirely bend-
dominated. The defects in columnar liquid crystals consequently formdevelopable domains,
or rather, domains surrounded by surfaces with zero Gaussian curvature.
In quasi-two dimensional geometries, such as liquid crystal films, defect walls (DWs) sepa-
rate adjacent columnar regions by a discontinuous bend in director field [82]. These defect walls
can be seen in the “herringbone” textures of drying LCLC films. However, LCLCs can also ex-
hibit high-bend, less discontinuous boundaries between aligned columnar domains (though these
are not observed in the following experiments). Curvature walls (CWs), for example, exhibit a
continuous, low-angle bend in the columnar director localized to a line of relatively small width.
Developable domain walls (DDWs) facilitate a bend of intermediate angle through a pattern of
continuously curved regions and short bend defect walls. Following [82], one can estimate the
linear free energy density of these three species of domain boundaries:
109

FCW =1
12
√
K3B1�20, (4.4)
FDDW =�02K3 ln
(
R
r
)
+ Ed sin
(
�02
)
, (4.5)
FDW = Ed, (4.6)
where�0 is the total director angle change across the domain boundary,B1 is the free energy
cost of a lattice spacing deformation in the columnar liquid crystal, andR andr are the spacing
and width of defect walls in DDWs, respectively. By setting these free energy densities equal
at specific�0 values, one can estimate the domain bend angle at which the boundary transitions
from a CW to a DDW(�1) and a DDW to a DW (�2) as
�1 =
√
12Ed�
K3, (4.7)
�2 = �/3, (4.8)
given several assumptions about the boundary geometries and elastic constants.
4.3 Experimental and Numerical Methods
In these experiments, we create microscopically thin films of chromonic liquid crystals in ar-
rays of microscopic posts, and we model their structure using numerical free energy minimiza-
tions. We thus make unique progress by combining previous knowledge of the formulation of
110

chromonic liquid crystal suspensions, photolithographic synthesis of micropost arrays, polar-
izing microscopy of liquid crystals and numerical modeling of liquid crystals. Some of these
techniques were used in previous work, though we push the limits of their applicability.
4.3.1 Choice of LCLC Suspensions
We choose to utilize aqueous suspensions of two well-studied chromonic liquid crystal forming
molecules in our experiments. The first, disodium cromoglycate (DSCG, also known as Cro-
molyn, also known as cromoglicic acid) is used as an active ingredient in various drugs that treat
asthma and allergies (e.g., Intal, an inhaler-based preventative asthma treatment, and Opticrom,
eye drops for alleviation of allergetic conjunctivitis). The second is Sunset Yellow FCF (SSY,
also known as FD & C Yellow 6, also known as Orange Yellow S), a food dye with a deep
reddish-orange hue. SSY is one of the most commonly used food dyes in the United States,
lending its distinctive coloring to Doritos, Cheetos, Dayquil, and many other consumables.
We use these two particular molecules, rather than any of the dozens of other known LCLC-
formers, not because of their applicability in consumer goods, but rather because of the exist-
ing in-depth of understanding of their phase behavior and elastic properties. DSCG was one
of the first seriously studied LCLCs, and it has been characterized extensively since the early
1970’s [98, 99, 114]. The LCLC-forming properties of SSY have not been studied for quite
as long as DSCG, but within the past decade liquid crystal suspensions of this dye have been
well characterized and implemented in many experiments probing the phase behavior and self-
assembly of LCLC’s in confined geometries [64,121–123].
Most importantly, DSCG and SSY are two of the only LCLCs whose elastic properties in
the nematic phase have been quantified and characterized [114,189]. The Frank elastic constants
111

Figure 4.5: Molecular structure and aqueous suspension phase diagram of disodium cromogly-cate (left) and Sunset Yellow (right). Phase diagram of DSCG from [98]; phase diagram of SSYfrom [122]; molecule images from Wikipedia.
have been measured at several temperatures for a single concentration of DSCG (14% by weight,
or wt/wt) and for three concentrations of SSY (29.5%, 30%, and 31.5%); this previous work thus
allows us to make some qualitative comparisons between films composed of these materials.
The suspensions have elastic constants of a similar order and relative proportion (i.e.K1, K3
≈ 10K2), though there are some slight differences in elastic properties which, as we will see in
our experiments and numerical models, play an important role in the formation of micropatterned
configurations.
Although we have just pointed out that SSY and DSCG are fairly well characterized LCLC
suspensions, most experiments to date investigate the behavior of either one suspension or the
other; the two are never compared in the same work. This situation is mostly likely due to
several key differences between these LCLC suspensions. DSCG does not absorb much light in
112

the optical spectrum, making it more ideal for optical imaging than SSY, which, as a dye, absorbs
heavily. Also, qualitative rheological differences in the behavior of these suspensions are evident
from their preparation. A nematic DSCG suspension close to the isotropic-nematic phase border
(10 % wt/wt) is significantly more viscous that a more concentrated nematic SSY suspension
(> 28 % wt/wt). When observed under the microscope, SSY mesogens appear to relax much
faster than their DSCG counterparts. Also, while defects in the nematic director field are not
often visible / easily distinguishable in DSCG suspensions, they are readily observed as optical
aberrations in SSY. The nematic phases of DSCG and SSY separate when the two are mixed
in solution together, implying basic chemical incompatibility. This effect is evident not just
from the differences in molecular structure, but from some known differences in the assembly
of multi-molecular aggregates (SSY molecules supposedly stack in a staggered pattern). Thus,
though they are both LCLC suspensions with similar elastic constants, comparisons between
these materials must be taken with a grain of salt.
4.3.2 Synthesis and Loading of Micropost Arrays
We create chromonic liquid crystal films in photolithographically printed arrays of cylindrical
microposts (Fig. 4.6). Photolithographic techniques are used to make cylindrical microposts
of negative tone epoxy-based photoresist, SU-8 2000 series (Microchem Inc.) on a glass sub-
strate. We employ cylindrical posts in order to separate the effects of micropost placement from
micropost shape, since previous studies show that anisotropic or sharp-featured post shapes can
dominate alignment and organization of liquid crystals. [77,155] Micropost cylinders with height
ℎ =5�m, and diameterd = 7�m, are arranged in a square lattice with center-to-center pitch ofa
= 14�m.
113

5
1h
dL
2
3
4 b
a c
L
d
Figure 4.6: Configuration of micropost arrays loaded with liquid crystals. a) Bright-field mi-croscopy image of an empty SU-8 micropillar array with post center spacingL = 14�m, di-ameterd = L/2 = 7�m, and heightℎ = 5�m. Scalebar = 50�m. Inset: close-up of microposts,indicatingd andL. b) Schematic of micropost array configuration after loading with LCLC film.SU-8 microposts (1) sit atop a glass wafer (2). After being loaded with a LCLC (3), the waferis placed in a glass petri dish (4) and immersed in hexadecane(5). c) Schematic of LCLC filmloading procedure. A droplet of heated LCLC suspension is placed in a droplet onto a cleanedand heated micropost array where it begins to spread due to capillary forces (top); immediatelyafterward, hexadecane is placed to completely cover the sample, and LCLC droplet continues tospread (middle); after several minutes, the LCLC film has spread to cover the entire micropostarray, leaving a level film at the post height (bottom).
114

After the micropost arrays are thoroughly rinsed and plasma-cleaned, they are filled with
one of the two LCLC-forming molecules mentioned in the previous section (DSCG and SSY)
suspended in Millipore filtered water at various concentrations. DSCG is sufficiently pure to
be used as-is; SSY, by contrast, is purified by re-suspension in water, precipitation through the
addition of ethanol, and centrifugation several times in order to reach a purity of> 99%.
The procedure for filling the micropost array with LCLC is illustrated in Fig. 4.6. Micropost-
covered glass slides are placed in a petri dish and heated to 60∘C. At the same time, the LCLC
suspension (which is in the isotropic phase at this temperature) is also heated to 60∘C. A droplet
of 2-3�L of LCLC solution is placed on the substrate and then spreads rapidly due to capillary
interactions with the microposts. Several mL of hexadecane are then immediately placed over
the LCLC and substrate in order to prevent rapid evaporation of the aqueous suspension. The
entire system is left at 60∘C for several minutes, until the LCLC droplet has ceased spreading.
The petri dish is then placed on a microscope stage at 25∘C and allowed to cool to ambient tem-
perature, at which time the LCLC film re-enters the nematic mesophase. The LCLC-hexadecane
surface tension is large enough to insure that the aqueous film spreads evenly through the mi-
cropost array, eventually resting at the high-edge of the micropillars with an undeformed, flat
interface. Under these conditions, all surfaces in contact with the aqueous phase (glass sub-
strate, pillar sides, and hexadecane interface) induce degenerate planar anchoring of the LCLC
mesogens.
4.3.3 Polarizing Imaging and Director Field Analysis
One significant technical innovation of this thesis concerns a means to carry out high-fidelity liq-
uid crystal director analysis using polarization video microscopy. Birefringent lyotropic chromonic
115

liquid crystal (LCLC) films in micropost arrays are placed on arotating stage of a Leica DM IRB
microscope under a 63x air objective between crossed polarizers. Once the stage is centered to
ensure that the center of rotation lies in the microscope field of view, the stage is rotated by hand
a total of 360∘ while video is acquired at 10 frames per second on an UNIQ UP 680-CL digital
camera. The resulting images have a resolution of 312 nm/pixel. The polarizer and analyzer
direction in the resulting video are fixed on the image’s vertical and horizontal axes.
t = 0 sec t = 6 sec t = 8 sec
Figure 4.7: Crossed-polarizer images from a movie of a rotating 30% wt/wt Sunset Yellowaqueous nematic film in an array of cylindrical microposts of diameter 7�m and height 5�m,overlaid with bright circles centered at tracked post centers. Polarizer and analyzer orientedalong the vertical and horizontal of images. Scale bars = 50�m.
To obtain the translation and rotation of the sample, we process the images, and in this pro-
cess, render the post locations trackable via well-used particle tracking algorithms. Specifically,
we invert the image (by subtracting the current pixel values from the maximum value), increase
the image contrast by raising the pixel intensity to the eighth power, and then convolute the re-
sulting image with the image of a bright disk whose radius equals the observed post radius in
the images (Fig. 4.8). After setting all pixels below an arbitrary threshold to zero, the resulting
“processed” image gives us a set of bright intensity peaks located at the centers of each post. We
then track these bright intensity peaks using a commonly used sub-pixel tracking algorithm [26].
The tracked post locations compare well with the original unprocessed image (Fig. 4.7).
116

t = 0 sec t = 6 sec t = 8 sec
t = 0 sec t = 6 sec t = 8 sec
Figure 4.8: Intermediate post-processing steps for post tracking a rotating 30 percent SunsetYellow aqueous nematic film in an array of cylindrical microposts of diameter 7�m and height5 �m. (Top) Inverted cross-polarizer images, calculated from subtracting original image pixelvalues from the maximum pixel brightness. (Bottom) Inverted images convoluted with a uni-formly bright disk of diameter equal to the post diameter, yielding near-gaussian peaks centeredat the post centroids. Scale bar = 50�m.
117

Importantly, the resulting tracks of the post centers yield useful information about the mo-
tion of the sample during its rotation between the crossed-polarizers. We first calculate the
average motion of all tracked posts from frame-to-frame; this yields the translational motion
of the sample, e.g., due to slight shifts of the stage during manual rotation. We then remove
this frame-to-frame translational motion from the video using a cubic convolution interpolation
method. This procedure yields a video with pure rotational motion (Fig. 4.9).
a b
100 200 300 400 500 600
100
200
300
400
500
y co
ordi
nate
(pi
xels
)
xcoordinate (pixels)
100 200 300 400 500 600
100
200
300
400
500
y co
ordi
nate
(pi
xels
)
x coordinate (pixels)
Figure 4.9: (a) Trajectories of 59 posts tracked through a 360∘ sample rotation. (b) Trajectorieswith average translational motion per frame removed.
t = 0 sec t = 6 sec t = 8 sec
Figure 4.10: Selections of images of the SSY film from Figure 1,with net sample rotation andtranslation removed. Polarizer/analyzer are oriented at angles of 0∘ (t = 0 sec), 37∘ (t = 6 sec),and 55∘ (t = 8 sec) with respect to the vertical/horizontal of images.
118

The rotation of the system from framet to t + 1 is calculated as the average rotation angle
�i(t) of each post position(xi, yi) around the mean post position(x0, y0). This is calculated
using the approximation�i = drperp/r, wheredri(t) = [xi(t+1)−xi(t),yi(t+1)−yi(t)] is
the motion of a post,ri(t) = [xi(t)−x0, yi(t)−y0] is the distance between the post and the center
of rotation, anddrperp is the component ofdr perpendicular tor. We expect this approximation
to be valid, since the rotation of the system over a single time frame is no greater than 3∘. The
rotation�(t) is then removed from the original, unprocessed images using a cubic convolution
interpolation. The resulting video shows stationary posts as the polarizer and analyzer are rotated
at an angle�pol = −�sample to the vertical/horizontal directions in the images (Fig. 4.10).
The equation for transmitted light intensity through a birefringent liquid crystal sample be-
tween crossed-polarizers is given by
It = Ii sin2(�/2) sin2(2�), (4.9)
where � is the angle between the optical axis of the liquid crystal (director) and the polar-
izer/analyzer. The retardation� depends on the sample thickness, birefringence, and out-of-
plane tilt angle. Assuming the director is purely in-plane, then the term containing� will not
vary spatially, and the relative intensity should depend only on the term containing�. Thus, we
consider the intensity variations per pixel as the polarizer and analyzer are rotated with respect
to the LCLC film:
It = I0 sin2(2(�dir − �pol)), (4.10)
whereI0 is a qualitative measure of the in-plane director order (note, a small value indicates local
119

disorder due to a defect or a director oriented slightly out-of-plane. Large out-of-plane directors
will cause changes in� which can decreaseor increaseI0). Indeed, by looking at representative
pixels intensities in a motion-removed image, we see this functional form fits quite well (Fig.
4.11). By fitting curves to Equation 4.10, withI0 set as the amplitude of intensity fluctuations,
we find the average in-plane director angle�dir at each pixel in the image.
0 50 100 150 200 250 300 3500.00
0.25
0.50
0.75
1.00
Nor
mal
ized
Inte
nsity
θpol
(°)
0 50 100 150 200 250 300 3500.00
0.25
0.50
0.75
1.00
Nor
mal
ized
Inte
nsity
θpol
(°)
1 2
a
b
c
Figure 4.11: (a) Selection of unprocessed video of SSY film under crossed-polarizers, when thepolarizer/analyzer is oriented at an angle of 0∘ (t = 0 sec) with respect to the vertical/horizontalof the image. (b-c) Image brightness / transmitted light intensity at pixels 1 and 2, respectively, asa function of the angle of polarizer/analyzer to image horizontal/vertical,�dir. Red lines indicatefits to the functionI = I0 sin
2(2(�dir − �pol)) + B, whereI0 is the difference in maximumand minimum intensity, andB is the minimum intensity value. For (a),�dir = 42.3∘, and (b),�dir = 30.15∘.
We note that there exists a degeneracy in this fitting method for finding�dir, sinceI0 sin2(2(�dir−
�pol)) = I0 sin2(2((�dir + �/2) − �pol)). However, we can determine whether local direc-
tor orientation follows�dir or �dir ± �/2 by comparing images with full-waveplate retardation
crossed-polarizer images (which distinguishes local directors under�/2 rotations), by observing
local post boundary conditions (directors should lie parallel to post surfaces in minimum-energy
120

t = 6 seca b
Figure 4.12: (a) Relative in-plane director magnitude,I0. Indications of defects at the edges ofposts are shown as small dark spots. (b) In-plane director orientation (red lines) plotted overgrayscale image of in-plane director magnitudeI0. For the sake of clarity, only every 10th pixelis represented in this image.
configurations), and by minimizing obvious director discontinuities.
4.3.4 Numerical Modeling of Liquid Crystals in Micropost Arrays
To supplement and verify our experimental observations of liquid crystal configurations in mi-
cropost arrays, we perform numerical minimizations of a phenomenological Landau de-Gennes
(LdG) free energy for a nematic director field under similar confinement conditions [15, 138].
The free energy is minimized in a finite difference scheme on a regular cubic mesh, using a
conjugate gradient minimization routine from the ALGLIB package. Specifically, we simu-
late a box of 50× 50 × 15 points, with a 24-point diameter cylindrical pillar in the center,
tangential boundary conditions at the top, bottom and post surface, and periodic boundary con-
ditions at the edges. In the uniaxial limit, the LdG free energy is written in terms of the tensor
Qij = 32S(ninj − 1
3�ij), whereni is theith component of the nematic director,�ij is the Kro-
necker delta, andS is the nematic degree of order. The free energy density (per unit area) is a
121

sum of two components: a phase free energy density
fphase =
∫
dV
(
1
2ATr
(
Q2)
+1
3BTr
(
Q3)
+1
4C(
Tr(
Q2))2)
(4.11)
and a gradient free energy density, which, for a generic nematic LC with equal elastic constants
reads
fd =1
2L
∫
dV (∇Q)2. (4.12)
For lack of better information about elastic properties of LCLCs, we used values for A, B
and C consistent with a commonly studied thermotropic nematic liquid crystal, 4-cyano-4’-
pentylbiphenyl (5CB).
Though the above free energy suffices for qualitative modeling of generic nematic liquid
crystals, applying these same numerical methods for understanding columnar configurations re-
quires care. The distortion free energy,fd, shown in Equation 2 is a valid approximation for
modeling a generic thermotropic nematic like 5CB. This can be re-stated as a Frank free energy,
fFrank =K1
2(∇ ⋅ n)2 +
K2
2(n ⋅ ∇ × n)2 +
K3
2((n ⋅ ∇)n)2, (4.13)
whereK1, K2, andK3, the splay, twist, and bend elastic constants, respectively, are similar in
magnitude. However, as a nematic transitions into the columnar phase, there is a necessary cou-
pling between the density and the director [67,69,154] that produces a lengthscale dependence of
K1, as well as a coupling between the crystalline order and the director, resulting in a lengthscale
122

dependence ofK2. [68] In both cases these elastic constants diverge at long wavelengths. More-
over, even in the nematic phase, fluctuations near the nematic to columnar transition strongly
renormalize the elastic constants. [149] In this thesis, we do not implement the full theory of
columnar phases; rather, we consider the nematic theory with differing elastic constants, and we
consider the limits whereinK1 andK2 grow in comparison toK3. The above form of the LdG
free energy cannot model this system, as it assumes equalK ’s. However, if we use an expanded
form of the LdG free energy [138],
fd =1
2
(
L1∂Qij
∂xk
∂Qij
∂xk+ L2
∂Qij
∂xj
∂Qik
∂xk+ L3Qij
∂Qkl
∂xi
∂Qkl
∂xj
)
, (4.14)
then, following previous numerical work [138], we find the following relationships betweenL
andK terms:
K1 =9
4S2 (2L1 + L2 − SL3) (4.15)
K2 =9
4S2 (2L1 − SL3) (4.16)
K3 =9
4S2 (2L1 + L2 + SL3) . (4.17)
Therefore, to model columnar configurations, we run the LdG free energy minimizations
under the same conditions as for the nematic case, except we employ the expanded form of the
LdG free energy of Equation 4.14, along with values ofLi such thatK3 is decreased by at least
an order of magnitude compared toK1 andK2. Thus, even though the LdG free energy models
a nematic LC, by using the aforementioned limit of elastic constants, we can approximate an ex-
pected director field as a nematic approaches the columnar phase. As discussed in section 4.2.6,
123

this is reasonable because splay and twist deformations become far more energetically costly
compared to bend deformations in columnar phases, as only bend deformations preserve colum-
nar spacing. Further, instead of initializing the director configuration randomly (which leads to
random defect nucleation and frustrated high energy states), we start with a bulk director field
uniformly oriented in the plane of the post array. As major out-of-plane director deformations
would include large splay and twist components, which are difficult in columnar LCs, and since
the in-plane director component measured in experiments is constant (away from defect walls),
assuming in-plane director orientation is a reasonable assumption to make.
4.4 Results and Discussion
4.4.1 Nematic Configurations
Observations and simulations of nematic LCLC films in micropost arrays demonstrate that such
films have a tendency to align along either diagonal of the square lattice of cylindrical posts. To
create larger, well-ordered films, weak alignment along one direction is necessary to break the
degeneracy along the two diagonals. Competition between this preferred alignment and surface
rubbing demonstrate that the alignment effects of post geometry are comparable to the most
effective surface anchoring methods available at present.
Initial observations of the nematic LCLC films under crossed-polarizers do not indicate any
obvious consistent director patterning on a scale larger than a single pillar spacing (though the
director orientation appears to lie predominantly in-plane). Considering that there may exist mul-
tiple metastable local director configurations for a nematic under such confinement, we sought
to create a more consistently ordered film by introducing a weak directional bias into the film.
124

To achieve this goal, we form the micropillar arrays on glass surfaces that are first rubbed with a
fine abrasive pad (3M Trizact Foam Disc P3000). This rubbing creates nano-sized grooves in the
bottom glass surface which, in turn, induce a weak, oriented planar alignment on the overlying
chromonic liquid crystal [104,189].
b
a
d
c
PA
PA
PA
PA
Figure 4.13: Micropost arrays filled with nematic DSCG (14% wt/wt) at room temperature.Crossed-polarizer (a & c) and crossed-polarizer with full wave retardation plate(b & d) imagesshown with bottom surfaces rubbed along a lattice diagonal (a & b) or a post lattice direction (c& d), as illustrated in the insets. Scale bar = 50�m. The slow axis of the retardation plate isgiven by the orange arrow in (b & d).
As can be seen in Fig. 4.13, the consistency of director patterning in the final film is depen-
dent on the rubbing direction on the bottom surface. For example, a surface rubbing along a
diagonal of the post lattice produces a consistent nematic texture under crossed-polarizers. The
same degree of rubbing along a post lattice direction, however, did not produce coherent pattern-
ing over multiple post spacings. This observation implies a preferred director orientation along
a diagonal of the post lattice, with the symmetry of the bistability broken by the weak oriented
125

anchoring potential provided by the rubbing.
We model a generic nematic film in such a post array using numerical LdG free energy min-
imization, and we find that the minimum energy configuration does indeed demonstrate average
alignment along a diagonal of the micropost lattice, skewing slightly off-diagonal between adja-
cent posts (Figure LC13). Two vertically aligned -1/2 topological disclinations per post are also
observed, separated from the micropost centers along a diagonal of the square lattice, which is
parallel to the average director alignment. This alignment configuration implies a bistable pre-
ferred director orientation along either diagonal of the micropost lattice. We did not observe this
configuration in our initial experiments, because of the random nucleation of diagonally aligned
domains that arises during the isotropic-nematic cooling of the film, thereby creating an “over-
all disordered” director pattern. The anchoring strength of this rubbing technique, though not
strong enough to induce an arbitrary overall alignment, for example, along a lattice direction, is
sufficient to break the two-diagonal degeneracy of the system.
PA
Figure 4.14: Average in-plane director orientation (red lines) from a minimization of the LdGfree energy for a generic nematic in cylindrical micropost confinement, overlaid by the schlierentexture expected when viewed between crossed-polarizers.
126

Quantification of the LC director orientations in the alignednematic films demonstrates that
both DSCG and SSY nematic films have director configurations consistent with our expectations
based on the LdG free energy minimizations for a generic nematic LC (Fig. 4.15). Additionally,
the degree of in-plane director order is observed to decrease close to the microposts, suggesting
the presence of defects or a slight out-of-plane director at locations wherein one would expect
-1/2 disclinations in the LdG free energy minimizations.
d
a b c
e f
PA
PA
Figure 4.15: Nematic films of 14% wt/wt DSCG (a-c) and 30% wt/wtSSY (d-f) in micropostarrays. Images show schlieren textures under crossed-polarizers (a & d), average in-plane direc-tor magnitude (b & e), and average in-plane director orientation for a selected region of 4 posts(c & f). Scale bar = 20�m.
4.4.1.1 Estimation of Anchoring Strength of Rubbing Alignment
Based on the fact that rubbing the bottom surface parallel to the lattice direction does not pro-
duce a single aligned domain, the anchoring from the rubbed surface is not strong enough to
127

overwhelm the alignment preferred by the micropost geometry. Combined with the LdG numer-
ical modeling of the director field outlined in section 4.3.4, we use this experimental result to
estimate an upper boundWmax on the anchoring strength of the abrasively rubbed surfaceW .
In the Rapini-Papoular approximation [137] for uniform planar anchoring at an angle�0 = 0∘
from thex-axis of the post lattice, a director fieldn = (cos �(x, y), sin �(x, y)) at an aligned
surface incurs a free energy penalty per unit area of
fanchor =1
2W sin2(�(x, y)). (4.18)
We can make an estimate ofWmax by including the above free energy penalty in the LdG
free energy minimizations described in Section 4.3.4, varyingW , and observing the change in
stable director configurations. In terms ofQij , Equation 4.18 is
fanchor =W/(16S20)(Q −Q0)
2, (4.19)
where(Q0)ij ≡ 2S(�i�j − 12�ij), � = (1, 0). Equation 4.19 is added to the Landau-de Gennes
free energy densities. As in Section 4.3.4, we minimize the LdG free energy from random initial
conditions, and we observe a pair of−1/2-index disclinations positioned along a line making
an angle−45∘ < �d < 45∘ to the rubbing direction (i.e., thex axis of the micropost lattice).
Since0∘ < �d < 45∘ and−45∘ < �d < 0∘ are geometrically equivalent, we consider∣�d∣ as a
function ofW in Fig. 4.16. In this plot,∣�d∣ decreases monotonically from∣�d∣ = 45∘, the defect
configuration preferred by the lattice geometry, to∣�d∣ = 0∘, the defect configuration preferred
by the bottom surface anchoring condition, with increasingW .
128

The fact that our abrasive rubbing procedure does not obviously bias the orientations of
defect pairs away from∣�d∣ ≈ 45∘ in experiment suggests that∣�d∣ ≥ �min = 0.9×45∘ = 40.5∘
(assuming difficulty in distinguishing between�max = 45∘ and�min = 0.9×�max by the naked
eye). This provides an upper bound on the rubbing anchoring strengthWmax = W (�min).
From Fig. 4.16,Wmax ≈ 1 × 10⁻⁷ J/m2. This value is similar to the anchoring strength of this
technique experimentally measured in a separate study,W = 3 × 10⁻⁷J/m2, which is still an
order of magnitude lower than the anchoring strengths of conventional alginment techniques for
thermotropic liquid crystals (W = 10−6 − 10−5J/m2) [104].
4.4.2 Columnar Configurations
Observations of columnar films in LCLC experiments and numerical models of columnar LCs
demonstrate two possible alignment and defect wall configurations of columnar films in the
observed micropost arrays. The stability of these configurations appears to be related to the
elastic properties of the film during the columnar structure formation. Specifically, films with
a higher ratio of splay to bend free energy cost (K1/K3) will form an array of defect wall
“squares,”, while films with a lowerK1/K3 ratio form an array of zig-zagging defect walls. In
experiment, these elastic properties can be controlled by the type and initial concentration of
LCLC forming material in the film.
4.4.2.1 Experimentally Observed Columnar Patterns
During the slow drying of these films from the nematic state, water is lost to the overlying hex-
adecane, and the LCLC nematic film transforms into a high-concentration columnar mesophase.
Interestingly, this phase transition is accompanied not only by significant changes in the local
129

Figure 4.16: Results of LdG numerical modeling with varying planar oriented anchoring strengthalong the bottom of the cell. The planar anchoring is parallel to one of the lattice axes (in this casealong thex direction) and has a strengthW . a) Absolute value of the angle of the stable defectorientation with respect to the bottom surface anchoring direction∣�d∣, as a function of anchoringstrengthW . Each point is averaged over 10 random initial configurations.Wmax = 1.0 × 10⁻⁷
J/m2 is set at the value ofW resulting in∣�d∣ = �min = 40.5∘. Bottom: simulation resultsfor local director orientation (red lines) and corresponding schlieren textures given polarizer,analyzer, lattice axes and rubbing direction (dashed lines / red arrow) given in schematic (e) for(b)W1 = 3.52 × 10⁻¹⁰ J/m2, (c)W2 = 7.04 × 10⁻⁷ J/m2 and (d)W3 = 3.48 × 10⁻⁶ J/m2.
130

director configuration, but also by the appearance of dark lines in bright-field microscope images
(Fig. 4.17 and Fig. 4.18). The resulting columnar liquid crystal film thus forms two very differ-
ent director configurations dependent on type (i.e., DSCG or SSY) and on the concentration of
the chromonic liquid crystal used to make the initial nematic film.
For columnar DSCG films, which cross over from an initial nematic phase with concentration
< 17.5% wt/wt, we observe configurations containing pairs of defect lines running between
adjacent posts, and forming local squares or rhombuses with posts at the vertices (Fig. 4.17). By
quantifying the director orientation and magnitude, we see that the defect lines in the bright field
images correspond to areas with low in-plane director magnitude,I0. Additionally, these lines
appear to divide the space into regions with distinct (i.e., locally uniform) director orientations.
This observation suggests that the lines are defect walls, i.e., plane-like defects in columnar
liquid crystals that occur in regions across which there exists a discontinuous bend in director
orientation. [83] In these samples, the area between four posts is populated by a director oriented
close to a diagonal of a lattice, and the regions between adjacent posts contain directors oriented
close to a lattice direction. Notice that these patterns of alignment are similar to the director
configuration found in the nematic films, albeit with a much sharper off-diagonal director bend
between adjacent posts.
A different defect placement and local director distribution arises in columnar DSCG films
with an initial pre-drying concentration> 18% wt/wt and in all columnar SSY films (Fig. 4.18).
The defect walls, indicated by dark lines in bright-field and low in-plane director magnitude, run
between adjacent posts in a single lattice direction, as well as between posts on a lattice diagonal
perpendicular to the initial nematic director alignment, forming zig-zags of defect walls. These
131

c d
PA
-20 0 20 40 60 80 100 120
PD
F
θ (°)
a b
Figure 4.17: Columnar film of DSCG dried from a nematic DSCG filmof initial concentration17% wt/wt. Images show (a) crossed-polarizer image of the film; (b) bright field image of thefilm (where defects are visible as dark lines); (c) probability distribution of in-plane directororientations with respect to the horizontal post lattice spacing direction; (d) average in-planedirector orientation for four posts, colored by angle using the same scheme as (c) and plottedover the average in-plane director magnitude (bright=in-plane, dark=out-of-plane/disordered).Scale bar = 10�m.
132

defect walls divide the director configurations into three distinct regions. Between diagonal
posts, the director is aligned within 5∘ of a lattice diagonal; between adjacent posts, the director
lies on (or slightly tilted past) a lattice direction; and the remaining rhombus-like region contains
a director oriented between these directions, typically 20-30∘ off the lattice direction. Unlike
the “square” configuration, the average director field in this case appears to lie significantly off
the diagonal of the micropost lattice.
-20 -10 0 10 20 30 40 50 60
PD
F
θ (°)
PA
c d
a b
PA
c d
-10 0 10 20 30 40 50 60
PD
F
θ (°)
a b
Figure 4.18: Columnar films dried from (left) nematic DSCG filmof initial concentration 18%wt/wt and (right) SSY. Images show (a) crossed-polarizer image of the film; (b) bright field imageof the film (where defects are visible as dark lines); (c) probability distribution of in-plane direc-tor orientations with respect to the horizontal post lattice spacing direction; (d) average in-planedirector orientation for four posts, colored by angle using the same scheme as (c) and plottedover the average in-plane director magnitude (bright=in-plane, dark=out-of-plane/disordered).Scale bar = 10�m.
4.4.2.2 Numerical Reproduction of Columnar Patterns
Numerical modeling of the columnar phase is performed in the lowK3/K1 limit of the LdG sys-
tem described previously. The results indicate that the tendency of different LCLCs at different
initial concentrations to form different local patterns is tied to the elastic properties of the LCLCs
133
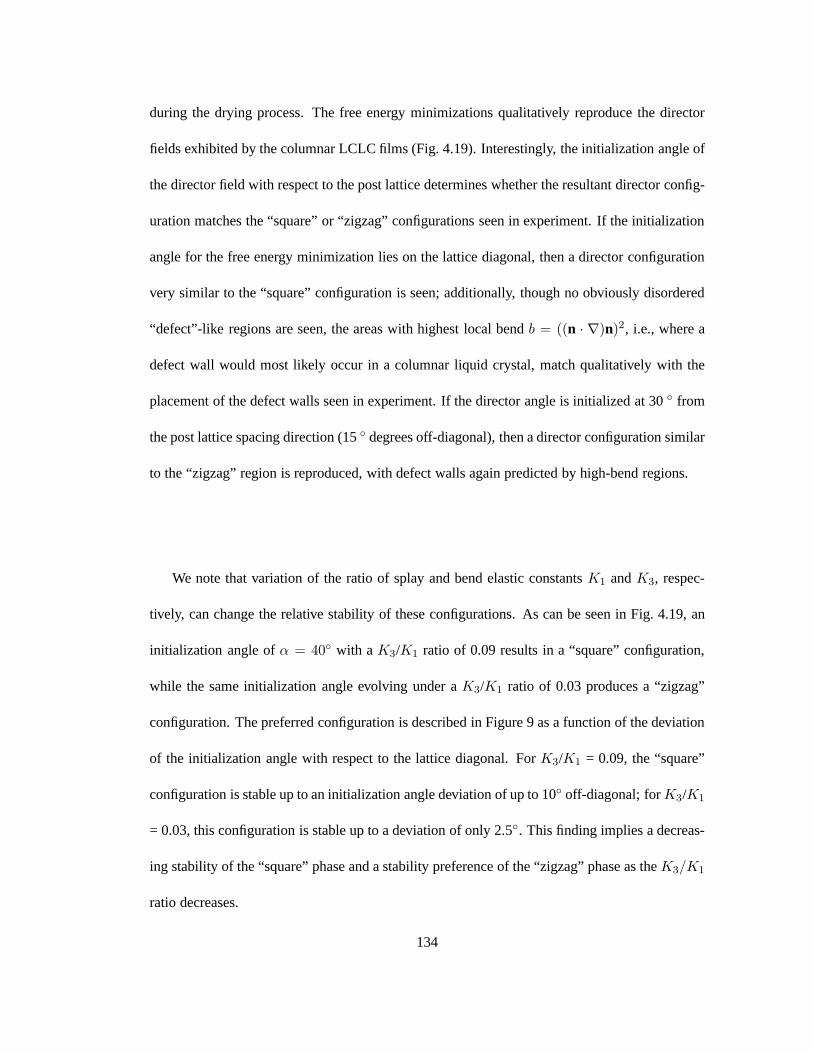
during the drying process. The free energy minimizations qualitatively reproduce the director
fields exhibited by the columnar LCLC films (Fig. 4.19). Interestingly, the initialization angle of
the director field with respect to the post lattice determines whether the resultant director config-
uration matches the “square” or “zigzag” configurations seen in experiment. If the initialization
angle for the free energy minimization lies on the lattice diagonal, then a director configuration
very similar to the “square” configuration is seen; additionally, though no obviously disordered
“defect”-like regions are seen, the areas with highest local bendb = ((n ⋅ ∇)n)2, i.e., where a
defect wall would most likely occur in a columnar liquid crystal, match qualitatively with the
placement of the defect walls seen in experiment. If the director angle is initialized at 30∘ from
the post lattice spacing direction (15∘ degrees off-diagonal), then a director configuration similar
to the “zigzag” region is reproduced, with defect walls again predicted by high-bend regions.
We note that variation of the ratio of splay and bend elastic constantsK1 andK3, respec-
tively, can change the relative stability of these configurations. As can be seen in Fig. 4.19, an
initialization angle of� = 40∘ with aK3/K1 ratio of 0.09 results in a “square” configuration,
while the same initialization angle evolving under aK3/K1 ratio of 0.03 produces a “zigzag”
configuration. The preferred configuration is described in Figure 9 as a function of the deviation
of the initialization angle with respect to the lattice diagonal. ForK3/K1 = 0.09, the “square”
configuration is stable up to an initialization angle deviation of up to 10∘ off-diagonal; forK3/K1
= 0.03, this configuration is stable up to a deviation of only 2.5∘. This finding implies a decreas-
ing stability of the “square” phase and a stability preference of the “zigzag” phase as theK3/K1
ratio decreases.
134

o45=α o
40=αo
30=αd
a b c
e f
Figure 4.19: Average in-plane director orientations from expanded LdG free energy minimiza-tions in micropillar confinement for effective Frank elastic constant ratiosK3/K1 = 0.09 (a-c)andK3/K1 = 0.03 (d-f) for in-plane director initializations of 45∘ (a & d), 40∘ (b & e), and30∘ (c & f) from the horizontal post lattice spacing direction. Line coloring highlights distinctregimes of director orientation (blue = close to horizontal, red = most off-horizontal, green = in-termediate orientation); darker backgrounds indicate regions with the 40% greatest contributionto Frank free energy bend,b = ((n ⋅ ∇)n)2.
135

“square”
“zigzag”
1 10
25
30
35
40
45
K3/K1 = 0.09 K3/K1 = 0.03
Mea
n F
inal
Dire
ctor
C
on!g
urat
ion
Ang
le (
°)
Initialization Angle (deviation from diagonal) (°)
Figure 4.20: Final mean director orientation from expanded LdG free energy minimizations as afunction of deviation of initialized director angle from the lattice diagonal. Mean director angles> 36∘ correspond to “square” defect wall configurations (blue area of graph); mean directorangles< 36∘ correspond to “zigzag” defect wall configurations (mauve area of graph). Filledcircles represent effective Frank free energy constantsK3/K1 = 0.09; open squares representeffective Frank free energy constantsK3/K1 = 0.03
This interpretation is consistent with experimental observation and the known elastic prop-
erties of the studied LCLCs (see Fig. 4.5). TheK3/K1 ratio of nematic DSCG at 14 % wt/wt is
2.5 at 25∘C [114]; for nematic SSY at 29% wt/wt, theK3/K1 ratio is 1.4, and at 31.5%,K3/K1
= 0.95 [189]. Though no experimental determinations of DSCG elastic constants at higher ne-
matic concentrations exist, we expect from general expectations about the nematic-columnar
transition [149] and the trends seen in SSY [189] that higher concentrations of DSCG should
have a lowerK3/K1 ratio. In our experiments, systems which have a higherK3/K1 in the initial
nematic configuration (i.e., nematic DSCG at a concentration< 17% wt/wt) form the “square”
columnar state. Likewise, systems which have a lowerK3/K1 in the initial nematic configuration
(i.e., nematic DSCG at a higher concentration, and nematic SSY) form the “zigzag” columnar
state. Though some of the details of the route from nematic to columnar structure formation
136

are not worked out, both the experiments and the numerics suggest the same basic control of
columnar configurations via modifications of the elastic constants.
4.5 Conclusion
We have demonstrated control of patterning of micro-templated aqueous LCLC films by ad-
justing LC elastic properties. Micropost confinement biases alignment on a preferred direction
for nematic films, and columnar films adopt several distinct configurations of defect and di-
rector patterns depending on their preparation. These results demonstrate a novel method for
inducing alignment of typically difficult-to-align LCLC films, as well as the first instance of
two-dimensional patterning of a columnar liquid crystal film. These results serve as a prime
example of configuration switching in a LC film due to changes in bulk elastic properties, rather
than external boundary conditions or applied fields.
This work could easily lead to new ideas for engineering self-assembled patterned films.
Though only a single micropost pattern was studied here, post shape, diameter, height, placement
geometry and anchoring conditions can be used as controllable variables (along with a film’s
elastic properites) for creating a wide variety of novel liquid crystal micropatterns. The observed
columnar LCLC films could then serve as templates for self-folding materials, since their director
“tiling” resembles the patterning studied in models of such films. [107, 108] Additionally, the
patterns and order induced in these LCLC films could be transferred to suspended colloids,
suspended nanotubes and bacterial systems to create novel metamaterial films. [38, 113, 120,
146,188]
137

Chapter 5
Preliminary Results: Novel
Microstructures in Lyotropic
Chromonic Liquid Crystals
While the contents of the preceeding chapters of this thesis have been published or are about
the be sent out for review, they do not summarize the entirety of the work performed in the
course of the author’s studies. Specifically, in an effort to identify new research directions,
many exploratory experiments were performed on lyotropic chromonic liquid crystals (LCLCs).
Though the results of these experiments are not quite ready for publication, they open up new
and promising avenues for research for future group members.
In this chapter, we review the most promising unpublished preliminary results demonstrat-
ing novel microstructures in LCLC suspensions. First, we discuss an extension of the work
138

on nematic LCLC films in micropost arrays which finds novel twisted microstructures emerg-
ing from the deformations of a nematic-isotropic interface. Second, we summarize preliminary
experimental results that reveal chiral symmetry breaking of nematic LCLC droplets in micro-
capillaries. Third, we describe initial experiments that mix LCLCs and surfactant-based liquid
crystals in suspension; we find that they phase separate when mixed, and we show that they can
co-organize to create interesting assemblies. Finally, we present results from some experimental
attempts to suspend giant diblock copolymer vesicles in nematic LCLC suspensions.
5.1 Nematic LCLC’s in Micropost Arrays with a Deformed Inter-
face
The experimental methods and motivations for preparing LCLC films in a square array of cylin-
drical micropillars were discussed extensively in the previous chapter. In the course of perform-
ing these experiments, several samples were prepared using a Sunset Yellow film initially in an
isotropic state (≈ 5% wt/wt). Over time, water in the LCLC film diffuses into the overlying hex-
adecane, and in the process it slowly drives up the LCLC concentration and causes the film to
progress from an isotropic phase, to a nematic phase, and finally to a columnar state. Typically,
the regions of higher-concentrations are produced at the edges of the LCLC films and then move
in towards the center.
However, in a few samples, the nematic phase initially nucleates from asurface of the film,
rather than an edge. This typically occurs at the early stages of the evaporation process. This con-
figuration is most likely unstable, and possibly caused by an initial affinity of LCLC molecules
for the glass substrate or oil. Nevertheless, a nematic film that is thinner than the full aqueous
139

film can be observed during the very early stages of evaporation (see Fig. 5.1). Though the
surface tension between water and hexadecane is sufficient to keep that particular interface rel-
atively flat, the isotropic-nematic interface surface tension is much lower, and this small surface
tension permits significant deformations of the nematic film.
isotropic nema�c
hexadecane
Figure 5.1: Illustration of LCLC film configuration with deformed nematic interfaces. Sincethe film is in nematic-isotropic coexistence, though the top of the aqueous film is level, theisotropic-nematic interface wets the microposts and deforms.
A new set of boundary conditions is apparent from the very different director configurations
seen under crossed-polarizers, though interface deformations are not directly observed. Specif-
ically, we observe two director patterns, one with “pinwheel” textures between each set of four
posts, and one with lines running down rows (Fig. 5.2). Rotation of the samples between fixed
cross-polarizers yields insight into the underlying director structure. In the “pinwheel” pattern,
two defect species appear at the intersection of four dark fringes. Between adjacent posts, these
appear to be -1 topological defects (based on the rotation of fringes with respect to the polar-
izers); at the center of the observed “pinwheels”, these appear to be +1 topological defects. In
the line pattern, only -1 defects appear between adjacent posts in a single lattice direction. Note
that these textures do not persist when the film has dried sufficiently to be entirely in the nematic
phase.
140

Figure 5.2: Cross-polarizing images of a nematic SSY film (polarizer and analyzer vertical andhorizontal, respectively) with a deformed interface. Insets: Enlargements of cross-polarizertexture between four posts.
Though±1 disclinations are unstable structures [105], curved surfaces could stabilize a three
dimensional structure with similar apparent topology. In fact, such defects and twisted patterns
are seen in sessile droplets of achiral liquid crystals [106], as well as in liquid crystal emulsion
droplets with twisted bipole configurations [64]. One might then assume that, like these droplets,
the surface close to these +1 defects would have a positive Gaussian curvature.
In fact, the connection between surface curvature and ordering in a liquid crystal film could
be deeper than this superficial observation. In a study of sessile nematic LCLC tactoids at an
interface [158], it is observed that molecular aggregates have a tendency to align perpendicular
to a gradient in film thickness⇀∇ℎ, in order to minimize elastic distortions (specifically, splay)
given planar degenerate anchoring conditions at the interfaces. It follows that the local curvature
of a surface would dictate the local director orientation in a sufficiently thin film.
A guess at the surface geometry of a film wetting four posts in a square lattice allows an
interesting comparison to the observed defects in the “pinwheel” pattern. Though the exact wet-
ting configuration needs to be confirmed by more rigorous means, one could assume a minimum
141

in the surface height between the four posts, and saddle points between the adjacent posts, as
sketched in Fig. 5.3. Then, where the height of the surface forms a minimum with a positive
local Gaussian curvature, a topological defect of charge +1 forms in the director field. Likewise,
at saddle points the local Gaussian curvature is negative, a topological defect of charge -1 is
observed. Thus, there appears to be a coupling between the sign of the local Gaussian curvature
and the defect topology in the underlying liquid crystal film.
Figure 5.3: (Right) Cross-polarizer image of the “pinwheel”texture with corresponding approx-imated average in-plane director orientation sketched in red dotted lines. (Left) Illustration ofthe presumed shape of the deformed nematic-isotropic interface between four posts. Dark linestrace the surface of the interface.
For the future, stable control of the isotropic-nematic interface height and better charac-
terization of the interface shape is necessary to make precise conclusions. Nevertheless, these
preliminary results imply that microposts and surface curvature could useful new tools for ly-
otropic liquid crystal director patterning. The wide range of isotropic-nematic coexistence in
LCLCs (which might not be nearly as feasible in thermotropic LCs) permits relatively stable and
deformable nematic interfaces to facilitate this patterning. This micropatterning technique might
therefore be specific to LCLCs.
142

5.2 Observations of Chiral LCLC Configurations in Tubes
LCLCs share a common trait with polymer-based lyotropic liquid crystals; they are both more
susceptible to twist deformations than splay or bend. Because of this property, nematic LCLCs
have been observed to adopt twisted, chiral configurations in achiral microscale confinement.
This behavior has been observed in sessile tactoids [158] and spherical emulsion droplets [64].
It follows that other achiral confining microstructures, such as cylindrical confinement, may
induce new chiral LCLC structures.
To explore the configurational behavior of LCLCs under cylindrical confinement, we placed
suspensions of nematic disodium cromoglycate (DSCG, 14% wt/wt) in glass microcapillaries
with inner diameters ranging from 10 to 100�m. The unfunctionalized glass capillaries induce
planar degenerate anchoring on the LCLC mesogens. One would expect a uniform alignment of
the director field along the length of the capillary, as it would result in satisfaction of boundary
conditions with no necessary elastic deformations.
The first capillaries we observed, however, i.e., capillaries which had an inner diameter<
10 �m and which were filled entirely with a uniform nematic phase, exhibited cross-polarizer
textures which violated this basic intuition (Fig. 5.4). The entire nematic region appeared bright
when viewed under cross-polarizers at a diagonal, indicating average alignment of the director
along the length of the tube. However, viewing the sample parallel to either the polarizer or
analyzer revealed distinct regions with different brightnesses. This indicates regions with some
orientation component not along the tube length. In previous work on sessile nematic tactoids
[158], addition of a non-adsorbing polymer was shown to increase the relative cost of splay to
twist, orK1/K2, increasing the likelihood of spontaneous twist of the nematic under achiral
143

confinement. When we add a small amount of PEG to the DSCG solution (≈ 1% wt/wt) and
again observe the sample under cross-polarizers, we see the same average alignment along the
tube length, but we also observe smaller lengthscale intensity fluctuations when viewed parallel
to the polarizer. Though the details of these configurations were not entirely clear, there is an
implication that DSCG is forming regions with various twists and chiralities.
PA
PA
PA
PA
Figure 5.4: (Top) Nematic DSCG in a microcapillary with innerdiameter< 10�m under crosspolarizers. (Bottom) Nematic DSCG with added PEG in a microcapillary with inner diameter< 10�m under cross polarizers with a full wavelength retardation plate.
Though large nematic domains of DSCG did not exhibit consistent alignment in larger di-
ameter tubes (> 30�m), isolated droplets of nematic DSCG (length≈ 100�m) demonstrated
consistent twisted configurations. Two different types of nematic droplet were observed in these
preliminary experiments. By drawing low concentration DSCG in isotropic-nematic coexis-
tence into capillaries, we formed nematic droplets with concave ends (Fig. 5.6). Nematic DSCG
144

emulsions were made by vigorously shaking a small volume of DSCG suspension heated to the
isotropic phase in mineral oil (without any stabilizing surfactants), and immediately vacuuming
the suspension into the capillary (Fig. 5.5). This method resulted in nematic droplets with con-
vex ends. In both cases, though droplets would show identical textures under cross-polarizers,
the insertion of a full wavelength retardation plate (which distinguishes between director orien-
tations on different diagonals) showed that droplets exhibited different coloration when aligned
along a polarizer or analyzer direction. This implies that each droplet has a different chirality of
the same twisted configuration.
100μm
PA
PA
PA
PA
Figure 5.5: DSCG emulsion droplets at 15% wt/wt suspended in mineral oil in glass microcap-illaries, under cross-polarizers (top) and with a full-wavelength retardation plate (bottom).
A basic argument for the appearance of chirality in these droplets would be similar to the one
justifying chiral nematic sessile tactoids in [158]. In short, ordering of the mesogens along the
length of the tube would require a large splay to be consistent with planar degenerate anchoring at
145

PA
Figure 5.6: Isotropic-nematic coexistence of DSCG in a microcapillary, under cross-polarizerswith a full wavelength retardation plate.
the highly curved ends of the droplet. For LCLCs, where twist is much easier than splay (K2 ≈
0.1K1), this splay deformation gets relieved by adding twist to the system, which propagates
along the length of the drop.
This argument does not fully explain the tendency of LCLCs to form chiral domains when
surfaces are not involved (as in Fig. 5.4), or for the occasional thicker DSCG sample to form
twisting disclination line pairs (as shown in Fig. 5.7). However, these preliminary observations
have been followed by more careful and thorough studies of Sunset Yellow (SSY) in capillar-
ies with similar boundary conditions by Joonwoo Jeong and Zoey Davidson. They have not
only found that these twisted configurations are very robust, both in droplets and more extended
nematic domains, but they have made much more precise characterizations of the twisted config-
urations. Additionally, in ongoing work, they have developed models which attribute the stability
of this twist to higher order expansions of the free energy cost of deformations (i.e.,K24 free
energy terms).
Current ongoing work succeeding these preliminary results has largely focused on SSY. It
146

would be interesting to compare nematic DSCG and SSY under thesame confinement condi-
tions, and explore whether their difference in elastic constants cause differences in configuration
(as observed in micropost confinement inChapter 4). Additionally, the cylinders observed in
more recent experiments have been larger in diameter (> 30�m), and it would be interesting to
further investigate the chiral structures in micron-scale confinement (shown here in Fig. 5.4).
PA
Figure 5.7: Twisted disclination lines observed in nematic DSCG filled capillaries, several daysafter filling. Viewed under cross-polarizer with full wavelength retarding waveplate.
5.3 Mixtures of CLC and Surfactant Phases
Lyotropic and amphiphile-based liquid crystals are quite different from their chromonic coun-
terparts. In addition to having molecular components with substantially different shapes (e.g.,
a hydrophilic head with a hydrophobic tail, as opposed to a plank-like molecule with ionic side
groups), the assembly of these molecules into higher-order structures can be quite different.
While molecules in LCLCs aggregate isodesmically and form linear aggregates at all concentra-
tions and temperatures, amphiphiles must reach a critical micelle concentration (CMC) before
assembling into micelles and other structures. Additionally, the mesophases formed by am-
phiphiles are markedly different from the nematic and columnar phases of LCLCs. For example,
147

amphiphiles can assemble into anisotropic micelles which themselves form nematic calamitc
(Nc) or nematic discotic (Nd) phases. They may also assemble into lamellar layers (L�), hexag-
onally packed columns (H�), gyroid phases, percolating networks of wormlike micelles, giant
vesicles, or multi-layered micelles.
However, since they both classes of lyotropic LCs are aggregate-forming and water-based,
it is natural to inquire how surfactants and LCLC-forming molecules might interact in suspen-
sion, and whether they might form new and interesting composite liquid crystal mesophases.
There exists a single publication so far which attempts such a mixture, and only observes phase
seperation between hexagonal phases of several amphiphiles and LCLCs [5]. To investigate this
possibility in a wider phase space, we mixed varying concentrations of DSCG into aqueous sus-
pensions of sodium dodecyl sulfate (SDS) and decanol or butanol. We choose these particular
surfactant / co-surfactant pairings because their phase behaviors are well studied, and because
they can form a variety of amphiphilic mesophases at room temperature [14,145].
Our preliminary experiments found phase separation of the two liquid crystal phases when
mixed together in solution. Additionally, even when the surfactant is in a low-concentration
isotropic micellar phase, the chromonic (LCLC) regions form phase-separated columnar do-
mains (Fig. 5.8). This is probably driven by the crowding/depletion effect of the surfactant mi-
celles, i.e., similar behavior to what is seen in the addition of non-adsorbing polymer to LCLC
suspensions [121,158,159].
More uniform suspensions can be created from mixtures of high concentration surfactant
phases with the addition of dilute chromonic molecules. Though the chromonic will locally con-
centrate (due to the crowding effects seen in [121, 158, 159]) into columnar bands, the ordering
148

PA
Figure 5.8: Cross-polarizing images of 15% wt/wt SDS/butanol mixture in 10% wt/wt aqueousDSCG solution. The system exhibits nematic-isotropic and/or columnar-isotropic coexistancevia crowding effects.
of these bands is greatly influenced by the liquid crystal phase of the surrounding surfactant/co-
surfactant mixture (Fig. 5.9). When the surfactant is in a nematic calamitic state, i.e., when
the surfactant forms ellipsoidal micelles aligned in the same direction, thin chromonic columnar
bands align in the same direction of the surfactant nematic director. In a lamellar surfactant state,
the characteristic “oily streak” polarizing textures become more pronounced with the addition
of chromonic molecules. As these “oily streaks” indicate borders between well-aligned lamellar
regions, this indicates the concentration of columnar LCLC domains at the borders of ordered
lamellar regions. In hexagonal columnar or nematic discotic phases, a combination of these two
behaviors is seen, with chromonic bands forming both along local director orientations and at
boundaries between ordered domains.
This ordering of columnar chromonic bands in surfactants could have interesting new impli-
cations. By adding a very dilute amount of chromonic additive (< 5% wt/wt) to these surfactant
suspensions, one can create percolating structures of columnar bands which drastically change
the rheological and optical properties of the surfactant suspension. This effect could be utilized to
modify the properties of surfactant-based rheology modifiers in products ranging from consumer
products to fracking fluids for enhanced oil recovery. Additionally, these percolating columnar
149

PA
PA
Figure 5.9: Variety of SDS/decanol/water mesophases including 3% wt/wt DSCG (top, cross-polarizer, bottom, cross-polarizer with full-wavelength retarding waveplate). Left: SDS/decanolin nematic calamitic (NC ) phase (5% decanol, 33.5% SDS). Middle: SDS/decanol in nematicdiscotic (ND) phase (5.9% decanol, 31% SDS)/ Right: SDS/decanol in lamellar (L�) phase(9.4% decanol, 29.2% SDS).
bands structures could have novel electrically conductive properties different from those seen in
uniform LCLC films [115], depending on the underlying surfactant phase structure.
5.4 Diblock Copolymer Vesicles Suspended in CLCs
The bio-compatibility of aqueous LCLC suspensions make them quite appealing for applications
detecting and manipulating biological molecules and micro-organisms [113,144,146,168,188].
As such, it is important to understand not only the chemical, but the physical effects of the liquid
crystal on cell-like materials. Diblock copolymers can form giant bilayer vesicles which serve as
simple models of cells in suspension [91]. By suspending these vesicles in nematic suspensions,
interesting distortions of these vesicles might be observed through elastic interactions with the
surrounding nematic, yielding important insight into the behavior of flexible micro-organisms
150

in nematics. Additionally, the shape of these vesicles couldcouple to the nematic director in
LCLCs to form novel configurations. This would be unique behavior compared to droplets in
thermotropic nematic emulsions, which have a high enough surface tension to remain spherical
[97,134].
To create such vesicle suspensions, we follow a well-practiced method [91], substituting a
sugar/water mixture with a nematic suspension of DSCG. After suspending a PEO-PBD diblock
copolymer in chloroform and drying the suspension to a film on the inside of a glass vial, we
fill the vial with a nematic DSCG suspension (15% wt/wt), and heat the system to 60∘ C for
24 hours. This causes vesicles to bud and separate from the dried polymer film and enter the
suspension.
Figure 5.10: Cross-polarizing images of PEO-PBD vesicle in nematic DSCG shortly after initialsuspension. Top: Temperature increase from 25C to 36C (left to right) induces swelling ofcrumpled vesicle. Bottom: Cooling from 36C to 25C (left to right) causes vesicle to deswell andcrumple.
151
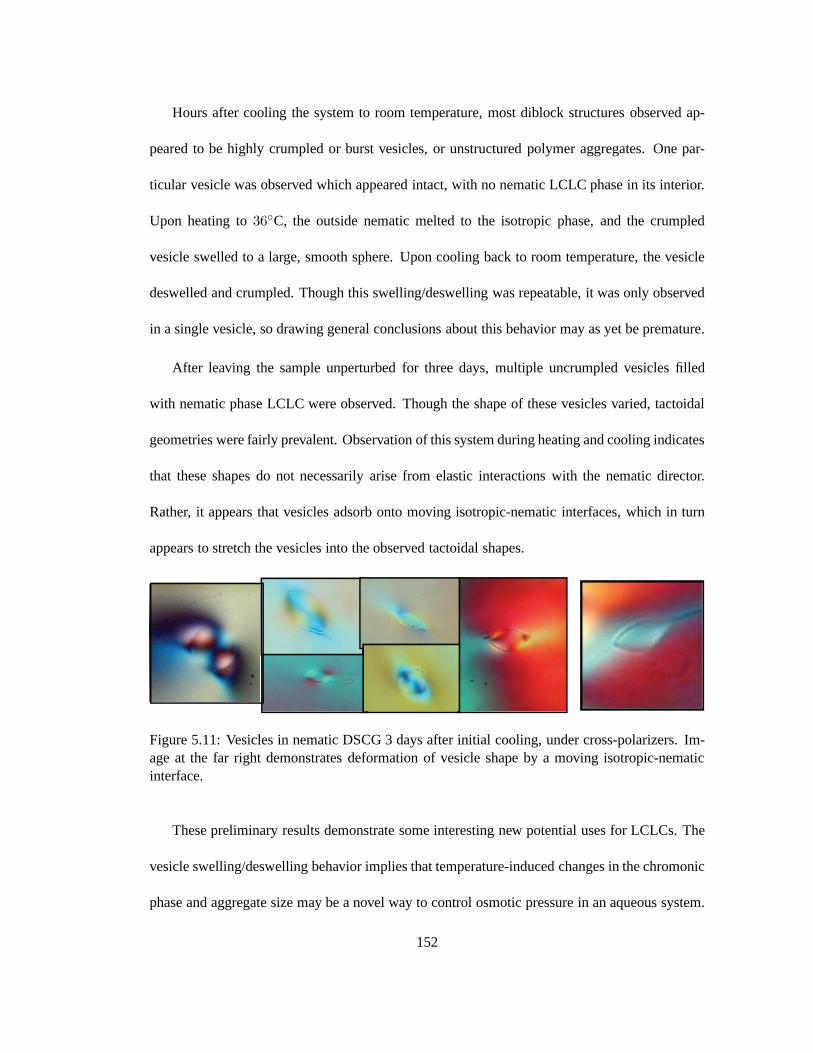
Hours after cooling the system to room temperature, most diblock structures observed ap-
peared to be highly crumpled or burst vesicles, or unstructured polymer aggregates. One par-
ticular vesicle was observed which appeared intact, with no nematic LCLC phase in its interior.
Upon heating to36∘C, the outside nematic melted to the isotropic phase, and the crumpled
vesicle swelled to a large, smooth sphere. Upon cooling back to room temperature, the vesicle
deswelled and crumpled. Though this swelling/deswelling was repeatable, it was only observed
in a single vesicle, so drawing general conclusions about this behavior may as yet be premature.
After leaving the sample unperturbed for three days, multiple uncrumpled vesicles filled
with nematic phase LCLC were observed. Though the shape of these vesicles varied, tactoidal
geometries were fairly prevalent. Observation of this system during heating and cooling indicates
that these shapes do not necessarily arise from elastic interactions with the nematic director.
Rather, it appears that vesicles adsorb onto moving isotropic-nematic interfaces, which in turn
appears to stretch the vesicles into the observed tactoidal shapes.
Figure 5.11: Vesicles in nematic DSCG 3 days after initial cooling, under cross-polarizers. Im-age at the far right demonstrates deformation of vesicle shape by a moving isotropic-nematicinterface.
These preliminary results demonstrate some interesting new potential uses for LCLCs. The
vesicle swelling/deswelling behavior implies that temperature-induced changes in the chromonic
phase and aggregate size may be a novel way to control osmotic pressure in an aqueous system.
152

Additionally, careful control of the moving isotropic-nematic fronts using temperature gradients
may be an interesting new way for deforming and assembling microstructures.
5.5 Summary
The preliminary experiments with LCLC suspensions that we have described in this chapter are
not “finished” or conclusive, but they offer interesting results which merit further study. The
structures observed in micropost arrays with a deformed interface suggest an interesting new
mechanism for patterning nematic films through modulation of film thickness and curvature.
The initial studies of LCLCs in microtubes have inspired further study which demonstrates a
non-intuitive yet robust emergence of chiral structure. The mixtures of chromonic and am-
phiphilic liquid crystal phases can potentially be controlled to make a variety of co-organized
structures. Finally, though preliminary experiments on diblock copolymer vesicles in nematic
LCLC revealed a behavior more complicated than expected, they demonstrate some potentially
interesting properties of LCLCs related to osmotic pressure and isotropic-nematic interface sur-
face tension. With finer experimental design and control, the underlying physical mechanisms
of these systems should become clear, allowing for precise characterization of new methods for
aqueous microstructure assembly.
These experiments also serve to inspire a wide variety of general, less explored ideas for
useful new applications of LCLCs. The wide coexistence regime of isotropic and nematic phases
(which can be made more stable through the addition of additives [121, 158, 159]) allows for
the creation of novel water-water interfaces. These interfaces, though strong enough to drag
and manipulate vesicles and colloidal particles, have a much lower surface tension than the
153

more common oil-water interfaces. These might then serve as novel and flexible templates for
colloidal assembly. Additionally, though the structure, dynamics and stability of chromonic
molecular aggregates is a widely researched field, the temperature tunability of their size and
concentration provides an unutilized system for control of osmotic pressure. Consequently, as
is shown in some preliminary experiments not discussed in this text, dilute, isotropic chromonic
suspensions could provide a new mechanism for tunable colloidal depletion.
154

Chapter 6
Conclusions and Future Work
6.1 Summary
The research presented in this thesis elucidates physical properties of a variety of novel mi-
crostructures in soft matter. The helical packings, the glass-gel transition, and the microtem-
plated aqueous liquid crystals presented in the preceding chapters all exhibit novel phase and
configuration behavior upon rigorous analysis of their microscopic structure and dynamics. Fur-
ther, such analyses provide insight into the microscopic mechanisms behind formation of stable
and structured soft materials.
The first study, presented inChapter 2, clarified questions about the stability of quasi-1D
helical structures in thermal equilibrium via microscopic observations of colloids in cylindri-
cal confinement. By packing fluorescent microgel spheres in a glass capillary of slightly larger
diameter and then imaging the system with confocal microscopy, we were able to character-
ize a variety of helical structures at a microscopic scale. When we decreased sample volume
155

fraction using the thermosensitive properties of the microgel particles, we found the first ex-
perimental evidence of stable helical crystals under thermal Brownian fluctuations. Further, by
decreasing the volume fraction of these packings more and by tracking the evolving structure and
dynamics, we were able to quantitatively characterize of the melting behavior of these “helical
phases”. We find evidence for a potentially discontinuous crossover between ordered and dis-
ordered states using measurements of the long-range orientational order and local orientational
susceptibility. This presence of long-range order was validated with theoretical calculations on a
tightly wrapped two-dimensional model with similar structure. In confirming the stability of this
ordered phase, we not only provide a powerful counter-example to the argument against the sta-
bility of one-dimensional translationally ordered structures [126, 162], but we demonstrate that
thermal fluctuations are not a technical barrier to fabrication of such structures on a microscopic
scale. Additionally, we find that changes in volume fraction result in transitions between ordered
phases prior to melting, and that these transitions are not mediated by the well-understood move-
ment of dislocations seen in athermal media. With careful engineering, this trait could provide a
novel mechanism for materials with temperature-tunable microscale pitch or chirality.
The second study identified a vibrational signature of the crossover between gel-like and
glassy states in aggregating colloidal suspensions (i.e., suspension with particles that have at-
tractive short-range interactions). InChapter 3, we presented careful experiments with particles
and a binary-fluid-induced wetting-based attraction. In particular, we devised a novel method
for creating strongly attractive monolayers of quasi-2D attractive colloidal particles which still
exhibit Brownian vibrations at high densities. We then implemented a method for extracting
the vibrational modes from particle trajectories in a series of samples of attractive packings with
156

varying packing fraction and spatial heterogeneity. The shape of the resulting vibrational density
of states curves classified these packings into two categories of relatively sparse (“gel-like”) and
dense (“glassy”) packings. While the dense packings show vDOS curves qualitatively similar
to previously observed glassy packings, the sparse packings exhibit an excess of low-frequency
modes which appear to be highly localized to microstructures with low local coordination. Be-
yond providing a distinct characterization of disordered packings into more glass-like and gel-
like states, this result provides the beginnings of a micro-structural definition of otherwise poorly
defined “gel” phases.
Chapter 4presented an investigation of patterning and defect formation in lyotropic chromonic
liquid crystal (LCLC) films in micropost arrays. Through a combination of experiment (on two
different LCLC formers, disodium cromoglycate (DSCG) and Sunset Yellow (SSY)) and numer-
ical free energy minimizations, we demonstrated that square patterns of anisotropic cylindrical
microposts can be used to induce ordering in a nematic liquid crystal film along a diagonal of the
square lattice. Then, by allowing these nematic films to dry into the columnar phase, multiple
patterns of defects and director orientations were induced from a single microtemplate. Through
extensions of nematic numerical techniques to the columnar limits, we were able to demonstrate
that these different structures arise as a result of competition between splay and bend deforma-
tions in the LC film. These patterns can thus be controlled through careful modification of the
elastic properties of the liquid crystals.
The potential of LCLCs to create various other novel microstructures is demonstrated through
preliminary work on a variety of aqueous liquid crystal dispersions described inChapter 5. By
157

forming nematic films in the same micropatterned template described inChapter 4 under a de-
formed interface, we demonstrate a novel micropatterning technique from modulations of film
thickness. Preliminary experiments on LCLCs confined to microtubes demonstrated sponta-
neous chiral symmetry breaking in achiral confinement which is being further explored in on-
going work. Mixtures of LCLC’s with concentrated surfactant dispersions demonstrate ordered
phase separation in multiple lyotropic liquid crystals with tunable structure. Finally, dispersions
of diblock copolymer vesicles in a nematic LCLC demonstrate novel uses of LCLCs for micro-
manipulation using temperature-tunable osmotic pressure and isotropic-nematic interfaces.
6.2 Future Work
The following section describes potential fruitful avenues for continued research on the colloidal
and liquid crystal systems presented in this thesis.
6.2.1 Three Dimensional Dynamics and Self-Assembly of Helical Structures
As discussed in detail inChapter 2, precise three dimensional particle tracking of pNIPAm mi-
crospheres in glass microcapillaries is difficult due to imaging artifacts from the highly-curved,
index mismatched surfaces involved in the experimental setup. This does not mean that precise
three dimensional trajectories are completely inaccessible to a more sophisticated experimental
system, however. Recent work has shown that pNIPAm particles synthesized through a semi-
batch process are more homogeneously polymerized, and as a result, are much better index-
matched to water [148]. Additionally, pNIPAm particles with fluorescent cores would be far
easier to distinguish at high densities than the particles we have employed in our investigations.
158

Assuming the index matching of the aqueous solvent to the capillary can be addressed, more pre-
cise three dimensional tracking could then be used to examine new structural order parameters
more carefully. Specific interesting analyses would include a careful examination of dislocation
structures at boundaries of ordered packings with different pitch or chirality, the radial distribu-
tion and dynamics of particles, and vibrational density of states calculations using the methods
outlined inChapter 3.
The stability of helical quasi-1D packings begs a more thorough fundamental investigation
of orientational order in confined dimensions. Though we argue that orientational order could be
stable in these packings due to the quasi-2D nature of the packings, extensions of the arguments
against 1D order [126,162] could be made that disprove such orientational stability. Also, obser-
vations of longer helical structures could demonstrate a finite correlation length of orientational
order dependent on inter-particle interactions. The stability of orientational order might thus
be a result of interactions of the particles with the highly curved cylindrical boundary. Though
the improved experimental resolution described above (as well as a larger sample size/field of
view) would certainly serve to clarfy such points, a more rigorous theoretical treatment incor-
porating the ordering effects of boundaries might provide a more thorough explanation for these
effects. Even without a better theoretical explanation, it might be interesting to examine the
stability of orientational order in hard sphere simulations. Simulational studies of sphere pack-
ings in tubes to date examine translational order without probing orientational order [46]. It
would also be interesting to theoretically and experimentally study other quasi-1D systems with
orientational order. For example, anisotropic particles (e.g. ellipsoids, cubes, trimers, etc.),
or particles with anisotropic interactions (e.g. Janus particles, magnetic dipoles) confined to a
159

one-dimensional chain might exhibit orientational order beyond a certain pressure, though they
might not exhibit long-range translational order. Also, it would be interesting to study experi-
mental analogues of simulated systems whichalways exhibit long-range orientational order, for
example, rods/anisotropic particles free to rotate in two dimensions and translate only along a
fixed line [50,70].
Though placing particles in a cylinder is a simple method for creating helical packings,
there is evidence that such packings could also be self-assembled from colloids with complex
anisotropic interactions. For example, suspensions of so-called Janus particles with dipolar inter-
actions have been shown to create chain-like structures with some degree of helical order [56].
Additionally, simulations of spherical particles with competing long-range dipolar and short-
range attraction have predicted the self-assembly of helical structures with the exact pitch deter-
mined by fine tuning of these interactions [131]. Though this system has not yet been experi-
mentally realized, a colloidal analogue could be produced in a relatively straightforward manner
using well-characterized techniques. A tunable short-range attraction could be induced by the
addition of a size-changing depleting polymer or surfactant, or a binary phase separating solvent
(as used inChapter 3). A tunable long-range dipolar interaction could be produced by applying
a uniform magnetic field to superparamagnetic colloids or applying a strong oscillating electric
field to index-mismatched particles. Though the engineering of such a system would take time,
and both potentials would need to be carefully tuned to have strengths on the order of≈ 1kBT ,
it is certainly within the realm of possibility. Once these structures were assembled, it would
be interesting to see how their phase behavior compared to the confined short-range repulsive
thermal system studied inChapter 2.
160

6.2.2 Precise Structural Nature and Generality of the Gel-Glass Crossover
The exact structural nature of the low-frequency modes which characterize sparse, gel-like pack-
ings is still unclear, despite the finding of a correlation between areas with low local coordination
and highly localized vibrational modes presented inChapter 3. We have found qualitative cor-
relation of these modes to local “linear” structures; however, the correlation is not one-to-one
(i.e., not all linear structures dominate low-frequency modes, and not all low-frequency modes
are localized to linear structures). A more rigorous analysis of the structures surrounding these
localized low-frequency modes would better help to define gel-like packings based on their mor-
phology alone.
Additionally, the experiments described inChapter 3 only observe this low-frequency sig-
nature of states in a rather specific set of two-dimensional morphologies. Whether or not this
signature would be observed in other classes of high-density attractive particles is crucial to de-
termining the generality of this gel-glass crossover. It would thus be useful to apply this same
analysis to short-range attractive packings at identical area fractions with coarser, sparser or
more fractal structures. Additionally, it would be interesting to see whether short-range attrac-
tive particles stabilized by long-range repulsion and “patchy” particles with a limited attractive
valence (i.e., systems which approach gel states through non-aggregated, “equilibrium” states
as proposed in [181]) show similar behavior. It would also be helpful to see if this vibrational
crossover can be applied to three-dimensional systems, assuming three-dimensional confocal
imaging could be performed at a fast enough speed to capture simultaneous particle displace-
ments and thus calculate vibrational modes. Replicating these results in numerical simulations
would also serve to verify the generality of this crossover.
161

A connection must be made between these microscopic vibrational behaviors and bulk rheo-
logical properties to give the described analysis more pertinent physical meaning. The localized
modes in sparse packings might correspond the fragile regions of the packing in the same way
that localized low frequency modes in dense disordered packings correlate to rearrangement-
prone regions. The breaking of these “fragile” bonds might correlate to cluster-breaking relax-
ations observed in the multi-step yielding of attractive packings [86]. This correlation could be
experimentally probed by calculating vibrational modes and then observing consequent shears
in colloidal packings using confocal rheolometer setups (such as those used in [6]) or more so-
phisticated apparatuses which induce local shear using magnetic fields [73] or optical tweezers.
6.2.3 Further Engineering of LCLC films via Microtemplating
The control of local director microstructure in LCLC films by micropost arrays and bulk LC
elastic properties is shown by the work inChapter 4 to be a powerful new microengineering
technique. However, a large range of possibilities for fabricating a whole menagerie of mi-
crostructures through variations of microtemplating geometry remains largely unexplored. The
size, spacing, height, shape, anchoring conditions and placement geometry of microposts could
all be varied to create a wide variety of stable structures in nematic and columnar films. Re-
cently discovered methods for inducing homeotropic anchoring on LCLCs [65] would allow for
the creation of microposts geometries with hybrid boundary conditions, allowing exploration of
LCLCs in the post-aligned bistable nematic structures studied in [77–79]. Additionally, LCLC
films could be modified with the addition of polymer and ionic additives [121, 158, 159] to ex-
plore a wider range of elastic properties. The micropattern formation demonstrated in LCLCs
should also be generalizable to other lyotropic and thermotropic liquid crystals, which could
162

exhibit an even wider variety of elastic properties.
Micropost arrays created from polymers sensitive to external conditions could be used to
fabricate dynamically switchable LC micropattern configurations. For example, posts fabricated
from thermosensitive pNIPAm polymer would change size with temperature. Preliminary simu-
lations on nematics confined between microposts of different size (performed by the author) saw
a continuous transition between alignment along the post diagonal (small posts) and alignment
along the lattice directions (large posts). In this setup, tuning the temperature of pNIPAM mi-
croposts would then tune the alignment angle of LC director. Similar dynamically controllable
patterns could be imagined using posts of tunable shape fabricated from liquid crystal elastomers.
Additionally, as the “tile” like pattern of interlocking aligned domains formed in columnar
LCLC films resemble the patterns predicted to make novel self-folding materials [107, 108], it
would be a challenging but novel engineering task to transfer these micropatterns to elastically
anisotropic films and observe their bulk properties. Also, films with switchable configurations
could be made from context-sensitive polymers. For example, one could make a membrane
with micropores that open and close with changes in the film elasticity. Additionally, one could
consider using the defect patterns in the columnar films as nucleation/concentration/patterning
points for depositing nanoparticle solutions. If the nanoparticles used are conductive, this could
be an interesting method for printing novel circuits at a microscopic scale.
6.2.4 Continuing Work on Novel LCLC-Facilitated Microstructures
Finally, the preliminary results put forth inChapter 5 initiate the first steps of several future
projects on microstructures precipitated in-and-by LCLCs. To reiterate specifically, by utilizing
the low surface tension of the isotropic-nematic interface, one can create nematic micropatterns
163

governed by undulations in film thickness. The twisted configurations of LCLCs in cylinders are
already under thorough investigation. The ordering of columnar LCLC bands in surfactants is a
promising method for making structurally and rheologically unique materials. Though vesicles
exhibit interesting structural behavior in LCLCs, more carefully designed experiments might see
these effects better controlled.
These experiments also serve to inspire a wide variety of general, less explored ideas for
useful new applications of LCLCs. The wide coexistence regime of isotropic and nematic phases
(which can be made more stable through the addition of additives [121, 158, 159]) allows for
the creation of novel water-water interfaces. These interfaces, though strong enough to drag
and manipulate vesicles and colloidal particles, have a much lower surface tension than the
more common oil-water interfaces. These might then serve as novel and flexible templates for
colloidal assembly. Additionally, though the structure, dynamics and stability of chromonic
molecular aggregates is a widely researched field, the temperature tunability of their size and
concentration provides an unutilized system for control of osmotic pressure. Consequently, as
is shown in some preliminary experiments not discussed in this text, dilute, isotropic chromonic
suspensions could provide a new mechanism for tunable colloidal depletion.
164

Bibliography
[1] A. M. Alsayed, M. F. Islam, J. Zhang, P. J. Collings, and A. G. Yodh. Premelting at
defects within bulk colloidal crystals.Science 309(5738), 1207–1210 AUG (2005).
[2] P. W. Anderson. Through the glass lightly.Science 267(5204), 1615–1616 MAR (1995).
[3] V. Anderson and H. Lekkerkerker. Insights into phase transition kinetics from colloid
science.Nature 416(6883), 811–815 APR 25 (2002).
[4] T. Aste, M. Saadatfar, and T. J. Senden. Geometrical structure of disordered sphere pack-
ings. Physical Review E 71(6) JUN (2005).
[5] T. Attwood, J. E. Lydon, C. Hall, and G. J. T. Tiddy. The distinction between chromonic
and amphiphilic lyotropic mesophases.Liquid Crystals 7, 657–668 (1990).
[6] A. Basu, Q. Wen, X. Mao, T. C. Lubensky, P. A. Janmey, and A. G. Yodh. Nonaffine
displacements in flexible polymer networks.Macromolecules 44(6), 1671–1679 MAR
22 (2011).
[7] J. Bergenholtz and F. M. Nonergodicity transitions in colloidal suspensions with attractive
interactions.Physical Review E 59(5), 5706–5715 MAY (1999).
165
[8] D. Beysens and T. Narayanan. Wetting-induced aggregation of colloids. Journal of Sta-
tistical Physics 95(5-6), 997–1008 JUN (1999).
[9] P. Boltenhagen and N. Pittet. Structural transitions in crystalline foams.Europhysics
Letters 41(5), 571–576 MAR (1998).
[10] P. Boltenhagen, N. Pittet, and N. Rivier. Giant deformations and topological hysteresis of
an ordered foam.Europhysics Letters 43(6), 690–694 SEP (1998).
[11] N. Bowden, S. Brittain, A. Evans, J. Hutchinson, and G. Whitesides. Spontaneous for-
mation of ordered structures in thin films of metals supported on an elastomeric polymer.
Nature 393(6681), 146–149 MAY 14 (1998).
[12] C. Brito and M. Wyart. Heterogeneous dynamics, marginal stability and soft modes in
hard sphere glasses.Journal of Statistical Mechanics - Theory and Experiment AUG
(2007).
[13] C. Brito and M. Wyart. Geometric interpretation of previtrification in hard sphere liquids.
Journal of Chemical Physics 131(2) JUL (2009).
[14] G. Burducea. Lyotropic liquid crystals ii. structural polymorphism.Romanian Reports in
Physics 56(1), 87–100 (2004).
[15] M. Cavallaro, M. Gharbi, D. Beller, S. Copar, Z. Shi, T. Baumgart, S. Yang, R. Kamien,
and K. Stebe. Exploiting imperfections: Directed assembly of surface colloids via bulk
topological defects.Proceeding of the National Academy of Sciences 110(47), 18804–
18808 November (2013).
166

[16] P. Chaikin and T. C. Lubensky.Principles of Condensed Matter Physics. Cambridge
University Press Cambridge (2006).
[17] D. T. N. Chen, Q. Wen, P. A. Janmey, J. C. Crocker, and A. G. Yodh. Rheology of soft
materials.Annual Review of Condensed Matter Physics 1, 301–322 (2010).
[18] K. Chen, W. Ellenbroak, Z. Zhang, D. Chen, P. Yunker, S. Henkes, C. Brito, O. Dauchot,
W. van Saarloos, A. Liu, and A. Yodh. Low-frequency vibrations of soft colloidal glasses.
Physical Review Letters 105(2) JUL 9 (2010).
[19] K. Chen, M. Manning, P. Yunker, W. Ellenbroek, Z. Zhang, A. Liu, and A. Yodh. Mea-
surement of correlations between low-frequency vibrational modes and particle rearrange-
ments in quasi-two-dimensional colloidal glasses.Physical Review Letters 107(10) AUG
31 (2011).
[20] K. Chen, T. Still, S. Schoenholz, K. Aptowicz, M. Schindler, A. Maggs, A. Liu, and
A. Yodh. Phonons in two-dimensional soft colloidal crystals.Physical Review E 88(2)
(2013).
[21] S. Chui. Grain-boundary theory of melting in 2 dimensions.Physical Review B
28(1), 178–194 (1983).
[22] A. I. Chumakov, G. Monaco, A. Monaco, W. A. Crichton, A. Bosak, R. Ruffer, A. Meyer,
F. Kargl, L. Comez, D. Fioretto, H. Giefers, S. Roitsch, G. Wortmann, M. H. Manghnani,
A. Hushur, Q. Williams, J. Balogh, K. Parlinski, P. Jochym, and P. Piekarz. Equivalence
of the boson peak in glasses to the transverse acoustic van hove singularity in crystals.
Physical Review Letters 106, 225501 May (2011).
167
[23] A. Ciferri. Polymer Liquid Crystals. Materials science and technology. Elsevier Science
(1982).
[24] A. Coniglio, T. Abete, A. de Candia, E. Del Gado, and A. Fierro. Dynamical hetero-
geneities: from glasses to gels.Journal of Physics: Condensed Matter 20(49), 494239
DEC (2008).
[25] M. L. Cowan, J. H. Page, and P. Sheng. Ultrasonic wave transport in a system of disor-
dered resonant scatterers: Propagating resonant modes and hybridization gaps.Physical
Review B 84(9), 094305 SEP 19 (2011).
[26] J. Crocker and D. Grier. Methods of digital video microscopy for colloidal studies.Jour-
nal of Colloidal Interface Science 179(1), 298 (1996).
[27] J. Cuesta and A. Sanchez. General non-existence theorem for phase transitions in one-
dimensional systems with short range interactions, and physical examples of such transi-
tions. Journal of Statistical Physics 115(3-4), 869–893 MAY (2004).
[28] V. K. de Souza and P. Harrowell. Unconstrained motions, dynamic heterogeneities, and
relaxation in disordered solids.Physical Review E 80(4) OCT (2009).
[29] P. G. Debenedetti and F. H. Stillinger. Supercooled liquids and the glass transition.Nature
410(6825), 259–267 MAR (2001).
[30] C. J. Dibble, M. Kogan, and M. J. Solomon. Structure and dynamics of colloidal depletion
gels: Coincidence of transitions and heterogeneity.Physical Review E 74(4), 041403
OCT (2006).
168

[31] C. J. Dibble, M. Kogan, and M. J. Solomon. Structural origins of dynamical heterogeneity
in colloidal gels.Physical Review E 77(5), 050401 MAY (2008).
[32] J. Dreyer. The fixing of molecular orientation.Journal of Physical and Colloid Chemistry
52(5), 808–810 (1948).
[33] F. J. Duran-Olivencia and M. C. Gordillo. Ordering of hard spheres inside hard cylindrical
pores.Physical Review E 79(6) JUN (2009).
[34] A. Eberle, R. Castaneda-Priego, J. Kim, and N. Wagner. Dynamical arrest, percolation,
gelation, and glass formation in model nanoparticle dispersions with thermoreversible
adhesive interactions.Langmuir 28(3), 1866–1878 JAN 24 (2012).
[35] T. Eckert and E. Bartsch. Re-entrant glass transition in a colloid-polymer mixture with
depletion attractions.Physical Review Letters 89(12), 125701 SEP (2002).
[36] M. D. Ediger and P. Harrowell. Perspective: Supercooled liquids and glasses.Journal of
Chemical Physics 137AUG (2012).
[37] R. O. Erickson. Tubular packing of spheres in biological fine structure.Science
181(4101), 705–716 (1973).
[38] J. S. Evans, C. N. Beier, and I. I. Smalyukh. Alignment of high-aspect ratio colloidal
gold nanoplatelets in nematic liquid crystals.Journal of Applied Physics 110(3), 033535
AUG 1 (2011).
169

[39] L. Fabbian, W. Gotze, F. Sciortino, P. Tartaglia, and F. Thiery. Ideal glass-glass tran-
sitions and logarithmic decay of correlations in a simple system.Physical Review E
59(2), R1347–R1350 FEB (1999).
[40] L. Feng, R. Dreyfus, R. Sha, N. C. Seeman, and P. M. Chaikin. Dna patchy particles.
Advanced Materials 25(20), 2779–2783 MAY 28 (2013).
[41] U. Gasser, E. Weeks, A. Schofield, P. Pusey, and D. Weitz. Real-space imaging of nu-
cleation and growth in colloidal crystallization.Science 292(5515), 258–262 APR 13
(2001).
[42] A. Ghosh, V. Chikkadi, P. Schall, and D. Bonn. Connecting structural relaxation with the
low frequency modes in a hard-sphere colloidal glas.Physical Review Letters 107(18)
OCT 31 (2011).
[43] A. Ghosh, V. Chikkadi, P. Schall, J. Kurchan, and D. Bonn. Density of states of colloidal
glasses.Physical Review Letters 104(24) JUN 17 (2010).
[44] M. A. Glaser and N. A. Clark. Melting and liquid structure in two dimensions.Advances
in Chemical Physics 83, 543–709 (1993).
[45] C. P. Goodrich, W. G. Ellenbroek, and A. J. Liu. Stability of jammed packings i: the
rigidity length scale.Soft Matter 9(46), 10993–10999 (2013).
[46] M. C. Gordillo, B. Martinez-Haya, and J. M. Romero-Enrique. Freezing of hard spheres
confined in narrow cylindrical pores.Journal of Chemical Physics 125(14) OCT (2006).
170

[47] M. Gratale, P. Yunker, K. Chen, T. Still, K. Aptowicz, andA. Yodh. Phonons in two-
dimensional colloidal crystals with bond-strength disorder.Physical Review E 87(5)
MAY 8 (2013).
[48] N. L. Green, D. Kaya, C. E. Maloney, and M. F. Islam. Density invariant vibrational modes
in disordered colloidal crystals.Physical Review E 83(5), 051404 MAY 27 (2011).
[49] F. Guo, A. Mukhopadhyay, B. W. Sheldon, and R. H. Hurt. Vertically aligned graphene
layer arrays from chromonic liquid crystal precursors.Advanced Materials 23(4), 508+
JAN 25 (2011).
[50] P. Gurin and S. Varga. Orientational ordering of hard zigzag needles in one dimension.
Physical Review E 82, 041713 Oct (2010).
[51] Y. Han, N. Y. H. Ha, A. M. Alsayed, and A. G. Yodh. Melting of two-dimensional
tunable-diameter colloidal crystals.Physical Review E 77(4) APR (2008).
[52] Y. Han, Y. Shokef, A. M. Alsayed, Y. P., T. C. Lubensky, and A. G. Yodh. Geometric
frustration in buckled colloidal monolayers.Nature 456(7224), 898–903 DEC (2008).
[53] W. F. Harris and R. O. Erickson. Tubular arrays of spheres - geometry, continuous and
discontinuous contraction, and the role of moving dislocations.Journal of Theoretical
Biology 83(2), 215–246 (1980).
[54] S. Henkes, C. Brito, and O. Dauchot. Extracting vibrational modes from fluctuations: a
pedagogical discussion.Soft Matter 8(22), 6092–6109 (2012).
171

[55] C. Hertlein, L. Helden, A. Gambassi, S. Dietrich, and C. Bechinger. Direct measurement
of critical casimir forces.Nature 451(7175), 172–175 JAN 10 (2008).
[56] L. Hong, A. Cacciuto, E. Luijten, and S. Granick. Clusters of amphiphilic colloidal
spheres.Langmuir 24(3), 621–625 FEB (2008).
[57] A. Honglawan, D. A. Beller, M. Cavallaro, R. D. Kamien, K. J. Stebe, and S. Yang.
Pillar-assisted epitaxial assembly of toric focal conic domains of smectic-a liquid crystals.
Advanced Materials 23(46), 5519+ DEC 8 (2011).
[58] A. Honglawan, D. A. Beller, M. Cavallaro, Jr., R. D. Kamien, K. J. Stebe, and S. Yang.
Topographically induced hierarchical assembly and geometrical transformation of focal
conic domain arrays in smectic liquid crystals.Proceedings of the National Academy of
the Sciences 110(1), 34–39 JAN 2 (2013).
[59] L. A. Hough, M. F. Islam, B. Hammouda, A. G. Yodh, and P. A. Heiney. Structure of
semidilute single-wall carbon nanotube suspensions and gels.Nano Letters 6(2), 313–
317 FEB (2006).
[60] L. E. Hough, H. T. Jung, D. Krueerke, M. S. Heberling, M. Nakata, C. D. Jones, D. Chen,
D. R. Link, J. Zasadzinski, and G. Heppke. Helical nanofilament phases.Science
325(5939), 456–460 JUL (2009).
[61] H. C. Huang, S. K. Kwak, and J. K. Singh. Characterization of fluid-solid phase transition
of hard-sphere fluids in cylindrical pore via molecular dynamics simulation.Journal of
Chemical Physics 130(16) APR (2009).
172
[62] G. L. Hunter and E. R. Weeks. The physics of the colloidal glass transition.Reports on
Progress in Physics 75(6) JUN (2012).
[63] M. Islam, A. Alsayed, Z. Dogic, J. Zhang, and T. Lubensky. Nematic nanotube gels.
Physical Review Letters 92(8), 088303 FEB (2004).
[64] J. Jeong, Z. Davidson, P. Collings, T. Lubensky, and A. Yodh. Chiral symmetry breaking
and surface faceting in chromonic liquid crystal droplets with giant elastic anisotropy.
Proceedings of the National Academy of Sciences 111(5), 1742–1747 (2014).
[65] J. W. Jeong, G. H. Han, A. T. C. Johnson, P. J. Collings, T. C. Lubensky, and A. G.
Yodh. Homeotropic alignment of lyotropic chromonic liquid crystals using noncovalent
interactions.Langmuir 30(10), 2914–2920 MAR (2014).
[66] L. Jiang, J. de Folter, J. Huang, A. Philipse, W. Kegel, and A. Petukhov. Helical col-
loidal sphere structures through thermo-reversible co-assembly with molecular micro-
tubes. ANGEWANDTE CHEMIE-INTERNATIONAL EDITION 52(12), 3364–3368
(2013).
[67] R. D. Kamien, P. Le Doussal, and D. R. Nelson. Theory of directed polymers.Physical
Review A 45, 8727–8750 Jun (1992).
[68] R. D. Kamien and D. R. Nelson. Defects in chiral columnar phases: Tilt-grain boundaries
and iterated moire maps.Phys. Rev. E 53, 650–666 Jan (1996).
[69] R. D. Kamien and J. Toner. Anomalous elasticity of polymer cholesterics.Phys. Rev. Lett.
74, 3181–3184 Apr (1995).
173

[70] Y. Kantor and M. Kardar. One-dimensional gas of hard needles. Physical Review E 79(4)
APR (2009).
[71] T. Kawasaki and H. Tanaka. Structural signature of slow dynamics and dynamic hetero-
geneity in two-dimensional colloidal liquids: glassy structural order.Journal of Physics -
Condensed Matter 23(19), 194121 MAY 18 (2011).
[72] D. Kaya, N. Green, C. Maloney, and M. Islam. Normal modes and density of states of
disordered colloidal solids.Science 329(5992), 656–658 AUG 6 (2010).
[73] N. C. Keim and P. E. Arratia. Mechanical and microscopic properties of the reversible
plastic regime in a 2d jammed material.Physical Review Letters 112(2), 028302 JAN 15
(2014).
[74] P. Keim, G. Maret, U. Herz, and H. von Grunberg. Harmonic lattice behavior of two-
dimensional colloidal crystals.Physical Review Letters 92(21), 215504 MAY 28 (2004).
[75] A. N. Khlobystov, D. A. Britz, A. Ardavan, and G. A. D. Briggs. Observation of ordered
phases of fullerenes in carbon nanotubes.Physical Review Letters 92(24) JUN (2004).
[76] J. B. Kim, P. Kim, N. C. Pegard, S. J. Oh, C. R. Kagan, J. W. Fleischer, H. A. Stone,
and Y.-L. Loo. Wrinkles and deep folds as photonic structures in photovoltaics.Nature
Photonics 6(5), 327–332 MAY (2012).
[77] S. Kitson and A. Geisow. Controllable alignment of nematic liquid crystals around micro-
scopic posts: Stabilization of multiple states.Applied Physics Letters 80(19), 3635–3637
MAY 13 (2002).
174

[78] S. C. Kitson, E. G. Edwards, and A. D. Geisow. Designing liquid crystal alignment
surfaces.Applied Physics Letters 92(7), 073503 FEB 18 (2008).
[79] S. Kitson and A. Geisow. Bistable alignment of nematic liquid crystals around micro-
scopic posts.Molecular Crystals and Liquid Crystals 412, 1763–1771 (2004). 19th
International Liquid Crystal Conference, EDINBURGH, SCOTLAND, JUN 30-JUL 05,
2002.
[80] C. Kittel. Phase transition of a molecular zipper.American Journal of Physics 37(9), 917
(1969).
[81] H. Kleinert. Disclinations and 1st order transitions in 2d melting.Physics Letters A
99(7), 381–384 (1983).
[82] M. Kleman and P. Oswald. Defects in hexagonal discotic mesophases - discilnations and
walls. Journal de Physique 42(10), 1461–1472 (1981).
[83] M. Kleman and P. Oswald. Columnar discotic mesophases - elasticity, dislocations, insta-
bilities. Journal de Physique 43(4), 655–662 (1982).
[84] K. Koga and H. Tanaka. Close-packed structures and phase diagram of soft spheres in
cylindrical pores.Journal of Chemical Physics 124(13) APR (2006).
[85] J. M. Kosterlitz and D. J. Thouless. Ordering, metastability and phase-transitions in 2
dimensional systems.Journal of Physics C - Solid State Physics 6(7), 1181–1203 (1973).
[86] N. Koumakis and G. Petekidis. Two step yielding in attractive colloids: transition from
gels to attractive glasses.Soft Matter 7(6), 2456–2470 (2011).
175

[87] M. Kozubek, S. Kozubek, E. Lukasova, E. Bartova, M. Skalnikova, P. Matula, P. Mat-
ula, P. Jirsova, A. Cafourkova, and I. Koutna. Combined confocal and wide-field high-
resolution cytometry of fluorescent in situ hybridization-stained cells.CYTOMETRY
45(1), 1–12 SEP 1 (2001).
[88] M. Kroon, W. L. Vos, and G. H. Wegdam. Structure and formation of a gel of colloidal
disks.Physical Review E 57(2), 1962–1970 FEB (1998).
[89] A. Latka, Y. Han, A. M. Alsayed, A. B. Schofield, A. G. Yodh, and P. Habdas. Particle
dynamics in colloidal suspensions above and below the glass-liquid re-entrance transition.
Europhysics Letters 86(5), 58001 JUN (2009).
[90] M. Laurati, S. U. Egelhaaf, and G. Petekidis. Nonlinear rheology of colloidal gels with
intermediate volume fraction.Journal of Rheology 55(3), 673–706 MAY-JUN (2011).
[91] J. Lee, H. Bermudez, B. Discher, M. Sheehan, Y. Won, F. Bates, and D. Discher. Prepa-
ration, stability, and in vitro performance of vesicles made with diblock copolymers.
Biotechnology and Bioengineering 73(2), 135–145 APR 20 (2001).
[92] F. Li, X. Badel, J. Linnros, and J. B. Wiley. Fabrication of colloidal crystals with tubular-
like packings. Journal of the American Chemical Society 127(10), 3268–3269 MAR
(2005).
[93] I.-H. Lin, D. S. Miller, P. J. Bertics, C. J. Murphy, J. J. de Pablo, and N. L. Ab-
bott. Endotoxin-induced structural transformations in liquid crystalline droplets.Science
332(6035), 1297–1300 JUN 10 (2011).
176

[94] M. A. Lohr, A. M. Alsayed, B. G. Chen, Z. Zhang, R. D. Kamien, and A. G. Yodh.
Helical packings and phase transformations of soft spheres in cylinders.Physical Review
E 81(4), 040401 APR (2010).
[95] M. A. Lohr, J. Cavallaro, Marcello, A. Beller, Daniel, K. J. Stebe, D. Kamien, Randall,
P. J. Collings, and A. G. Yodh. Elasticity-dependent self-assembly of micro-templated
chromonic liquid crystal films.Soft Matter 10(19), 3477 – 3484 (2014).
[96] P. J. Lu, E. Zaccarelli, C. F, A. B. Schofield, F. Sciortino, and D. A. Weitz. Gelation of
particles with short-range attraction.Nature 453(7194), 499–U4 MAY (2008).
[97] T. Lubensky, D. Pettey, N. Currier, and H. Stark. Topological defects and interactions in
nematic emulsions.Physical Review E 57(1), 610–625 JAN (1998).
[98] J. Lydon. Chromonic review.Journal of Materials Chemistry 20(45), 10071–10099
(2010).
[99] J. Lydon. Chromonic liquid crystalline phases.Liquid Crystals 38(11-12, SI), 1663–
1681 (2011).
[100] L. A. Lyon, J. D. Debord, S. B. Debord, C. D. Jones, J. G. McGrath, and M. J. Serpe.
Microgel colloidal crystals.Journal of Physical Chemistry B 108(50), 19099–19108
DEC (2004).
[101] M. Manning and A. Liu. Vibrational modes identify soft spots in a sheared disordered
packing.Physical Review Letters 107(10) AUG 31 (2011).
177

[102] D. Matsunaga, T. Tamaki, H. Akiyama, and K. Ichimura. Photofabrication of
micro-patterned polarizing elements for stereoscopic displays.Advanced Materials
14(20), 1477+ OCT 16 (2002).
[103] J. T. McGinley, I. Jenkins, T. Sinno, and J. C. Crocker. Assembling colloidal clusters using
crystalline templates and reprogrammable dna interactions.Soft Matter 9(38), 9119–
9128 (2013).
[104] C. K. McGinn, L. I. Laderman, N. Zimmermann, H. S. Kitzerow, and P. J. Collings. Planar
anchoring strength and pitch measurements in achiral and chiral chromonic liquid crystals
using 90-degree twist cells.Physical Review E 88(0), 062513 DEC (2013).
[105] R. B. Meyer. On the existence of even indexed disclinations in nematic liquid crystals.
Philosophical Magazine 27(2), 405424 (1973).
[106] D. Meyerhofer, R. Williams, and A. Sussman. Electrooptic and hydrodynamic properties
of nematic liquid films with free surfaces.Journal of Applied Physics 43(9), 3685 (1972).
[107] C. D. Modes and M. Warner. Blueprinting nematic glass: Systematically constructing and
combining active points of curvature for emergent morphology.Physical Review E 84(2,
1), 021711 AUG 30 (2011).
[108] C. D. Modes, M. Warner, C. Sanchez-Somolinos, L. T. de Haan, and D. Broer. Angu-
lar deficits in flat space: remotely controllable apertures in nematic solid sheets.Pro-
ceedings of the Royal Society A-Mathematical and Physical and Engineerings Sciences
469(2153), 20120631 MAY 8 (2013).
178

[109] J. H. Moon, S. Kim, G. R. Yi, Y. H. Lee, and S. M. Yang. Fabrication of ordered macrop-
orous cylinders by colloidal templating in microcapillaries.Langmuir 20(5), 2033–2035
MAR (2004).
[110] A. Mukhopadhyay, F. Guo, A. Tokranov, X. Xiao, R. H. Hurt, and B. W. Sheldon. Engi-
neering of graphene layer orientation to attain high rate capability and anisotropic prop-
erties in li-ion battery electrodes.Advanced Functional Materials 23(19), 2397–2404
MAY 20 (2013).
[111] M. Muller. Introduction to Confocal Fluorescence Microscopy. Tutorial Text Series.
Society of Photo Optical (2006).
[112] C. A. Murray and D. H. VanWinkle. Experimental-observation of 2-stage melting
in a classical two-dimensional screened coulomb system.Physical Review Letters
58(12), 1200–1203 MAR (1987).
[113] P. C. Mushenheim, R. R. Trivedi, H. H. Tuson, D. B. Weibel, and N. L. Abbott. Dynamic
self-assembly of motile bacteria in liquid crystals.Soft Matter 10, 88–95 (2014).
[114] Y. Nastishin, K. Neupane, A. Baldwin, O. Lavrentovich, and S. Sprint. Elasticity and vis-
cosity of a lyotropic chromonic nematic studied with dynamic light scattering.electronic-
Liquid Crystal Communications JULY (2008).
[115] V. G. Nazarenko, O. P. Boiko, M. I. Anisimov, A. K. Kadashchuk, Y. A. Nastishin, A. B.
Golovin, and O. D. Lavrentovich. Lyotropic chromonic liquid crystal semiconductors for
water-solution processable organic electronics.Applied Physics Letters 97(26), 263305
DEC 27 (2010).
179

[116] V. G. Nazarenko, O. P. Boiko, H. S. Park, O. M. Brodyn, M. M. Omelchenko, L. Tortora,
Y. A. Nastishin, and O. D. Lavrentovich. Surface alignment and anchoring transitions
in nematic lyotropic chromonic liquid crystal.Physical Review Letters 105(1) JUN 28
(2010).
[117] D. R. Nelson and B. I. Halperin. Dislocation-mediated melting in 2 dimensions.Physical
Review B 19(5), 2457–2484 (1979).
[118] C. O’Hern, L. E. Silbert, A. J. Liu, and S. R. Nagel. Jamming at zero temperature and
zero applied stress: The epitome of disorder.Physical Review E 68(1) JUL (2003).
[119] M. O’Neill and S. M. Kelly. Ordered materials for organic electronics and photonics.
Advanced Materials 23(5), 566–584 FEB 1 (2011).
[120] N. Ould-Moussa, C. Blanc, C. Zamora-Ledezma, O. D. Lavrentovich, I. I. Smalyukh,
M. F. Islam, A. G. Yodh, M. Maugey, P. Poulin, A. E., and M. Nobili. Dispersion and ori-
entation of single-walled carbon nanotubes in a chromonic liquid crystal.Liquid Crystals
40(12), 1628–1635 (2013).
[121] H.-S. Park, S.-W. Kang, L. Tortora, S. Kumar, and O. D. Lavrentovich. Condensation
of self-assembled lyotropic chromonic liquid crystal sunset yellow in aqueous solutions
crowded with polyethylene glycol and doped with salt.Langmuir 27(7), 4164–4175
APR 5 (2011).
[122] H.-S. Park, S.-W. Kang, L. Tortora, Y. Nastishin, D. Finotello, S. Kumar, and O. D.
Lavrentovich. Self-assembly of lyotropic chromonic liquid crystal sunset yellow and
180

effects of ionic additives.Journal of Physical Chemistry B 112(51), 16307–16319 DEC
25 (2008).
[123] S. K. Park, S. E. Kim, D. Y. Kim, S. W. Kang, S. Shin, S. W. Kuo, S. H. Hwang, S. H. Lee,
M. H. Lee, and K. U. Jeong. Polymer-stabilized chromonic liquid-crystalline polarizer.
Advanced Functional Materials 21(11), 2129–2139 JUN (2011).
[124] J. Pawley. Handbook of Biological Confocal Microscopy. Cognition and Language.
Springer Dordrecht (1995).
[125] R. Peierls.Surprises in Theoretical Physics. Princeton series in physics. Princeton Uni-
versity Press Princeton, NJ (1979).
[126] R. Peierls.More Surprises in Theoretical Physics. Princeton University Press Princeton,
NJ (1991).
[127] R. Pelton. Temperature-sensitive aqueous microgels.Advances in Colloid and Interface
Science 85(1), 1–33 FEB (2000).
[128] K. N. Pham, G. Petekidis, D. Vlassopoulos, S. U. Egelhaaf, W. C. K. Poon, and P. N.
Pusey. Yielding behavior of repulsion- and attraction-dominated colloidal glasses.Journal
of Rheology 52(2), 649–676 (2008).
[129] K. N. Pham, G. Petekidis, D. Vlassopoulos, S. U. Egelhaaf, P. N. Pusey, and W. C. K.
Poon. Yielding of colloidal glasses.Europhysics Letters 75(4), 624–630 AUG (2006).
181

[130] K. N. Pham, A. M. Puertas, J. Bergenholtz, S. U. Egelhaaf, A. Moussaid, P. N. Pusey,
A. B. Schofield, M. E. Cates, M. Fuchs, and W. C. K. Poon. Multiple glassy states in a
simple model system.Science 296(5565), 104–106 APR (2002).
[131] G. T. Pickett, M. Gross, and Okuyama. Spontaneous chirality in simple systems.Physical
Review Letters 85(17), 3652–3655 OCT (2000).
[132] N. Pittet, P. Boltenhage, N. Rivier, and D. Weaire. Structural transitions in ordered, cylin-
drical foams.Europhysics Letters 35(7), 547–552 SEP (1996).
[133] N. Pittet, N. Rivier, and D. Weaire. Cylindrical packing of foam cells.Forma 10(1), 65–
73 (1995).
[134] P. Poulin, H. Stark, T. Lubensky, and D. Weitz. Novel colloidal interactions in anisotropic
fluids. Science 275(5307), 1770–1773 MAR 21 (1997).
[135] P. Pusey and W. VanMegen. Phase behavior of concentrated suspensions of nearly hard
colloidal spheres.Nature 320(6060), 340–342 MAR 27 (1986).
[136] P. Pusey, W. VanMegen, P. Bartlett, B. Ackerson, J. Rarity, and S. Underwood. Structure
of crystals of hard colloidal spheres.Physical Review Letters 63(25), 2753–2756 DEC
18 (1989).
[137] A. Rapini and M. J. Papoular. Distortion d’une lamelle nematique sous champ magnetique
conditions d’ancrage aux parois.J. Phys. (Paris) Colloq. 30, C4–54 (1969).
[138] M. Ravnik and S. Zumer. Landau-de gennes modelling of nematic liquid crystal colloids.
Liquid Crystals 36(10-11), 1201–1214 (2009).
182

[139] L. Rovigatti, W. Kob, and F. Sciortino. The vibrationaldensity of states of a disordered
gel model.Journal of Chemical Physics 135(10) (2011).
[140] B. R. Saunders and B. Vincent. Microgel particles as model colloids: theory, properties
and applications.Advances in Colloid and Interface Science 80(1), 1–25 FEB (1999).
[141] M. Schindler and A. Maggs. Truncated correlations in video microscopy of colloidal
solids.Soft Matter 8(14), 3864–3874 (2012).
[142] T. Scopigno, G. Ruocco, F. Sette, and G. Monaco. Is the fragility of a liquid embedded in
the properties of its glass?Science 302(5646), 849–852 OCT (2003).
[143] H. Shintani and H. Tanaka. Universal link between the boson peak and transverse phonons
in glass.Nature Materials 7(11), 870–877 NOV (2008).
[144] S. Shiyanovskii, O. Lavrentovich, T. Schneider, T. Ishikawa, I. Smalyukh, C. Woolverton,
G. Niehaus, and K. Doane. Lyotropic chromonic liquid crystals for biological sensing ap-
plications.Molecular Crystals and Liquid Crystals 434, 587–598 (2005). 20th Biennial
International Liquid Crystal Conference, Ljubljana, SLOVENIA, JUL 04-09, 2004.
[145] J. Sjoblom, A. Blokhus, M. Wei, and S. FRiberg. Surfactants and cosurfactants in lamellar
liquid crystals and adsorbed on solid-surfaces 1. the model system sodium dodecyl-sulfate
butanol or sodium dodecyl-sulfate benzyl alcohol and alpha-alumina.Journal of Colloid
and Interface Science 140(2), 481–491 DEC (1990).
[146] I. I. Smalyukh, J. Butler, J. D. Shrout, M. R. Parsek, and G. C. L. Wong. Elasticity-
mediated nematiclike bacterial organization in model extracellular dna matrix.Physical
Review E 78(3), 030701 (2008).
183

[147] T. Still, C. P. Goodrich, K. Chen, P. J. Yunker, S. Schoenholz, A. J. Liu, and A. G. Yodh.
Phonon dispersion and elastic moduli of two-dimensional disordered colloidal packings
of soft particles with frictional interactions.Physical Review E 89(1) JAN (2014).
[148] T. Still, K. Chen, A. M. Alsayed, K. B. Aptowicz, and A. G. Yodh. Synthesis
of micrometer-size poly(n-isopropylacrylamide) microgel particles with homogeneous
crosslinker density and diameter control.Journal of Colloid and Interface Science
405, 96–102 SEP 1 (2013).
[149] J. Swift and B. Andereck. Statics and dynamics near the nematic-columnar phase-
transition in liquid-crystals.Journal de Physique Lettres 43(12), L437–L440 (1982).
[150] S.-W. Tam-Chang and L. Huang. Chromonic liquid crystals: properties and applications
as functional materials.Chemical Communications (17), 1957–1967 MAY 7 (2008).
[151] S. Tam-Chang, J. Helbley, T. Carson, W. Seo, and I. Iverson. Template-guided organiza-
tion of chromonic liquid crystals into micropatterned anisotropic organic solids.Chemical
Communications (5), 503–505 FEB 7 (2006).
[152] H. Tanaka, T. Kawasaki, H. Shitani, and K. Watanabe. Critical-like behavior of glass-
forming liquids. Nature Materials 9(5), 324–331 APR (2010).
[153] S. Taraskin and S. R. Elliott. Vibrations in disordered systems.Physica B 316, 81–88
MAY (2002).
[154] V. Taratuta and R. Meyer. Elasticity of a nematic polymer in the infinite molecular chain
limit. Liquid Crystals 2(3), 373–379 MAY-JUN (1987).
184

[155] R. Thurston, J. Cheng, and G. Boyd. Mechanically bistable liquid-crystal display struc-
tures.IEEE Transactions on Electron Devices 27(11), 2069–2080 (1980).
[156] C. M. Tone, M. P. De Santo, and F. Ciuchi. Alignment of chromonic liquid crystals: A
difficult task. Molecular Crystals and Liquid Crystals 576(1), 2–7 JUL 1 (2013).
[157] C. M. Tone, M. P. De Santo, M. G. Buonomenna, G. Golemme, and F. Ciuchi. Dy-
namical homeotropic and planar alignments of chromonic liquid crystals.Soft Matter
8(32), 8478–8482 (2012).
[158] L. Tortora and O. D. Lavrentovich. Chiral symmetry breaking by spatial confinement
in tactoidal droplets of lyotropic chromonic liquid crystals.Proceedings of the National
Academy of the Sciences 108(13), 5163–5168 MAR 29 (2011).
[159] L. Tortora, H.-S. Park, S.-W. Kang, V. Savaryn, S.-H. Hong, K. Kaznatcheev, D. Finotello,
S. Sprunt, S. Kumar, and O. D. Lavrentovich. Self-assembly, condensation, and or-
der in aqueous lyotropic chromonic liquid crystals crowded with additives.Soft Matter
6(17), 4157–4167 (2010).
[160] V. Trappe, V. Prasad, L. Cipelletti, P. N. Segre, and D. A. Weitz. Jamming phase diagram
for attractive particles.Nature 411(6839), 772–775 JUN (2001).
[161] M. Tymczenko, L. F. Marsal, T. Trifonov, I. Rodriguez, F. Ramiro-Manzano, J. Pallares,
A. Rodriguez, R. Alcubilla, and F. Meseguer. Colloidal crystal wires.Advanced Materials
20(12), 2315 JUN (2008).
[162] L. Van Hove. Sur l’integrale de configuration pour les systemes de particules a une di-
mension.Physica 16(2), 137–142 FEB (1950).
185

[163] W. van Megen. Dynamical perspective of the freezing transition of a suspension of hard
spheres from the velocity autocorrelation function.Physical Review E 73(2), 020503
FEB (2006).
[164] G. Vroege and H. Lekkerkerker. Phase-transitions in lyotropic colloidal and polymer
liquid-crystals.Reports on Progress in Physics 55(8), 1241–1309 (1992).
[165] A. Widmer-Cooper, H. Perry, P. Harrowell, and D. R. Reichman. Irreversible reorga-
nization in a supercooled liquid originates from localized soft modes.Nature Physics
4(9), 711–715 SEP (2008).
[166] S. Williams, G. Bryant, I. Snook, and W. van Megen. Velocity autocorrelation func-
tions of hard-sphere fluids: Long-time tails upon undercooling.Physical Review Letters
96(8), 087801 MAR 3 (2006).
[167] D. Wood, C. Santangelo, and A. Dinsmore. Self-assembly on a cylinder: a model system
for understanding the constraint of commensurability.Soft Matter 9(42), 10016–10024
(2013).
[168] C. Woolverton, E. Gustely, L. Li, and O. Lavrentovich. Liquid crystal effects on bacterial
viability. Liquid Crystals 32(4), 417–423 APR (2005).
[169] M. Wyart, L. Silbert, S. Nagel, and T. Witten. Effects of compresssion on the vibrational
modes of marginally jammed solids.Physical Review E 72(2) (2005).
[170] N. Xu, V. Vitelli, A. J. Liu, and S. R. Nagel. Anharmonic and quasi-localized vibrations in
jammed solidsmodes for mechanical failure.Europhysics Letters 90(5), 56001 (2010).
186

[171] T. Yamazaki, K. Kuramochi, D. Takagi, Y. Homma, F. Nishimura, N. Hori, K. Watanabe,
S. Suzuki, and Y. Kobayashi. Ordered fullerene nanocylinders in large-diameter carbon
nanotubes.Nanotechnology 19(4) JAN (2008).
[172] J. Yin, J. L. Yaguee, D. Eggenspieler, K. K. Gleason, and M. C. Boyce. Determinis-
tic order in surface micro-topologies through sequential wrinkling.Advanced Materials
24(40), 5441–5446 OCT 23 (2012).
[173] A. P. Young. Melting and the vector coulomb gas in two dimensions.Physical Review B
19(4), 1855–1866 (1979).
[174] P. Yunker, Z. Zhang, K. Aptowicz, and A. Yodh. Irreversible rearrangements, correlated
domains, and local structure in aging glasses.Physical Review Letters 103(11) SEP 11
(2009).
[175] P. J. Yunker, M. Gratale, M. A. Lohr, T. Still, T. C. Lubensky, and A. G. Yodh. Influ-
ence of particle shape on bending rigidity of colloidal monolayer membranes and particle
deposition during droplet evaporation in confined geometries.Physical Review Letters
108(22), 228303 JUN 1 (2012).
[176] P. J. Yunker, M. A. Lohr, T. Still, A. Borodin, D. J. Durian, and A. G. Yodh. Effects of
particle shape on growth dynamics at edges of evaporating drops of colloidal suspensions.
Physical Review Letters 110(3), 035501 JAN 18 (2013).
[177] P. J. Yunker, T. Still, M. A. Lohr, and A. Yodh. Suppression of the coffee-ring effect by
shape-dependent capillary interactions.Nature 476(7360), 308–311 AUG 18 (2011).
187

[178] P. Yunker, K. Chen, M. Gratale, M. Lohr, T. Still, and A. Yodh. Physics in ordered and
disordered colloidal matter composed of poly(n-isopropyl acrylamide) microgel particles.
Reports on Progress in Physics 77(5), 056601 (2014).
[179] P. Yunker, K. Chen, Z. Zhang, and A. Yodh. Phonon spectra, nearest neighbors, and
mechanical stability of disordered colloidal clusters with attractive interactions.Physical
Review Letters 106(22) JUN 1 (2011).
[180] P. Yunker, Z. Zhang, M. Gratale, K. Chen, and A. Yodh. Relationship between neighbor
number and vibrational spectra in disordered colloidal clusters with attractive interactions.
Journal of Chemical Physics 138(12) MAR 28 (2013).
[181] E. Zaccarelli. Colloidal gels: equilibrium and non-equilibrium routes.Journal of Physics:
Condensed Matter 19(32) (2007).
[182] E. Zaccarelli and W. Poon. Colloidal glasses and gels: The interplay of bonding and
caging.Proceedings of the National Academy of Sciences 106(36), 15203–15208 (2009).
[183] A. Zaccone, H. Wu, and E. Del Gado. Elasticity of arrested short-ranged attractive col-
loids: Homogeneous and heterogeneous glasses.Physical Review Letters 103(20) NOV
13 (2009).
[184] K. Zahn, R. Lenke, and G. Maret. Two-stage melting of paramagnetic colloidal crystals
in two dimensions.Physical Review Letters 82(13), 2721–2724 MAR (1999).
[185] Z. Zhang, P. Yunker, P. Habdas, and A. Yodh. Cooperative rearrangment regions and
dynamical heterogeneities in colloidal glasses with attractive versus repulsive interactions.
Physical Review Letters 107(20) NOV 11 (2011).
188

[186] Z. Zhang, I. Jones, H. Schriemer, J. Page, D. Weitz, and P. Sheng. Wave transport in
random media: The ballistic to diffusive transition.Physical Review E 60(4), 4843–
4850 OCT (1999).
[187] Z. Zhang, N. Zu, D. Chen, P. Yunker, A. Alsayed, K. Aptowicz, P. Habdas, A. Liu,
S. Nagel, and A. Yodh. Thermal vestige of the zero-temperature jamming transition.
Nature 495(7244), 230–233 MAY 14 (2009).
[188] S. Zhou, A. Sokolov, O. D. Lavrentovich, and I. S. Aranson. Living liquid crystals.
Proceedings of the National Academy of Sciences 111(4), 12651270 (2014).
[189] S. Zhou, Y. A. Nastishin, M. M. Omelchenko, L. Tortora, V. G. Nazarenko, O. P. Boiko,
T. Ostapenko, T. Hu, C. C. Almasan, S. N. Sprunt, J. T. Gleeson, and O. Lavrentovich.
Elasticity of lyotropic chromonic liquid crystals probed by director reorientation in a mag-
netic field.Physical Review Letters 109(3), 037801 JUL 18 (2012).
[190] J. Zhu, M. Li, R. Rogers, W. Meyer, R. Ottewill, W. Russell, and P. Chaikin. Crystal-
lization of hard-sphere colloids in microgravity.Nature 387(6636), 883–885 JUN 26
(1997).
189