Embed Size (px)
Citation preview

MICROSTRUCTURAL PREDICTION IN METAL CUTTING AND IMPROVEMENT OF MACHINABILITY AND SURFACE INTEGRITY VIA LASER‐ASSISTED MACHINING
A Dissertation
Submitted to the Faculty
of
Purdue University
by
Hongtao Ding
In Partial Fulfillment of the
Requirements for the Degree
of
Doctor of Philosophy
May 2012
Purdue University
West Lafayette, Indiana

ii
To my wife, Ting Lu.

iii
ACKNOWLEDGEMENTS
First and foremost, I must thank Dr. Yung C. Shin, who guided me through my PhD
research and introduced me to the exciting fields of laser‐assisted machining and material
process modeling. His invaluable advices have directed my research work and inspired me to
find the solutions to the difficult problems I encountered. I would also like to thank Dr. Klod
Kokini, Dr. Ganesh Subbarayan, Dr. Gary Cheng and Dr. Keith Bowman for serving on my
examination and advisory committee and for providing me with ample guidance.
I have been very fortunate to work with Ninggang Shen, Yinggang Tian, Gary Hedberg,
Tyler Davis, Benxin Wu, Wenda Tan, Yunfeng Cao, Shaoyi Wen and Neil Bailey, who as fellow
graduate students helped me immensely for my research. I would like to thank them for making
my PhD at Purdue an enjoyable experience.
I would like to thank Mike Sherwood and John Wheeler for their help on machining
experiments. I would also like to thank Dave Roberts, Diana Akers and all other staffs in the ME
department for their help.
I am grateful for having the best family and I thank my wife, Ting, for her sacrifice and
her love throughout my PhD. I want to thank my parents and sister for their unwavering
support.

iv
TABLE OF CONTENTS
Page
LIST OF TABLES ............................................................................................................................... viii
LIST OF FIGURES ............................................................................................................................... x
ABSTRACT .................................................................................................................................... xiv
CHAPTER 1. INTRODUCTION ............................................................................................................ 1
1.1. Rationale ............................................................................................................................ 1
1.2. Laser-Assisted Machining .................................................................................................. 4
1.2.1. Laser-Assisted Machining of Difficult-to-Machine Metal Alloys ............................... 4
1.2.2. Laser-Assisted Micromachining of Difficult-to-Machine Metal Alloys ..................... 6
1.3. Thermal and Mechanical Modeling of Laser-Assisted Machining ..................................... 9
1.3.1. Thermal Modeling of Laser-Assisted Machining ....................................................... 9
1.3.2. Mechanical Modeling of Machining ....................................................................... 10
1.4. Microstructure Alteration in Metal Cutting ..................................................................... 13
1.4.1. Grain Refinement in Cutting ................................................................................... 13
1.4.2. Phase Change in Steel Cutting ................................................................................ 19
1.4.3. White Layer Formation Mechanisms ...................................................................... 22
1.5. Research Objectives ......................................................................................................... 25
1.6. Dissertation Outline ......................................................................................................... 26
CHAPTER 2. THERMAL AND MECHANICAL MODELING OF MACHINING PROCESSES .................... 28
2.1. Coupled Eulerian-Lagrangian Modeling of Orthogonal Cutting ...................................... 28
2.1.1. CEL Modeling .......................................................................................................... 28
2.1.2. Model Validation..................................................................................................... 29
2.2. Finite Element Modeling of Laser-Assisted Micro-Milling ............................................... 31
2.2.1. LAMM Experimental Work ..................................................................................... 31
2.2.2. Strain Gradient Constitutive Model ........................................................................ 35

v
Page
2.2.3. FE Models of Chip Formation Analysis .................................................................... 37
2.2.4. Validation of Cutting Force ..................................................................................... 38
2.3. Thermal and Mechanical Modeling Analysis of Laser-Assisted Micro-Milling ................ 40
2.3.1. Workpiece Temperature Increase due to Laser Heating ........................................ 40
2.3.2. Workpiece Temperature after Multi LAMM Cycles ................................................ 44
2.3.3. Tool Temperature after Multi LAMM Cycles .......................................................... 47
2.3.4. Chip Formation and Temperature Effect on Workpiece Flow Stress ..................... 49
2.3.5. Tool Wear Analysis in Laser-Assisted Side Cutting ................................................. 51
2.3.6. Surface Integrity Analysis ........................................................................................ 54
2.4. Summary .......................................................................................................................... 56
CHAPTER 3. GRAIN REFINEMENT MODELING IN MACHINING ...................................................... 58
3.1. Dislocation Density-Based Material Model ..................................................................... 58
3.2. Determination of Material Model Parameters ................................................................ 62
3.3. Simulations of Grain Refinement by Machining .............................................................. 66
3.3.1. Chip Formation and Deformation Field .................................................................. 67
3.3.2. Grain Refinement .................................................................................................... 69
3.3.3. Discussions .............................................................................................................. 77
3.4. Summary .......................................................................................................................... 78
CHAPTER 4. PHASE CHANGE MODELING IN MACHINING .............................................................. 80
4.1. Phase Transformation Kinetics ........................................................................................ 80
4.2. Constituent Phase Properties of AISI 1045 Steel ............................................................. 82
4.3. Metallo-thermo-mechanical Coupling ............................................................................. 86
4.4. Simulations ...................................................................................................................... 88
4.4.1. Implementation of the Material Models ................................................................ 88
4.4.2. Orthogonal Cutting Experiments of 1045 Steel ...................................................... 89
4.5. Simulation Results ........................................................................................................... 92
4.6. Discussions ....................................................................................................................... 99
4.7. Summary ........................................................................................................................ 101
CHAPTER 5. MULTI-PHYSICS MODELING OF MICROSTRUCTURE ALTERATION IN HARD TURNING102
5.1. Hard Turning Experiments ............................................................................................. 102

vi
Page
5.2. Models ........................................................................................................................... 103
5.2.1. Material Properties and Constitutive Models of AISI 52100 Steel ....................... 103
5.2.2. Phase Transformation Kinetics and Metallo-thermo-mechanical Coupling ......... 104
5.2.3. Grain Refinement and Dislocation Density Evolution ........................................... 106
5.2.4. Numerical Solution ............................................................................................... 107
5.3. Results and Discussions ................................................................................................. 109
5.4. Summary ........................................................................................................................ 117
CHAPTER 6. SURFACE INTEGRITY ANALYSIS OF LASER-ASSISTED MACHINING OF HARDENED
STEEL PARTS ............................................................................................................. 118
6.1. Problem Statement ........................................................................................................ 118
6.2. Improvement of LAM Thermal Model ........................................................................... 119
6.2.1. Thermal Modeling of Laser-Assisted Face Turning ............................................... 119
6.2.2. Thermal Modeling of Laser-Assisted Profile Turning ............................................ 126
6.3. LAM Process and Modeling ........................................................................................... 130
6.3.1. Experimental Setup ............................................................................................... 130
6.3.2. Temperature Prediction and Measurement ......................................................... 133
6.3.3. Microstructural Prediction of the LAM Process .................................................... 138
6.4. Surface Integrity Analysis ............................................................................................... 141
6.4.1. LAM Experiments .................................................................................................. 141
6.4.2. Surface Finish ........................................................................................................ 142
6.4.3. Precise Size Control ............................................................................................... 143
6.4.4. Microstructures .................................................................................................... 144
6.4.5. Hardness ............................................................................................................... 145
6.4.6. Residual Stress ...................................................................................................... 146
6.4.7. Discussions ............................................................................................................ 149
6.5. Summary ........................................................................................................................ 150
CHAPTER 7. CONCLUSIONS AND FUTURE WORK ........................................................................ 151
7.1. Summary ........................................................................................................................ 151
7.2. Conclusions .................................................................................................................... 155
7.3. Future Work ................................................................................................................... 155

vii
Page
LIST OF REFERENCES .................................................................................................................... 158
VITA………………… ................................................................................................ …………………………177

viii
LIST OF TABLES
Table ........................................................................................................................................... Page
Table 2.1. CEL model validation test conditions ............................................................................ 30
Table 2.2. Johnson-Cook type constitutive model parameters for AISI 316L ................................ 30
Table 2.3. LAMM side cutting tests of bulk workpiece configuration ........................................... 34
Table 2.4. LAMM side cutting tests of fin workpiece configuration .............................................. 34
Table 2.5. Johnson-Cook constitutive model parameters of the workpiece materials ................. 36
Table 2.6. Strain gradient parameters of the workpiece materials ............................................... 36
Table 2.7. Thermal properties of the workpiece materials ........................................................... 41
Table 2.8. Absorptivity of the workpiece materials at CO2 laser wavelength of 10.6 µm ............ 41
Table 3.1. Orthogonal cutting tests simulated for Al 6061 T6 and OFHC Cu ................................. 63
Table 3.2. Material thermo-mechanical properties ....................................................................... 65
Table 3.3. Material constitutive model parameters ...................................................................... 65
Table 3.4. Dislocation density-based model parameters .............................................................. 65
Table 3.5. Simulation results for orthogonal cutting of Al 6061 T6 and OFHC Cu ......................... 75
Table 4.1. Microstructural properties for AISI 1045 steel ............................................................. 82
Table 4.2. Physical properties of constituent phases for AISI 1045 steel ...................................... 84
Table 4.3. The constitutive model parameters of constituent phases for AISI 1045 steel ............ 86
Table 4.4. Orthogonal cutting conditions for AISI 1045 steel ........................................................ 90
Table 4.5. Comparison of model predictions with experimental data from ................................. 95
Table 5.1. Hard turning conditions .............................................................................................. 103
Table 5.2. Physical properties of constituent phases for AISI 52100 steel .................................. 104
Table 5.3. Constitutive model parameters of phases for AISI 52100 steel .................................. 104
Table 5.4. Dislocation density-model constants .......................................................................... 107
Table 6.1. Dislocation density-model constants of 4130 steel .................................................... 139
Table 6.2. LAM experimental conditions ..................................................................................... 141

ix
Table ........................................................................................................................................... Page
Table 6.3. X-ray parameters for 4340 steel ................................................................................. 147

x
LIST OF FIGURES
Figure ......................................................................................................................................... Page
Figure 1.1. Chip formation relative to chip load and cutting edge radius ....................................... 7
Figure 1.2. TEM images of grain refinement of CP Ti. ................................................................... 18
Figure 1.3. Metallo-thermo-mechanical coupling in cutting of steels ........................................... 20
Figure 1.4. Phase changes in hypo-eutectoid steel during heating ............................................... 21
Figure 1.5. Processing map of the white layers formed during machining of AISI 52100 steel. ... 24
Figure 2.1. CEL model setup schematic ......................................................................................... 29
Figure 2.2. Comparison of predicted cutting force with experiments........................................... 30
Figure 2.3. Comparison of predicted temperature distributions for Test 2 .................................. 31
Figure 2.4. LAMM test configurations ........................................................................................... 32
Figure 2.5. Johnson-Cook and strain gradient constitutive behaviors of the workpiece materials.
.................................................................................................................................... 36
Figure 2.6. FE models of chip formation ........................................................................................ 37
Figure 2.7. Measured and predicted cutting forces in micromachining of hardened H13 steels . 40
Figure 2.8. Temperature fields of Ti6Al4V undergoing LAMM side cutting .................................. 42
Figure 2.9. Temperature predictions by the prismatic thermal model ......................................... 43
Figure 2.10. Thermal analyses in fin workpiece side cutting of 422SS .......................................... 44
Figure 2.11. Workpiece nodal temperature histories in conventional micro-milling and LAMM of
422SS .......................................................................................................................... 46
Figure 2.12. Heat transfer analysis of the tool .............................................................................. 48
Figure 2.13. Tool cutting edge temperatures in LAMM of 422SS under the condition of 422fin-2.
.................................................................................................................................... 49
Figure 2.14. Chip formation and cutting temperatures of LAMM bulk side cutting of 422SS at 60
µs cutting time under the condition of 422bulk-3 (V=18.85m/min).......................... 50
Figure 2.15. Temperatures and flow stresses in LAMM side cutting of 422SS .............................. 51

xi
Figure ......................................................................................................................................... Page
Figure 2.16. Tool geometry and tool wear mode after 33 minutes LAMM fin side cutting 422fin-2
.................................................................................................................................... 52
Figure 2.17. Tool wear for fin side cutting of 422SS and IN-718 under the conditions of 422fin-1,
2 and 718fin-1, 3 ........................................................................................................ 52
Figure 2.18. Tool wear predictions for fin side cutting of 422SS ................................................... 54
Figure 2.19. Workpiece velocity fields of Inconel 718 undergoing fin side cutting tests 718 fin 1
and 3 ........................................................................................................................... 55
Figure 2.20. Machined side surface finish by fin side cutting of Inconel 718 and 422SS .............. 56
Figure 3.1. Flow chart for CEL modeling using the dislocation density-based material model ..... 62
Figure 3.2. Dislocation density-based plasticity model predictions .............................................. 66
Figure 3.3. Shear strain rate for cutting of OFHC copper under condition: V=0.01 m/s, α=10° and
doc=0.1 mm ................................................................................................................ 67
Figure 3.4. Cumulative shear strain along path-1 for cutting of OFHC copper under condition:
V=0.01 m/s, α=10° and doc=0.1 mm .......................................................................... 68
Figure 3.5. Average shear strain and chip thickness for cutting of Al 6061 T6 under conditions
Al1-3 ........................................................................................................................... 69
Figure 3.6. Predicted microstructural evolution for cutting of OFHC Cu under conditions Cu3 . 70
Figure 3.7. Predicted grain size distribution in the chips for Al 6061 T6. ...................................... 72
Figure 3.8. Grain size in the chips for Al 6061 T6 under conditions Al1-3 with varying tool rake
angles ......................................................................................................................... 73
Figure 3.9. Grain size in the chips for OFHC Cu under conditions Cu1-4 with varying cutting
speeds ......................................................................................................................... 75
Figure 3.10. Grain misorientation angle distribution for cutting test Cu4 at a cutting speed of
1.25 m/s ...................................................................................................................... 76
Figure 4.1. Temperature-dependent physical properties of phases for AISI 1045 steel ............... 85
Figure 4.2. Constitutive model predictions vs. SHPB test results .................................................. 86
Figure 4.3. Flowchart for implementation of the material model ................................................. 89
Figure 4.4. Predictions of temperature, Mises stress and phase field for tests A7 and A8. .......... 94
Figure 4.5. Comparison of the deformed chip thickness predicted with the experimental data . 96

xii
Figure ......................................................................................................................................... Page
Figure 4.6. Prediction of volume fraction of austenite in the chip and comparison of the
predicted Tint with experimental data ........................................................................ 98
Figure 4.7. Comparison of the predicted cutting force with experimental data ........................... 99
Figure 4.8. Comparison of the predicted temperature and cutting force with the predicted
values using an extended Oxley’s predictive machining theory .............................. 101
Figure 5.1. Time-Temperature-Transformation cooling diagram for AISI 52100 steel ............... 106
Figure 5.2. Hard turning simulation via AdvantEdge FEM ........................................................... 108
Figure 5.3. Simulation results of cutting force for Tests B1-B3 ................................................... 110
Figure 5.4. Simulation results of surface microstructure for tests A1 and A2 ............................. 112
Figure 5.5. Refined surface microstructures ................................................................................ 113
Figure 5.6. Simulation results of surface microhardness for tests A1 and A2 ............................. 114
Figure 5.7. Simulation results of subsurface residual stress profile for tests A1 and A2 ............ 115
Figure 5.8. Simulation results of martensitic transformation layer thickness for tests B1-B5 .... 116
Figure 6.1. Current and proposed methods for machining a transmission shaft. ....................... 119
Figure 6.2. Sketch of the laser-assisted facing of a cylindrical workpiece with one laser ........... 120
Figure 6.3. Sketch of the laser spot and machine chamfer in laser-assisted face turning .......... 124
Figure 6.4. Sketch of partial deactivating control volumes and laser absorption at the boundary
.................................................................................................................................. 124
Figure 6.5. Heat transfer at the boundary control volumes ........................................................ 124
Figure 6.6. Program flow in the LAM thermal model .................................................................. 126
Figure 6.7. Simulation result of laser-assisted face turning. ........................................................ 126
Figure 6.8. A representative case study of laser-assisted profile turning ................................... 127
Figure 6.9. The machine chamfer in different stages .................................................................. 128
Figure 6.10. Mesh generation in laser-assisted profile turning ................................................... 129
Figure 6.11. 2D temperature simulations at the tool position in laser-assisted profile turning . 129
Figure 6.12. 3D temperature simulations in laser-assisted profile turning ................................. 130
Figure 6.13. LAM experimental setup with both the CO2 and Nd:YAG laser .............................. 131
Figure 6.14. Geometry of the hollow shaft of varying-thickness ................................................. 131
Figure 6.15. Diagram of the CO2 and Nd:YAG lasers in the machined chamfer.......................... 132

xiii
Figure ......................................................................................................................................... Page
Figure 6.16. Thermal model predictions at absorptivity of 0.78 and thermocouple measurements
during an absorptivity test for the graphite coated surface to the Nd:YAG laser ... 134
Figure 6.17. 2D temperature distributions in a hollow shaft workpiece undergoing LAM ......... 135
Figure 6.18. 3D temperature distribution in a hollow shaft workpiece undergoing LAM ........... 136
Figure 6.19. Schematic of the IR camera temperature measurement ........................................ 137
Figure 6.20. Temperature measurements and thermal model predictions in a hollow shaft
undergoing LAM ....................................................................................................... 138
Figure 6.21. Comparison of measured and predicted flow stress at elevated temperatures of
4130 steel ................................................................................................................. 139
Figure 6.22. Simulation results of workpiece microstructure ..................................................... 140
Figure 6.23. Temperature effect on specific cutting energy of hardened 4130 steel ................. 142
Figure 6.24. Temperature effects on surface finish of hardened 4130 steel .............................. 143
Figure 6.25. Effect of thermal expansion on size control ............................................................ 144
Figure 6.26. Optical microscopy of microstructures of the subsurface after LAM at speed of 180
m/min, feed of 0.075 mm/rev and various Tmr, 200X. ............................................. 145
Figure 6.27. Histograms of the hardness of the parts before and after LAM .............................. 146
Figure 6.28. Subsurface hardness after LAM at speed of 180 m/min and feed of 0.075 mm/rev
.................................................................................................................................. 146
Figure 6.29. Surface residual stress of LAM of 4130 .................................................................... 147
Figure 6.30. Subsurface residual stress of LAM of 4130 .............................................................. 149

xiv
ABSTRACT
Ding, Hongtao. Ph.D., Purdue University, May 2012. Microstructural Prediction in Metal Cutting and Improvement of Machinability and Surface Integrity via Laser-Assisted Machining. Major Professor: Yung C. Shin, School of Mechanical Engineering.
This study is concerned with the predictive modeling of surface microstructure
alterations in terms of grain refinement due to mechanical deformation and thermally driven
phase transformation during the machining process. To model grain refinement, a dislocation
density-based numerical framework is developed to simulate the chip formation, cutting
temperature and grain size during orthogonal cutting of Al 6061 T6 and OFHC Cu; to model
phase change, a truly coupled metallo-thermo-mechanical scheme is proposed to considerate
mechanical deformation, thermal history, and phase transformation kinetics in orthogonal
cutting of AISI 1045 steel under various conditions. The developed metallo-thermo-mechanical
coupled analysis is then applied to the three-dimensional (3D) hard turning process for bearing
steels to investigate the surface microstructure alteration, particularly the white layer formation
mechanisms incorporating both the thermally driven phase transformation and mechanical
grain refinement due to severe plastic deformation.
To carry on the microstructural evolution simulation and improve computational
efficiency, a coupled Eulerian-Lagrangian (CEL) model is developed to simulate steady-state chip
formation in two-dimensional (2D) orthogonal cutting by using the commercial software
Abaqus. 3D hard turning simulations are undertaken via AdvantEdge FEM software
incorporating the material user subroutine for various hard turning conditions. A novel,
arbitrary-Lagrangian–Eulerian (ALE) based finite element scheme is developed in ABAQUS to
simulate the micro-milling cycles, and a strain gradient constitutive material model is
incorporated to model the size effect in micro-milling. Through a quantitative assessment using
the experimental data, the model simulations demonstrate the essential characteristics of the
deformation field and microstructural evolution mechanism during cutting.

xv
Microstructure and surface integrity is further studied experimentally and numerically
for difficult-to-machine materials during laser-assisted machining. One-step laser-assisted
machining process is proposed for hardened AISI 4130 steel to replace the hard turning and
grinding operations. A heat transfer model is developed to predict the temperature field inside
the workpiece of complex geometry undergoing laser-assisted profile turning. Microstructure of
4130 steel workpiece is simulated using the 3D nose turning option in AdvantEdge FEM by
considering both phase transformation kinetics and grain refinement. The surface integrity
analysis is experimentally studied by changing heating and operating conditions, viz., average
material removal temperature, cutting speed and feed.

1
CHAPTER 1. INTRODUCTION
1.1. Rationale
As design requirements increase in modern machines and products, material processing
technologies advance at an escalating speed to create high performance materials with ever
stronger strength and higher abrasive, corrosive, or heat resistance. Accordingly pertinent
machining methods also have to be developed to accurately shape these new materials into
products. The use of high strength metallic materials, such as hardened steels, nickel-based
heat resistant superalloys and titanium alloys, is becoming increasingly common in aerospace,
automotive, energy, medical, and mining applications [1-5]. These advanced materials have
very favorable properties, which allow components to function under high-temperature and/or
highly stressed operating environments. However, these materials are traditionally considered
to be difficult-to-machine because they have a very strong tendency to strain hardening,
maintain their high strength even at elevated temperatures, or even worse for the case of
titanium alloys, their low thermal conductivity keeps much of the heat generated during
machining very near the tool tip, causing extreme temperatures on the tool faces [6, 7].
Conventional machining processes for these materials are notoriously affected by slow
machining speeds and/or frequent tool changes due to short tool lives.
The ever increasing demand for the use of these high performance alloys motivates
technological developments of advanced tools, including carbides with a multi-layer of ceramic
coatings, whisker-reinforced ceramics, and PCBN (poly-cubic-boron-nitride) tools, and
innovations of machining processes like laser-assisted machining (LAM). Ceramics and PCBN
tools have increased the rate of productivity for difficult to machine alloys, but their use is still
constrained by rapid tool wear or chipping, which results in short tool lives. LAM is the process
of locally preheating a workpiece with a focused laser beam ahead of the material cutting
location. By lowering the material strength in the cutting area at a certain elevated
temperature, LAM can achieve lower cutting force, slower tool wear progression rate, higher

2
material removal rate and better surface quality [5-18]. Nowadays, LAM has been widely
accepted as a promising alternative machining process for difficult-to-machine materials as the
developments in laser technology provide economic, high power, easily transportable lasers like
fiber lasers, diode lasers and Nd:YAG lasers [1, 19]. These improvements coupled with the
multi-functionality of lasers in various manufacturing processes promise large potential benefits
that may be received from LAM of difficult-to-machine metal alloys.
The concept of LAM has been expanded to micro scale cutting of difficult-to-machine
materials. As miniaturization of products grows in complexity and shrinks requisite feature size
in many applications, the need to manufacture parts with complex features as small as a few
microns to a high precision has expanded from conventional soft materials like aluminum and
copper to much stronger engineering alloys. The size effect such that specific cutting energy at
the micro-scale is much higher than at the macro-scale makes micromachining of difficult-to-
machine materials even more difficult [20, 21]. The high specific cutting force cannot be
sustained by micro-sized tools, which usually results in a catastrophic failure of the tool and a
poor finished surface. Softening the workpiece material using a controlled laser beam focused
ahead of the cutting position reduces cutting forces and has the potential for extending the
practical application domains of the mechanical micromachining process. Sharing the similar
idea to LAM, laser-assisted micromachining (LAMM), due to its great process flexibility, is a
promising technology, offering the desired capability of producing complex, 3D, and high aspect
ratio micro features in steels, titanium alloys, and nickel-based superalloys [22, 23].
The challenge lies in optimizing the laser-assisted micro and macro machining processes
so that the temperature required for the large decrease in workpiece strength does not shorten
the life of the cutting tool or adversely affect the finished surface quality and part dimensions.
The LAM process must show a significant improvement in tool life, while good machined surface
integrity has to be maintained to ensure the requisite functionality of the component. LAM will
only become economically viable and justifiable for industrial use if it can be proved versatile in
different application domains. A high material removal rate and a long tool life are the main
purposes of LAM to achieve low cost roughing operations, while good machined surface
integrity and tight dimensional tolerance are the major considerations in applying LAM to
finishing operations. The limited adoption of LAM as the final finishing process is basically due
to: (1) the lack of the appreciation of its total benefits compared with traditional finish grinding

3
processes, and (2) the lack of knowledge of the effect of the LAM process on the performance of
the finished components. Performance of the components is dictated by the texture and
integrity of the machined surface. Machined surface integrity problems, such as poor surface
finish, material side flow, high tensile stress, grain enlargement, subsurface defects like
microcracks, a heat affected area with phase change, a softened machined surface layer and the
hardened surface white layer of extreme hardness and brittleness, are all concerns in the final
or semi-final finishing processes. To determine the true feasibility of LAM it is important to
investigate resultant surface roughness, surface hardness, residual stress and microstructures.
Although many LAM studies have experimentally shown improved surface finish, reduced
subsurface defects, a hardness profile similar to that of conventional machining and no
existence of heat affected zone given a properly design of laser heating, the possible change of
grain microstructure and phase composition, in particular, has not been investigated, although it
is one of the main concerns industry has in applying LAM to finishing processes.
Grain sizes in the chip and on the machined surface tend to become smaller due to the
severe plastic deformation (SPD) occurring in a cutting process. As a matter of fact, machining,
particularly plane-strain orthogonal cutting as a means of SPD processing, has recently been
exploited to refine the microstructure from tens of micrometers or greater to a few hundred
nanometers. Compared to other SPD processes such as equal channel angular processing
(ECAP), high pressure torsion (HPT) and cold rolling, machining only needs one pass to create
large enough strain required for the creation of sub-micron grain sizes in the chip and can be
performed at near-ambient temperature for high strength alloys [24]. It has been shown that
machining is a flexible and controllable method for producing ultra-fine grained (UFG)
microstructures for various metals and alloys, such as copper [25-27], aluminum alloys [27, 28],
titanium [29, 30], nickel-based superalloys [30] and steels [27, 30]. Experimentally, many
studies have shown a relationship between grain size and strain level in cutting [27-35] for a
range of cutting conditions; however, there is no physics-based model, analytical or empirical,
available in literature to quantitatively predict the change of grain sizes during machining to the
author’s best knowledge. It remains a tough technical challenge to predict the grain size change
in the workpiece undergoing a high strain rate deformation with a complex temperature
contour due to laser heating in a LAM process. A predictive model based on the grain
refinement mechanism in machining is critically needed to better design and optimize the

4
process parameters, such as the cutting speed, temperature, depth of cut and tool geometry,
etc., for producing the desirable microstructures by LAM. Metallurgical transformation occurs in
the chip or on the workpiece machined surface due to intense, localized and rapid thermal-
mechanical working during machining. This is especially evident in high-speed machining,
thermally enhanced machining, grinding and hard turning with severe tool wear [36-39]. To
improve the machining process and understand the resultant microstructure, it is necessary to
develop a physics-based machining model to predict the microstructure alterations in terms of
both phase change and grain size.
1.2. Laser-Assisted Machining
1.2.1. Laser-Assisted Machining of Difficult-to-Machine Metal Alloys
LAM implements the concepts of thermally-assisted machining using a laser as the
heating source. During LAM, the workpiece material is locally heated and softened by a focused
laser beam and then removed by a conventional cutting tool. Recently, LAM has been
considered as an alternative process for machining of high strength materials like ceramics [9-
15, 40, 41], metal matrix composites [18], high temperature alloys [6, 9], hardened steels [8, 42-
45] and compacted graphite iron [5]. Extensive experimental investigations conducted so far
have shown the feasibility of LAM and its advantages over conventional machining methods in
terms of surface finish, tool wear, specific cutting energy, and subsurface integrity. Moreover,
machining is carried out dry without needing a coolant, which reduces the cost associated with
the purchase and the treatment of lubricants and makes the process more environmental
friendly. LAM can also increase the number of operations possible with the same machine. For
example, a laser equipped lathe is able to carry out laser deburring and thermal surface
treatments.
For LAM of hardened steel, Gratias et al. [42] characterized the laser power-cutting
speed relations in machining of hardened AISI 1042 steel and found the cutting forces could be
reduced by 70%. Germain et al. [43, 44] reported the surface finish and residual stress produced
by LAM of hardened AISI 52100 steel, wherein the surface roughness Ra ranged from 0.6 to 0.75
µm with a small feed rate of 0.1 mm/rev, the residual stress became more tensile and the stress
penetration depth became shallower when compared to conventional cutting. Dumitrescu et al.

5
[45] showed that LAM suppressed machining chatter and saw tooth chip formation and
improved tool life by as much as 100% for AISI D2 tool steel.
Anderson et al. [6] experimentally evaluated the machinability of Inconel 718 under
varying conditions by examining tool wear, cutting forces and surface finish. With the increasing
material removal temperature from room temperature to around 540 °C, the benefit of LAM
was demonstrated by a 25% decrease in specific cutting force, a 2–3-fold improvement in
surface roughness and a 200–300% increase in ceramic tool life over conventional machining.
Moreover, an economic analysis showed significant benefits of LAM of Inconel 718 over
conventional machining with carbide and ceramic inserts. Attia et al. [46] conducted the high-
speed (highest about 500 m/min) finish turning experiments of Inconel 718 with SiAlON ceramic.
Compared to conventional machining, the surface finish and the material removal rate were
improved by over 25% and 800%, respectively, due to a significant drop in the cutting forces.
Surface integrity remained intact with the absence of phase change or microdefects. The
chemical compositions were quite consistent before and after both conventional and LAM.
However, their experiments did not maintain a constant material removal temperature in the
cutting zone for varying cutting speeds.
Dandekar et al. [7] investigated the tool life during LAM of titanium alloys with various
material removal temperatures. The optimum material removal temperature during LAM of
Ti6Al4V alloy was found to be 250 °C at which the balance between the heat generated due to
plastic deformation and the heat produced by laser energy input was achieved and the cobalt-
diffusion controlled crater wear was minimized. Under this material removal temperature, tool
life was improved 1.7 times by LAM for cutting speeds below 107 m/min compared with
conventional machining. Yang et al. [47] developed a 3D finite element model using ANSYS to
predict the heat affected zone during laser assisted machining of Ti6Al4V. A good correlation
was achieved between the prediction and experimental observations of heat affected zone.
However, the peak temperature in the laser spot was overestimated to be about 600°C above
the melting pint, which inevitably casts some doubts in their temperature predictions.
The majority of published research shown above has focused on the improvement of
feasibility and machinability of difficult –to-machine materials with LAM wherein higher material
removal rates and longer tool life are usually pursued in optimizing the LAM parameters. Few
studies have systemically investigated the best LAM parameter combination to achieve superior

6
surface integrity of components. Surface integrity after a finishing process is a central attribute
to the performance and behavior of various manufactured parts. In finish turning, surface
quality and integrity are often of great concern because of their impact on product performance
[48, 49]. LAM will only become economically viable and justifiable for industrial use if it can be
proved versatile in achieving higher material removal rate, longer tool life and/or superior
surface integrity in machining of different difficult-to-machine materials.
1.2.2. Laser-Assisted Micromachining of Difficult-to-Machine Metal Alloys
Micromachining, micro-milling in particular, due to its great process flexibility, is a
promising technology for the manufacture of durable, high temperature and wear resistant
micro-dies and micro-molds made of hardened tool steels with relative high accuracy. However,
micro-milling of difficult-to-machine metal alloys still remains a great technological challenge in
industry due to the unpredictable tool life of micro endmills, machined surface integrity and part
dimension accuracy. The needs for micromachining have expanded from conventional soft
materials like aluminum and copper to much stronger engineering materials such as high-
temperature superalloys [22], hardened tool steels [20, 50, 51], stainless steels [22, 23],
titanium alloys [22] and ceramics [52].
The size effect contributes to the fundamental difference in the process mechanism
between micromachining and conventional macro-machining, and the analytical and numerical
solutions available for macro-machining cannot be assumed to be valid for micromachining
operations particularly for the small undeformed chip thickness. In micromachining, the cutting
edge radius (re) of the micro tools is comparable to the undeformed chip thickness (h) and in
some occasions less than the size of the workpiece material grain size. The substantial
reduction in the ratio (λ) of undeformed chip thickness to cutting edge radius has a profound
influence on the specific cutting force, chip formation and surface integrity in micromachining.
Figure 1.1 illustrates the change of material removal mechanism in micromachining for a
constant chip load but with varying tool cutting edge radii. Cutting is the dominant mechanism
for a fresh tool with h greater than re, but ploughing with workpiece material elastic recovery
plays a more important role as re increases to a size close to h. Ploughing eventually becomes
dominant as re increases to be much greater than h and no chip forms beyond this condition.
More specific cutting energy will be spent in the material plastic deformation due to ploughing

7
than shearing in cutting. The size effect in micromachining has been extensively studied
theoretically and experimentally, but the focus has been mainly on soft materials like aluminum
alloys [53], copper [54] and mild carbon steels [55]. Only a handful of studies have investigated
the size effect in micromachining of difficult-to-machine materials. Aramcharoen and
Mativenga [20] experimentally explored the size effect on the specific cutting force, surface
finish and burr formation in micro slotting of hardened H13 tool steel with a hardness of 45 HRC
using a 900 µm diameter tungsten carbide endmill. Their study has shown that the specific
cutting force of hardened H13 steel increased drastically to around 100 GPa as the ratio λ
decreases to 0.2. Shelton and Shin [23] conducted laser-assisted micro slotting experiments of
difficult-to-machine materials such as titanium alloy Ti6Al4V, AISI 316 and 422 stainless steels
with 100 µm diameter tungsten carbide endmills and numerically modeled the size effect on
specific cutting force under orthogonal cutting conditions.
(a) h > re (b) h ≈ re (c) h < re Figure 1.1. Chip formation relative to chip load and cutting edge radius.
Many theoretical and experimental attempts have been made to analyze surface
integrity in micromachining. Liu et al. [55-57] studied the surface roughness achieved in
micromachining of aluminum alloy 6082-T6 and carbon steel 1041 and their study showed that
the resultant surface roughness was a product of the tradeoff between the effect of minimum
chip thickness and the traditional effect of feed rate. For cutting ratio λ greater than 1, the
surface roughness increased with increasing feed per tooth, while for cutting ratio λ less than 1,
roughness increased with decreasing feed due to the material elastic recovery. A similar
phenomenon was observed for micro slotting of harden H13 steel [20]. The most frequently
observed surface defects on the machined surface by micromachining were dimples, prows,
microvoids, and microcracks [58]. For carbon steel with a dual phase structure of pearlite and

8
ferrite, dimples were found on the machined surface at the pearlite-ferrite grain boundary,
which indicated a great effect of the inhomogeneous microstructure on machined surface
integrity undergoing severe plastic deformation. Their study showed that prows resulted from
the broken-down built-up edge (BUE) from the tool tip. Prows were hardened workpiece
materials that had undergone severe plastic deformation under the tool nose with a hardness
value 2 to 3 times greater than that of the original workpiece [58]. Burr formation is another
critical issue in micromachining processes since it affects the functionality of the
microcomponent and damages the part dimension and geometric tolerance. The mechanism of
burr formation in micromachining has been reported to be dominated by the interaction
between cutting edge radius and feed per tooth, while cutting speed, undeformed chip
thickness, tool edge radius, feed rate, and workpiece materials all contributed to burr formation
in micromachining [59].
Micro-tools such as micro endmills and drills are generally made from tungsten carbide
(WC) with cobalt as the binder. Progression of tool wear in micromachining is dominated by the
friction between the tool and the workpiece. For a small depth of cut in micromachining, a tool
with a greater edge radius with respect to undeformed chip thickness increases the tool-work
friction and wears at a faster rate [21]. Filiz et al. [60] investigated the wear progression of 254
µm diameter WC endmills in cutting of copper at cutting speeds ranging from 40 to 120 m/min
and feed ranging from 0.75 to 6 µm per tooth. Their study showed that WC tools wore at a 5-
time faster rate when the ratio λ reduced from about 3 to 0.4 for all the cutting speeds
investigated.
To improve the tool performance in micromachining of difficult-to-machine materials,
recently, laser-assisted micromachining (LAMM) has been implemented on high-temperature
superalloys [22, 23], hardened tool steels [61-64], stainless steels [22, 23] and titanium alloys
[22, 23]. Shelton and Shin [23] conducted the laser-assisted micro slotting tests of Ti6Al4V,
stainless steels AISI 422 and AISI 316 with tungsten carbide micro end mills. The improvement
of surface roughness on the machined surface of AISI 422 and AISI 316 was found to be up to
37%. Their study showed that LAMM resulted in less built-up edge (BUE) than conventional
micromachining and significantly reduced the edge burrs for AISI 422. Shelton and Shin [22]
conducted laser-assisted micro side cutting tests of AISI 316, AISI 422, Ti6Al4V, and Inconel 718
in a fin structure with tungsten carbide tools. The fin structure was found to be more suitable

9
for LAMM in a side-cutting configuration than the bulk workpiece due to the ease of the laser
heating arrangement and practical applicability. Their study showed that burrs of Ti6Al4V and
Inconel 718 were drastically reduced with the laser-assist. The tool life for AISI 422 was
increased by almost 6 folds in LAMM than that of conventional micro milling. Joen and
Prefferkorn [65] conducted laser-assisted micro milling tests of aluminum 6061T6 and 1018
steel with tungsten carbide end mills. Their study showed that the laser-assist micro milling
increased chip loads by about 30-45% and reduced cutting forces. However, laser preheating
was found to increase burr formation. Melkote et al. [51] conducted an experimental study of
the laser-assisted micro-milling process for a hardened A2 tool steel with the hardness of 62
HRC using a TiAlN-coated tungsten carbide 4-flute ball endmills. A low tool wear rate was
obtained in their LAMM tests and the surface roughness was consistently lower in LAMM than
conventional micro-milling. Increasing cutting speed resulted in increasing the surface
roughness with laser heating while improving the groove depth accuracy. However, there was
not a clear trend without the laser-assist. Singh et al. [61] modeled the size of the heat affected
zone (HAZ) using a transient 3D finite element thermal model with ANSYS and their study
showed that there would be no residual HAZ in the workpiece after micro cutting with the well-
designed laser and cutting parameters. Singh and Melkote [64] developed an analytical model
to predict cutting forces and presented the effects of depth of cut, laser power, and cutting
speed.
1.3. Thermal and Mechanical Modeling of Laser-Assisted Machining
1.3.1. Thermal Modeling of Laser-Assisted Machining
Laser-assisted machining implements the concepts of thermally-assisted machining
using a laser as the heating source. During LAM, the workpiece material is locally heated and
softened by a focused laser beam and then removed by a conventional cutting tool.
Determination of the temperature field in a workpiece undergoing LAM is critical, since the
benefits of LAM can be achieved and optimized only when the workpiece is heated properly.
Transient, 3D, finite volume thermal models have been developed for laser-assisted turning
(longitudinal) and milling processes by the Laser-Assisted Materials Processing Lab at Purdue
University [9, 12, 14]. The Graphic User Interfaces (GUI’s) developed for these thermal models
run as standard Windows application software. Once the parameters of operating condition,

10
workpiece material and boundary condition are defined, then the model simulates a 3D
transient temperature field in the workpiece during LAM.
Almost all industrial products have some curved surfaces to be machined. Profile
turning operations are more commonly performed on ever stronger and tougher materials to
attain certain functional features like high wear and hear resistance and longer fatigue life. A
finishing operation is usually the last machining step to generate the component’s final surface,
shape and dimensions, which are crucial to ensuring those functionalities. Traditional finishing
operations are grinding processes, which usually involve a costly set up, yield low material
removal rates and have a lack of a flexibility [4]. Laser-assisted profile turning provides a
potential economical alternative to finish grinding processes for these difficult-to-machine
components with the benefits of lower set up cost, high flexibility, higher material removal
rates, and no need of the environmentally hazardous coolant.
For machining a part with more complex geometric features like profile finishing of a
crank shaft, the LAM thermal model needs to be further expanded to face turning and profiling.
Transient, three-dimensional cylindrical thermal models have been developed for laser-assisted
face and profile turning processes. In these models, the laser heat absorption is modeled as a
Lagrangian-type heat source in synchronized with the moving tool motion, the heat transfer
governing equations are discretized over the rotating cylindrical workpiece domain, and
workpiece material removal is modeled by partially or completely deactivating control volumes
along the complex predefined tool path [14].
1.3.2. Mechanical Modeling of Machining
A tremendous amount of research has been done in modeling machining processes
analytically or numerically. Compared to analytical or empirical models, the development of
computers in recent years has allowed researcher to study machining processes through
sophisticated numerical techniques. Among them, the finite element (FE) analysis is the most
used and effective numerical method. FE analyses have been conducted in different aspects of
machining processes such as predictions of cutting force, cutting temperature, chip formation,
tool wear, white layer, residual stress, hardness, microstructure, etc.
Continuous or serrated chip formations of hardened steels, heat-resistant alloys and
titanium alloys depend on cutting conditions and can be modeled using FE models with material

11
constitutive models. Miguelez et al. [66, 67] and Nasr et al. [68, 69] proposed Coupled Eulerian-
Lagrangian (CEL) FE models to simulate the continuous chip formation and residual stresses of
stainless steels and tool steels in steady-state cutting using commercial software
ABAQUS/EXPLICIT. Umbrello and Filice [70] developed a 2D FE model for serrated chip
formation in the hard turning of AISI 52100 in terms of white and dark layer formation by
Deform-2D, which was validated by experimental observation. Lorentzon et al. [71] simulated
the serrated chip formation of Inconel 718 with the Cockroft-Latham fracture criterion using
MSC. Marc. Calamaz et al. [72] and Sima and Ozel [73]developed 2D FE models to simulate the
serrated chip formation of Ti6Al4V with thermal softening material constitutive models using FE
software Forge and Deform-2D, respectively. Umbrello [74] developed a 2D FE model by
Deform-2D to simulate the serrated chip formation of Ti6Al4V with a thermal softening material
constitutive model and the Cockroft-Latham fracture criterion.
Tool wear during cutting can be predicted with FE models. Dandekar et al. [7] and Rao
et al. [75] predicted the tool wear of uncoated carbide in turning of Ti6Al4V based on Hua and
Shivpuri’s crater wear rate model [76] with a 3D FE model by AdvantEdge. Lorentzon and
Jarvstrat [77] predicted the tool wear of cemented carbide tool in turning of Inconel 718 with a
2D FE model by Deform-2D with Usui’s model [78].
Kapoor and Devor’s group from the University of Illinois at Urbana–Champaign
published several papers on microstructure-based modeling of micromachining of two major
materials, i.e., a ductile iron [79-86] and a carbon nanotube reinforced polymeric composite
material [87, 88]. The selection of the ductile iron is due to two reasons: (i) it is a soft material
and has a relatively good machinability under the micromachining condition; (ii) it has significant
heterogeneous microstructures with harder pearlite particles enclosed by softer ferrite matrix.
They have shown that microstructure-based finite element modeling of micromachining of the
ductile iron with the built-in Baumann-Chiesa-Johnson (BCJ) model was able to better predict
the cutting force than the prediction based on the homogeneous material model and was also
able to predict the material damage in the cutting zone. Although chip segregation was
simulated by the built-in material constitutive models of constituents in their work, a very rough
machined surface was simulated, which looked quite different from the actual chip morphology.
Remeshing the workpiece after each step might be needed to better predict the chip
segregation and smooth the machined surface profile.

12
A number of finite element (FE) models have been proposed to simulate the chip
formation in micromachining by simplifying the 3D milling processes to 2D orthogonal cutting
processes, but few of them modeled the actual chip formation with varying undeformed chip
thickness in the milling cycle. Özel et al. [89] developed a 2D FE model for micro slotting of
aluminum alloy 2024-T6 and AISI 4340 steel to simulate the chip formation and cutting force
within a complete slot cutting cycle of one flute using commercial software DEFORM-2D.
Although a complete chip formation was simulated with the DEFORM platform, the predicted
cutting force was not validated with the cutting force data measured from their micro slotting
tests. To model the size effect in micromachining at a micro length scale, Liu and Melkote [53,
90] and Lai et al. [54] applied material strain gradient plasticity models to simulate orthogonal
cutting of aluminum alloy 5083-H116 and copper, respectively. Liu and Melkote [90] showed
that the strain gradient plasticity model was able to simulate the drastic increase of specific
cutting force as λ decreased from 4 to 0.6 in micromachining and their simulated specific cutting
force matched well with the experimental data. With the strain gradient plasticity model
developed for copper at the micro level, Lai et al. [54] predicted a great increase of specific
cutting force to around 45 GPa as the ratio λ decreased to about 0.2 in micro-milling by using an
analytical slip line model. As discussed above on the 2D FE modeling work, the current FE
modeling techniques still have shortcomings in correctly and efficiently modeling the chip
formation with varying chip thickness and the significant size effect in micro-milling processes.
In Chapter 2, thermal and mechanical modeling analyses are presented to investigate
the performance of LAMM of difficult-to-machine materials in side cutting configurations of
both bulk and fin workpieces. The transient, 3D finite volume prismatic thermal model
developed by Tian et al. [91] is used to analyze the material temperature increase in the
machined chamfer due to laser heating for the two LAMM configurations. The 2D finite element
models developed by Ding et al. [92] are adapted to simulate the continuous chip formation
with varying chip thickness in LAMM side cutting with the strain gradient material constitutive
models. Cutting temperatures and workpiece flow stresses are characterized in the cutting zone.
Steady-state tool and workpiece temperatures after multiple LAMM cycles are predicted with
heat transfer models. Tool wear progression, BUE formation and surface integrity are studied
with the FE models.

13
1.4. Microstructure Alteration in Metal Cutting
During machining processes, materials often behave in a complicated manner involving
severe plastic deformation, phase change, grain size change, fracture, etc. Microstructure
alterations occur in the chip or on the workpiece machined surface due to intense, localized and
rapid thermal mechanical working during machining.
1.4.1. Grain Refinement in Cutting
There has been a lot of research interest in the manufacture of ultra-fine grained (UFG)
metals for their enhanced strength and hardness by employing SPD processing techniques.
Machining, particularly plane-strain orthogonal cutting as a means of SPD processing, has
recently been exploited to refine the microstructure from tens of micrometers or greater to a
few hundred nanometers. During the chip formation, the achieved large-strain deformation
under plane-strain condition is to some extent similar to that in the widely applied SPD
technique of equal channel angular processing (ECAP). But unlike ECAP, machining only needs a
single pass to create large enough strains required for the creation of sub-micron grain sizes in
the chips and can be performed at near-ambient temperature for high strength alloys. The level
of plastic strain imposed during cutting can be controlled by an appropriate choice of the rake
angle of the cutting tool. The material processing rate and the strain rate of the plastic
deformation can also be easily controlled by regulating the cutting speed and/or depth of cut.
Hence as a flexible and controllable SPD method for producing UFG microstructures, plane-
strain orthogonal cutting has been experimentally studied for various polycrystalline metallic
materials, such as aluminum alloys [32], copper [25, 27, 34], nickel-based superalloys [27], steels
[27] and titanium [29]. In these experimental studies, the microstructural evolution, namely
grain size changes, textures and misorientations in the machined chips, are usually measured by
using transmission electron microscope (TEM), x-ray diffraction (XRD) or electron backscattering
diffraction (EBSD) techniques. Hardness of the resultant chips is measured by micro- or nano-
indentation hardness tests in comparison with that of the bulk material before cutting. High-
speed images of the deformation field can be acquired by using a high speed camera system and
the strain rate field and the accumulative strain can then be derived by using the particle image
velocimetry (PIV) technique. The large-strain in the chip formation by machining has been
generally used as a qualitative measure to the grain size change in the experimental results. For

14
instance, Swaminathan et al. [27] undertook orthogonal cutting experiments of oxygen-free high
thermal conductivity (OFHC) copper with cutting tools of varying rake angles and showed that
the grain size in the chip decreased as the shear strain increased: average grain size was above 1
µm for a shear strain of 3, about 400 nm for a shear strain of 8, and about 200 nm for a shear
strain above 13. To keep the cutting temperature low and suppress grain dynamic recovery, low
cutting speeds, for example, 0.01 or 0.05 m/s, were usually applied for copper and aluminum
alloys in these tests. It is noted that the aforementioned experimental conclusions, or any other
experimental observations of strain-grain size relationship in those resultant UFG
microstructures reported in [25, 27, 29, 32, 34], cannot be simply extended to a different
process condition or a different material, because each cutting condition for each material is
unique and all the process parameters affect the resultant microstructures.
To effectively design the machining process parameters, such as the tool rake angle,
cutting speed and temperature, for materials with varying thermo-mechanical properties and
improve the quality of the resultant microstructures, it is necessary to investigate the
microstructure refinement mechanism during machining and is desirable to have an analytical
model for predicting the microstructural evolution in terms of both grain size and
misorientation. While the aforementioned experimental work has produced a significant body
of knowledge with regard to microstructure and properties of machined materials, there is no
quantitative grain refinement model available in literature for plane-strain orthogonal cutting of
metals to the authors’ best knowledge.
Many theoretical attempts have been made to analyze grain refinement in a regular SPD
process such as ECAP. Petryk et al. [93] proposed a quantitative relationship between strain
hardening and equiaxed grain size and modeled the grain size change for an ECAP process and a
multi-axis compression test. Beygelzimer [94] proposed kinetic equations of grain refinement
and pore generation by using a self-similarity hypothesis for the grain refining mechanism, and
mathematically modeled the grain refinement during a general deformation process. These
aforementioned models assumed that grain size depended only on strain, not on other involved
process parameters like strain rate or temperature, and hence were not suitable for modeling a
complex thermo-mechanical dynamic process such as machining.
Numerous dislocation density-based approaches have been applied for constitutive
modeling of metals to couple the material dynamic response with the microstructural evolution

15
during complex dynamic deformation processes. Arsenlis and Parks [95, 96] proposed a
continuum constitutive model based on internal variables characterizing crystallographic
dislocation density, which evolves based on fundamental concepts in dislocation mechanics such
as the conservation of Burgers vector in multiplication and annihilation processes. Their model
was implemented to investigate the tensile behavior of single crystal aluminum, which not only
captured the mechanical stress-strain response well, but also showed that the development of
underlying dislocation structure is responsible for the plastic behavior. Ma and Roters [97]
proposed a dislocation density-based constitutive model for the face-centered cubic (FCC)
crystal structure, which considers the mechanical interaction between mobile dislocations and
grain boundaries. The dislocation density-based constitutive model was implemented into a
crystal-plasticity finite element (FE) framework to model hot compression tests of aluminum
single crystals [97]. In a follow up study, they further expanded the dislocation density-based
constitutive model to the body-centered cubic (BCC) crystal structure using dislocation density
variables as internal state variables and numerically simulated plane strain compression of a
pure niobium bicrystal [98]. Their proposed model showed that a combination of the strain
gradient and grain boundary effect was able to reproduce the experimental findings; however,
so far their modeling approach has been limited to studying polycrystal micro-mechanics at
small spatial scales.
Recently, several dislocation density-based material models have been proposed to
model the physics of grain refinement during SPD processes involving multi-process variables.
Mohamed [99] modeled the obtainable minimum grain size during a ball milling process of
various metals by balancing the hardening rate arising from the dislocation generation and the
recovery rate caused by dislocation annihilation. The proposed model was useful in assessing
the achievable minimum grain size under different process conditions, but was not suitable for
modeling the significant variance of grain sizes or microstructure textures for a monotonic
deformation such as machining. Starink et al. [100] predicted grain refinement during SPD using
the volume averaged number of dislocations generated and proposed a strain hardening
function considering the effect of minor obstacle particles. Their proposed model dealt with
grain refinement during a SPD process with a strain greater than 3, but with no strain rate
dependence and a limited range of process temperature; hence, the model was not suitable for
modeling grain refinement in machining with a wide range of cutting speeds and high

16
temperature gradients. Estrin et al. [101] and Tóth et al. [102] presented a set of differential
equations to evaluate the dislocation density evolution rates and applied the dislocation
density-based material plasticity model to grain refinement in the ECAP processes of various
materials such as copper [103], aluminum [104] and IF (interstitial-free) steel [105, 106]. The
nucleation of dislocations due to deformation, annihilation of dislocations due to dynamic
recovery, and interaction of dislocations between the dislocation cell interiors and cell walls
were evaluated based on the deformation process state variables. Their proposed dislocation
density-based material plasticity model was compatible with the material constitutive models
developed under varying conditions of strains, strain rates and temperatures and can be
adapted to model other deformation processes with high strain rates or high temperature
gradients such as a Taylor impact test [107] or a machining process. For example, recently their
model has been adapted by Hosseini and Kazeminezhad with slight modifications on the cell size
coefficient [108] and the work softening mechanism [109], and implemented in a FE model for
predicting the flow stress evolution of copper undergoing SPD processes of repetitive
corrugation and straightening (RCS) and constrained groove pressing (CGP). The hardness
enhancement predicted by the model showed a good agreement with experimental
measurements. Hence, the dislocation density-based material plasticity model presented in
[101, 102] was selected for modeling grain refinement, evolution of the dislocation cell structure
and chip formation of by machining.
Indeed, a dislocation cell structure with high dislocation density is commonly observed
in metal workpieces treated by a variety of SPD processes. Figure 1.2 shows the transmission
electron microscope (TEM) images of commercially pure titanium (CP Ti) workpieces produced
by (a-b) orthogonal cutting [29], (c-d) multi-pass cold rolling [110], (e) ten-pass ECAP plus cold
rolling with 77% thickness reduction [111], (f) two-pass ECAP [112], (g) multi-pass hydrostatic
extrusion [113] and (h) surface mechanical attrition treatment (SMAT) processes [114]. Figure
1.2 (a) shows a TEM micrograph of a chip machined with the +20° rake angle tool, of which
microstructure consists of sub-100 nm dislocation cells/grains interspersed with elongated, less
developed subgrain structures. Figure 1.2 (b) shows a nanocrystalline microstructure resulting
from deformation of CP Ti to an effective strain of 3.5 using a -20° rake angle tool. Most of the
subgrain structures are well delineated in Figure 1.2 (b) corresponding to a material that has
undergone considerable microstructure refinement, due to the larger values of shear strain.

17
TEM observations in Figure 1.2 (c) showed that cold rolling with a strain of 0.92 gave rise to a
cellular microstructure with a high dislocation density but rather wide and loose cell boundaries.
Cold rolling with a strain of 2.66 leads to a considerable refinement of the microstructure and
simultaneously to an increase in dislocation density, as can be seen in Figure 1.2 (d). The cellular
microstructure of CP Ti is refined from an inhomogeneous structure of cells/grans ranging from
a hundred nanometers to a few micrometers achieved at a strain of 0.92 to an equiaxed
structure of cells/grains of approximately 200 nm achieved at a strain of 2.66. The formation of
a similar lamellar structure of high dislocation density and a cell/grain size of sub-200 nm is also
observed in CP Ti workpieces processed at an equivalent plastic strain of over 3 by ECAP,
hydrostatic extrusion and SMAT as can be seen in Figure 1.2 (e-h). The microstructural
evolutions of CP Ti produced by SPD processes have all shown a similar pattern: at the early
stage of deformation, a very high dislocation density is introduced, which leads to the formation
of lamellar structure consisting of dislocation cells with thick cell walls and low angles of
misorientation [115]. Deformation twinning plays a role for the refinement of CP Ti workpiece
at the early stage deformation; however, twinning is found to saturate at an equivalent strain of
about 0.1-0.2 for CP Ti [110, 112, 116]. Indeed, no twinning boundaries can be observed in the
microstructures of CP Ti workpieces at a high strain produced by various SPD processes, i.e.,
orthogonal cutting [29], multi-pass cold rolling [110, 117], multi-pass ECAP plus cold rolling [24,
111, 118], multi-pass ECAP [111, 112], multi-pass hydrostatic extrusion [113] and SMAT [114,
116]. As the strain increases, the thickness of the cell walls decreases and the original grains
break down and become subdivided into smaller sub-grains. The dislocation cell walls evolve
into grain boundaries (GBs), and ultimately an array of ultrafine grains with high-angle non-
equilibrium GBs are formed, as can be seen in Figure 1.2 (a-h).

18
Figure 1.2. TEM images of grain refinement of CP Ti produced by (a-b) orthogonal cutting [29], (c-d) multi-pass cold rolling [110], (e) ECAP plus cold rolling [111], (f) ECAP [112], (g) hydrostatic
extrusion [113] and (h) SMAT [114].

19
In Chapter 3, the suitability of this dislocation density-based model is investigated for
predicting the microstructure evolution at large strain, high strain rate and high temperature
gradients and a finite element based numerical framework is developed to model both chip
formation and grain refinement in machining. A CEL finite element model embedded with the
dislocation density subroutine is developed to model the severe plastic deformation and grain
refinement and grain misorientation during a steady-state cutting process. Multiple orthogonal
cutting tests of aluminum alloy 6061 T6 and OFHC Cu, both of which are of great technology
and commerce importance, are modeled at various cutting conditions: cutting speed ranges
from 0.01 to 1.25 m/s, rake angel ranges from -20° to 20°, and depth of cut ranges from 0.1 to
0.3 mm. The dislocation density-based material models, consisting of both grain size and
misorientation angle, are calibrated to replicate the observed material constitutive mechanical
behaviors under various strains, strain rates and temperatures in the cutting processes. The
chip formation and the evolution of microstructure in terms of both grain size and grain
misorientation during cutting are simulated with the CEL finite element model embedded with
the dislocation density subroutines developed for both materials. Modeling results are
presented in chip formation, strains, strain rates, temperatures, grain sizes and dislocation
densities in comparison with the actual measurements during orthogonal cutting. The effects of
important cutting process parameters like cutting speed, tool rake angle and temperature on
grain refinement and misorientation angles are discussed to great details.
1.4.2. Phase Change in Steel Cutting
As the heat generated in the cutting process raises the workpiece material temperature
above its critical phase transformation temperature, a metallurgical transformation will occur,
and the attendant latent heat and volume change due to the transformation will affect the
machining process. Mechanical deformation, heat transfer, and microstructure are all strongly
coupled together, each affecting the others, and these effects has been termed metallo-thermo-
mechanical coupling [119-121], which is schematically illustrated in Figure 1.3. Temperature
fields affect the stress state through thermal softening and thermal strains caused by
temperature gradients, which also affect microstructural changes according to phase
transformation kinetics. Mechanical work caused by plastic deformation or friction generates a
lot of heat and alters the temperature field. Large strains can also assist in phase

20
transformations, called strain-induced transformation. Phase changes, in turn, affect the stress
state by causing dilatation strain. The thermo-mechanical properties of the phase constituents
change radically as the transformation occurs, which will drastically change the material
behavior during cutting. The latent heat from solid phase transformations can also alter the
temperature field. And finally, chemical concentrations, such as carbon content in carbon
steels, will have an effect on all three fields. Such extensive interaction/coupling between the
plastic deformation, heat transfer, and microstructure evolution creates difficulties in numerical
modeling of machining of steels and has rarely been considered. Essentially, all of these deeply
coupled phenomena ought to be solved simultaneously to correctly understand the effects of
phase transformation on cutting performance and surface integrity of steel parts. Hence it is
critically needed to develop a predictive model based on the metallo-thermo-mechanical
coupled mechanisms.
Figure 1.3. Metallo-thermo-mechanical coupling in cutting of steels (adapted from [119]).
Phase change in cutting can be explained in details by orthogonal cutting of American
Iron and Steel Institute (AISI) 1045 steel. The workpiece material AISI 1045 steel has significant
relevance in the automotive and heavy equipment industries, and is widely used in

21
manufacturing processes that involve high-speed machining operations. AISI 1045 steel is hypo-
eutectoid steel consisting of pearlite (P) and proeutectoid ferrite (α). As depicted in Figure 1.4,
when the material is locally heated to a temperature above the eutectic temperature, AC1, the
pearlite colonies begin to transform to austenite (γ), while the proeutectoid ferrite remains
unaffected. However, as temperature increases further, carbon from newly formed austenite
diffuses into the low carbon ferrite. If kept above AC1 temperature for a sufficient amount of
time the carbon distribution will become homogeneous. If the austenization temperature, AC3,
is exceeded, then any remaining ferrite will transform to austenite. As the material cools down,
austenite transforms to martensite at high cooling rates, while it will transform to both
martensite and bainite at lower cooling rates [122-124]. Chou and Evans [36] estimated the
surface cooling rate in hard turning of hardened steel to be on the order of 104 °C/s. Due to the
fast cooling rate in cutting, some of the austenite has no time to transform and remains in the
surface layer.
Figure 1.4. Phase changes in hypo-eutectoid steel during heating (adapted from [124]).

22
Although an enormous amount of work has been reported on modeling of steel cutting,
only a handful of researchers have attempted to explicitly model phase formation in machining
of steels. Mahdi and Zhang [125, 126] developed a finite element (FE) framework to predict
phase transformations in grinding. Chou and Evans [36] used an analytical thermal modeling
approach to predict white layer formation due to phase transformation in hard turning of AISI
52100 steel workpieces. Umbrello and Filice [70] developed a two-dimensional (2D) FE
framework to predict white/dark layer thickness due to quenching/tempering and surface
hardness in orthogonal cutting of hardened AISI 52100 steel. Ramesh and Melkote [127]
applied a kinetics model of phase transformation to 2D FE simulations of orthogonal cutting of
hardened AISI 52100 steel using commercial software ABAQUS. Their simulations attempted to
capture the phase transformation due to thermal, stress, and strain effects in a surface layer.
The white layer thickness and subsurface residual stress predicted by the model were shown to
be in good agreement with the experimental data. However, these aforementioned models did
not consider the feedback of phase change on the material thermal, elastic and constitutive
viscoplastic behaviors in cutting. Burns et al. [128, 129] have reported that for carbon steels like
AISI 1045 steel and AISI 1075 steel phase transformation drastically changed the material
constitutive behaviors at high temperatures from those at lower temperatures prior to phase
change, and indicated that the constitutive models developed without considering the phase
change effect often are not suitable for modeling of cutting of steel at high cutting speeds.
In Chapter 4, a 2D FE framework is proposed for orthogonal cutting of AISI 1045 steel
based on a metallo-thermo-mechanical coupled material model. Cutting temperature, phase
composition, chip morphology, and cutting force are all solved simultaneously. Comparisons of
model predictions with experimental data are presented and the results are discussed.
1.4.3. White Layer Formation Mechanisms
The so-called hard turning process involves the single point turning of hardened bearing
steels as an alternative to grinding operations. During the hard turning process, steels often
behave in a complicated manner involving dynamic phase transformation (DPT), fracture, severe
plastic deformation (SPD), grain size change, and etc. Undesirable microstructural changes can
be induced within the near-surface layers after hard turning, which is often termed as “white
layer” because it appears to be featureless and white when viewed under an optical microscope.

23
Griffiths [130] attributes white layer formation to one or more of the following possible
mechanisms: (1) rapid heating and quenching, which results in phase transformation, (2) severe
plastic deformation, which produces a refined homogeneous structure, and (3) surface reaction
with the environment, e.g., nitriding. It is well acknowledged that metallurgical transformation
occurs in the chip or on the workpiece machined surface due to intense, localized and rapid
thermo-mechanical working during hard turning [36, 37, 39]. Indeed, hard turning operations,
particularly at high cutting speeds or with cutting tools severely worn, often lead to high cutting
temperatures and hence white layers as a result of austenitization followed by partial
transformation into martensite (the residue being retained austenite) [131]. An ultrafine grain
structure has long been observed within the near-surface layers produced by hard machining.
Studies of hard drilling of a commercial bearing steel (type SUJ2) in a tempered martensite
structure by Li et al. [132] and Todaka et al. [133] showed that the white layers formed on the
machined surfaces were composed of refined equiaxed nanocrystalline grains. They stipulated
that the ultrafine structure layer on the machined surface is produced by both thermal- and
deformation- driven phase transformations together with a large strain gradient and high strain
rates. Ramesh et al. [134] suggested that white layers produced by hard turning of AISI 52100
steel with a hardness of 62 HRC at low-to-moderate cutting speeds are largely due to the grain
refinement induced by SPD, whereas white layer formation at high cutting speeds is mainly due
to thermally driven phase transformation. Umbrello et al. [135] and Li et al. [132] showed that
both cutting parameters and initial workpiece hardness play vital roles in the white layer
formation. Umbrello et al. [135] proposed a processing map as a function of the initial hardness
of the workpiece and cutting speed as shown in Figure 1.5. It can be seen in Figure 1.5 that
white layer formation in hard turning results from a combined effect of both thermally driven
phase transformation and SPD. It is noted that the effect of cutting speed on white layer
formation illustrated in Figure 1.5 contradicts the findings of the microstructure analysis in [134]
for an AISI 52100 steel workpiece with an initial hardness of 62 HRC.

24
Figure 1.5. Processing map of the white layers formed during machining of AISI 52100 steel. Adapted from [135].
Thermally driven phase transformation has been exclusively modeled to investigate the
formation of white layer in hard turning of bearing steels. Chou and Evans [36] used an
analytical thermal modeling approach to predict white layer formation due to phase
transformation in hard turning of AISI 52100 steel workpieces. Shi and Liu [136] developed a
two-dimensional (2D) finite element (FE) analysis to simulate orthogonal cutting of hardened
AISI 52100 steel using commercial software ABAQUS and analyzed the phase transformation on
the chips from the temperature prediction. They found that high temperatures around the
secondary shear zone causes fast re-austenitization and martensitic transformation, while other
parts of the chips retain the original tempered martensitic structure. Ramesh and Melkote [127]
modeled phase transformation kinetics in orthogonal cutting of hardened AISI 52100 steel using
ABAQUS, which captured the phase transformation due to thermal, stress, and strain effects
within the near-surface layers. The white layer thickness and subsurface residual stress
predicted by the model were shown to be in good agreement with the experimental data.
Umbrello and Jawahir [137] and Umbrello et al. [135] developed a 2D FE framework to predict
white/dark layer thickness due to quenching/tempering and surface hardness in orthogonal

25
cutting of hardened AISI 52100 steel using commercial software DEFORM 2D. In particular, a
hardness-based flow stress model was implemented in the FE code and an empirical model was
developed for describing the phase transformations that create white and dark layers.
These aforementioned models did not consider the mechanism of grain refinement in
the formation of white layer. Although ultrafine grain structures have been widely observed in
the near-machined surface layers, very limited work has been attempted on modeling surface
grain refinement due to SPD in hard turning. Only one study by Caruso et al. [138], to the
author’s best knowledge, attempted to model the grain size change in orthogonal cutting of
hardened AISI 52100 using an empirical relationship, which was “calibrated” using the measured
grain size values. To improve the process and understand the resultant microstructure after
hard turning, it is necessary to investigate the microstructure refinement mechanism during the
hard turning process and is desirable to have an analytical model for predicting resultant grain
sizes.
In Chapter 5, a 3D FE framework is proposed for predicting the microstructure change in
hard turning of AISI 52100 steel using a multi-physics model, which for the first time considers
both phase transformation and grain refinement. The method proposed in this study takes a
metallo-thermo-mechanical coupled frame work developed in Chapter 4 and solve for
mechanical deformation, heat transfer, and microstructure simultaneously. Critical surface
microstructure attributes such as grain refinement, phase change, microhardness, and residual
stress are all discussed in this analysis.
1.5. Research Objectives
The objectives of this study are (i) to predict the microstructure alterations in metals
and alloys subjected to cutting with a wide range of cutting conditions, and (ii) to improve the
machinability and surface integrity of difficult-to-machine metal alloys via laser-assisted
machining in both macro and micro scales. The specific objectives are as follows:
1. Develop new machining simulation methods
a) Develop a computationally efficient CEL based finite element model to simulate the
steady-state orthogonal cutting process.

26
b) Develop a numerical model with strain gradient plasticity to simulate the size effect in
micro-milling.
2. Predictive modeling of grain refinement in metal cutting
a) Establish a physics-based numerical method for predicting the grain size change in
metals and metal alloys undergoing SPD processes with a range of temperatures, strains
and strain rates.
b) Apply this numerical method to different materials under different cutting conditions to
predict grain size change due to SPD.
3. Predictive modeling of phase change in steel cutting
a) Develop a metallo-thermo-mechanical coupled model to solve for grain size, phase
composition, chip morphology, cutting temperature and cutting force simultaneously.
a) Apply the multi-physics model to hard turning and laser-assisted machining processes to
quantitatively predict the microstructural change.
4. Improve the machinability and surface integrity of difficult-to-machine metal alloys via laser-
assisted machining in both micro and macro scales
a) Develop one-step LAM process for finish machining of difficult-to-machine alloys.
b) Study the laser-assist effect on surface quality and subsurface integrity in terms of
surface finish, size control, microhardness, microstructures and residual stresses.
c) Develop numerical models to predict the tool performance, material machinability and
surface integrity during the LAM process.
1.6. Dissertation Outline
In Chapter 2, novel numerical methods are proposed to model the chip formation
during the steady-state orthogonal cutting and interrupted micro-milling processes.
In Chapter 3, a dislocation density-based material model is proposed to model grain size
refinement due to severe plastic deformation in metal cutting.
In Chapter 4, a metallo-thermo-mechanical coupled model is developed to predict the
phase change effect during orthogonal cutting of AISI 1045 steel.

27
In Chapter 5, the mechanisms of grain refinement and phase transformation are both
included in modeling the surface microstructure alteration during 3D hard turning of AISI 52100
steel.
In Chapter 6, one-step LAM process is presented for finish machining of hardened steels.
Surface integrity is examined experimentally and numerically with the developed models.
In Chapter 7, conclusions and recommendations for future work are given.

28
CHAPTER 2. THERMAL AND MECHANICAL MODELING OF MACHINING PROCESSES
In this chapter, novel Coupled Eulerian-Lagrangian and arbitrary-Lagrangian–Eulerian
based finite element models are proposed to model the chip formation during a steady-state
plane-strain orthogonal cutting process and a complete micro-milling cycle, respectively. The
steady-state workpiece and tool cutting temperatures after multiple micro-milling cycles are
analyzed with a heat transfer model based on the chip formation analysis and the prismatic
thermal model predictions. The FE model results are discussed on chip formation, flow stresses,
temperatures and velocity fields in great details, which relate to the surface integrity analysis
and built-up edge (BUE) formation in micro-milling.
2.1. Coupled Eulerian-Lagrangian Modeling of Orthogonal Cutting
2.1.1. CEL Modeling
A coupled Eulerian-Lagrangian (CEL) model was developed to simulate steady-state chip
formation and grain refinement in two-dimensional (2D) orthogonal cutting by using the
commercial software Abaqus 6.10.1. Fully coupled thermo–mechanical Abaqus/Explicit analysis
was carried out for orthogonal cutting. Quadrilateral, four-node, linearly interpolated elements
with automatic hourglass control and reduced integration were used. Figure 2.1 shows the 2D
CEL model setup with applied mechanical boundary conditions, where cutting takes place under
plane strain condition. The arbitrary-Lagrangian–Eulerian (ALE) technique was used in the
whole domain of workpiece, which was divided into four regions (Zone 1-4) to simulate material
flow during cutting, as can be seen in Figure 2.1. During the simulation, material flows into the
workpiece mesh from the left inlet surface of zone-1, passes zone-2 around the tool tip, and
exits the simulation domain from the right outlet surface of zone-3 and the top surface of zone-
4. Eulerian zones 1 and 2 remain mesh constrained at the left inlet and fully in space,
respectively, while Lagrangian zones 3 and 4 grow in size generating the machined part and the

29
chip, respectively. The chip morphology continuously evolves by either inflation or deflation
until reaching a steady state. No chip separation criterion was required by the CEL model. Mass
scaling is often used in Abaqus/Explicit for computational efficiency in some dynamic analyses
that contain very small elements [139] and a moderate mass scaling factor of 10 was used in the
simulation to save the simulation time. A mesh-sensitivity analysis was conducted in several
trial simulations, and the optimal mesh scheme was found to have about 5000 elements in total
with the minimum element size of 5 µm in the workpiece, which considers both computational
precision and time.
Figure 2.1. CEL model setup schematic.
2.1.2. Model Validation
To assess the validity of the CEL model, 2D orthogonal cutting conditions listed in Table
2.1 were simulated to compare the predicted cutting force with the experimental results [66,
67]. Workpiece material constitutive models used in the simulation are given in Table 2.2. A
friction coefficient of 0.4 was used to define the tool-chip interaction in the simulations same as
in [67]. Figure 2.2 and Figure 2.3 show the comparison of the cutting force and temperature

30
predictions with the experimental results, respectively. The cutting force matches well with the
experimental results for all three tool rake angles. Nearly identical chip morphology and
temperature profile were predicted by the CEL model in comparison with the predictions made
by Miguélez et al. [66]. These results thus validate the CEL model for simulating 2D steady-state
orthogonal cutting.
Table 2.1. CEL model validation test conditions [66, 67].
Test Workpiece
Material Tool
Material Tool edge
radius (µm) Cutting speed
(m/s) Feed (mm)
Rake angle (°)
1
2
3
AISI 316L Kennametal
K313
20
20
20
2
2
2
0.1
0.1
0.1
-6
0
8
Table 2.2. Johnson-Cook type constitutive model parameters for AISI 316L [67].
Material AJC (MPa) BJC (MPa) nJC CJC mJC
AISI 316L 514 514 0.508 0.042 0.533
Figure 2.2. Comparison of predicted cutting force with experiments.

31
Figure 2.3. Comparison of predicted temperature distributions for Test 2.
2.2. Finite Element Modeling of Laser-Assisted Micro-Milling
Chip formation during micro-milling with varying uncut chip thickness was simulated
with the strain gradient based finite element model for the two LAMM configurations. An
arbitrary-Lagrangian–Eulerian (ALE) based finite element explicit scheme was developed with
the commercial software ABAQUS to model the chip formation in micro-milling. The technique
of remesh/solution mapping was developed to remesh the workpiece domain to enable a
continuous simulation of chip formation and transfer the simulation results between ABAQUS
explicit and implicit analyses.
2.2.1. LAMM Experimental Work
Laser-assisted micro-milling experiments were carried out on a three-axis CNC
controlled micro-milling system that includes a Precise SC-40 spindle with a maximum rotational
speed of 90k RPM and provides movement of the workpiece relative to the tool with a 1 µm
resolution. A Synrad 48-2 CO2 laser with a peak power output of 25 W and the necessary optics
were mounted to the spindle fixture. A flexible nozzle was attached to the spindle mounting
fixture allowing for an adjustable flow of assist gas during LAMM. Two-flute tungsten carbide
endmills were used with the tool diameter ranging from 100 to 300 µm. Figure 2.4 (a) shows
the LAMM optical path and (b-c) show the schematics of two LAMM configurations used in this

32
study. The LAMM bulk side cutting tests were performed along the top edges of bulk prismatic
workpieces of about 55(L)X20(H)X20(W) mm in size, while the fin side cutting tests were
performed on workpieces with fin structures of 55(L)X3(H)X(0.8-1.5)(W) mm in size. A smaller
elliptical laser beam with the spot size of 150X260 µm was positioned on the workpiece side
surface ahead of the tool in LAMM bulk side cutting, while a larger beam with the laser spot size
of 360X510 µm was positioned on the workpiece top surface with a greater laser-tool lead
distance in LAMM fin side cutting. The narrow width of the fins allowed for a more uniform
temperature profile and lower peak temperatures to be achieved compared to the bulk
workpiece geometry. To be consistent, the coordinate system was defined with respect to the
workpiece as shown in Figure 2.4 such that feed direction is X axis and axial depth of cut
direction is Z axis. The milling mode was down milling for the side cutting configurations. Note
that the laser spot size (DX, DY and DZ), the laser-tool lead distance (LX, LY and LZ ), the tool size
(Dtool) and the depth of cut (DocY and DocZ) were approximately scaled in Figure 2.4 to illustrate
the differences in the two setups. The laser-tool lead distance in the workpiece feed direction
was defined as the distance between the laser spot center and the boundary of the machined
chamfer in the side cutting configurations.
Figure 2.4. LAMM test configurations.
Table 2.3 and Table 2.4 give the test conditions for the side cutting of bulk workpiece
and fin structure configurations, respectively. The average material removal temperature, Tmr-
avg, refers to the weighted average material temperature in the machined chamfer purely due to
the laser heating, and will be discussed in details in Section 2.3. Multiple laser power levels
were used in the LAMM tests to study the temperature effect on the LAMM process. Tool wear
was measured for both bulk and fin LAMM side cutting tests. For LAMM side cutting of the bulk

33
workpiece configuration, the laser scanned the unmachined surface ahead of the cutting tool,
and multiple cutting tests were performed on multiple workpieces. For LAMM side cutting of
the fin structure, multiple fin side cutting tests were performed along the same workpiece side
with the laser scanning the top surface in multi passes. Post-inspections after micro-milling
experiments were carried out to investigate the resultant surface integrity, machined part size
and tool wear. A JEOL JSM-T330 scanning electron microscope (SEM) and a Zeiss optical
microscope were used to examine machined workpieces and tools.

34
Table 2.3. LAMM side cutting tests of bulk workpiece configuration.
Material Test Dtool (µm)
re (µm)
V (m/min)
hmax (µm)
λ (hmax/ re)
DocYXDocZ (µm)
P (W)
DXXDZ (µm)
LX X LZ (µm)
Tmr-avg (°C)
422SS
422bulk-1
100 ≈0.5 18.85 0.83 1.67 5X150
- - - 20
422bulk-2 12.5 150X260
150X260
150X260
150X150 330
422bulk-3 15.5 150X150 400
422bulk-4 18.75 150X150 480
Ti64
Tibulk-1
100 ≈0.5 18.85 0.83 1.67 5X150
- - - 20
Tibulk-2 2.7 150X260 150X150 242
Tibulk-3 4 150X260 150X150 338
Tibulk-4 5.3 150X260 150X150 435
Tibulk-5 6.7 150X260 150X150 532
Table 2.4. LAMM side cutting tests of fin workpiece configuration.
Material Test Dtool (µm)
re (µm)
V (m/min)
hmax (µm)
λ (hmax/ re)
DocYXDocZ (µm)
P (W)
DXXDY (µm)
LX X LY (µm)
Tmr-avg (°C)
422SS 422fin-1
150 ≈0.5 28.3 0.83 1.67 5X250 - - - 20
422fin-2 20.4 360X510 400X255 354
IN718
718fin-1
300 ≈0.5 58.8 0.83 1.67 10X200
- - - 20
718fin-2 17.4 360X510 400X255 396
718fin-3 20.6 360X510 400X255 468
Ti64 Tifin-1
300 ≈0.5 58.8 0.83 1.67 10X200 - - - 20
Tifin-2 14.5 360X510 400X255 421

35
2.2.2. Strain Gradient Constitutive Model
Table 2.5 shows the Johnson-Cook type material constitutive plasticity model
parameters of the workpiece materials. These constitutive models describe the material flow
stress at various strains, strain rates and temperatures occurring in cutting. However, the flow
stress models are independent of the length scale in the FE simulation and hence are not
suitable for describing the significant size effect in micro cutting.
The strain gradient plasticity model is briefly presented in this section and more detailed
descriptions can be found from the work of Liu and Melkote [53] and Lai et al. [54]. In strain
gradient plasticity, a length scale is introduced through the coefficients of spatial gradients of
strain components and can be used to model the size effect in micro-milling. The strain gradient
constitutive model can be expressed explicitly as
/
2
1 2
2 2181 11 log
1 log 1
ref
m refref
m ref
m
n
mo
n
o
A BT
c
A
T
B c
a bG
T TT T
LT T
(2.1)
where L is the length parameter. The strain gradient plasticity was programmed as a material
subroutine in ABAQUS. Table 2.6 gives the model parameters of the workpiece materials used
in the FE simulations. The length L used in the simulation was chosen to be the uncut chip
thickness, which varied as a function of the angle of tool rotation. To properly estimate the total
dislocation density in the strain gradient plasticity model, a constant µ of 0.38 was adopted for
modeling the workpiece materials in micro-milling from the work of Lai et al. [54] and Joshi and
Melkote [140]. Figure 2.5 compares the Johnson-Cook and strain gradient constitutive
behaviors of the workpiece materials for the maximum uncut chip thickness of 0.83 µm, strain
rate of 105 s-1 and temperature of 400 °C. It can be seen that the strain gradient constitutive
model predicts higher flow stresses by including the size effect. For example, the strain gradient
plasticity model of Inconel 718 shows a flow stress of 2,876 MPa at an equivalent strain of 1,
while the conventional Johnson-Cook model of Inconel 718 shows a flow stress of 1,845 MPa
under the same condition.

36
Table 2.5. Johnson-Cook constitutive model parameters of the workpiece materials.
Material A (MPa) B (MPa) n C m o (s-1) Tm (°C)
422SS [141] 870 400 0.4 0.015 0.5 0.01 1520
IN718 [142] 980 1370 0.164 0.02 1.03 1 1300
Ti64 [74] 782.7 498.4 0.28 0.028 1 1E-5 1660
Table 2.6. Strain gradient parameters of the workpiece materials.
Material G (GPa) b (nm) a µ
422SS [143] -0.0439T(°C)+85.709 0.248 0.5 0.38
IN718 [144] -0.0225 T(°C)+86.003 0.249 0.5 0.38
Ti64 [145] -0.0241 T(°C)+41.097 0.295 0.5 0.38
Figure 2.5. Johnson-Cook and strain gradient constitutive behaviors of the workpiece materials.

37
2.2.3. FE Models of Chip Formation Analysis
The 3D micro-milling process as illustrated in Figure 2.4 can be approximated as the sum
of a deck of 2D deformation-process sections with finite sectional heights twisted at the helix
angle of the endmill in an orderly fashion. Because the sectional height can be chosen to be
very small, the tool helix angle has little effect and the section can be treated as straight one in
the tool axial direction. Figure 2.6 (a) shows the 2D sectional view of LAMM side cutting. A
simplified geometry of one cutting flute was modeled in the simulation, while considering the
actual tool cutting edge radius, tool radial rake angle and relief angle. For LAMM side cutting of
both bulk and fin configurations, the simulation started from θmax, around 20° to 26° depending
on the actual cutting parameters, to simulate a complete cutting cycle of one flute as can be
seen in Figure 2.6 (b).
Figure 2.6. FE models of chip formation.
Fully coupled thermo–mechanical Abaqus/Explicit analysis was carried out for micro-
milling simulations. Quadrilateral, four-node, bilinear displacement and temperature elements
with automatic hourglass control and reduced integration were used. The workpiece
temperature predicted by the thermal model was used as the initial workpiece temperature in
the simulations of the first milling cycles, while the steady-state cutting temperature after many
milling cycles is determined by additional heat transfer analysis as will be discussed in Section
2.3. The ALE and remeshing techniques developed by Ding et al. [92] were applied in the

38
Abaqus/Explicit analysis steps to simulate chip formation without using any chip separation
criterion. To save the computation cost for ALE, the workpiece domain was artificially divided
into two sections of A and B. ALE was applied to the top section A with a fine mesh, while the
bottom section B was fixed in space with no ALE defined but to work as a heat sink. A constant
thermal conductance of 105 W/K·mm2 was used to define the interface between sections A and
B for the materials studied, which was deliberately set high enough to ensure the continuity of
temperature across the interface between the sections. As a result, no stress was simulated in
section B, but a continuous temperature contour was simulated by properly accounting for heat
conduction.
The top section A has a sectional width of 6 µm for the LAMM side cutting models. A
prescribed rotational speed was applied to the tool center and the workpiece elements in
section A deformed into the chip were simulated with the smoothing techniques of ALE. A
constant frictional coefficient of 0.65 was adopted for the tool-work interface [89] for all the
materials investigated in this study. An ABAQUS/Explicit simulation step of 20 µs or 7° tool
rotation at a cutting speed of 18.85 m/min can be completed with the ALE technique in a
reasonable computation time. However, a longer step cannot be simulated due to excessive
distortion of the workpiece mesh around the tool nose even with ALE. To simulate the chip
formation continuously for a longer period of time, for instance, 26° tool rotation for a complete
cutting cycle, remeshing the deformed workpiece is required. However the mesh-to-mesh
solution mapping technique is only available in ABAQUS/Implicit. An ABAQUS/Implicit step was
developed between two continuous explicit steps for remeshing the distorted workpiece mesh
and mapping the simulation results from the previous explicit step to the following one. A very
short period of time, say 0.001 µs, was simulated for the implicit step and remesh was optimized
in the deformed workpiece domain using ABAQUS/CAE.
2.2.4. Validation of Cutting Force
To determine the validity of the model, the FE model with the strain gradient plasticity
has been applied to prediction of the cutting forces in micro-milling of hardened H13 steel with
the hardness of 45 HRC and laser-assisted micro-grooving of hardened H13 steel with the
hardness of 42 HRC conducted by Aramcharoen and Mativenga [20] and Singh and Melkote [63],
respectively. The simulation results of the cutting force in micro-milling are briefly presented

39
here and more detailed descriptions can be found from the authors’ early work [92]. Figure 2.7
(a) compares the predicted specific cutting forces with the experimental data in micro-milling
tests with ratio λ varying from 0.2 to 2. It is evident that FE simulations with the strain gradient
plasticity model show a significant size effect in the specific cutting force in micro-milling and
match well with the experimental data for various λ ratios by Aramcharoen and Mativenga [20].
Simulations with the Johnson-Cook model predict the size effect to some extent due to the
increase of tool cutting edge radius in micro slotting; however, it was not able to simulate the
extreme high specific cutting force occurring in micro cutting for ratio λ less than 0.5. To further
assess the validity of the numerical models and temperature effect on cutting force in LAMM,
the prismatic thermal model has been applied to model the temperature rise due to laser-assist
in laser-assisted micro-grooving of hardened H13 steel using a 35W solid-state ytterbium-doped
fiber laser of a wavelength of 1060 nm studied by Singh et al. [61]. For laser-assisted micro-
grooving using a laser beam size of 110 µm, a scanning speed of 10 mm/min and depth of cut of
25 µm, the temperature rise predicted by the prismatic thermal model matched well with the
temperature measurement using the K-type thermocouples of 75 µm diameter and the
prediction errors are all within 10% at thermocouples at distances ranging from 20 to 200 µm
from the laser beam center for laser power ranging from 5 to 10 W. Using the simulated steady-
state temperature field as the temperature condition and the strain gradient plasticity with a
material length scale L of 25 µm (equivalent of the uncut chip thickness), the cutting forces in
the tangential (Fc) and radial (Ft) directions were predicted using the FE model for the laser-
assisted micro-grooving process. Figure 2.7 (b) shows the comparison of the predicted cutting
forces with the experimental data provided by Singh and Melkote [63] and it is evident that FE
simulations match very well with the experimental measurement with prediction errors well
below 5%. The simulation results thus validated the efficacy of the prismatic thermal model and
the FE model with the strain gradient plasticity model for simulating the LAMM process.

40
Figure 2.7. Measured and predicted cutting forces in micromachining of hardened H13 steels.
2.3. Thermal and Mechanical Modeling Analysis of Laser-Assisted Micro-Milling
In this section, the workpiece temperature predicted by the prismatic thermal model
was used as the initial workpiece temperature in the simulations of first milling cycles, while the
steady-state cutting temperature was investigated by a heat transfer analysis of multi micro-
milling cycles.
2.3.1. Workpiece Temperature Increase due to Laser Heating
In LAMM, the temperature distribution in a workpiece is very critical for the tool
performance in LAMM and surface integrity analysis such as heat affected zone. Therefore, the
thermal analysis in the machined chamfer is very critical for both theoretical investigation and
experiment design of different configurations. A transient, 3D finite volume prismatic thermal
model has been developed by the authors’ research group for laser-assisted milling studies [91].
The model calculates the temperature distribution throughout any prismatic workpiece during a
transient laser heating process. The prismatic thermal model was used to accurately predict the
temperature distribution due the laser heating in different LAMM configurations.
The thermo-mechanical properties of the tool material were obtained from Park [146],
while the temperature-dependent thermal properties of the workpiece materials were found
from the Thermophysical Properties of Matter Database [143], which are given in Table 2.7 as
functions of temperature. The absorptivity of the workpiece material depends on the laser

41
parameters and workpiece surface condition. Table 2.8 gives the absorptivity of the workpiece
materials at CO2 laser wavelength of 10.6 µm, which was measured for both fin and bulk
workpiece specimens by Shelton and Shin [22]. The workpiece surface was scanned by the CO2
laser repeatedly in multi-pass LAMM fin side cutting, while the workpiece surface was scanned
only once in LAMM bulk side cutting. The measured absorptivity was about 0.4 for the four
workpiece materials with small variances. For Inconel 718, with the similar peak temperatures,
Tp, the specimen surface was oxidized more in the fin absorptivity test due to multi-pass laser
scans and a higher absorptivity was obtained. While for 422SS and Ti64, the peak temperatures
were 332 and 170 °C lower in the fin absorptivity tests than those in the bulk absorptivity tests,
respectively, and hence specimen surfaces were less oxidized for the fin specimens, which
explains lower absorptivity values were measured in the fin absorptivity tests for these two
materials.
Table 2.7. Thermal properties of the workpiece materials [143].
Material
Density
(kg/m3
)
Thermal Conductivity (W/m-K) Specific Heat (J/kg-K)
422SS 7780
6 219.78 0.017 8.83 10 ( 925 )
28 ( 925 )
T T forT K
forT K
2 6 3
478 ( 493 )
1177.3 3.9932 0.0067848 3.1466 10
( 493 1145 )
1112.2 0.4098 ( 1145 1325 )
570 ( 1325 )
for T K
T T T
for K T K
T for K T K
for T K
IN718 8180 6.86 0.0151T 363.91 0.213T
Ti64 4470 5 26.65 0.0012 1 10 ( 1250 )
20.8 ( 1250 )
T T for T K
for T K
415.52 0.2293 ( 1473 )
756 ( 1473 )
T forT K
forT K
Table 2.8. Absorptivity of the workpiece materials at CO2 laser wavelength of 10.6 µm [22].
Material Bulk workpiece Tp (°C) Fin workpiece Tp (°C)
422SS 0.40±0.03 1208 0.38±0.03 876
IN718 0.36±0.02 1117 0.46±0.05 1028
Ti64 0.45±0.04 1098 0.38±0.02 928

42
Figure 2.8 shows the predicted workpiece temperature fields of Ti6Al4V undergoing
LAMM. The material temperature, Tmr(Z,θ), is defined as the workpiece temperature at the tool
rotational angle of θ and cutting depth of Z in the machined chamfer due to the laser heating,
while the average material temperature, Tmr-avg, is the weighted average workpiece temperature
of the cutting chamfer using the weighting factor of undeformed chip thickness. It can be seen
that some temperature variances can be observed along the cutting depth for LAMM side
cutting. Figure 2.9 (a) shows the laser power effects on Tmr-avg and temperature variance of the
machined chamfer of LAMM side cutting of various workpiece materials. Tmr-avg increases largely
in a linear trend as the laser power increases. As workpiece materials have different thermal
properties, i.e., thermal conductivity and specific heat, the workpiece temperature field varies
greatly for different materials even with the same absorbed laser power and experimental
condition. For example, Tmr-avg of Ti6Al4V is much higher than that of 422SS given the same laser
power as can be seen in Figure 2.9 (a). Compared to the other materials, the low thermal
conductivity of Ti6Al4V tends to produce a more notable temperature gradient in the cutting
chamfer. Figure 2.9 (b) shows the temperature profiles in the machined chamfer of Ti6Al4V for
different configurations. Tmr varies by 20°C and 30 °C within the depth of cut of 150 and 200 µm
for LAMM side cutting of bulk and fin workpiece configurations, respectively.
Figure 2.8. Temperature fields of Ti6Al4V undergoing LAMM side cutting.

43
Figure 2.9. Temperature predictions by the prismatic thermal model.
Figure 2.10 shows the temperature distributions at different cutting depths for LAMM
side cutting of 422SS of the fin configuration. High temperature gradients exist within a shallow
depth near the laser spot center, while the temperature gradients decrease drastically as the
heat dissipates as can be seen by comparing Figure 2.10 (a) to Figure 2.10 (b) and (c). Tmr-avg of
the cutting chamfer only drops from 365 °C to 338°C from 5 µm to 245 µm below the top
surface. The boxed domain of 60X30 µm shown in Figure 2.10 is designated as the finite
element cutting simulation domain, where temperature distribution predicted by the thermal
model defines the initial temperature for the cutting simulation. It can be seen that the
workpiece temperatures vary by less than 20 °C within the cutting simulation domains. In the
following sections, unless the location is specified, the temperature profile predicted in the
middle of the depths of cut was used as the initial condition for the workpiece in the FE
simulations.

44
Figure 2.10. Thermal analyses in fin workpiece side cutting of 422SS.
2.3.2. Workpiece Temperature after Multi LAMM Cycles
The FE chip formation simulation was limited to one micro-milling cycle, because
coupled thermo-mechanical analysis is too expensive in computation using any commercial
finite element software. To correctly model the steady-state cutting temperature only achieved
after many milling cycles, a heat transfer analysis was performed on the bulk and fin workpieces
after the chip formation analysis for further milling cycles at a low computation cost. In the chip
formation analysis, the modeled workpiece was smaller than the actual one to save the
computation cost, but it was extended to close to the actual size in the heat transfer analysis for
the proper thermal boundary conditions. The ABAQUS/Explicit solver was used in the heat
transfer analysis of the bulk and fin workpieces for many milling cycles. In each conventional
micro-milling cycle, the workpiece material is heated locally by heat generation due to plastic

45
deformation and friction at the tool-chip and tool-workpiece interfaces as the tool flute is
engaged, while it cools down due to heat conduction to the bulk material and heat convection
to air as the flute leaves. If the local heat generation is not dissipated completely to the bulk
material by heat conduction and the environment by heat convection, the temperature of the
workpiece will get an increment in the following milling cycle due to the remaining heat.
Different than in conventional micro-milling, the workpiece material temperature, Tmr, is already
increased to a few hundreds of degrees in Celsius higher than the tool temperature due to the
laser heating in LAMM, and the material cutting temperature in the deformation zone, Tshear,
might drop several dozens of degrees from Tmr due to the heat conduction to the relative cool
tool.
As the cutting flute approaches, the total heat flux to the local material due to cutting is
composed of heat generation term plq converted from plastic deformation and frictional heat
term fwq . Deformation heat flux is given by
pl plq (2.2)
where pl specifies the fraction of deformation energy converted into thermal energy (0.9 was
used), is the material flow stress, and is the material strain rate. Frictional heat flux is
created due to the sliding friction between the workpiece material and the tool face. The
amount of frictional heat flux into the workpiece is given by
fw f sq (2.3)
where f specifies the fraction of mechanical energy converted into thermal energy (0.9 was
used), s is the frictional stress, is the slip rate, and gives the fraction of the generated heat
flowing into the workpiece (0.5 was used). The conductive heat flux, cq , conducted away by the
tool is defined by the temperature difference of tool-chip and tool-workpiece at the interface by
/( )c gap work chip toolq k T T (2.4)
where gapk is the gap conductance. The gap conductance in the heat transfer analysis was 104
W/K·mm2 when the tool face node is in contact with the chip and the workpiece. When the tool
face node had no contact with the chip and the workpiece, the gap conductance was set to zero.
The contact status of the tool face node at a time point was derived from the value of normal
pressure at the corresponding time point in the chip formation analysis of the first milling cycle.

46
All these heat flux components are varying from node to node and the nodal heat flux data were
obtained from the FE chip formation analysis of one milling cycle. A time-dependent nodal heat
flux subroutine was created for the heat transfer analysis of multi cycles, in which the heat flux
was used as periodic heat input along the milling paths. The temperature fields predicted by the
LAMM thermal model were used as the boundary conditions in the heat transfer analysis.
To determine if the workpiece temperature field reaches its quasi steady state, the
temperature histories of central nodes on the machined slot were tracked for the conventional
and LAMM side cutting of 422SS with the heat transfer analysis. Figure 2.11 (a) shows the nodal
temperature history of two conventional fin side cutting cycles, and it can be seen that the
material temperature (Tshear) in the cutting zone increases to about 120 °C as the flute
approaches but drops to the ambient temperature (Tss) as the flute leaves within the first milling
cycle. Figure 2.11 (b) tracks the nodal temperature histories of two LAMM fin side cutting cycles.
The material shearing temperature drops to about 342 °C as the flute approaches but reverses
quickly to the initial Tmr of 356 °C as the flute leaves within the first milling cycle. These findings
prove that the simulation of the first side cutting cycle of either LAMM or conventional
configuration predicts the steady-state cutting temperature. As discussed above, the
continuous laser heating input in LAMM compensates for the heat loss conducted away by the
tool material and increases the material temperature back to steady-state Tmr prior to the
following cutting cycle. The simulated steady-state temperature fields were then used for
setting the temperature conditions in the chip formation analysis of LAMM side cutting.
Figure 2.11. Workpiece nodal temperature histories in conventional micro-milling and LAMM of 422SS.

47
2.3.3. Tool Temperature after Multi LAMM Cycles
A heat transfer analysis was also carried on the cutting tool for multiple fin side cutting
cycles in order to get the steady-state tool temperature for the correct calculation of tool wear.
For the tool flute, each milling cycle includes a cutting and an idling phase. The tool is heated in
the cutting phase by the heat flux at the tool-chip and tool-workpiece interfaces, and then the
heat is dissipated to the tool bulk material by conduction and to the air by convection. An
implicit heat transfer analysis with ABAQUS/Standard solver was conducted to model the tool
temperature history of multiple LAMM side cutting cycles. Although in the cutting simulation
the cutting tool rotates continuously, in the heat transfer analysis it is fixed spatially. The tool
geometry and mesh in chip formation analysis were inherited and used in the heat transfer
analysis. The 2D first-order four node diffusive element, DC2D4, was chosen to mesh the tool
geometry in the heat transfer analysis.
Figure 2.12 illustrates the boundary heat flux conditions in the tool heat transfer
analysis. In the cutting phase the cutting tool is heated and the total heat flux is composed of
frictional heat flux ftq and conductive heat flux cq . The conductive heat flux caused by the
temperature difference of tool-chip and tool-workpiece at the interface is calculated by Eqn.
2.4. The amount of frictional heat flux into the cutting tool is given
(1 ) .ft f sq (2.5)
Therefore, conductive heat flux was temperature dependent. Both the heat flux components
were varying from node to node and the basic nodal heat flux data were obtained from the chip
formation analysis. In the cooling phase of milling operation, if the heat in the tool is not
emitted completely to the environment by heat convection and heat radiation, the temperature
of the tool will get an increase in the following milling cycle due to the remaining heat. The
convectional heat transfer coefficient h from a high-speed rotating tool was obtained by using
an empirical correlation of Nusselt number for a rotating cylinder [147] as
0.5710.318RerNu (2.6)
where Rer is the Reynolds number for the rotating tool in air. The calculated convectional heat
transfer coefficient h ranged from 118 to 138 W/m2K for micro endmill diameter ranging from

48
100 to 300 µm rotating at 60k RPM. Constant temperature was assumed at the tool core area.
The time-dependent nodal heat flux subroutine was created for both the cutting and cooling
phases of multi LAMM cycles.
To determine after how many milling cycles the tool temperature field reaches its quasi
steady state, the tool temperature distribution simulated for multiple milling cycles was
examined. It is found that the tool temperature distribution after multiple milling cycles was
identical to the one after the first milling cycle. Figure 2.13 shows the tool cutting edge
temperature histories of the two flutes in multiple LAMM fin side cutting cycles under the
condition of 422fin-2 with a cutting speed of 28.3 m/min. It can be seen that the tool tip
temperature increases to about 250 °C during cutting, but then drops quickly to the ambient
temperature during the first tenth of cooling phase period.
Figure 2.12. Heat transfer analysis of the tool.

49
Figure 2.13. Tool cutting edge temperatures in LAMM of 422SS under the condition of 422fin-2.
2.3.4. Chip Formation and Temperature Effect on Workpiece Flow Stress
Continuous chip formation within a complete LAMM side cutting cycle with a 0.5 µm
edge radius micro tool is shown in Figure 2.14. Five ABAQUS/Explicit steps were simulated for
the cutting cycle. Four ABAQUS/Implicit intermittent steps were used to remesh the distorted
workpiece mesh from the previous explicit step and map the simulation results from the earlier
step to the following one. Strain gradient plasticity was used in all the time steps with the
average uncut chip thickness as the material length scale L, which was updated for each
remeshed step to account for the varying uncut chip thickness at different tool rotation angles.
Deformed chip thickness grew thicker in the beginning 30 µs cutting time even with a decreasing
uncut chip thickness. The model simulated necking of chip formation after approximately 50 µs.
The simulated shear zone temperature, Tshear, in the primary deformation zone was about 370
°C, which was lower than Tmr of 400 °C due to the heat conduction from the deformation zone to
the tool material. Figure 2.14 (b) shows the predicted tool temperature distribution with a peak
temperature of 216 °C at 60 µs cutting time.

50
Figure 2.14. Chip formation and cutting temperatures of LAMM bulk side cutting of 422SS at 60
µs cutting time under the condition of 422bulk-3 (V=18.85m/min).
Figure 2.15 (a) shows the temperatures and flow stresses in the primary deformation
zone in LAMM bulk side cutting tests of 422SS. As can be seen in Figure 2.15 (a), flow stress
reduced linearly from 2557 MPa under conventional bulk side cutting test condition to 1927
MPa under LAMM condition with Tmr-avg of 480 °C. It is interesting to note that the simulated
shear zone temperature was higher than the average material temperature as the laser power
drops to below 8 W, while it became lower than Tmr-avg at higher laser powers due to the heat
conduction to the tool. Multiple simulations were also run using temperatures at different
depth of cuts to investigate any temperature effect on cutting. Figure 2.15 (b) shows the effect
of temperature variances in the cutting depth on the workpiece flow stresses for LAMM side
cutting of 422SS of fin configuration. With a temperature variance of about 30 °C in the axial
depth of cut of 250 µm, almost constant flow stress of 2082 MPa was predicted with a negligible
variance of 50 MPa in the cutting depth. Uniform workpiece specific cutting energy was
predicted along the cutting depth of 250 µm, which would produce uniform tool wear profile
along the flute cutting edge.

51
Figure 2.15. Temperatures and flow stresses in LAMM side cutting of 422SS.
2.3.5. Tool Wear Analysis in Laser-Assisted Side Cutting
Figure 2.16 shows a new tool and the tool wear mode after 33 minutes of LAMM fin side
cutting of 422SS. The flank wear was measured with the microscope or SEM by calculating the
decrease from the width of land of the tool flank surface after cutting. The tool cutting edge
radius was measured with SEM. It can be seen in Figure 2.16 (b) that a uniform flank wear has
been developed along the long helix cutting edge of the flute, which corroborates the FE
prediction of uniform flow stresses and temperatures along the edge. Figure 2.17 shows the
tool wear comparison of conventional and LAMM fin side cutting of 422SS and Inconel 718. The
micro endmills have been continuously used in LAMM fin side cutting of 422SS for 33 minutes,
compared with the 5.5 minutes of cutting time used in the conventional cutting. Increasing Tmr-
avg to 354°C helped reduced the tool wear rate from 0.73 to 0.12 µm/min for fin side cutting of
422SS, while increasing Tmr-avg to 451°C helped reduced the tool wear rate from 0.9 to 0.25
µm/min for fin side cutting of Inconel 718.

52
Figure 2.16. Tool geometry and tool wear mode after 33 minutes LAMM fin side cutting 422fin-2 [22].
Figure 2.17. Tool wear for fin side cutting of 422SS and IN-718 under the conditions of 422fin-1, 2 and 718fin-1, 3.

53
Approximately, a linear tool wear progression at a steady rate was observed along the
tool cutting edge radius and flank surface in micro-milling and LAMM of multiple difficult-to-
machine alloys [22, 92], and hence an uniform wear rate is assumed in this tool wear study. To
model the tool wear rate during micro side cutting tests, Usui’s tool wear rate model [78] was
modified to include the size effect in micro cutting, which is given by
/ toolp Tnt s
dWC v e
dt
(2.7)
where dW
dt is the rate of volume loss per unit contact area per unit time (µm/min), σt is the
normal pressure (GPa) on tool face, Ttool is the tool temperature in Celsius degree, vs is the
sliding velocity (m/s) between the chip and the cutting tool, and C, n and p are tool wear
characteristic constants. The model includes three variables: sliding velocity between the chip
and the cutting tool, tool temperature and normal pressure on the tool face, which were
provided by the FE simulations of the micro side cutting process using a constant moderate tool
cutting edge radius of 2 µm. The constants in the tool wear rate model depend on the
workpiece material, tool material and cutting parameters. The constants were derived by curve
fitting the tool wear rate data measured from the bulk side cutting tests, and are given by
n=11.8, p=20.65 and C=1.0617E-7. Figure 2.18 shows the tool wear rate model predictions of
the fin side cutting tests. It can be seen that the developed tool wear rate model can correctly
predict the tool wear rate in LAMM fin side cutting.

54
Figure 2.18. Tool wear predictions for fin side cutting of 422SS.
2.3.6. Surface Integrity Analysis
The transition of material removal mechanism from cutting to ploughing was
investigated by the FE model using different tool cutting edge radii. Figure 2.19 shows the chip
formation within the first 10 µs of LAMM and conventional fin side cutting with different tool
edge radius of 0.5 and 4.2 µm. It can be seen that cutting is the main material removal
mechanism when the ratio λ is 1.67, while ploughing plays the dominant role with no chip
formed as λ decreases to 0.2. Velocity fields simulated with various cutting ratios in Figure 2.19
(c) and (d) show larger triangle zones of stagnant workpiece material during side cutting for λ of
0.2 than those for λ of 1.67, which indicates BUE would form more often as tool wears to have a
large re. It is also readily seen that increasing Tmr-avg helps decrease the size of the stagnant
triangle zone: the workpiece material stagnant zone is almost eliminated for λ of 1.67
undergoing LAMM compared with conventional micro-milling, while it becomes smaller and less
stagnant for λ of 0.2 undergoing LAMM compared with conventional cutting.

55
Figure 2.19. Workpiece velocity fields of Inconel 718 undergoing fin side cutting tests 718 fin 1 and 3.
Figure 2.20 shows the machined side surface finish produced by conventional and
LAMM fin side cutting with tools worn to the similar extent. Comparing the Inconel 718 surface
finish between Figure 2.20 (a) and (b), longer, larger edge burrs and more prows can be
observed remaining on the top surface and machined side surface, respectively, produced by
conventional cutting than LAMM side cutting. Similarly, more prows can be observed remaining
on the machined side surface after 5.5 minutes conventional cutting of 422SS than those
produced after 33 minutes of LAMM side cutting. It is interesting to note that no prows can be
observed on the upper half of the machined side surface of 422SS produced by LAMM, while
some prows are observed on the lower half, which might be caused by more severe tool wear
there. The experimental observation of BUE breaking off the worn tool as shown in Figure 2.16
(b) confirmed the model predictions of BUE. The surface defect of prows remaining on the
machined surface was the result of BUE’s that have broken off from the tool nose [58]. The
model predictions that LAMM would eliminate the BUE formation at a large λ of 1.67 or reduce
the BUE formation at a small λ of 0.2 corroborate the experimental observation of more and
larger prows remaining on the machined surface produced by conventional cutting than LAMM.

56
It is already known that increasing the cutting speed will reduce the formation of BUE [148].
However due to the micro size of the endmill, the maximum spindle speed of micromachining
apparatus usually limits the available highest cutting speed. It is validated that LAMM can
eliminate or reduce BUE in micromachining of difficult-to-machine materials even at a relatively
low cutting speed with proper heating the workpiece material prior to the cutting tool. The
developed FE model in this study does not require the shape of BUE to be known and thus
serves as a useful tool to assess the BUE formation in micromachining under different
conditions.
Figure 2.20. Machined side surface finish by fin side cutting of Inconel 718 and 422SS.
2.4. Summary
In this chapter, the workpiece temperature increase due to the laser heating and
temperature variances in the cutting zone was examined by a transient, 3D prismatic thermal
model for various LAMM test configurations. The thermal analysis proved that the fin
workpiece structure was the optimal design for LAMM within the present system constraints
with a temperature variance of 10 to 15 °C in the machined chamfer. The steady-state cutting
temperature after many micromilling cycles was determined by the heat transfer analysis. Using
the simulated steady-state temperature fields as the temperature conditions, continuous chip
formation with varying undeformed chip thickness was achieved by 2D FE models embedded
with the strain gradient constitutive models. It is shown that the workpiece flow stress drops by
about 20-25% as the temperature is creased to 250-450 °C. A uniform workpiece specific

57
cutting energy was predicted along the cutting depth of 250 µm in LAMM fin side cutting. An
empirical tool wear model was derived for a tungsten carbide tool in fin side cutting based on
LAMM bulk side cutting simulations and experimental tool wear rate, and the steady-state tool
temperature was predicted by the heat transfer analysis. The model predicted that the tool
wear rate drops from 0.62 to 0.15 µm/min as the workpiece temperature increases from the
ambient temperature to about 354 °C in fin side cutting of 422SS, which was in good agreement
with the tool wear measurements. The FE model simulations showed that LAMM can eliminate
or reduce BUE formation in micromachining of difficult-to-machine materials with proper
heating of the workpiece material prior to the mechanical cutting.

58
CHAPTER 3. GRAIN REFINEMENT MODELING IN MACHINING
In this chapter, dislocation density-based material models are presented to model grain
size refinement and grain misorientation during severe plastic deformation processes of various
materials under varying strain rates and temperatures. A coupled Eulerian-Lagrangian (CEL)
finite element model embedded with the dislocation density subroutine is developed to
simulate the severe plastic deformation and grain refinement during steady-state plane-strain
orthogonal cutting processes. Simulation results of grain refinement and grain misorientation
are discussed for Al 6061 T6 and OFHC Cu in details.
3.1. Dislocation Density-Based Material Model
Estrin and other researchers presented a set of differential equations to evaluate the
dislocation density evolution rates and applied the dislocation density-based material model to
grain refinement in the ECAP processes of various materials such as aluminum [104], copper
[103] and IF steel [105]. Their proposed dislocation density-based material model is compatible
with the material constitutive models developed under varying conditions of strains, strain rates
and temperatures and has been adapted to model other deformation processes with high strain
rates or high temperature gradients such as a Taylor impact test of copper [107] and a
machining process of titanium [24]. Hence their dislocation density-based material model is
adopted for modeling grain refinement by cutting in this study.
In the model, a dislocation cell structure is assumed to form during deformation, which
consists of two parts, dislocation cell walls and cell interiors, and obeys a rule of mixtures.
Different types of dislocation densities are distinguished in the model: the cell interior
dislocation density ( ) and the cell wall dislocation density ( ), which is further divided into
two distinct groups of statistical dislocation density ( ) and geometrically necessary

59
dislocation density ( ). The evolutions of the dislocation densities , and follows
different routes and are governed by the following equations:
1/
* *
1/3
1 6
3 1
nrr r rc
c ws wg w c o c c
o
kb bd f
(3.1)
2
1/3
* *3 1 6 11
nr
r r rwws ws wg c c o ws w
o
f fk
fb bdf
(3.2)
2
3* 6 1
.rwg c
f
bdf (3.3)
The first terms of Eqs. 3.1 and 3.2 on the right side correspond to the generation of dislocations
due to the activation of Frank–Read sources; the second terms denote the transfer of cell
interior dislocations to cell walls where they are woven in; the last terms represent the
annihilation of dislocations leading to dynamic recovery in the course of straining. The density
of geometrically necessary dislocations is assumed to arise from a fraction ( ) of the dislocations
incoming into cell walls from the cell interiors as shown in Eq. 3.3. , and ko are dislocation
evolution rate control parameters for the material, n is a temperature sensitivity parameter,
is the volume fraction of the dislocation cell wall, b is the magnitude of the Burgers vector of
the material, d is the dislocation cell size, and
are the resolved shear strain rates for the
cell walls and interiors, respectively, and is the reference resolved shear strain rate. It is
assumed that the resolved shear strain rate across the cell walls and cell interiors are equal,
, which satisfies the strain compatibility along the interface between interiors and
boundaries. The resolved shear strain rate can be calculated by the von Mises strain rate
by using , where M is the Taylor factor.
Volume fraction of the dislocation cell wall, total dislocation density and grain
size d are given as follows:
r
r
of f f f e
(3.4)
(1 )tot ws wg cf f (3.5)

60
tot
Kd
(3.6)
where and are the initial and saturation volume fractions of cell walls, respectively, and
the average cell size d is assumed to scale with the inverse of the square root of total dislocation
density . The resolved shear strain rate can then be integrated with the dislocation
densities to obtain the resolved shear stress as follows:
1/r m
rc
c
o
cGb
(3.7)
1/rw
m
rw ws g
o
wGb
(3.8)
(1 )r r rw cf f (3.9)
where m is the strain rate sensitivity of the material.
Geometrically necessary dislocations contribute to an imbalance in the Burgers vector in
a dislocation cell wall and thus lead to misorientation buildup across the wall. The statistical
dislocations do not produce misorientation across the boundary [149] and hence their effect on
grain misorientation is omitted in this study. The absolute value of the misorientation angle
between the neighboring cells induced by deformation ( ) is then given by:
int arctan .wgb (3.10)
In the course of the accumulation of misorientation with straining, the efficiency of cell walls as
places for storage of incoming cell interior dislocations increases. Therefore, the cell wall
dislocation evolution rate parameter is given as a function of the misorientation angle:
* /12o e
(3.11)
where and are the initial and saturation value of parameter , respectively. The total
misorientation frequency distribution can be split into two parts: the deformation-
induced misorientation angle distribution ( ) as already defined above and the residual

61
grain boundary misorientation angle distribution ( ) that comes from the periphery of the
original large grain and its neighbors situated at the opposite side of the same initial grain
boundary [149]. The rule of mixture can be used to get the total misorientation frequency
distribution
int 1 .GBf f (3.12)
In the simulation, a random initial texture with the Mackenzie distribution [150] is assumed for
, which remains little changed due to the absence of a topological connection between
the large original grains.
The CEL model incorporated the dislocation density-based material model subroutines
written in FORTRAN and calculated the dislocation fields in the workpiece during the cutting
simulation. Figure 3.1 shows the flow chart for CEL modeling using the dislocation density-
based material model.

62
Figure 3.1. Flow chart for CEL modeling using the dislocation density-based material model.
3.2. Determination of Material Model Parameters
To study the effects of cutting processing parameters on grain refinement and
misorientation, microstructural evolution was simulated for multiple plane-strain orthogonal
cutting tests of Al 6061 T6 and OFHC Cu. Interest in these materials is motivated by their
extensive applications in industry and their potential attractiveness of enhanced mechanical

63
strength with an ultra-fine grained microstructure. Dry cutting tests cited from multiple sources
were carried out at room temperature under various conditions for the materials as given in
Table 3.1. Test conditions Al1~Al3 were conducted for Al 6061 T6 using the same machining
parameters with more negative tool rake angles from 20° to -20° , which were aimed to study
the effect of increasing the applied strain on grain refinement. Different cutting speeds, ranging
from 0.02 to 1.25 m/s, and tool rake angles, ranging from 20° to -20°, were used in test
conditions Cu1~Cu4 for OFHC copper to study the combining effects of applied strains, strain
rates, and temperatures on the microstructural evolution during cutting.
Table 3.1. Orthogonal cutting tests simulated for Al 6061 T6 and OFHC Cu.
Material Test Initial grain
size (µm) V (m/s) f (mm) α (°) Reference
Al 6061 T6
Al1
Al2
Al3
~75
~75
~75
0.01
0.01
0.01
0.15
0.15
0.15
20
-5
-20
Shankar et al. [32]
Shankar et al. [32]
Shankar et al. [32]
OFHC Copper
Cu1 ~50 0.02 0.11 -20 Swaminathan et al. [27]
Cu2 ~50 0.05 0.3 20 Shekhar et al. [34]
Cu3 ~50 0.6 0.3 -5 Ni and Alpas [25]
Cu4 ~50 1.25 0.3 20 Shekhar et al. [34]
The material thermal and mechanical properties are given in Table 3.2. The material
Johnson-cook constitutive plastic model is shown as follows:
11 ln .
JC
JC
m
re
JC JC J
fn
o m ef
C
r
T TA B C
T T (3.13)
The Johnson-cook model parameters for Al 6061 T6 and OFHC Cu are given in Table 3.3. The
dislocation density-based material models were developed using Matlab to replicate the
observed material constitutive behaviors under various strains, strain rates and temperatures
similar to those occurring in cutting or other SPD processes. The reference strain rate was set as
150 s-1 for cutting of Al 6061 T6 at a cutting speed of 0.01 m/s, while the reference strain rates

64
were set as 200 and 4000 s-1 for cutting of OFHC Cu at low (conditions Cu1 and Cu2) and high
(conditions Cu3 and Cu4) cutting speeds, respectively. The dislocation density evolution rate
control parameters, i.e., the dynamic coefficients of dislocation generation (α*), interaction
between the cell walls and interiors (β*) and dislocation annihilation (ko), were calibrated for Al
6061 T6 and OFHC Cu according to the flow stress data given by the material Johnson-cook
constitutive models. Constant parameters α* and β* were identified as 0.06 and 0.01 for Al
6061 T6, respectively, while α* and β* were identified as 0.04 and 0.01 for OFHC Cu,
respectively. The temperature sensitivity coefficients m and n were given as follows:
Am
T (3.15)
Bn
T (3.16)
where A and B were adopted as 50,000 and 14,900 for Al 6061 T6 [151], respectively, while A
and B were adopted as 30,000 and 14,900 for OFHC Cu [107], respectively. The dislocation
annihilation rate parameter ko increases as the workpiece temperature increases. A constant ko
has usually been used in ECAP models because the temperature profile is more uniform during
the ECAP process than in cutting. For the temperature range from ambient to 175 °C, ko linearly
increases from 5.2 to 7.6 for Al 6061 T6. For the temperature range from ambient to 300 °C, ko
linearly increases from 9.0 to 10.2 for cutting of OFHC Cu at low cutting speeds of 0.02 and 0.05
m/s, while it linearly increases from 12.0 to 16.1 for cutting of OFHC Cu at high cutting speeds of
0.6 and 1.25 m/s,. A constant fraction ( ) of 0.1 was used for the evolution of the geometrically
necessary dislocations, which was adapted from the modeling work of copper by Toth et al.
[102]. A constant of 0.12 was used in the grain misorientation simulations of OFHC Cu,
which was adapted from modeling ECAP process of copper by Estrin and Kim [149]. The other
non-mentioned material constants for the two material models were generally derived from an
earlier study of ECAP process of pure aluminum [104] and copper [103]. The dislocation density
model parameters are given in Table 3.4.

65
Table 3.2. Material Thermo-mechanical Properties.
Material E
(GPa)
G
(GPa) ν
b
(nm)
ρ
(kg/m3)
Tm
(°C)
Thermal expansion
(10-6
/°C)
Thermal conductivity
(W/m·K)
Specific heat
(J/kg·K)
Al 6061-T6 68.9 26 0.33 0.286 2700 582 23.6 167 896
OFHC Cu ~116 48 0.34 0.256 8960 1083 16.6 400 385
Table 3.3. Material Constitutive Model Parameters.
Material AJC
(MPa)
BJC
(MPa) nJC CJC mJC
Tref
(°C)
Tm
(°C)
(1/s)
Al 6061-T6 [152] 324.0 114.0 0.42 0.002 1.34 25 582 1
Cu (OFHC) [153] 90 292 0.31 0.025 1.09 25 1083 1
Table 3.4. Dislocation Density-Based Model Parameters.
Material ko A
(K)
B
(K) K M
(mm-2
)
(mm-2
)
b
(mm) α
Al 6061 T6 0.06 0.01 5.2-7.6 50,000 14,900 150 0.25 0.06 30 3.06 3.2 1E7 1E8 2.86E-7 0.25
OFHC Cu
(low speed) 0.04 0.01 9.0-10.2 30,000 14,900 200 0.25 0.077 10 3.06 3.2 1E7 1E8 2.56E-7 0.25
OFHC Cu
(high speed) 0.04 0.01 12.0-16.1 30,000 14,900 4E3 0.25 0.077 10 3.06 3.2 1E7 1E8 2.56E-7 0.25

66
Figure 3.2 shows the comparisons of the dislocation density-based material model
predictions of the stress-strain relationships with the flow stress data that are measured or
predicted from a material constitutive model at different temperatures and strain rates for all
four different materials. The good agreement proved that the identified model parameters are
accurate enough to predict the stress-strain relationships under different temperatures and
strain rates, which validates the dislocation density-based plasticity models.
(a) Al 6061 T6
(b) OFHC Cu
Figure 3.2. Dislocation density-based plasticity model predictions.
3.3. Simulations of Grain Refinement by Machining
The parameters of the dislocation density-based material models described above have
been used to simulate the microstructural evolution during cutting of Al 6061 T6 and OFHC Cu.
The simulated chip morphologies and deformation fields under various cutting conditions are

67
first examined in comparison with experimental results to assess the validity of the numerical
solution. The predicted grain size and grain misorientation angle in the machined chips are then
discussed.
3.3.1. Chip Formation and Deformation Field
Figure 3.3 shows an example of strain rate field predicted by the CEL model in
comparison with the measurement conducted by using a high speed camera system [27] during
orthogonal cutting of OFHC Cu at a cutting speed of 0.01 m/s with a 10° rake angle tool. It can
be seen that the model prediction matched well with the measurement: a narrow, high-rate
concentrated zone along the shear plane separated the machined chip from the bulk material;
the model predicted shear strain rate of about 200 s-1 for a cutting speed of 0.01 m/s was very
close to the measured rate in the primary shear zone. The predicted formation of a long
continuous chip was nearly identical to the actual chip, as can be seen in Figure 3.3. The shear
strain field in the chip was also examined. Figure 3.4 shows a comparison of the model
prediction and the actual measurement of the cumulative shear strain along the middle line of
the chip flow, which again are in a good agreement. The magnitude of the average shear strain
in the chip was predicted to be about 4.5, while the measured average strain was 4.6 for the
cutting test of OFHC Cu with the 10° rake angle tool.
(a) Measured (b) predicted Figure 3.3. Shear strain rate for cutting of OFHC copper under condition: V=0.01 m/s, α=10° and
doc=0.1 mm. .

68
Figure 3.4. Cumulative shear strain along path-1 for cutting of OFHC copper under condition: V=0.01 m/s, α=10° and doc=0.1 mm.
The machined chip morphology and the achieved strain in the chip vary greatly in
cutting of different materials with different cutting tools. Figure 3.5 shows the predictions of
average shear strains in the chips and machined chip thicknesses for cutting of Al 6061 T6 at a
cutting speed of 0.01 m/s with different tool rake angles in comparison with those measured by
Shankar et al. [32]. The predicted average shear strains in the chips were 1.8, 3.5, and 5.5 for
the rake angle of 20°, -5° and -20°, respectively; while the measured average shear strains in the
chips were 1.8, 3.8 to 5.2 for the rake angle of 20°, -5° and -20°, respectively. The predicted
average machined chip thicknesses were 0.27, 0.44, and 0.64 mm for the rake angle of 20°, -5°
and -20°, respectively; while the measured average machined chip thicknesses were 0.27, 0.5
and 0.6 mm for the rake angle of 20°, -5° and -20°, respectively. As can be seen in Figure 3.5,
the model correctly captured the effect of tool rake angle on the deformation field. A more
negative rake angle tool produces a thicker chip and imposes a larger stain on the chip.

69
(a) Shear strain (b) predicted machined chip thickness Figure 3.5. Average shear strain and chip thickness for cutting of Al 6061 T6 under conditions
Al1-3.
3.3.2. Grain Refinement
Figure 3.6 shows the model predicted steady-state distributions of equivalent strain,
total dislocation density and grain size in the OFHC Cu workpiece under cutting condition Cu3 at
a cutting speed of 0.6 m/s with a -5° rake angle tool. Generally, it is noted that the simulated
dislocation field stops evolving as the chip morphology reaches a steady state during the
simulation. Ni and Alpas investigated material microstructural evolution of annealed OFHC Cu
under the same cutting condition [25], and their measured TEM micrographs at three different
stages of chip formation, i.e., bulk material prior to cutting, primary deformation zone and chip,
are also shown in Figure 3.6 along with the model predictions. As can be seen in the TEM
micrograph I, prior to cutting and straining, loosely tangled dislocation structures are present in
the coarsely-grained annealed bulk material. The equivalent strain drastically increases as the
workpiece material passes the shear plane and enters the primary deformation zone, and the
dislocation cell structures are greatly elongated due to severe straining as can be observed from
the TEM micrograph II. New dislocations dramatically increase on the cell walls and some are
blocked by the subgrain boundaries. As the deformation continues into the steady-state chip
zone, elongated subgrains break up and are reoriented into ultrafine equiaxed grains, as can be
confirmed from the TEM micrograph III. In the steady-state chip, the predicted equivalent strain
is unevenly distributed, with the largest strain of about 4 predicted in the secondary shear zone
along the tool-chip contact and on the machined surface. A very steep strain gradient is
predicted in a shallow layer below the machined subsurface. Dislocations accumulate more as

70
strain increases, and hence the two shares a similar contour pattern in the chip. As can be seen
in Figure 3.6, the grain size distribution largely reverses the pattern of the strain and dislocation
density distribution, with finer gains of about 200 nm on the outer regions and coarser grains of
about 300 nm in the center of the chip produced under condition Cu3.
Figure 3.6. Predicted microstructural evolution for cutting of OFHC Cu under conditions Cu3 (a)
Equivalent strain (b) total dislocation density, mm-2 (c) grain size, mm.
I, loosely distribution of dislocations in the bulk material prior to cutting; II, elongated
dislocation cell in the primary deformation zone; III, equiaxed sub-micron grains in the chip [25].

71
The level of strain plays the most significant role in the grain refinement process. Figure
3.7 shows the model predicted histograms of the refined grain size distributions in the machined
chips of Al 6061 T6 under cutting conditions of Al1-3 with the same cutting speed but using tools
with varying rake angles. The predicted ranges of the grain size in the chip were from 80 to 180
nm, 60 to 130 nm and 40 to 110 nm for using 20°, -5° and -20° rake angle tools, respectively.
The model predictions of the average grain size in the machined chips of Al 6061 T6 under these
aforementioned conditions are compared with the measured values as can be seen in Figure
3.8. It can be seen that the predictions of the average grain size were very close to the
measurements at all three levels of strains. Both the measurements and model predictions
show a similar trend such that a more negative rake angle tool can help further reduce the grain
size in the chip by applying a larger strain. The data of the grain size measurement variance was
not available to the authors and hence is not shown in this study.

72
(a)
(b)
(c)
Figure 3.7. Predicted grain size distribution in the chips for Al 6061 T6. (a) Rake angle of 20° (b) rake angle of -5° (c) rake angle of -20°.

73
Figure 3.8. Grain size in the chips for Al 6061 T6 under conditions Al1-3 with varying tool rake angles.
The effects of the other important cutting parameters such as cutting speed and cutting
temperature were investigated in this study with simulations of cutting of OFHC Cu under
various cutting conditions and the simulation results are given in Table 3.5. The average
equivalent strain, , and the average temperature rise, , in the chip were obtained by
averaging the simulated von Mises equivalent strains and temperature rises in the chip above
the primary deformation zone, respectively. The model predictions of the average grain size in
the chip generally matched well with the measured values for all the tests of Al 6061 T6 and
OFHC Cu under varying cutting conditions except for a greater discrepancy under the cutting
condition Cu4 at a high cutting speed of 1.25 m/s. The effects of the cutting speed, tool rake
angle and cutting temperature on the resultant grain size in the chip are depicted in Figure 3.9.
Comparing cutting tests of Cu2 and Cu4 with the same cutting tool and similar applied strains, it
is readily seen that a high cutting speed of 1.25 m/s caused a 126 °C temperature rise in the
chip, while a low cutting speed of 0.05 m/s induced only a 27 °C temperature rise. Strain rates
of about 200 and 4,000 s-1 were predicted for tests Cu2 and Cu4, respectively. Both the high
strain rate and high temperature in the chip of test Cu4 contributed to a coarser grain size of 1
to 2 µm than a finer grain size of about 0.4 µm of test Cu2. Comparing cutting test Cu3 to Cu4
with similar cutting temperatures, we can see that a combined effect of a larger strain of 1.56
and a lower cutting speed of 0.6 m/s contributed to a finer grain size of about 200 nm in test

74
Cu3. In other words, small applied strain, high cutting speed and high cutting temperature are
all the factors contributing to a coarser grain structure during cutting, and vice versa. Altering
the applied strain by selecting different rake angle tools might not be effective in designing grain
refinement experiments if the effects of other cutting parameters are omitted. This further
validates the necessity of developing such a numerical model as in this study, which captures
the underlying physics during the cutting process by considering all the important process
parameters.

75
Table 3.5. Simulation results for orthogonal cutting of Al 6061 T6 and OFHC Cu.
Material Test Feed (mm)
Rake angle, α
(°)
Initial grain size
(µm)
Cutting speed (m/s)
Average equivalent strain
in chip,
Average temperature
rise in chip, (°C)
Measured grain size in chip (nm)
Predicted grain size in chip (nm)
Al 6061 T6
Al1
Al2
Al3
0.15
0.15
0.15
20
-5
-20
~75
~75
~75
0.01
0.01
0.01
~0.89
~1.85
~3.01
~8
~12
~16
~150
~80
~80
164±30
110±18
72±12
OFHC Cu
Cu1 0.11 -20 ~50 0.02 ~2.96 ~12 216±104 244±20
Cu2 0.3 20 ~50 0.05 ~0.86 ~27 446±262 357±40
Cu3 0.3 -5 ~50 0.6 ~1.56 ~135 220±95 274±25
Cu4 0.3 20 ~50 1.25 ~0.88 ~126 1135±559 559±50
Figure 3.9. Grain size in the chips for OFHC Cu under conditions Cu1-4 with varying cutting speeds.

76
Geometrically necessary dislocation densities were simulated for cutting of OFHC Cu
under conditions Cu2 and Cu4 with the developed numerical framework and the grain
misorientation angles were predicted. Figure 3.10 shows the histograms of the misorientation
angle distributions predicted by the numerical model to the measured one under cutting
condition Cu4. A reasonably good agreement can be seen between the predicted and measured
distributions of misorientation angle. The measurement data showed that 67% and 85% of the
misorientations were below 15° and 40° for test Cu4, respectively, while the model prediction
showed that 69% and 88% of the misorientations were below 15° and 40°, respectively. The
measured average grain misorientation angles were 17° and 29° for cutting tests of Cu4 and
Cu2, respectively, while the model predicted the average misorientation angles of 19° and 35°
for cutting tests of Cu4 and Cu2, respectively. It can be seen that a low cutting speed of 0.05
m/s and a low temperature rise of 27 °C under the condition Cu2 produces a more randomly
orientated microstructure than a high cutting speed of 1.25 m/s and a high temperature rise of
126 °C under the condition Cu4.
Figure 3.10. Grain misorientation angle distribution for cutting test Cu4 at a cutting speed of 1.25 m/s.

77
3.3.3. Discussions
Smaller variances in the grain size were simulated, compared to the measured data.
The variance in the measured grain size data ranged from about 100 nm for a more uniform
equiaxed grain structure to about 500 nm for a mixed grain structure with both fine and coarse
grains existing. The discrepancy, particularly the one under condition Cu4 at a high cutting
speed of 1.25 m/s, between the measurement and model prediction variances are possibly
caused by the following reasons. First, a uniform grain size distribution was assumed as the
initial condition in the simulations, which omitted the significant variance of the grain sizes
usually seen in the bulk material prior to cutting. The initial inhomogeneous microstructure
might play a role in the grain size variance of the resultant microstructure after the cold
deformation by high-speed cutting. Second, the model output the grain size by using Eq. 3.6
and used a constant K for the calculation of grain size, which might over-simplified the grain
size-dislocation density relationship. Finally, although twinning usually exists in the material
before the primary deformation zone and diminishes as the material enters the chip with an
increase of strain, deformation twins might be retained in the chip at a higher cutting speed
[154] and affect the dislocation mobility and grain refinement to some extent. A bimodal
distribution of grain size of 500 nm and 2 µm was experimentally observed in the machined chip
produced at a high cutting speed of 1.25 m/s under condition Cu4 [34]. The coarser grains in
this case might be a result of the grain dynamic recovery due to a high temperature (the
predicted maximum temperature in the chip was about 180 °C) and the retained twins at the
high cutting speed of 1.25 m/s. Nonetheless, the model predicted average grain sizes are in
good agreement with the measurement for all the conditions, and the effect of the tool rake
angle, cutting speed and cutting temperature are all well captured by the numerical model.
Particular forms of equations have been used to describe the shape of the
misorientation angle distribution: for example, a Rayleigh distribution function was used to
model the misorientation angle distribution induced by a severe deformation and a scaling
analysis was conducted to determine the distributions at particular strains [155]. The numerical
framework developed in this study simulates the misorientation of all dislocation cells and the
misorientation angle distribution is obtained without imposing any predefined probability
density functions. The misorientation angle modeled this way has been fully integrated with the

78
dislocation density-based material model, which can be easily adapted for different processes
with different materials.
3.4. Summary
In this chapter, a dislocation density-based numerical framework was developed to
simulate grain refinement in orthogonal cutting of Al 6061 T6 and OFHC Cu at strain rates as
high as 4,000 s-1. The dislocation density-based material models were calibrated to reproduce
the observed material constitutive behaviors under various strains, strain rates and
temperatures similar to those occurring in the cutting and cold rolling processes. Multiple
orthogonal cutting tests, cutting speed ranging from 0.01 to 1.25 m/s, rake angle ranging from -
20° to 20°, and depth of cut ranging from 0.1 to 0.3 mm, were simulated using the CEL finite
analysis embedded with the dislocation density subroutines to investigate the effects of cutting
parameters on the grain refinement mechanism during cutting.
The CEL model predictions of steady-state chip formation, strain and strain rate
distributions in the chip all matched well with the actual measurements. The model predictions
of the average grain size in the chip generally matched well with the measured values for all the
tests of Al 6061 T6 and OFHC Cu under varying cutting conditions. Both the measurements and
model predictions showed that the grain size in the machined chips of Al 6061 T6 were refined
from an initial grain size of 75 µm to about 160, 100 and 80 nm under varying levels of applied
shear strains ranging from 1.8 to 5.2 imposed by tool rake angles ranging from 20° to -20°.
Selecting a more negative rake angle tool generally helps further reduce the grain size in the
chip for applying a larger strain, but cutting speed and cutting temperature also have to be
carefully designed to obtain an optimum microstructure in terms of both grain size and
misorientation angle. A small applied strain, high cutting speed and high cutting temperature all
contribute to a coarser elongated grain structure during cutting, while a more randomly
orientated microstructure would be achieved at a low cutting speed. The simulation results
demonstrated that the essential characteristics of the deformation field and grain refinement
mechanism during cutting were well captured by the dislocation density-based material models.
The numerical framework developed in this study has been shown to be a useful tool to predict

79
grain refinement and can be used to better design cutting process parameters to achieve
optimum refined microstructures.

80
CHAPTER 4. PHASE CHANGE MODELING IN MACHINING
This chapter is concerned with prediction of the phase change effect on orthogonal
cutting of AISI 1045 steel. A metallo-thermo-mechanical coupled material model is developed,
and the CEL finite element model is used to solve the evolution of phase constituents, cutting
temperature, chip morphology, and cutting force simultaneously using ABAQUS. The model
validity is assessed using the experimental data for orthogonal cutting of AISI 1045 steel under
various conditions.
4.1. Phase Transformation Kinetics
To account for the evolution of the phase composition of the workpiece material during
machining, phase transformation kinetics is solved simultaneously with the energy equation at
each time step. For a more detailed presentation of the kinetics model, readers are referred to
the work by Skvarenina and Shin [123] and Bailey et al. [121], but a brief explanation is given
below.
The workpiece material, AISI 1045 steel, had a uniform microstructure of 57% pearlite
and 43% ferrite with an average grain size of 3-8 µm prior to machining [156]. The phases
formed by diffusive transformation during cooling are classified as ferrite, pearlite and bainite,
while martensite forms via a diffusionless transformation. During heating above the AC1
eutectoid temperature, pearlite and ferrite-pearlite interface transform to austenite and ferrite-
austenite interface, respectively. According to Ashby and Easterling [122], the pearlite
dissolution is governed by
2L Dt (4.1)
where D is the diffusion coefficient, L is the radius of the pearlite colony, λ is the average plate
spacing in the pearlite colony, and t is time. The pearlite colony radius can be approximated by

81
1/32 i
gL
f (4.2)
where g is the average grain size and fi is the volume fraction of pearlite within the material.
Since metal cutting is non-isothermal, D is a function of temperature. The quantity Dt is given
by
2
1
0 exp( )
t
t
QDt D dt
RT t
(4.3)
where D0 is the pre-exponential coefficient of carbon diffusion in ferrite and Q is the activation
energy. This equation is integrated from the time when the temperature rises above the AC1
eutectoid temperature until the current time in the model. The cell transforms to either
austenite or ferrite-austenite interface depending on its initial condition, once the following
relationship is satisfied:
2
1
02 exp .( )
t
t
QL D dt
RT t (4.4)
As the workpiece begins to cool, austenite is transformed to martensite if the cooling
rate is fast enough or to bainite if the cooling rate is slower. In order to determine if bainite
formation will occur, the current cooling time of a material undergoing non-isothermal
transformation is compared with the amount of time required to begin bainite formation in an
isothermal process. Sheil’s Additivity Rule discretizes the process over a number of time steps,
allowing for non-isothermal calculations [121]. If the integral in Eq. 4.5 reaches a value of 1
before the temperature drops below the martensite formation temperature, bainite will begin
to form [157].
0
1.t
a
dt
t T (4.5)
Here dt is the length of a time-step, ta(T) is the incubation time required isothermally at
temperature T for bainite to form, and t is the current cooling time of an austenite cell in the
model. Under the parameters used in this study, bainite is not formed because the cooling rate
is sufficiently fast, thereby avoiding formation of bainite. Once the temperature has dropped

82
below the martensite formation temperature, Ms, the following equation is used to calculate the
volume fraction of martensite in the cooling process [121, 158-161].
0.011* 1 .sM T
mf f e (4.6)
Here fγ* is the volume fraction of austenite at the time when temperature reaches Ms. If the
cooling rate is sufficiently fast, i.e., no bainite is formed, all austenite that does not change into
martensite will be considered retained austenite. The specific coefficients of the phase
constituents and other relevant microstructural properties were determined from literature
data [121, 162-164] for AISI 1045 steel, summarized in Table 4.1. The percent volume change
(ΔV/V) due to phase transformation from one phase to another is also given in Table 4.1.
Table 4.1. Microstructural properties for AISI 1045 steel [121, 162-164].
Property Value Property Value
Pre-exponential carbon in ferrite, Doα
6 x10⁻⁵ m2/s
Initial volume fraction of pearlite, f
57%
Pre-exponential carbon in austenite, Doγ
1x10⁻⁵ m2/s ΔV/Vp-γ, pearlite to austenite -0.33%
Activation energy ferrite, Qα 80 kJ/mol ΔV/Vα-γ, ferrite to austenite -0.38%
Activation energy austenite, Qγ 135 kJ/mol ΔV/Vγ-M, austenite to martensite
1.026%
Universal gas constant, R 8.314
J/molK AC1 (°C) [163] 727
Pearlite grain spacing, λ 0.5 m AC3 (°C) [163] 800
Diameter of pearlite grain, L 5 m MS (°C) [164] 324
4.2. Constituent Phase Properties of AISI 1045 Steel
The AISI 1045 steel workpiece has an initial microstructure of ferrite-pearlite prior to
machining. When the material temperature is raised above its austenitic temperature, the
ferrite-pearlite transforms to austenite, and then the austenite transforms to martensite as the
temperature cools down quickly. Table 4.2 shows the temperature-dependent physical
properties of constituent phases of ferrite-pearlite, austenite and martensite for AISI 1045 steel
adopted from literature data [164-168]. Figure 4.1 plots the temperature-dependent physical
properties of constituent phases for AISI 1045 steel, which clearly shows the radical difference in

83
thermo-mechanical properties such as density, thermal conductivity and specific heat for
different constituent phases.
For AISI 1045 steel consisting of pearlite and ferrite prior to the phase change, Jaspers
and Dautzenberg [169] experimentally obtained the material parameters in the Johnson-Cook
(JC) constitutive plasticity model using the split-Hopkinson pressure bar (SHPB) tests at
temperatures ranging from room temperature to 500 °C. However, Burns et al. [129] conducted
SHPB tests of the AISI 1045 steel specimens at various temperatures from 644 °C to 942 °C, and
reported that the specimens tested at temperatures higher than 800 °C showed a drastic
decrease in material strength than those at temperatures from room temperature to 651 °C.
Their SHPB measurements showed that the JC model only works for AISI 1045 steel at low
temperatures prior to phase transformation. As the material temperature increases and phase
transformation occurs, a different constitutive model is needed to correctly describe the
mechanical behavior for AISI 1045 steel. The same phenomenon of drastic change in
constitutive behavior was also observed for another carbon steel (AISI 1075 steel) due to
transformation of pearlite to austenite at temperatures ranging from 588 °C to 875 °C [128].

84
Table 4.2. Physical properties of constituent phases for AISI 1045 steel.
Property Phase Temperature-dependent functions
Elastic modulus E (GPa)
Austenite (>1073 K) [165] 227.08 0.0929E T
Ferrite-Pearlite (<873 K) [166] 250.29 0.1086E T
Martensite (<873 K) [165] 214.9 0.0533E T
Density ρ (kg/m3)
Austenite (>1041 K) [164] 8190 0.49T
Ferrite-Pearlite (<985 K) [164] 27919.7 0.2149 0.000102T T
Martensite [167, 168] 7859.5 0.2667T
Poisson ratio ν
Austenite (>1073 K) [165] 0.345
Ferrite-Pearlite (<873 K) [166] 0.30
Martensite (<873 K) [165] 50.2667 5 10 T
Thermal expansion α (10-6K-1)
Austenite (>1073 K) [165] 21
Ferrite-Pearlite (<973 K) [166] 8.8608 0.0068T
Martensite (<873 K) [121] 11
Thermal conductivity k (W/m·K)
Austenite (>1073 K) [166] 2295.36 0.4382 0.0002k T T
Ferrite-Pearlite (<973 K) [166] 51.638 0.0228k T
Martensite (<873 K) [165] 49.052 0.0217k T
Specific heat Cp (J/kg·K)
Austenite (>1041 K) [164] 439 0.1142pC T
Ferrite (<873 K) [164] 2435 0.102 0.000541pC T T
Ferrite-Pearlite (<873 K) [164] 2447 0.081 0.000495pC T T
Martensite (<873 K) [165] 416.2 0.2862pC T

85
Figure 4.1. Temperature-dependent physical properties of phases for AISI 1045 steel (data from [164-168]).
The constitutive models for AISI 1045 steel of austenite and martensite were adopted
from the work by Iwamoto et al. [170], who reported constitutive equations for the primary
phases of martensite and austenite of the 304 austenitic stainless steels with 0.06wt% carbon.
The constitutive models for austenite and martensite considering strain, strain rate and
temperature are given as follows:
352
mC C TC ε
1 4e .σ C 1 e Co
(4.7)
Table 4.3 shows the constitutive model parameters for all the constituent phases of AISI 1045
steel. Figure 4.2 shows the predicted flow stresses for AISI 1045 steel in the temperature range
from the ambient to 1000 °C in comparison with the experimental data in [129]. It can be seen

86
that the predicted material behaviors match well with the experimental data obtained at
different temperatures with different phase compositions.
Table 4.3. The constitutive model parameters of constituent phases for AISI 1045 steel.
Figure 4.2. Constitutive model predictions vs. SHPB test results (SHPB data from [129]).
4.3. Metallo-thermo-mechanical Coupling
In the course of phase transformation during the cutting process, an additional strain is
induced by the microstructure evolution along with the mechanical and thermal strains. The
phase transformation also produces transformation-induced plasticity. This can be represented
analytically by adding a separate strain component to the total strain function. Hence, the total
0
200
400
600
800
1000
1200
0 200 400 600 800 1000
Stre
ss (
MP
a)
Temperature (°C)
SHPB data
Predicted
= 4000 s-1
ɛ=0.1
Ferrite-Pearlite
Austenite
Phase AJC
(MPa) BJC
(MPa) nJC CJC mJC o
(1/s)
Tm (K)
Ferrite-Pearlite (<773 K)
[129, 169] 553.1 600.8 0.234 0.0134 2 1 1733
Phase m o
(1/s) C1 C2 C3 C4 C5
Austenite [170, 171] 0.01 5E-4 2084.2 0.31 0.58 1023.9 0.005
Martensite [170, 171] 0.01 5E-4 1180.7 17.8 7.66 1983 0.0059

87
strain increment ( ) for a steel undergoing solid-state phase transformation can be written as
the sum of the individual components of the strain as follows [121, 158-160, 172]
E P T V TrP (4.8)
where E , P , T , V and TrP represent the strain increments due to elastic, plastic,
thermal, volumetric dilatation and transformation-induced plasticity, respectively. The elastic
strain increment E is calculated using the isotropic Hook’s law with temperature-dependent
Young’s modulus and Poisson’s ratio for different constituent phases as given in Table 4.2. The
rate-independent constitutive models were used for the plastic strain increment of P . The
thermal strain increment T is computed using the coefficient of thermal expansion by [121,
173]
Ti if T (4.9)
where fi is the phase fraction of phase i, and αi is the coefficient of thermal expansion for phase
i, which are given in Table 4.2. When a given volume in a workpiece undergoes transformation
from one phase to another, the microstructural pattern transforms. For example, austenite
changing to martensite will transform from a face-centered cubic (FCC) body structure to a
body-centered tetragonal (BCT) structure, thereby dilating the volume. The strain increment
due to this volumetric dilatation is given by [121, 172]
1
3V V
fV
(4.10)
where the percent volume change ΔV/V due to phase transformation from one phase to
another is given in Table 4.1 and Δf is the change in phase fraction during the time increment.
Unlike austenitic transformation, the formation of martensite induces transformation plasticity,
which is also produced when dilatational strains interact with the already-existing stress field
[121, 158, 159]. It has been reported that transformation plasticity produces a mechanical
effect on the stresses and strains equivalent to that induced when the yield stress of the steel is
reduced by a certain extent over the phase transformation temperature range [174, 175]. Lee
and Chang [158, 159] reported that a reduction of 30 MPa in the value of yield stress can

88
represent the mechanical effect of transformation plasticity via the formation of martensite.
This simplified and approximate approach is employed in this work in order to incorporate the
transformation plasticity into the FE model.
4.4. Simulations
4.4.1. Implementation of the Material Models
The metallo-thermo-mechanical coupled material model was implemented in the
commercial software ABAQUS 6.11.1 Explicit using the user-defined material subroutines of
VUHARD and VUSDFLD programmed in FORTRAN. A flowchart showing the various steps in the
computational scheme employed in this work is given in Figure 4.3. The evolution of phase
constituents of the workpiece material was modeled in the user-defined subroutine of VUSDFLD
using the phase transformation kinetics model described in Section 4.1. The user defined state
and field variables for the phase constituents were constantly updated from the inputs of the
thermal and mechanical fields. The thermo-mechanical properties of the workpiece material
were defined using metallurgical field variable-dependent data as given in Section 4.2. The
constitutive plasticity models for the phase constituents were implemented in the user-defined
subroutine of VUHARD, which included the material behavior dependent on metallurgical field
variables and defined the derivatives of the yield stress with respect to the independent
variables, such as strain, strain rate, and temperature. In VUHARD, the phase fraction of each
phase is used to calculate the phase-dependent volumetric dilatation strain, and account for the
effect of transformation-induced plasticity strain. NLGEOM flag was used within the
ABAQUS/Explicit step to specify a large-displacement formulation and to ensure applicability to
finite deformation/strain in the simulation. Abaqus/Explicit internally uses classical J2 plasticity
theory to generalize the scalar model given in the VUHARD user subroutine to multiaxial stress
states in the simulation [139]. During the simulation, the material subroutines were constantly
called at all material points of elements to calculate the material flow stresses and the user-
defined solution-dependent metallurgical field variables.

89
Figure 4.3. Flowchart for implementation of the material model.
4.4.2. Orthogonal Cutting Experiments of 1045 Steel
In order to assess the validity of the coupled metallo-thermo-mechanical analysis
solution presented in this study, a set of orthogonal cutting experiments as given in Table 4.4
was simulated for AISI 1045 steel, and the modeling results are compared with the experimental
data presented in [156, 176-178]. Orthogonal cutting tests A1-A8 as shown in Table 4.4 were

90
conducted for AISI 1045 steel by Ivester et al. [156] with varying cutting speeds (V) of 200 and
300 m/min, feeds (f) of 0.15 and 0.3 mm and rake angle (α) tools of 5° and -7° using a general
purpose uncoated tungsten carbide / cobalt (WC/Co) insert (grade, Kennametal K68). The AISI
1045 steel workpieces had an equiaxed grain structure of a grain size of 3-8 µm [156]. Prior to
machining, the workpiece microstructure was a homogeneously distributed mixture of a pearlite
volume fraction of 57% and a ferrite volume fraction of 43%. Orthogonal cutting tests B1-B4
shown in Table 4.4 were conducted by Iqbal et al. [166, 178] for a wide range of cutting speeds
from 198 to 879 m/min with a constant feed of 0.1 mm. They used a commercially available
uncoated tungsten carbide insert (Sandvik 5015) with a rake angle of 0°. Widths of cut (W) of
1.6 mm and 2.5 mm were applied to tests A1-A8 and B1-B4, respectively, while an edge radius
(re) of 0.02 mm was used for the sharp cutting edge of the tools for all the tests. All the
experiments were conducted without any coolant. The effects of cutting speed, feed and tool
rake angle are discussed using tests A1-A8, while significantly higher cutting speeds of 628
m/min and 879 m/min in tests B1-B4 are used to further examine the effect of high cutting
speed on phase transform during cutting of AISI 1045 steel.
Table 4.4. Orthogonal cutting conditions for AISI 1045 steel [156, 178].
Test V (m/min) f (mm) α (°) re (mm) W (mm)
A1 200 0.15 5 0.02 1.6
A2 300 0.15 5 0.02 1.6
A3 200 0.15 -7 0.02 1.6
A4 300 0.15 -7 0.02 1.6
A5 200 0.3 5 0.02 1.6
A6 300 0.3 5 0.02 1.6
A7 200 0.3 -7 0.02 1.6
A8 300 0.3 -7 0.02 1.6
B1 198 0.1 0 0.02 2.5
B2 399 0.1 0 0.02 2.5
B3 628 0.1 0 0.02 2.5
B4 879 0.1 0 0.02 2.5

91
The orthogonal cutting tests investigated in Table 4.4 were all conducted using
continuous turning setups [156, 178], and therefore it is essential to model steady-state cutting
in this numerical study. The CEL finite element model was used to simulate 2D steady-state
orthogonal cutting using the commercial software Abaqus 6.11.1. The metallo-thermo-
mechanical coupled material model developed was used for the workpiece material in the 2D FE
simulations, while the physical properties of the two carbide tool materials used in the
simulations can be found in [156, 176-178].
To define the tool-chip interface behavior, cutting speed-dependent frictional
coefficients were used in the simulations for the cutting tests with varying cutting speeds. The
applied frictional coefficients were 0.75, 0.73, 0.7, 0.65 and 0.6 for cutting speeds of 200 (as well
as 198), 300, 628 and 879 m/min, respectively, which were adopted from the study of frictional
behavior in cutting of AISI 1045 steel using uncoated carbide tool at various cutting speeds [178].
A gap conductance of 104 W/K·mm2 was defined for the heat transfer at the tool-chip interface
as in [179]. When the tool face node had no contact with the chip and the workpiece, the gap
conductance was set to zero. It was adopted from [180] that 90% of the dissipated energy
caused by friction between the chip and the tool face is converted into heat, and the fraction of
the heat generation by plastic deformation was set to be 0.9. A mesh-sensitivity analysis was
conducted in several trial simulations, and the optimal mesh scheme was found to have about
6000 elements in total with the minimum element size of 3-5 µm in the workpiece, which
considers both computational precision and time. To determine if cutting simulation reaches its
steady state, a long enough cutting time, say 0.002 s for a cutting speed of 200 m/min, was used
to ensure that the chip morphology, mechanical, thermal and metallurgical fields all remain
unchanged as the cutting time further increased. One of the main drawbacks of machining
simulation by FEM is the extremely high computational cost of simulations. Using the CEL
model, the computational time was reduced to about 4 hours per simulation from more than 20
hours when using a Lagrangian model with ALE in simulating steady-state chip formation for
orthogonal cutting conditions given in Table 4.4.

92
4.5. Simulation Results
Simulation results are presented for chip formation, cutting force, cutting temperature
and volume fraction of the phase transformed in the chip produced by orthogonal cutting and
compared with the actual experimental data. Figure 4.4 shows the steady-state distributions of
temperature, Mises stress and phase composition predicted for orthogonal cutting tests of A7
and A8 conducted at the depth of cut of 0.3 mm with -7° rake angle tools but at different cutting
speeds of 200 and 300 m/min. The temperature distribution is shown in the workpiece, chip,
and tool while the stress and phase distributions are only shown in the workpiece and chip in
Figure 4.4. The simulated steady-state chip morphologies, as can be seen in Figure 4.4, show
that a lower cutting speed of 200 m/min produces an average deformed chip thickness (tc) of
0.71 mm from an uncut chip thickness (t1) of 0.3 mm and a shear angle (φ) of 21°. Increasing
the cutting speed to 300 m/min produces a thinner tc of 0.62 mm and a higher φ of 23°. Figure
4.4a and b show the temperature fields predicted by the model and it can be seen that as the
material passes the shear plane, the temperature is predicted to be drastically increased from
ambient temperature to about 340 °C and 380 ° C for cutting speeds of 200 and 300 m/min,
respectively. This is mainly contributed by the heat generation due to the severe shear plastic
deformation. As the material deformation continues into the steady-state chip, much higher
temperatures are predicted in the secondary shear zone mainly due to the friction between the
tool and chip contact interface. The maximum tool-chip interface temperature (Tint) is predicted
to be 1192 °C and 1326 °C for cutting speeds of 200 and 300 m/min, respectively. When cutting
reaches steady state, very steep temperature gradients are predicted to exist at the tool-chip
interface and also in a shallow layer below the machined surface. It can be seen in Figure 4.4c
and d that the simulated von Mises stress in the primary shear zone is about 1,280 MPa for both
cutting speeds. The predicted phase compositions in the chips are illustrated in Figure 4.4e and
f: a layer of material close to the tool-chip interface has transformed from the original mixture
of pearlite and ferrite to either pure austenite, or mixture of austenite and ferrite due to the
increasing temperature. The thickness of the phase transformed layer was predicted to be 0.14
and 0.16 mm, which accounts for a volume fraction of 19% and 26% of the steady-state chip for
cutting speeds of 200 and 300 m/min, respectively. No phase transformation was predicted on
the machined subsurface.

93
Table 4.5 summarizes the details of the model predictions of: maximum tool-chip
interface temperature (Tint-pred), volume fraction of the transformed austenite (fgamma) in the
steady-state chip, cutting force (Fc-pred) in the tangential direction, thrust cutting force (Ft-pred) in
the radial direction, average thickness (tc-pred) of the steady-state chip, cutting ratio (rpred= t1 / tc-
pred) and shear angle (φpred). Their experimentally-obtained counterparts extracted from [156,
176-178] are also given in Table 4.5 for orthogonal cutting of AISI 1045 steel. All the force data
in Table 4.5 is normalized by using the width of cut. The cutting temperature was not measured
for tests B1-B4; hence the temperature measurement data was not available for these tests.
Note for tests B1-B4 only the average values were reported in literature, and therefore the
variance of the experimental data is not discussed for those tests.

94
Figure 4.4. Predictions of temperature, Mises stress and phase field for tests A7 and A8.

95
Table 4.5. Comparison of model predictions with experimental data from [156, 176-178].
Test Fc-meas
(N/mm) Ft-meas
(N/mm) Tint-meas
(°C) tc-meas
(mm) rmeas
φmeas
(°) Fc-pred
(N/mm) Ft-pred
(N/mm) Tint-pred
(°C) fgamma
(%) tc-pred
(mm) rpred
φpred
(°)
A1 354 227 1250 0.42 0.36 20 417 191 1080 24% 0.44 0.34 19
A2 334 183 1300 0.37 0.41 23 361 171 1198 30% 0.38 0.39 22
A3 385 297 1120 0.46 0.33 17 443 257 1109 25% 0.47 0.32 17
A4 374 255 1310 0.43 0.35 18 391 209 1250 35% 0.42 0.36 19
A5 587 298 1220 0.62 0.48 27 659 301 1171 17% 0.59 0.51 28
A6 600 313 1300 0.64 0.47 26 607 278 1281 20% 0.56 0.54 29
A7 725 420 1100 0.75 0.40 21 744 389 1192 19% 0.71 0.42 22
A8 642 375 1305 0.66 0.45 23 633 331 1326 26% 0.62 0.48 24
B1 227 166 - 0.25 0.39 22 235 135 1037 28% 0.29 0.34 20
B2 209 144 - 0.24 0.42 23 219 119 1307 48% 0.27 0.37 21
B3 196 123 - 0.21 0.47 25 205 105 1351 58% 0.26 0.38 22
B4 199 123 - 0.21 0.48 26 209 109 1396 79% 0.24 0.42 24

96
The steady-state chip morphology varies greatly in cutting tests with different cutting
parameters, and the accuracy of the numerical model was first assessed on the deformation
field by comparing the average deformed thickness of the steady-state chip predicted by the
model with the experimental data as shown in Figure 4.5. The model predicted that a more
negative rake angle produces a thicker chip and imposes a larger stain. For instance, the
predicted average machined chip thicknesses were 0.59 mm and 0.71 mm for the rake angle of
5° and -7° in tests A5 and A7, respectively, with other machining parameters remaining the
same; while the measured average machined chip thicknesses were 0.62 mm and 0.75 mm for
tests A5 and A7, respectively. The model also accurately predicted deformed chip thickness for
different feeds, i.e., uncut chip thickness in an orthogonal cutting operation. For example, in
tests A3 with a feed of 0.15 mm and A7 with a feed of 0.3 mm, the predicted average machined
chip thicknesses were 0.47 mm and 0.71 mm, respectively, which are in good agreement with
the measured chip thicknesses of 0.46 mm and 0.75 mm, respectively. As for the effect of
cutting speed as demonstrated in Figure 4.5b, the model correctly captured a decreasing trend
in chip thickness as cutting speed increases, which matched well with the measurement data
obtained by Iqbal et al. [178].
Figure 4.5. Comparison of the deformed chip thickness predicted with the experimental data from [156, 178].

97
The model performance is demonstrated in Figure 4.6 on the thermal and metallurgical
fields. The accuracy of the model predictions on cutting temperature is assessed by a direct
comparison of the maximum tool-chip interface temperatures predicted by the model with the
experimental data extracted from [156, 176, 177] for orthogonal cutting tests A1-A8 with
varying cutting speeds, feeds and tool rake angles. The model predicted an increase in Tint of
110-140 °C as the cutting speed increased from 200 m/min to 300 m/min for various
combinations of feeds of 0.15 mm and 0.3 mm and tool rake angles of 5° and -7°, which is in a
good agreement with the experimentally-determined temperature increase of 50-195 °C. The
discrepancy between the model predictions of Tint and experimental data is well below 10% (or
below 100 °C) for the tests conditions, with a slight larger discrepancy of 14% for test A1.
The volume fraction of the transformed austenite predicted in the steady-state chip is
also shown in Figure 4.6 for various cutting parameters. The transformed austenite accounts for
volume fractions of 17%-35% of the chips produced by tests A1-A8. Due to a higher cutting
temperature at a higher cutting speed, the model predicted a 3-10% increase in fgamma as the
cutting speed increases from 200 m/min to 300 m/min for various combinations of feeds of 0.15
mm and 0.3 mm and tool rake angles of 5° and -7°. The model predicted a 1-8% increase in
fgamma when the tool rake angle changes from 5° to -7° while the other cutting parameters
remaining the same. A 5-10% decrease is predicted as the feed is increased from 0.15 mm to
0.3 mm, which is mainly caused by the significant increase of the deformed chip thickness at
feed increases. As the feed decreases to 0.1 mm and cutting speed increases from 198 m/min
to as high as 879 m/min in tests B1-B4, higher volume fractions of 28-79% of the transformed
austenite are predicted, which further shows the significant effect of cutting speed and feed on
phase transformation in the chip during cutting of AISI 1045 steel.

98
Figure 4.6. Prediction of volume fraction of austenite in the chip and comparison of the predicted Tint with experimental data from [156, 176, 177].
The validity of the model is further presented in Figure 4.7 with cutting force predictions
in comparison with the measured force data from [156, 178]. It can be seen in Figure 4.7 that
the model predicted cutting forces are generally higher than the measured average forces, while
the predicted thrust forces are generally lower than the measured values. The discrepancies
between the model predictions and the experimental data in Fc are mostly below 8% for the 12
test conditions, while the prediction errors in Ft range mostly from 10% to 19%. The model
correctly predicted the effect of cutting speed on force: both Fc and Ft decrease as the cutting
speed increases with the other cutting parameters remaining the same. For instance, as the
cutting speed increases from 198 m/min to 879 m/min for tests B1-B4, the predicted Fc drops
from 235 N/mm to 209 N/mm compared with an experimentally-determined decrease from 227
N/mm to 199 N/mm. The predicted Ft drops from 135 N/mm to 109 N/mm compared with an
experimentally-determined decrease from 166 N/mm to 123 N/mm. The model also predicted
an increase in both Fc and Ft when using a more negative rake angle from 5° to -7° for tests A1-
A8.

99
Figure 4.7. Comparison of the predicted cutting force with experimental data from [156, 178].
4.6. Discussions
This analysis is focused on steady-state cutting of AISI 1045 steel and the phase
composition of the chips separated from the bulk workpiece. The volume fractions of the
transformed austenite predicted in the steady-state chips cannot be directly assessed in this
analysis because of a lack of experimental data for phase compositions in the chips. Also, most
of the transformed austenite in the chips nearby the tool-chip interface would become
martensite due to quenching at a rapid cooling rate, while a part of austenite that does not
change into martensite turns into retained austenite. Han et al. [163] conducted orthogonal
cutting tests of AISI 1045 steel with no martensite and retained austenite in its initial
microstructure at cutting speeds of 100-200 m/min with severely worn carbide tools and
measured the volume factions of retained austenite on the machined surface. Their study
showed that retained austenite was found remaining on the machined surface, which was due
to a large amount of frictional heat, generated using the severely worn tool. The volume
fraction of retained austenite increased from 5% to 15% as the cutting speed increased and the
tool wear became more severe. Chou and Evans [36] reported a 22% increase of retained
austenite on the machined surface after hard turning of AISI 52100 steel at a cutting speed of
180 m/min. Ramesh et al. [134] reported the volume fraction of retained austenite increased

100
from 5% to 10% on the machined surface of AISI 52100 steel when the cutting speed increased
from 91 m/min to 273 m/min. These experimental studies corroborate the modeling
predictions of austenite transformation in this analysis.
Regardless of the experimental evidence of phase transformation during cutting of
steels, the metallurgical field has rarely been coupled to the thermo-mechanical analyses of
cutting, and the phase change effect upon the material machinability has often been neglected
in numerical studies. For an ease of implementation, a unified material model is often tried to
cover the workpiece material behaviors both prior to and after phase transformation in cutting.
One most notable case of such models was given by Oxley [181], who modeled the strain-
hardening flow stress dependent on velocity-modified temperature (Tmod) as a function of strain
rate and cutting temperature in the range of room temperature to 1000 °C. Oxley’s model
showed the blue-brittleness effect of steels in cutting experiments, i.e., the flow stress increases
with an increase in modified temperature in the range of 520 K to 640 K, which translates to a
temperature range of 672 °C to 890 °C and overlaps with the critical temperatures of phase
transformation. Lalwani et al. [176] applied an extended Oxley’s theory to model the cutting
forces and cutting temperatures for orthogonal cutting tests A1-A8 of AISI 1045 steel. Figure 4.8
shows the comparison of the temperature and cutting force predicted in this study with the
predicted values by Lalwani et al. [176]. It is can be seen in Figure 4.8 that much larger
discrepancies from the experimental data are predicted by the extended Oxley’s theory in both
cutting forces and temperatures for all the cutting conditions. This indicates that compared
with the approach using a unified material model not coupled with the metallurgical field, the
metallo-thermo-mechanical coupled analysis developed in this study not only has the ability of
predicting phase change but also captures the material behaviors more accurately when a phase
change occurs in cutting.
The better prediction results using the analysis coupled with the metallurgical field also
encourage the development of constitutive models for the basic constituent phases of steel.
Constitutive models are available in literature for only a limited number of steels under their
certain conditions, which will not work well for other types of steel or the same one but with
different microstructures. Ideally, with the development of the constitutive models for different
phases, it is possible to simulate cutting of steel using the metallo-thermo-mechanical coupled
analysis developed in this study only with the knowledge of its phase compositions.

101
Figure 4.8. Comparison of the predicted temperature and cutting force with the predicted values using an extended Oxley’s predictive machining theory from [176].
4.7. Summary
This chapter presented an FE model for orthogonal cutting of AISI 1045 steel based on a
true metallo-thermo-mechanical coupled material model. The metallo-thermo-mechanical
coupled material model was implemented in ABAQUS, and the CEL model was used to simulate
this metallo-thermo-mechanical coupled orthogonal cutting process. The evolution of phase
constituents of the workpiece material was modeled using a phase transformation kinetics
model, and was solved simultaneously with thermal and mechanical fields in cutting. The
thermo-mechanical properties and the rate-independent constitutive models of constituent
phases of ferrite-pearlite, austenite and martensite for AISI 1045 steel were used in the coupled
analysis. Cutting temperatures, phase compositions, chip morphologies, and cutting forces
were all solved simultaneously. The model accurately predicted the chip thickness for different
cutting speeds, tool rake angles and feeds compared with the experimental data. The volume
fractions of the transformed austenite were predicted in the steady-state chips. The model
predicted the tool-chip interface temperature ranging from 1080 °C to 1396 °C for various
cutting conditions investigated, and the discrepancy between the model predictions and the
experimental data was well below 10%. The model was further validated in cutting force with
discrepancies of less than 8% in cutting direction and 10-19% in feed direction.

102
CHAPTER 5. MULTI-PHYSICS MODELING OF MICROSTRUCTURE ALTERATION IN HARD TURNING
This chapter is to quantitatively disseminate the white layer formation through
prediction of the microstructure change using a multi-physics model, which considers both
phase transformation and grain refinement. 3D hard turning simulations are undertaken via
AdvantEdge FEM software incorporating these two mechanisms as user-defined subroutines to
investigate the surface microstructure alteration for AISI 52100 steel.
5.1. Hard Turning Experiments
The workpiece material investigated in this chapter, AISI 52100 steel, is a key alloy in the
manufacture of bearings. The nominal chemical composition of AISI 52100 steel is Fe-
1.05wt.%C-1.54wt.%Cr as given in [36]. In order to assess the validity of the coupled metallo-
thermo-mechanical analysis solution, a set of hard turning experiments was simulated for AISI
52100 steel, and the modeling results are compared with the experimental data in literature.
Tests A1 and A2, as shown in Table 5.1, were conducted by Ramesh et al. [134] with cutting
speeds (V) of 91.4 and 274.3 m/min, a feed (f) of 0.127 mm/rev and depth of cut (doc) of 0.254
mm. Cutting tools used in tests A1 and A2 were low CBN-content inserts (Kennametal KD050
grade, TNG432 geometry) with -5° back rake angle, 0° clearance angle, 0° side cutting angle and
0.8 mm nose radius with no wear. Hard turning tests B1-B5 were conducted by Chou and Evans
[36] at various cutting speeds between 45-180 m/min, with a feed of 0.05 mm/rev and depth of
cut of 0.2 mm. Cutting tools used in tests B1-B5 were 55° diamond-shaped Al2O3-TiC inserts
(Kenametal K090 grade, DNGA432T geometry) with -30° back rake angle, 5° clearance angle and
0.8 mm nose radius with three levels of flank wear land width (VB) of 0.11, 0.21 and 0.3 mm.
Prior to hard turning, the AISI 52100 steel workpieces used in all the tests were heat treated
under a similar condition: austenitization by heating at 829-843 °C, quenching in oil, and then
tempering at 163 °C. The initial microstructure of the workpieces after heat treatment was a

103
tempered martensitic (TM) bulk structure with a hardness of approximately 62 HRC. All the
experiments were conducted without any coolant.
Table 5.1. Hard turning conditions.
Test V (m/min) f (mm/rev) doc (mm) VB (mm)
A1 91.4 0.127 0.254 0
A2 274.3 0.127 0.254 0
B1 180 0.05 0.2 0.11
B2 180 0.05 0.2 0.21
B3 180 0.05 0.2 0.3
B4 90 0.05 0.2 0.3
B5 45 0.05 0.2 0.3
5.2. Models
5.2.1. Material Properties and Constitutive Models of AISI 52100 Steel
Table 5.2 shows the temperature-dependent physical properties of AISI 52100 steel
obtained in [182]. The Johnson-Cook model in [182] defined the constitutive plasticity behavior
of AISI 52100 steel of a tempered martensitic bulk structure with a hardness of 62 HRC, and was
adopted in this study to model its plasticity prior to any phase change. When the material
temperature is raised above its austenitic temperature, the tempered martensite transforms to
austenite (γ), and then the austenite converts to un-tempered martensite (M) as the
temperature cools down quickly. The constitutive models of austenite and martensite were
adopted from the work by Iwamoto et al. [170], who reported constitutive equations for the
primary phases of martensite and austenite of the 304 austenitic stainless steels. The
constitutive models for austenite and martensite considering strain, strain rate and temperature
are given by Eq. 4.7. Table 5.3 shows the constitutive model parameters for all the constituent
phases of AISI 52100 steel.

104
Table 5.2. Physical properties of constituent phases for AISI 52100 steel [182].
Property Temperature-dependent data
Elastic modulus, E (GPa, 297<T <1273 K) 247 0.146E T
Density, ρ (kg/m3) 7827
Poisson ratio, ν (297<T <1273 K) 4 7 20.341 3.31 10 3.55 10T T
Thermal expansion, α (10-6K-1, 297<T <1077 K) 310.2 4.79 10 T
Thermal conductivity, k (W/m·K) 43
Specific heat, Cp (J/kg·K) 458
Table 5.3. Constitutive model parameters of phases for AISI 52100 steel.
Phase AJC (MPa) BJC (MPa) nJC CJC mJC o (1/s) Tm (K)
TM [182] 2482.4 1498.5 0.19 0.027 0.66 1 1697
Phase m o (1/s) C1 C2 C3 C4 C5
γ [170] 0.01 5E-4 2084.2 0.31 0.58 1023.9 0.005
M [170] 0.01 5E-4 1180.7 17.8 7.66 1983 0.0059
5.2.2. Phase Transformation Kinetics and Metallo-thermo-mechanical Coupling
To account for the evolution of the phase composition of the workpiece material during
hard turning, phase transformation kinetics was solved simultaneously with the energy equation
at each time step. The initial workpiece material was defined as a fully tempered martensitic
structure. The small amounts of chromium carbide and retained austenite after the heat
treatment were considered to be negligible [127, 135]. Tempered martensite can further
decompose to ferrite and cementite when heated slowly during a tempering process. However,
heating rates are estimated as high as ~106 K/s in a hard turning process, which shall prevent
martensite from decomposing within the short period of heating cycle [36, 128]. Instead,
diffusionless reverse martensitic transformation may occur if the local workpiece temperature
during cutting rises above the austenite-start temperature (AS), and the initial tempered
martensite transforms to austenite. AS was determined to be 840 °C from a heating Time-
Temperature-Transformation (TTT) diagram for AISI 52100 steel [183]. During the heating cycle,

105
no carbide dissolution needs to be modeled since the initial tempered martensite structure is
quite homogeneous with a high carbon concentration [36].
Martensite formation may be better described with the help of cooling TTT diagrams for
AISI 52100 steel as shown in Figure 5.1. As the workpiece begins to cool, austenite transforms
to martensite if the cooling rate is fast enough or to bainite if the cooling rate is slower. In order
to determine if bainite formation will occur, the current cooling time of a material undergoing
non-isothermal transformation is compared with the amount of time required to begin bainite
formation in an isothermal process. Sheil’s Additivity Rule discretizes the process over a number
of time steps, allowing for non-isothermal calculations [121]. If the integral in Eq. 4.5 reaches a
value of 1 before the temperature drops below the martensite formation temperature (Ms),
bainite will begin to form [157]. Under the parameters used in this study, bainite is not formed
because the cooling rate is sufficiently fast, thereby avoiding formation of bainite. Once the
temperature has dropped below the martensite formation temperature, Eq. 4.6 is used to
calculate the volume fraction of martensite in the cooling process [159]. If the cooling rate is
sufficiently fast, i.e., no bainite is formed, all austenite that does not change into martensite will
be considered as retained austenite. MS was estimated to be 200 °C in this study, which is an
average value in literature [127, 183]. The change of microhardness due to dynamic phase
transformation ( DPTh ) can be calculated according to the phase fractions of that element by
1
v
DPT i i oi
h f h h
(5.1)
where fi is the fraction of phase i in the element, ho is the initial bulk microhardness, hi is the
hardness of phase i, and v represents the number of phases present in the element. In this
study, microhardness of 62 HRC (≈7.316 GPa), 64 HRC (≈7.946 GPa) and 17 HRC (≈2.256 GPa)
were adopted from [135] for AISI 52100 phases of tempered martensite, untempered
martensite and retained austenite, respectively.
The total strain increment for a steel undergoing solid-state phase transformation is
updated by summing the individual components of the strain as discussed in Section 4.3. The
elastic strain increment E is calculated using the isotropic Hook’s law with temperature-
dependent Young’s modulus and Poisson’s ratio as given in Table 5.2. The rate-independent
constitutive models are used for the plastic strain increment of P . The thermal strain

106
increment T is computed using the coefficient of thermal expansion. The strain increment
due to this volumetric dilatation is given by Eq. 4.10. The percent volume change from austenite
to martensite (ΔV/Vγ-M,) was determined to be 1.026% [121]. The formation of martensite
induces transformation plasticity, which is also produced when dilatational strains interact with
the already-existing stress field [121, 159]. A reduction of 30 MPa in flow stress was used to
represent the mechanical effect of transformation plasticity via the formation of martensite.
Figure 5.1. Time-Temperature-Transformation cooling diagram for AISI 52100 steel [183].
5.2.3. Grain Refinement and Dislocation Density Evolution
Li et al. [132] investigated hard drilling of bearing steel SUJ2 ( with a tempered
martensite structure very similar to AISI 52100 steel), and reported that high density of
dislocations and refined equiaxed nanocrystalline grain structures were observed in the topmost
layers using SEM and TEM. Since the essential characteristics of the deformation field and grain
refinement mechanism during cutting were well captured, this dislocation density-based
modeling approach developed in Chapter 3 was used in this analysis to model grain refinement
due to SPD in hard turning. The material coefficient K in Eq. 3.6 was adopted to be 10 based on
an experimental study of dislocation cell structure of the steel workpiece processed by equal

107
channel angular pressing (ECAP) [105]. The strengthening of material microhardness ( SPDh )
depends on the dislocation density due to SPD, which is given as
SPD h t o toth k M Gb (5.2)
where hk is a constant slope of 0.5 obtained from [184, 185] and αo is a constant of 0.25
obtained from [105]. The other model parameters as shown in Table 5.4 were determined to
reproduce the observed material constitutive behaviors of hardened AISI 52100 steel under
various strains, strain rates and temperatures using an approach presented in [105, 186, 187].
In this modeling approach, the numerically calculated cell size d achieved at a large strain is
identified as the grain size and can be compared with the experimentally determined grain sizes,
using the same assumption applied to steel processed by ECAP in [105].
Table 5.4. Dislocation density-model constants.
α* β* ko n o o
f f
K Mt r
G (GPa) b (mm) α
0.22 0.08 8.0 50 1E5 0.29 0.16 10 3.06 2.5 80 2.48E-7 0.25
5.2.4. Numerical Solution
3D hard turning was simulated using AdvantEdge FEM, a commercial software
specialized for 3D machining simulations, using the user defined subroutines to implement the
transformation kinetics grain refinement mechanisms. Figure 5.2 shows the simulation setup of
hard turning in AdvantEdge FEM. AdvantEdge FEM uses a fully-automatic adaptive remeshing
algorithm of finite element mesh in the workpiece domain to simulate chip formation without
using any chip separation criterion [188]. The inserts were modeled using the custom tool
editor in AdvantEdge FEM for representing different tool geometries and wear land widths. The
thermo-mechanical properties of tool material KD050 was obtained from [127], while the
properties of K090 insert were adopted from the default properties of Alumina70-TiC30 tool
provided in AdvantEdge FEM software [188]. The applied frictional coefficient at the tool-chip
interface was 0.7, which was adopted from a study of frictional behavior in steel cutting [178].
The nose turning configuration as shown in Figure 5.2 (a) in AdvantEdge FEM is suitable for

108
simulating 3D turning with a large tool nose radius, and hence it was selected for hard turning
simulations in this study. Since an option of multiple cuts was not available for the current
software version, one cutting pass was simulated in the standard mode with a residual stress
analysis option. Constrained by the computation cost, the minimum element size of the
workpiece was limited to about 5 µm. When the cutting simulation step is finished, both the
chip and tool are removed and the workpiece is allowed to thermo-mechanically relax. Within
the relaxation step, the heat is dissipated, the stress fluctuations die out, and then a state of
stress in the workpiece is shown. Figure 5.2 (b) shows a steady-state chip formation with a
temperature contour in the cutting step, while Figure 5.2 (c) shows the machined surface of a
uniform temperature distribution in the relaxation step for simulating residual stresses.
Figure 5.2. Hard turning simulation via AdvantEdge FEM.

109
A user-defined material model was developed for AISI 52100 steel in FORTRAN as
required by AdvantEdge FEM, which consisted of both phase transformation kinetics and
dislocation density-based grain refinement subroutines. The computation flowchart as shown in
Figure 5.2 (d) illustrates the implementation of the user-defined material model in AdvantEdge
FEM. During the simulation, the material subroutines were constantly called at material points
within the workpiece domain to update the deformation and user-defined metallurgical fields.
The temperature-dependent thermal properties were used to update the cutting temperatures.
The constitutive plasticity models were implemented to update the material flow stresses and
simulate chip formation using the feedback of the metallurgical field. The evolution of phase
constituents was simulated using the kinetics model using the inputs of the thermal and
mechanical field variables. The fraction of each phase constituent was used to calculate the
phase-dependent volumetric dilatation strain, and to account for the effect of transformation-
induced plasticity strain. Using the inputs from the deformation field, the dislocation density-
based grain refinement subroutine was used to simulate the evolutions of dislocation density
and grain size in the workpiece domain. The microhardness was updated using Eqs. 5.1 and 5.2.
5.3. Results and Discussions
To assess the validity of the material models, hard turning conditions B1-B3 were
simulated via AdvantEdge FEM to compare the predicted cutting force with the experimental
results presented in [36]. Figure 5.3 compares the predicted tangential cutting force (Fc) in the
workpiece rotation direction and the thrust cutting force (Ft) in the radial direction with the
experimental data obtained in hard turning tests B1-B3. The force predictions match well with
the experimental data for various tool wear amounts with the prediction errors within 17% and
23% for Fc and Ft, respectively. It is evident that the coupled metallo-thermo-mechanical
analysis simulations accurately predict the effect of tool wear on the cutting force, particularly
the rapid increase of the thrust component with the increase of tool wear.

110
Figure 5.3. Simulation results of cutting force for Tests B1-B3.
The steady-state solution of hard turning is presented in terms of temperature,
equivalent plastic strain, phase composition, total dislocation density and grain size in the
workpiece and chip for tests A1 and A2 with different cutting speeds, as shown in Figure 5.4. It
can be seen in Figure 5.4 (a) that a cutting speed of 91.4 m/min produces an average
temperature of about 800 °C in the material near the tool cutting edge, while Figure 5.4 (b)
shows the temperature to be around 1000 °C for a higher cutting speed of 274.3 m/min. The
predicted phase compositions during steady-state cutting are illustrated in Figure 5.4 (c) and (d)
for the two cutting speeds. It can be seen in Figure 5.4 (c) that no phase transformation was
predicted on the machined surface, but only a portion of the chip material was austenitized at a
cutting speed of 91.4 m/min. In comparison, a major portion of the machined surface and chip
were predicted to be austenitized at a higher cutting speed of 274.3 m/min. Also, as the
material temperature cooled down below Ms, martensitic transformation occurred with
untempered martensite forming on the machined surface as can be seen in Figure 5.4 (d).
Although similar levels of plastic strain were induced on the machined surface for tests A1 and
A2, a higher cutting speed and hence a higher material temperature for test A2 produced a
lower total dislocation density in the chip and machined surface than test A1, as can be seen in

111
Figure 5.4 (e) and (f). Figure 5.4 (g) and (h) show the predictions of the grain size distributions
for the two tests. It can be seen that grain size was greatly reduced to around 100 nm not only
in the chip but also near the machined surface for test A1. A larger grain size of about 200 nm
was predicted on the machined surface for test A2.
Figure 5.5 shows the experimental results of tests A1and A2 using an optical microscope
and bright-field transmission electron microscopy (TEM) to observe the refined microstructure
within the near-surface layers. Although it was not possible to reliably determine the grain size
in the TEM images, it is evident that the topmost surface layers produced at the two cutting
speeds possess a highly refined microstructure with a grain size of less than 200 nm. For both
tests, steep gradients were predicted for grain size changes from a few hundred nanometers to
several microns in the near-surface layer, which was also experimentally observed as shown in
Figure 5.5 (b) and (d). The model predicted that for a cutting speed of 91.4 m/min in test A1,
the microstructure within the near-surface layer of 7.5 micron thickness was mechanically
refined to a structure with a grain size less than a micron, which is close to the experimental
value of 4~8 µm for the white layer as shown in Figure 5.5 (a). For a cutting speed of 274.3
m/min in test A2, a topmost surface layer of 5 micron thickness was predicted to be
mechanically refined to a submicron microstructure, while a deeper surface layer of 10 µm was
predicted to be transformed to martensitic phase. The predicted layer thickness of 10 µm for
phase transformation matched well with the measured value of 10~15 µm for the white layer
formed in test A2 as can be seen in Figure 5.5 (c).

112
Figure 5.4. Simulation results of surface microstructure for tests A1 and A2.

113
Figure 5.5. Refined surface microstructures (a, b) Test A1, (c, d) Test A2. (Adapted from [134]).
To quantitatively analyze the surface microstructural alteration induced by hard turning,
it is necessary to investigate the mechanical property differences between the surface layer and
the unaffected bulk material. For microhardness, the multi-physics model proposed in this
study considers the surface hardening due to both the thermally driven phase transformation
and severe plastic deformation. As a result, the predicted microhardness h is a sum of the initial
bulk microhardness ho, microhardness increase by phase transformation DPTh and severe
plastic deformation SPDh . Multiple nano-indentation tests were performed to determine the
microhardness of the surface layer for the samples of tests A1 and A2 by Ramesh et al. [134].
Figure 5.6 shows the surface microhardness distributions predicted for tests 4 and 5 in
comparison with the measurement data. An initial microhardness ho of 7.316 GPa, equivalent to
62 HRC, was assumed for the bulk material in the model. The predicted surface microhardness
was obtained by averaging within the selected area of the machined surface as shown in Figure

114
5.6. For test A1, an increase of surface hardness was attributed to the drastic increase of
dislocation density due to SPD, while for test A2, the increase of surface hardness consisted of
hardening by phase change and SPD. For test A1, a hardness increase of 0.83 GPa was
determined by Eq. 5.2. For test A2, the hardness increase of 1.43 GPa predicted by the model
was a sum of strain hardening of 0.8 GPa given by Eq. 5.2 and martensitic phase hardening of
0.63 GPa determined by Eq. 5.1. A good agreement exists between the model predictions and
the measurements for both tests A1 and A2.
Figure 5.6. Simulation results of surface microhardness for tests A1 and A2.
The residual stress of the machined surface was also investigated using the metallo-
thermo-mechanical coupling analysis. The X-ray diffraction (XRD) measurement was conducted
in detail in [134] to determine the residual stresses. The residual stress volume averaging
feature was used in AdvantEdge FEM to predict the residual stress subsurface profile, in which
stresses over an area were averaged as a function of depth into the workpiece surface [188].
Figure 5.7 (a) and (b) show the residual stress profiles, which were predicted from the locations
circled in Figure 5.6, in the workpiece rotation direction (hoop) and tool feed direction (axial),
respectively. Compressive surface residual stresses of about -400 MPa and -200 MPa were
predicted for test A1 at a cutting speed of 91.4 m/min in the hoop and axial directions,

115
respectively, while tensile residual stresses of about 350 MPa and 300 MPa were predicted for
test A2 at a cutting speed of 274.3 m/min in the hoop and axial directions, respectively. It can
be seen in Figure 5.7 that the simulated residual stresses are similar to the experimental data in
terms of the hook-shape profile and magnitude within a 70 µm depth below the surface. The
discrepancy of residual stresses between the model prediction and measurement shown in the
deeper regions could be caused by the preexisting stresses in the bulk material after the heat
treatment. Overall, reasonable predictions of residual stresses were obtained for hard turning
at both low and high cutting speeds, which further validated the efficacy of the numerical
model.
Figure 5.7. Simulation results of subsurface residual stress profile for tests A1 and A2.
The effects of cutting speed and tool condition on the resultant surface microstructure
were further evaluated through numerical simulations of tests B1-B5. The white layer formation
in tests B1-B3 and tests B4-B5 was simulated to be dominated by phase transformation and
grain refinement, respectively. The predictions of white layer thickness are compared with the
measured values as shown in Figure 5.8. The model predictions of tests B1-B3 show that the
transformed martensitic layer thickness increases from 5 to 15 µm as the tool wear land width

116
increases from 0.11 to 0.3 mm at a constant cutting speed of 180 m/min, which are in good
agreement with the experimentally measured thicknesses of 4.2 to 11.7 µm. For tests B3-B5
with a constant tool wear land width of 0.3 mm, the white layer thickness predicted by either
thermally driven phase transformation or SPD increases drastically as the cutting speed
increased from 45 to 180 m/min, which also matched well with the experimental data. The
effect of cutting speed and tool wear on white layer formation predicted in this study is in line
with many experimental studies in literature [39, 189, 190]. A refined layer with the same
thickness of 7.5 µm was predicted for both test B4 with a VB of 0.3 mm and test A2 with no tool
wear at a similar cutting speed (≈90 m/min). Because a greater feed of 0.127 mm/rev was used
in test A2 than a feed of 0.05 mm/rev in test B4, a similar SPD effect was predicted to be
induced on the surface layer. The effect that a greater feed produces a thicker white layer has
also been experimentally demonstrated in other studies [132, 189-191].
Figure 5.8. Simulation results of martensitic transformation layer thickness for tests B1-B5.
The accuracy of the model prediction was greatly affected by the minimum element size
used in AdvantEdge FEM near the machined surface. In this study, an element size of about 5

117
µm was specified near the surface to achieve the balance of reducing the computation cost and
refining the simulation result. A better result could be achieved if a finer mesh with smaller
elements was used, however, the computational cost would be drastically increased.
Nonetheless, the model predictions prove that the refined microstructure produced at low-to-
moderate cutting speeds are mainly caused by severe plastic deformation, whereas white layer
formation at high cutting speeds is caused by both thermally driven phase transformation and
grain refinement due to SPD.
5.4. Summary
This chapter presented a multi-physics model to investigate the surface microstructure
alteration in hard turning of AISI 52100 steel. Both the thermally driven phase transformation
and mechanical grain refinement due to severe plastic deformation were considered to model
the surface microstructural change using a metallo-thermo-mechanical coupled model. The
model considered the critical surface microstructural attributes such as phase composition,
grain size, and microhardness, and was implemented for 3D simulations of hard turning via
AdvantEdge FEM. Through a quantitative assessment using the experimental data, the 3D
simulations proved that the model accurately predicted the formation of white layer due to
both thermally driven phase transformation and mechanical grain refinement for different
cutting conditions. It was shown that the refined microstructure produced at low-to-moderate
cutting speeds were mainly caused by severe plastic deformation, whereas white layer
formation at high cutting speeds was caused by both thermally driven phase transformation and
grain refinement due to SPD. For the tests studied it was found that at a cutting speed of 91.4
m/min, an increase of surface hardness of 0.83 GPa was predicted to be caused by severe plastic
deformation. At a cutting speed of 274.3 m/min, an increase of surface hardness of 1.43 GPa
was predicted to be caused by a combination of martensitic transformation and severe plastic
deformation. Predicted residual stresses were in a good agreement with the experimental data,
which further validated the efficacy of the model. Therefore, the multi-physics model
developed in this chapter is shown to be a more comprehensive solution for analyzing the
surface microstructure alteration in hard turning.

118
CHAPTER 6. SURFACE INTEGRITY ANALYSIS OF LASER-ASSISTED MACHINING OF HARDENED STEEL PARTS
In this chapter, one-step LAM process is presented for finish machining the automotive
transmission shafts of hardened steels to replace conventional hard turning and grinding
operations. The 3D transient thermal model is applied to predict the temperature field in the
hollow shaft of varying-thickness undergoing laser-assisted turning. The laser-assist effect on
surface quality and subsurface integrity is investigated in terms of surface finish, size control,
microhardness, microstructures and residual stresses.
6.1. Problem Statement
Machining of hardened steel components such as gears, bearing rings, crankshafts,
camshafts, etc., has traditionally relied on grinding-based technologies [48, 192]. Grinding has
been proven to produce good surface quality of these high load bearing steel components.
However, its low attendant material removal rate and lack of flexibility in producing complex
geometry make the grinding process very expensive and inefficient [48, 49, 192-194]. In order
to reduce overall machining costs and to increase the flexibility of production, this study
explores the potential of laser-assisted machining as a replacement for the grinding operation.
Currently, a three-step process is used to produce an automotive transmission shaft after full
heat treatment: hard turning, grinding and polishing.
One-step LAM process needs to be developed to replace the hard turning and grinding
operations. It will also allow for a higher material removal rate without compromising the
surface integrity. Figure 6.1 shows a schematic comparison between current and proposed
processes with the material removal and surface finish after each step. The materials used in
this study are automotive transmission shafts of AISI 4130 steel with Rockwell hardness C (HRC)
of 50. AISI 4130 is a low alloy steel containing molybdenum and chromium as strengthening
agents [195]. The carbon content is nominally 0.30% and the alloy can be hardened by heat

treatment. Machinability is best with the 4130 steel in the normalized and tempered condition.
Although the alloy may be machined in the fully heat treated condition, machinability becomes
poorer with increasing strength (hardness) of the alloy.
Figure 6.1. Current and proposed methods for machining a transmission shaft. *, material removal rate in radius during polishing.
6.2. Improvement of LAM Thermal Model
6.2.1. Thermal Modeling of Laser-Assisted Face Turning
The heat transfer problem associated with laser-assisted facing with one laser is
schematically shown in Figure 6.2, with complex transient boundary conditions and continuous
material removal as shown. The Nd:YAG laser attached on the turret travels at the same speed
as the cutting tool in the radial direction during the cutting. The cylindrical coordinate system is
fixed at the center of the workpiece. The material within the outside circular band (width=1
feed) is removed after one revolution. After each time-step of the simulation, one or two

120
control volumes in the radial direction, depending on the precision of the simulation, are
removed.
The present thermal model is governed by
2
h h 1 T 1 T Tρ ω rk k k S
t r r r r z z
(6.1)
where the first term on the left-hand side represents energy storage, and the other comes from
circumferential advection due to the rotation of workpiece relative to the coordinate system.
The first three terms on the right-hand side represent energy diffusion in the radial,
circumferential and axial directions, respectively. The last expression is a source term for
internal heat generation, which is zero for opaque materials. The present model uses uniform
and relatively finer meshes in the interested zone along radial direction, and treats the laser
irradiation and material removal plane physically like the machining process, i.e., moving in the
radial direction in the cylindrical coordinate system.
Figure 6.2. Sketch of the laser-assisted facing of a cylindrical workpiece with one laser.

121
Before the laser heating, the workpiece is under a thermal equilibrium with the
surroundings. Within the whole domain, the initial condition of the thermal model is
inf( , , , 0) .T r z t T (6.2)
For the surface under the laser irradiation, Eq. 6.3 is used to represent the heat flux into the
workpiece through laser irradiation, convection and radiation. The distribution of the laser
irradiation on the workpiece, laserq , is determined by the beam profile. The radiation exchange
between the workpiece and the surrounding is determined by using the instant workpiece
surface temperature, ambient temperature and the emissivity of the workpiece surface.
( , ) .laser conv rad
chamfer
Tk q z q q
r (6.3)
For the portion of the workpiece end faces outside the laser irradiation,
0, ,p w
conv rad
z a l
Tk q q
z (6.4)
where ap and lw denote the depth of cut and the workpiece length, respectively. For the circular
boundary surface outside the laser irradiation,
, ( )
.w
conv rad
r r r t
Tk q q
r (6.5)
Symmetry conditions are assumed at the centerline of the workpiece and result in Eq. 6.6 for
numerical implementation, because the rotation of the workpiece enhances the distribution of
laser energy in the circumferential direction and results in negligible temperature gradients near
the centerline of the workpiece.
0
0.r
T
r (6.6)
Away from the material removal plane, the continuity of temperatures and temperature
gradients in the circumferential direction is satisfied by
, , , 2 ,T r z T r z (6.7)

122
2
.T T
(6.8)
To facilitate the numerical solution of the heat transfer problem in LAM, where material
may experience temperatures higher than 1000 °C and the temperature dependence of material
thermophysical properties has to be taken into account, Eq. 6.1 is rewritten in the form of Eq.
6.9 following the numerical scheme proposed by Murthy and Mathur [196].
p p * * * *
p p2
c T c T 1 T 1 T Tρ ω rk k k S ρ c T h ρω c T h
t φ r r r r φ φ z z t φ
(6.9)
where T* and h* are the values of T and h gained from the previous iteration and used to solve
for T in current iteration. When convergence is achieved, T* and h* are equal to T and h,
respectively, and Eq. 6.9 reverts to Eq. 6.1 since the cpT terms on both sides cancel each other.
All the thermal properties in the center of the control volume (CV) can be directly expressed
from the calculated temperature field, while those at the CV faces need to be interpolated. For
thermal conductivity k, a harmonic mean interpolation [197] is applied, which keeps the
consistency of heat resistance between CVs. For cp, a pure linear interpolation is applied. In the
thermal model, the material removal process is simulated by properly setting the control
volumes corresponding to the removed materials inactive, i.e., the thermal conductivity of those
inactive control volumes are set to zero [14].
A finite volume thermal model is developed for the laser-assisted face turning process
based on the earlier thermal models for the laser-assisted longitudinal turning process
developed by the previous students in the Laser-Assisted Materials Processing Lab at Purdue
University. Rozzi et al. [9, 12, 198] firstly developed a transient, 3D numerical model of a
rotating workpiece undergoing laser heating and material removal. Rozzi’s model is restricted
to cylindrical workpieces having a uniform machined diameter along the axial direction, because
the geometry of the chamfer is fixed in his Eulerian model. Pfefforkorn et al. [41] extended the
model to semi-transparent materials by allowing for calculation of the internal radiation inside
the workpiece. A significant enhancement in the capabilities of the thermal mode was achieved
by Tian and Shin [14] by changing the thermal model from a stationary laser/moving workpiece

123
of Rozzi’s model (Eulerian) to a fixed workpiece/moving laser (Lagrangian) and also by including
adaptive geometry change to simulate laser-assisted longitudinal turning of a workpiece with
varying depth of cuts. The present model further expands this model to complex profiling by
adding facing capabilities to the longitudinal profiling.
The finite volume method is used to discretize the governing equations and the
modeled domain is divided into predefined, structured control volumes. The meshing in the
radial direction is very fine because of the continuous material removal in this direction; the
meshing in the axial direction is fine within the depth of cut; the meshing in the circumferential
direction is fine within the laser irradiation and the cutting zone. For example, a cylindrical part
can be divided into 60 (circumferential) ×30 (longitudinal) ×200 (radial) with a typical control
volume size of 0.19 × 0.075 × 0.06 mm. The energy equation is integrated over each control
volume with linear profiles expressing the temperatures between grid points. For the advection
term, the upwind difference scheme (UDS) [197] is used for interpolating the temperatures at
the CV faces according to the flow direction.
The motions of the laser irradiation, the machining chamfer and the material removal
plane are treated as the same as those in the physical facing process, i.e., moving in the radial
direction towards the center of the workpiece. The laser irradiation and material removal are
considered as moving boundary conditions. In order to pass the boundary condition to the
internal control volumes, the coefficients associated with the heat transfer in the radial
direction and the source terms for the internal CVs at the boundary include all the information,
such as laser irradiation, convection over the surface, and conduction heat exchange with the
surrounding temperatures. The modeling of the laser beam in the machine chamfer is shown in
Figure 6.3. For the boundary control volumes within the laser irradiation, the exposed area, the
angle to the laser direction, and the distance to the center of the laser beam are calculated. For
Gaussian laser intensity distribution, the laser flux is decided by the distance to the center r,
laser radius rl and laser power Pl. Simpson’s rule is used for the numerical integration to
calculate the laser flux rq . Figure 6.4 shows a sketch of laser heat absorption by those partially
deactivated boundary control volumes in the machine chamfer. According to the chamfer
geometry and the meshing condition, there could be only one or multiple control volumes
intercepted by the machined edge as shown as in Figure 6.3. The intercepted control volumes
are partially deactivated, i.e., the volume remains in the computational domain and the

124
remaining area in between two neighbors is calculated according to their corresponding
geometric portions. The source terms of these control volumes are specified according to their
geometry. Figure 6.5 shows the heat transfer at the boundary control volumes.
Figure 6.3. Sketch of the laser spot and machine chamfer in laser-assisted face turning.
Figure 6.4. Sketch of partial deactivating control volumes and laser absorption at the boundary.
(a) Complete CV (b) Partially deactivated CV
Figure 6.5. Heat transfer at the boundary control volumes.

125
The discretized equations are formulated in a fully implicit scheme to prevent physically
unrealistic oscillations in the converged solution. The Tri-Diagonal Matrix Algorithm (TDMA)
solver and the cyclic TDMA solver in the circumferential direction are used to solve the 1-
dimensional discrete equation for each line of CVs, which assume the temperatures of the
neighbors on sides are temporarily known. Line-by-line TDMA is used for 3D problems: it calls
the TDMA for each line and sweeps across lines in all the directions (circumferential, axial and
radial) over and over until convergence. Therefore, the resulting algebraic equations are solved
iteratively, with one sweep per iteration through the domain in the positive and negative
directions of each coordinate. After each iteration, the new temperature field is used to update
the temperature dependent variables such as material conductivity and specific heat.
Convergence of the solution is checked with a residual less than 10-6, while the unbalanced
global energy less than 10-6 of the laser power is achieved and the average of specific heat
changes less than 10-5 between two successive iterations. The program flow and the
subroutines of the thermal model are shown in Figure 6.6. The main program defines the
material removal at each time step and calculates the laser parameters at various geometric
features, such as the boundary control volumes of the laser irradiation, the laser tilted angle to
the control volume surface, the distance of the control volume to the center of the laser beam,
the exposed area and volume of the control volume. Figure 6.7 shows a preliminary simulation
of laser-assisted face turning of a Waspaloy workpiece.

126
Figure 6.6. Program flow in the LAM thermal model.
(a) (b) (c)
Figure 6.7. Simulation result of laser-assisted face turning. (a) 3D temperature distribution (b) 2D temperature projection onto ϕ-z plane (c) 2D temperature distribution in r-z plane.
6.2.2. Thermal Modeling of Laser-Assisted Profile Turning
The laser-assisted profile turning process is applied to cylindrical parts with complex
geometry features, which require straight longitudinal turning, face turning, taper turning,
convex and concave circular arcs, etc. The workpiece has to be properly heated during the
different phases of a laser-assisted profile turning operation to achieve a constant Tmr and to

127
ensure a consistent good cutting condition for superior surface finish and long tool life. A
representative case is analyzed to demonstrate the application of the methodology, as shown in
Figure 6.8 (a). In order to comprehensively study the effects of profile geometry on laser-assist
performance, this sample workpiece has concave turning, face turning and straight line turning
with zero and 15° slope angles and it is divided by five segments according to the geometric
shapes as shown in Figure 6.8 (b). Although contour geometry dealt with in a profile machining
process varies greatly from part to part, a continuous profile of complex features usually can be
curve-fitted into piecewise parameterized splines, Bezier or NURB (non-uniform rational B-
spline) curves. As a matter of fact, the laser-assisted profile turning process essentially consists
of two kinds of operations: outside diameter (OD) turning of complex feature with the tool
feeding in the longitudinal direction and face turning with the tool moving in the radial
direction. Hence, the thermal model of the laser-assisted profiling process basically is a
combination of thermal models of both laser-assisted OD turning and face turning.
(a) Tool path
(b) Profile dimensions
Figure 6.8. A representative case study of laser-assisted profile turning.
During the laser-assisted profile turning process, a single cutting pass is designed and no
tool change is required, which removes a small depth of material and keeps the complex
geometric features of the part the same (but smaller) as those prior to cutting. One laser is
assumed to be in use ahead of the cutting tool, and moves at the same feed rate as the machine
tool. The laser beam size is assumed to be constant and the laser lead distance in both
circumferential (°) and longitudinal directions (mm) are fixed to the tool position. The actual

128
setup of the lasers during the profiling process needs to be designed for every particular part
such that the laser locally heats the workpiece material ahead of the cutting tool without any
potential motion conflicts. This usually requires a flexible control of the laser optical path as
well as the laser power. For instance, the tool path change from OD turning to facing as shown
in Figure 6.8 requires that the laser agilely and automatically change the direction and readjust
the focus distance if necessary. For the case study in this report, constant cutting speed, feed
rate and depth of cut are applied. The spindle speed varies along with different diameters
during different stages and the maximum cutting speed to be applied at a small workpiece
diameter will be limited by the spindle. Obviously, the main applications of laser-assisted profile
turning are finishing processes; hence its acceptance depends on a high form and size accuracy,
high surface finish and good surface integrity of the workpiece. Machining conditions differ
from those for conventional laser-assisted turning. The low depth of cut, small feed rate and
the large cutting edge radius are typical finishing conditions in hard turning. The machine
chamfer is modeled based on the tool geometry and the depth of cut, as can be seen in Figure
6.9.
(a) Straight (b) Ramping (c) Circular (d) Facing
Figure 6.9. The machine chamfer in different stages.
Figure 6.10 (a) shows the structured mesh generated by the thermal model. A finer
mesh was generated along the profile of the part. The part geometry prior to cutting is
designated by deactivating the control volumes in the empty space by setting the thermal
conductivity to zero as shown in Figure 6.10 (b). The 3D finite volume numerical model
developed in FORTRAN for laser-assisted face turning has been expanded and integrated with
the laser-assisted turning to develop the laser-assisted profile turning model. Similarly, the laser
irradiation has been modeled as a moving heat source term as in the actual physical scenario,

129
which is updated in real time during the simulation. The material removal is modeled by
partially deactivating the control volumes along the tool path. The numerical program flow and
structure of the subroutines in the thermal model resemble those in the facing model as shown
in Figure 6.6. Figure 6.11 and Figure 6.12 show the temperature simulations of a Waspaloy
workpiece in OD turning and face turning stages in 2D and 3D views, respectively, which show
good continuity of the temperature prediction in turning and the following facing. The model
accuracy has yet to be validated by temperature measurement during a laser-assisted profile
turning process, which will be conducted after the prelim exam.
(a) Complete domain (b)Activated domain (c) Zoom in
Figure 6.10. Mesh generation in laser-assisted profile turning.
(a) In OD turning stage
(b) In facing stage
Figure 6.11. 2D temperature simulations at the tool position in laser-assisted profile turning.

130
(a) In OD turning stage
(b) In facing stage
Figure 6.12. 3D temperature simulations in laser-assisted profile turning.
6.3. LAM Process and Modeling
6.3.1. Experimental Setup
Laser-assisted turning experiments were performed on a 20 hp Jones and Lambson CNC
lathe. Due to the power limitation, two lasers, a CO2 and a Nd:YAG laser, have been integrated
with the cutting tool and irradiate the workpiece continuously ahead of the tool, which are
shown in Figure 6.13. The 1 kW Nd:Yag laser of wavelength of 1.06 µm irradiates the workpiece
surface 16° circumferentially ahead of the cutting tool, and its beam is delivered by a fiber optic
cable through a lens to a spot size of 3.0 mm. The 1.5 kW CO2 laser of wavelength of 10.6 µm is
positioned 55° ahead of the cutting tool irradiating the workpiece surface to provide requisite
preheating. A detailed description of the two-laser LAM experimental setup can be found in the
work of Anderson et al. [6]. The PCBN insert (grade BNC 200, made by Sumitomo) used in the
OD turning experiments has a tool nose radius of 1.19 mm, side rake angle of -5° and back rake
angle of 0°. The workpiece used in the experiments are hollow shafts of heat treated AISI 4130
steel with Rockwell hardness C of 50. Figure 6.14 shows the geometry of a hollow shaft of
varying-thickness. It should be noted that the present two-laser LAM setup is not ideal for large
parts of hardened steel because of the laser power constraints and the low absorptivity of steel
to the long wavelength CO2 laser. Prior to each LAM test, the workpiece surface was
sandblasted and painted with the Cotronics 931 graphite adhesive powder/binder mixture to
increase the absorption of the laser energy. In an actual manufacturing practice, however, the

131
workpiece surface coating can be eliminated with the use of a higher power fiber or Nd:YAG
laser at a short wavelength of about 1 µm.
Figure 6.13. LAM experimental setup with both the CO2 and Nd:YAG laser.
Figure 6.14. Geometry of the hollow shaft of varying-thickness.
The force data was collected using a three component Kistler 9121 dynamometer during
LAM. Temperature measurement was performed using a FLIR SC3000 infrared camera with the
ThermoCAM2002 software. The tool wear and microstructures were examined with a Zeiss

132
optical microscope and a JEOL T330 scanning electron microscope. The surface roughness was
measured using a Surtronic 3+ surface profilometer. Arithmetic average surface roughness Ra
was recorded at 9 locations along the axial and circumferential directions for each part after
LAM. Surface hardness and subsurface microhardness were measured using a Mitutoyo ATK-
F1000 hardness tester and a Vickers hardness tester respectively. Residual stress
measurements were conducted by X-ray diffraction with Siemens diffractometer D500 and data
analysis was done using an x-ray line profile fitting program XFIT.
One-step LAM process was developed for finish machining of the automotive
transmission shaft of varying-thickness to replace hard turning and grinding operations.
Determination of the temperature field in such an irregular-shaped part is necessary because
the LAM parameters can be optimized only when the part is heated properly. Figure 6.15 shows
the geometric configurations of the CO2 and the Nd:YAG lasers to the machined chamfer during
LAM. To avoid direct heating of the machined surface, the longitudinal laser-tool lead distance
is set to 1.2 mm for the CO2 laser and 0.9 mm for the Nd:YAG laser.
Figure 6.15. Diagram of the CO2 and Nd:YAG lasers in the machined chamfer.

133
6.3.2. Temperature Prediction and Measurement
The transient, 3D, finite volume thermal model of a cylindrical workpiece has been
expanded to handle the part geometric changes during LAM. The thermal conductivity of the
internal vacant area of the shaft was set to zero to deactivate those control volumes.
Convection heat transfer was defined on the internal surfaces with a convection coefficient of
19 W/m²·K according to the work by Rozzi et al. [12]. Fine mesh was used within the depth of
cut in both the radial and axial directions to model the material removal zone. A typical control
volume within the depth of cut area is 80 µm in the axial direction and 45 µm in the radial
direction. The laser heat absorption and conduction heat transfer were defined with great care
in the machined chamfer. The developed numerical scheme overcame the convergence
problem by partially deactivating multiple control volumes from each column along the machine
chamfer and the laser heat flux is defined over every exposed partially-deactivated control
volume at the boundary. No material removal was defined in the preheating phase and the
machine chamfer gradually enters the workpiece at the beginning of the machining phase. In
the new scheme, the temperature at the center of the surface control volume is solved by the
three-dimensional heat transfer solver and is used as the surface temperature in the output files.
The accurate absorptivity of the workpiece surface at each particular laser wavelength is
important since this parameter has a considerable effect on the workpiece temperature. Since
the CO2 and the Nd:YAG laser irradiate almost entirely on the graphite coated surface of the
workpiece as shown in Figure 6.15, the absorptivity at both the wavelengths for the graphite
coating must be known. The absorptivity of the graphite coated surface to the CO2 laser has
been measured previously to be 0.80 [6]. Absorptivity tests were conducted on graphite coated
AISI 4140 prismatic workpieces to find the absorptivity of the graphite coating to the Nd:YAG
laser. By comparing the thermocouple measurements with the thermal model predictions, the
absorptivity was inferred. Figure 6.16 shows a comparison between the inferred thermal model
predictions at absorptivity of 0.78 and the actual thermocouple measurements from one test.
The absorptivity was found to range from 0.75 to 0.80 and the maximum surface temperature
within the Nd:YAG laser beam was predicted to range from 400°C to 850°C for the absorptivity
tests. The maximum temperature under the Nd:YAG laser beam during a LAM test falls within
this range and hence the absorptivity of 0.78 is used for the graphite coated surface in the LAM
thermal model.

134
Figure 6.16. Thermal model predictions at absorptivity of 0.78 and thermocouple measurements during an absorptivity test for the graphite coated surface to the Nd:YAG laser.
Following the same procedure as mentioned above, the absorptivity of the machined
surface of AISI 4130 steel at the Nd:YAG wavelength was determined. The absorptivity of the
non-oxidized surface was 0.43, which matched well with the thermocouple measurements,
while the absorptivity of the oxidized surface was about 0.70. In the LAM thermal model,
absorptivity of 0.43 was used for the machine chamfer at the Nd:YAG laser wavelength.
Absorptivity of 0.10 at the CO2 laser wavelength was used for the machined chamfer because
the absorptivity of low alloy steel to the CO2 laser varies from 5% to 11% depending on the
temperature [199-202]. The density of AISI 4130 at room temperature is 7,833 kg/m³ [195] and
is assumed to be constant in the LAM thermal model. In order to apply the temperature
dependent properties in the LAM thermal model, thermal conductivity and specific heat are
curve fitted as functions of temperature and summarized as follows:
For thermal conductivity k (W/m·K):
If T ≤ 1600 K, k = -8 -4 -24.15 10 T³ - 1.03 10 T² + 6.05 10 T + 32.3
If T >1600 K, k = 35.404.

135
For specific heat Cp (J/kg·K)
If T ≤ 950 K, Cp = -46.27 10 T² - 0.241T + 489
If T>950 K, Cp = 0.08T + 749.
Figure 6.17 and Figure 6.18 show the 2D temperature distributions on the longitudinal
section and a corresponding 3D temperature distribution predicted by the thermal model,
respectively. The following parameters were used in the thermal model: cutting speed of 180
m/min, feed of 0.075 mm/rev, depth of cut of 0.36 mm, CO2 laser power of 1,100 W, Nd:YAG
laser power of 300 W and the preheating time of 3 s. As can be seen in Figure 6.17, the
maximum surface temperature is under the CO2 laser due to the intense laser heating, and the
Nd:YAG helps by increasing the temperature in the machine chamfer, while the heat
penetration is deepest at the tool cutting position. Figure 6.18 shows both the CO2 and the
Nd:YAG laser spots on the workpiece surface, the tool cutting position (horizontal line) and the
varying-thickness feature of the journal.
Figure 6.17. 2D temperature distributions in a hollow shaft workpiece undergoing LAM.

136
Figure 6.18. 3D temperature distribution in a hollow shaft workpiece undergoing LAM.
To validate the LAM thermal model for the hollow shaft of varying-thickness and to
verify the material properties of AISI 4130, a non-contact FLIR SC3000 infrared camera of
wavelength ranging from 8 to 9 µm was used to measure the temperature of the graphite
coated surface during the LAM tests. The IR camera was set horizontally and 225° downstream
from the tool as can be seen in Figure 6.19. The IR camera was set horizontally and 225°
downstream from the tool. Emissivity of 0.85 was used for the graphite coated surface in the IR
camera. The IR camera tracked the maximum temperature of the center line of the workpiece
at 10 frames per second. The following parameters were used during the LAM test: cutting
speed of 180 m/min, feed of 0.075 mm/rev, depth of cut of 0.36 mm, CO2 laser power of 1,060
W and a preheating time of 3 seconds.
A good agreement between the IR temperature measurements and the thermal model
predictions is observed in Figure 6.20. During the preheating phase, the workpiece surface
temperature at the tool position increased dramatically and became steady during the material
removal phase. The varying-thickness of the shaft had a minimal effect on the surface
temperature as can be seen in Figure 6.20. High temperature spikes recorded by the IR camera
during the LAM process were caused by two factors: the burned graphite powders under the
intense laser heating and the hot chips generated during LAM. The IR camera caught these hot

137
spots, which should not be used for the model validation purpose and were filtered out after the
test.
Regression models were developed to determine the average material removal
temperature due to laser heating as a function of the machining, laser, and workpiece
parameters. The laser power (W, CO2 laser power PCO2 and YAG laser power PYAG), the cutting
speed (V, m/min), and the feed (f, mm/rev) were selected as independent factors for the
multivariable regression analysis. A three-level full factorial design was used to generate the
simulation runs. The design was then implemented by running the LAM thermal model to
obtain the data needed for the regression analysis. Eqs. 6.10 and 6.11 are used for predicting
the Tmr during LAM process for the CO2-only and two-laser LAM setups respectively:
0.85CO2
0.47 0.47
P1.8mrT
V f (6.10)
0.29
YAG
0.45 0.47
P152.7 .mrT
V f (6.11)
For the two-laser setup, the CO2 laser power was fixed at 1,100 W to achieve high Tmr.
Figure 6.19. Schematic of the IR camera temperature measurement.

138
Figure 6.20. Temperature measurements and thermal model predictions in a hollow shaft undergoing LAM.
6.3.3. Microstructural Prediction of the LAM Process
LAM of hardened 4130 steel was simulated using the 3D nose turning option in
AdvantEdge FEM. Phase transformation kinetics and grain refinement were modeled in the user
defined material subroutines as described in Chapter 5. The thermo-mechanical properties of
the PCBN insert and 4130 steel workpiece were obtained from [203] and [204], respectively.
The Johnson-Cook model in [205] defined the constitutive plasticity behavior of AISI 4340 steel,
and was adopted by adjusting the strain hardening terms in this study to model the plasticity of
hardened AISI 4130 steel prior to any phase change. It can be seen in Figure 6.21 that the
predicted flow stress at an equivalent strain of 0.008 and elevated temperatures of 4130 steel
matches well with experimental data obtained from tensile and compressive tests provided in
[206]. The dislocation model parameters of 4130 steel are given in Table 6.1, which were
determined to reproduce the observed material constitutive behaviors of hardened AISI 4130
steel under various strains, strain rates and temperatures. A workpiece size of 6(L)x2(H)x4(W)
mm in size was used in the simulations with the initial temperature set as the average material
removal temperature. An initial microstructure of a tempered martensitic bulk structure with
an average grain size of 5 µm was used in the simulations. A minimum element size of 5 µm was
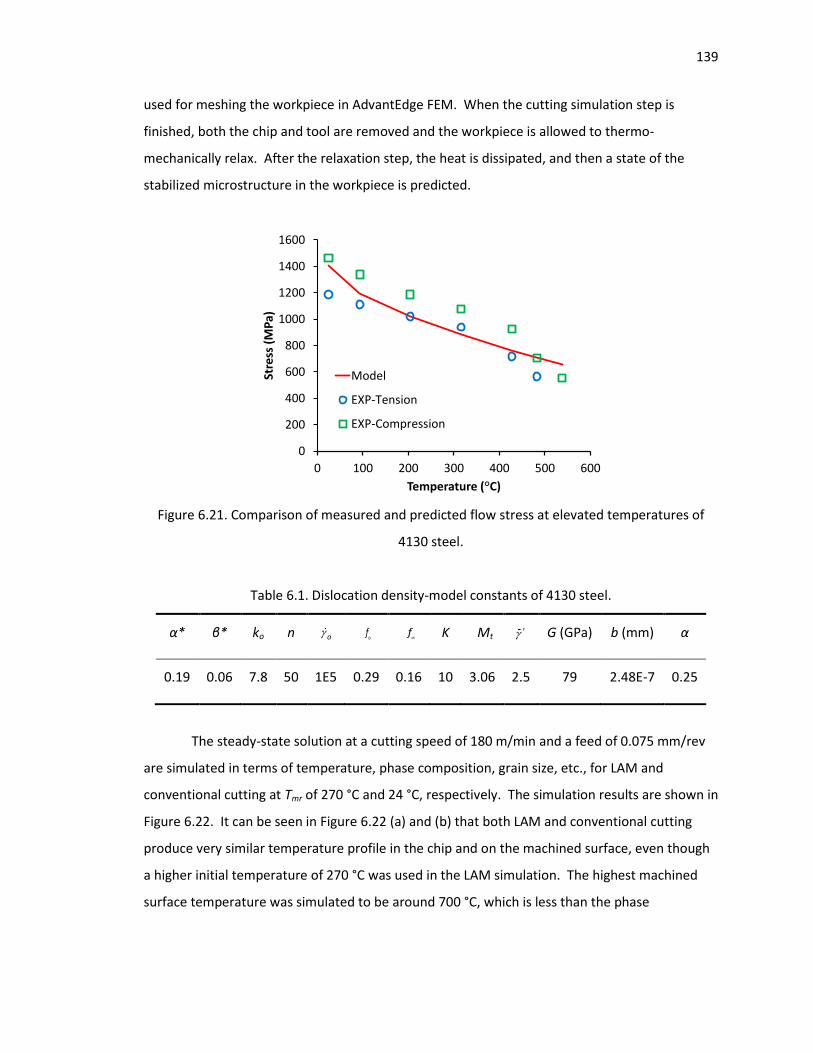
139
used for meshing the workpiece in AdvantEdge FEM. When the cutting simulation step is
finished, both the chip and tool are removed and the workpiece is allowed to thermo-
mechanically relax. After the relaxation step, the heat is dissipated, and then a state of the
stabilized microstructure in the workpiece is predicted.
Figure 6.21. Comparison of measured and predicted flow stress at elevated temperatures of
4130 steel.
Table 6.1. Dislocation density-model constants of 4130 steel.
α* β* ko n o o
f f
K Mt r
G (GPa) b (mm) α
0.19 0.06 7.8 50 1E5 0.29 0.16 10 3.06 2.5 79 2.48E-7 0.25
The steady-state solution at a cutting speed of 180 m/min and a feed of 0.075 mm/rev
are simulated in terms of temperature, phase composition, grain size, etc., for LAM and
conventional cutting at Tmr of 270 °C and 24 °C, respectively. The simulation results are shown in
Figure 6.22. It can be seen in Figure 6.22 (a) and (b) that both LAM and conventional cutting
produce very similar temperature profile in the chip and on the machined surface, even though
a higher initial temperature of 270 °C was used in the LAM simulation. The highest machined
surface temperature was simulated to be around 700 °C, which is less than the phase
0
200
400
600
800
1000
1200
1400
1600
0 100 200 300 400 500 600
Stre
ss (
MP
a)
Temperature ( C)
Model
EXP-Tension
EXP-Compression

140
transformation temperature, and hence no phase transformation was predicted for either LAM
or conventional cutting condition, as can be seen in Figure 6.22 (c) and (d). Figure 6.22 (e) and
(f) show the predictions of the grain size distributions for the two tests. It can be seen that grain
size was slightly reduced from 5 µm to 1-3 µm near the machined surface for both LAM and
conventional cutting conditions. But the grain refinement was predicted to be within a depth of
5 µm.
Figure 6.22. Simulation results of workpiece microstructure.

141
6.4. Surface Integrity Analysis
6.4.1. LAM Experiments
LAM and conventional machining operating conditions of the hardened steel shaft are
shown in Table 6.2. The requisite laser power was determined by using Eqs. 6.10 and 6.11. Test
conditions 1~6 use the same machining parameters with ascending Tmr, which are aimed to
determine the optimal Tmr. Through the experiments, it is known that Tmr should not be
increased above 300 °C because the machined surface tends to oxidize in the air after LAM with
this high temperature. Different cutting speeds or feed rates are used in test conditions 7~16 to
study the effects of cutting speed and feed on the surface integrity produced by LAM.
The temperature effect on the cutting force or the specific cutting energy is significant
and consistent for all the conditions. Compared to conventional machining, the specific cutting
energy during LAM drops by about 20% as the Tmr increases to above 200°C, as shown in Figure
6.23. The cutting speed has little effect on the specific cutting energy while increasing the feed
rate results in a higher cutting force but less specific cutting energy.
Table 6.2. LAM experimental conditions.
Condition V (m/min) f (mm/rev) ap (mm) tpre (s) PCO2 (W) PYAG (W) Tmr (°C)
1 180 0.075 0.36 - - - 24
2 180 0.075 0.36 3 816 - 160
3 180 0.075 0.36 3 1060 - 200
4 180 0.075 0.36 3 1249 - 230
5 180 0.075 0.36 3 1100 311 270
6 180 0.075 0.36 3 1100 425 300
7 180 0.05 0.36 - - - 24
8 180 0.05 0.36 4 666 - 160
9 180 0.05 0.36 4 865 - 200
10 180 0.05 0.36 4 1223 - 270
11 180 0.1 0.36 - - - 24
12 180 0.1 0.36 3 1224 - 200
13 180 0.1 0.36 3 1100 467 270
14 150 0.075 0.36 3.5 1100 243 270
15 240 0.075 0.36 2 1100 458 270
16 300 0.075 0.36 2 1100 616 270

142
Figure 6.23. Temperature effect on specific cutting energy of hardened 4130 steel.
6.4.2. Surface Finish
Generally, LAM produces a nice surface finish of Ra less than 0.3 µm since the feed is
less than 0.1 mm/rev, as can be seen in Figure 6.24. Theoretical surface roughness can be
determined by the feed and the tool nose radius (r) by 2
32a
fR
r . The theoretical Ra is 0.07, 0.15
and 0.26 µm for the feed of 0.05, 0.075 and 0.1 mm/rev respectively for a tool nose radius of
1.19 mm. The actual average surface roughness Ra generated from conventional machining is
about 0.34, 0.28 and 0.36 µm for the feed of 0.05, 0.075 and 0.1 mm/rev respectively. Because
conventional machining already achieves good surface finish at these small feed rates, the effect
of increasing Tmr is not significant on the surface finish as shown in Figure 6.24.
A smaller feed usually generates a better surface finish. However, at the speed of 150
m/min, a further decrease of the feed to 0.05mm/rev results in worse surface finish due to
plowing. Under this conventional machining condition, the surface roughness varies greatly at
different locations of the part indicating that plowing contributes significantly to the surface
roughness. Increasing the Tmr improves the average surface finish from 0.34 to 0.2 µm at the
feed of 0.05 mm/rev as shown in Figure 6.24.

143
Figure 6.24. Temperature effects on surface finish of hardened 4130 steel.
6.4.3. Precise Size Control
To measure the effect of thermal expansion on size control, the same cutting tool was
used throughout the LAM and conventional machining tests. Despite the variations found
among the original part diameters, the same radial position was used for all the tests. Thus the
actual depth of cut varies for different parts because of the variation of the incoming part size.
The diameters of multiple parts produced by LAM and conventional cutting were measured
when the parts cooled down. It was found that the actual depth of cut during LAM was 0.035
mm more than that of conventional machining, but the final dimensions or the tolerance of the
parts produced by LAM were as consistent as by conventional machining, which is shown in
Figure 6.25. Compared to conventional cutting, the slightly larger depth of cut during LAM was
mainly caused by two factors: first, more thermal expansion presented in the parts due to the
higher temperature gradients during LAM. The thermal expansion during LAM increases the
depth of cut by about 0.015 mm, which has been calculated with the temperature profile
predicted for the hollow cylindrical part by the thermal model. Secondly, the lower stiffness of
the work and tool holding setup used in this study contributes significantly to the dimensional
error of the parts produced by conventional cutting. The high radial cutting force during
conventional cutting of hardened steel reduces the actual depth of cut from the desired value.

144
The 20% decrease of the force reduces such a tendency so that the decrease of the depth of cut
during LAM becomes less than during conventional cutting, which explains the discrepancy
between the measured extra depth of cut and the diameter change due to thermal expansion.
Although both the stiffness and thermal expansion are sources to the dimensional error, precise
size control is achievable by improving the machine rigidity and finding a suitable LAM depth of
cut to minimize the dimensional error. Figure 6.25 shows that LAM produces parts with
consistent diameters even with the less machine rigidity of the current system.
Figure 6.25. Effect of thermal expansion on size control.
6.4.4. Microstructures
All the specimens were prepared by following the standard metallographic preparation
techniques, i.e., sectioning with an abrasive cutoff wheel, mounting in Bakelite, grinding and
polishing with diamond paste and then chemical etching in a 2% Nital solution. Figure 6.26
shows the subsurface microstructures after LAM and no microstructural change was observed
when comparing the machined subsurface after conventional machining with those after LAM.
These findings agree well with the microstructures predicted in Section 6.2, i.e., neither phase
change nor white layer forms on the machined surface under the LAM condition. This can be
explained by the fact that the bulk temperature is increased to around 200-270°C during LAM,
which softens the material, reduces the cutting force and heat generation while avoids reaching
the critical phase transformation temperature. Also compared with conventional cutting, LAM

145
alleviates the mechanical deformation effect on grain refinement and reduces the opportunity
of forming white layer.
Tmr = 24 °C
Tmr = 200 °C
Tmr = 270 °C
Figure 6.26. Optical microscopy of microstructures of the subsurface after LAM at speed of 180 m/min, feed of 0.075 mm/rev and various Tmr, 200X.
6.4.5. Hardness
The surface hardness was measured at 5 different locations for each cylindrical part
before and after LAM. The average hardness is 47.5 and 48.0 HRC for the parts as-received and
after LAM respectively. Figure 6.27 compares the surface hardness histograms before and after
LAM. The hardness of the as-received parts varies between 44 to 50 HRC, and in comparison
the hardness after LAM becomes more concentrated and ranges from 47 to 48.5 HRC. The
surface hardness measurements indicate that the machined surface produced by LAM was work
hardened uniformly due to an increase of dislocations; however the hardening effect due to SPD
in LAM is smaller than conventional cutting and does not produce white layer [207].
Before the micro-indentation hardness tests, an abrasive cutoff wheel was used for the
initial sectioning of the large workpiece with adequate coolant flow to minimize heat-induced
damage. All specimens were mounted in Bakelite, ground and polished with diamond paste.
The Vickers hardness tests were carried out on the specimens with the load of 1 kgf. The
resultant indentation diagonals were measured by a microscope and were used to calculate the
Vickers hardness number (HV). The diagonals of indentations are mostly within a narrow range
of 61~62 μm and thus corresponding hardness values are within the range of 482~498 HV. For
the hardness between 240 and 1040 HV, Eq. 6.12 was used to convert Vickers hardness number
to Rockwell C hardness number:

146
62.43 10119.0 .HRC
HV (6.12)
As can be seen from Figure 6.28, the hardness near the machined surface at different Tmr is
primarily concentrated around 48 HRC and increasing the Tmr up to 270 °C does not soften the
machined subsurface.
(a) As-received
(a) After LAM
Figure 6.27. Histograms of the hardness of the parts before and after LAM.
Figure 6.28. Subsurface hardness after LAM at speed of 180 m/min and feed of 0.075 mm/rev.
6.4.6. Residual Stress
Residual stress measurements by X-ray diffraction were conducted using the multiple
angle sin2ψ technique. The x-ray line profile fitting program, XFIT, was used to locate the

147
diffraction peak of the measurement at each ψ tilt angle. The x-ray parameters for 4340 steel of
50 HRC were used for the 4130 specimens in this study, which are shown in Table 6.3. Multiple
surface residual stress measurements were conducted for conditions 1-4, 7-9 and 11-12 using
multiple specimens. An electropolishing process was used to remove a layer of material in
depth direction for the subsurface measurements for conditions 1, 3, 7 and 9. Figure 6.29
shows the trend of the surface residual stresses at elevated temperatures for both the hoop and
axial directions. The residual stress in the hoop direction is tensile and is generally within the
range of 200~400 MPa. For the feeds of 0.075 and 0.1 mm/rev, the magnitude of the axial
stress is less than that of the hoop stress and ranges from -200 to 200 MPa. For the feed of 0.05
mm/rev, the compressive axial stress has a higher magnitude than that of the hoop stress and
ranges from -250 to -300 MPa. As Tmr increases from room temperature to 200 °C, the hoop
stress also increases by about 50~100 MPa.
Table 6.3. X-ray parameters for 4340 steel [208].
Alloy Radiation Lattice plane,
(hkl) Diffraction angle
2θ, (°) Elastic constants
(E/1 + ν) in (hkl), (GPa)
4340
(50 HRC) Cr Kα (211) 156.0 168.9 ± 2.8
(a) Hoop
(b) Axial
Figure 6.29. Surface residual stress of LAM of 4130.

148
LAM produces more compressive residual stress in the axial direction for the feeds of
0.075 and 0.1 mm/rev. Increasing Tmr from room temperature to around 200 °C reduces the
axial residual stress by about 150 MPa and produces more compressive residual stress. The
samples produced by conventional machining display a greater variance in hoop stress than
those produced by LAM. Feed has a strong effect on the residual stress. The residual stress
becomes more compressive in both the hoop and axial directions as the feed decreases from 0.1
to 0.05 mm/rev. For the feed of 0.05 mm/rev, compressive axial stress, -200~-300 MPa, is
evident in both LAM and conventional cutting and its magnitude is higher than that of the hoop
stress.
Figure 6.30 shows the subsurface residual stress measurements for the four conditions
under conventional machining and LAM. Stresses in both the hoop and axial directions drop
sharply within the first 20 µm below the surface. The stress penetration in both directions is
around 40~50 µm below the surface. The hoop stress is mainly tensile at the surface, but
becomes compressive about 10 µm below the surface with the peak compressive stress in the
range from -150 to -300 MPa. The axial stress is less tensile on the surface for the feed of 0.075
mm/rev and even becomes compressive for the feed of 0.05 mm/rev. The peak compressive
stress in the axial direction is higher than that in the hoop direction and is about –400 MPa for
all the four conditions.
The Tmr does not significantly alter the magnitude of the peak compressive stress in both
the hoop and axial directions. However, increasing the Tmr produces a slightly shallower depth
of maximum residual stress for both the hoop and axial directions, where the peak compressive
stress produced by LAM is about 5 µm closer to the surface than that produced by conventional
cutting. Feed has a strong effect on the hoop stress profile. Larger feed of 0.075 mm/rev
generates a deeper stress penetration and a larger peak compressive stress than the smaller
feed of 0.05 mm/rev. For the feed of 0.05 mm/rev, the peak compressive stress exists at about
15 µm below the surface for both directions and both temperatures. For the feed of 0.075
mm/rev, the peak compressive stress in the hoop direction is less than that in the axial direction
but the overall penetration is greater. The peak compressive stress exists at about 15 µm below
the surface in the axial direction but it is about 25~40 µm in the hoop direction.

149
(a) 0.075 mm/rev
(b) 0.05 mm/rev
Figure 6.30. Subsurface residual stress of LAM of 4130.
6.4.7. Discussions
The surface integrity of hardened steel transmission shafts produced by LAM has been
quantitatively studied in terms of surface roughness, dimensional accuracy, microhardness,
microstructures and residual stresses. The results presented in this study are valuable since
they show that LAM with at least a four-time faster material removal rate than the two-step
hard turning and grinding operations produces a good surface finish of Ra less than 0.3 µm, a
more concentrated surface hardness profile, no softening and no microstructure change in the
machined subsurface, less variation in the surface hoop residual stress and more compressive
surface axial residual stress. The feasibility of precise size control in LAM of hardened steel
components has also been demonstrated, which is usually a great concern for the industrial
applications.
The 20% cutting force reduction achieved during LAM reduced the workpiece deflection
and also slowed down tool wear progression. Because the tool wear developed at such a low
rate during LAM, it was not possible to complete tool wear tests due to the need of a very large
number of parts and the associated time and cost. However, the significant tool wear typically
encountered in hard turning not only deteriorates the surface finish but also causes the
formation of a hardened white layer near the machined surface, which is generally believed to
be detrimental to parts performance [49, 193, 194]. Compared to hard turning and grinding, the
impact of LAM on the part performance and fatigue life of the hardened steel components is of
great interest for the future study. Similar residual stress profiles in depth, but with less

150
variation, to those produced by conventional cutting prove that laser heating during LAM had no
detrimental effects on the workpiece machined subsurface.
6.5. Summary
The results of LAM of AISI 4130 shaft were experimentally analyzed by changing heating
and operating conditions, viz., average material removal temperature, cutting speed and feed.
The 3D transient thermal model has been expanded to predict the temperature field undergoing
laser-assisted profile turning. Compared to various conventional machining conditions, the
cutting force or the specific cutting energy during LAM dropped by about 20% as the Tmr
increased to above 200°C. The hardness of the machined surface after LAM typically ranges
from 47 to 48.5 HRC. In comparison, the hardness of the as-received parts spans from 44 to 50
HRC. For both LAM and conventional machining, similar hardness profiles were obtained on the
machined subsurface as shown through Vickers micro-indentation hardness testing, which
proves that increasing Tmr up to 270 °C is not detrimental to the workpiece hardness. The
simulation results show that LAM produces neither phase change nor white layer on the
machined surface, which has been validated through a microstructural analysis using an optical
microscope. During LAM, the actual depth of cut is slightly larger, but the resultant diameters
were consistent, indicating that depth of cut can be precisely controlled to achieve the desired
dimension. The samples produced by conventional machining display about twice the variance
in hoop stress than those produced by LAM. The residual stress becomes more compressive in
both the hoop and axial directions as the feed decreases from 0.1 to 0.05 mm/rev. Stresses in
both the hoop and axial directions drop sharply within the first 20 µm below the surface. The
stress penetration in both directions is around 40~50 µm below the surface. Larger feed of
0.075 mm/rev generates a deeper stress penetration and a larger peak compressive stress than
the smaller feed of 0.05 mm/rev in the hoop direction.

151
CHAPTER 7. CONCLUSIONS AND FUTURE WORK
7.1. Summary
A dislocation density-based numerical framework was developed to simulate grain
refinement for metallic materials subject to the machining processes. A coupled Eulerian-
Lagrangian finite element model was developed in ABAQUS to simulate steady-state chip
formation and grain refinement. Orthogonal cutting tests of Al 6061 T6 and OFHC Cu at cutting
speed ranging from 0.01 to 1.25 m/s, rake angel ranging from -20° to 20°, and depth of cut
ranging from 0.1 to 0.3 mm were modeled to simulate the cutting temperature, strain, grain size
and grain misorientation in the steady state chip and on the machined surface. The predictions
of steady-state chip formation, strain and strain rate distributions in the chip all matched well
with the actual measurements. The predictions of the average grain size in the chip generally
matched well with the measured values obtained in literature for all the tests of Al 6061 T6 and
OFHC Cu under varying cutting conditions. It has been shown that the grain size in the
machined chips of Al 6061 T6 was refined from an initial grain size of 75 µm to about 160, 100
and 80 nm under varying levels of applied shear strains ranging from 1.8 to 5.2 imposed by tool
rake angles ranging from 20° to -20°.
The numerical framework of grain refinement developed in this dissertation has been
shown to be a useful tool to design cutting process parameters for optimum refined
microstructures. A more negative rake angle tool helps further reduce the grain size in the chip
by imposing a larger strain, but the model simulation results show that cutting speed and
cutting temperature also strongly affect the final grain structure. Hence, the cutting parameters
have to be carefully designed to obtain the optimum microstructure in terms of both grain size
and misorientation angle. A small applied strain, high cutting speed and high cutting
temperature all contribute to a coarser elongated grain structure during cutting, while a more
randomly orientated microstructure should be achieved at a low cutting speed. The simulation
results demonstrated that the essential characteristics of the deformation field and grain

152
refinement mechanism during cutting were well captured by the dislocation density-based
material models.
A truly coupled metallo-thermo-mechanical model was proposed to solve for
mechanical deformation, thermal history, and microstructural composition in steels cutting. The
CEL model was used to simulate orthogonal cutting of AISI 1045 steel under various conditions,
with cutting speeds ranging from 198 to 879 m/min, feeds from 0.1 to 0.3 mm, and tool rake
angles from -7° to 5°. The evolution of phase constituents of the workpiece material was
modeled using a phase transformation kinetics model, and was solved simultaneously with
thermal and mechanical fields in cutting. The thermo-mechanical properties and the rate-
independent constitutive models of constituent phases of ferrite-pearlite, austenite and
martensite for AISI 1045 steel were used in the coupled analysis. A good agreement was
achieved in the chip formation, cutting force and cutting temperature between the model
predictions and the experimental data. The volume fractions of the transformed austenite were
predicted in the steady-state chips. The model predicted the tool-chip interface temperature
ranging from 1080 °C to 1396 °C for various cutting conditions investigated, and the discrepancy
between the model predictions and the experimental data was well below 10%. The model was
further validated in cutting force with discrepancies of less than 8% in cutting direction and 10-
19% in feed direction.
The developed metallo-thermo-mechanical coupled analysis was applied to the 3D hard
turning process for bearing steels to investigate the surface microstructure alteration,
particularly the white layer formation mechanisms. 3D hard turning simulations were
undertaken via AdvantEdge FEM software incorporating the material user subroutine for various
hard turning conditions, with cutting speeds ranging from 45 to 274.3 m/min, feeds from 0.05 to
0.127 mm, and tool flank wear land width from 0 to 0.3 mm. Both the thermally driven phase
transformation and mechanical grain refinement due to SPD were considered to model the
surface microstructural change. The model solved for the critical surface microstructural
attributes such as phase composition, grain size, and microhardness simultaneously in
AdvantEdge FEM. Through a quantitative assessment using the experimental data, the model
simulations proved that the white layers formed at low-to-moderate cutting speeds consisted of
a refined nanocrystalline microstructure, which was caused by severe plastic deformation but
not thermally driven phase transformation. The white layer formation at high cutting speeds

153
was caused by both thermally driven phase transformation and grain refinement due to SPD.
For instance, the simulation results found that at a cutting speed of 274.3 m/min, an increase of
surface hardness of 1.43 GPa was caused by a combination of martensitic transformation and
severe plastic deformation, whereas at a cutting speed of 91.4 m/min, an increase of surface
hardness of 0.83 GPa was predicted to be mainly caused by severe plastic deformation.
Subsurface residual stress profiles were also predicted, which agreed well with the experimental
data. The multi-physics modeling approach was shown to be a more comprehensive solution for
analyzing the surface microstructure alteration in hard turning and thermally enhanced
machining processes such as laser-assisted machining.
Microstructure and surface integrity has been further studied both experimentally and
numerically for difficult-to-machine materials during laser-assisted machining in both micro and
macro scales. For laser-assisted micro-milling, a comprehensive thermal and mechanical
analysis was conducted for Ti6Al4V, Inconel 718, and stainless steel AISI 422. The workpiece
temperature increase due to the laser heating and temperature variances in the cutting zone
were examined by a transient, 3D prismatic thermal model for various LAMM tests in side
cutting of bulk and fin workpiece configurations with a 30 W continuous CO2 laser and 100-300
µm diameter carbide endmills. A novel, arbitrary-Lagrangian–Eulerian based finite element
scheme was developed in ABAQUS/Explicit to simulate the continuous chip formation with
varying chip thickness in micro-milling. A strain gradient constitutive material model was
incorporated to model the size effect in micro-milling. The thermal analysis proved that fin
workpiece structure was the optimal design for LAMM within the present system constraints
with a temperature variance of 10 to 15 °C in the machined chamfer. The FE simulations
predicted uniform specific cutting energy along the cutting depth of 250 µm in LAMM fin side
cutting. The steady-state cutting temperature after many micromilling cycles was determined
by the heat transfer analysis. An empirical tool wear model was derived for a tungsten carbide
tool in fin side cutting based on LAMM bulk side cutting simulations and the model predicted
that the tool wear rate dropped from 0.62 to 0.15 µm/min as the workpiece temperature
increased from the ambient temperature to about 354 °C in fin side cutting of 422SS. The FE
model simulations further showed that built-up edge formation could be eliminated or reduced
in LAMM with proper heating of the workpiece material prior to the cutting tool.

154
One-step laser-assisted machining process was proposed for hardened AISI 4130 steel to
replace the hard turning and grinding operations. The surface integrity analysis was
experimentally conducted by changing heating and operating conditions, viz., average material
removal temperature, cutting speed and feed. The 3D transient thermal model has been
expanded to predict the temperature field inside the workpiece of complex geometry
undergoing laser-assisted profile turning. Microstructure of 4130 steel workpiece was simulated
using the 3D nose turning option in AdvantEdge FEM by considering both phase transformation
kinetics and grain refinement due to SPD. With the correct inputs of thermal and optical
properties, the infrared camera temperature measurement validated that the thermal model
accurately predicted workpiece surface temperatures during LAM. The FE simulation results
show that LAM produced neither phase change nor white layer on the machined surface. LAM
softened the material and reduced the heat generation by increasing the material bulk
temperature to around 200-270°C, which resulted in a surface temperature less than the critical
phase transformation temperature. The model prediction showed that grain size was slightly
reduced from 5 µm to 1-3 µm near the machined surface for both LAM and conventional cutting
conditions and the grain refinement was limited to be within a depth of 5 µm.
The experimental results of LAM of AISI 4130 shaft were presented by changing the
average material removal temperature from the room temperature to 300 °C, cutting speed
from 150 to 300 m/min and feed from 0.05 to 0.1 mm/rev. Compared to various conventional
machining conditions, the specific cutting energy during LAM dropped by about 20% as the Tmr
increased to above 200°C. The hardness of as-received 4130 steel workpieces varied between
44 to 50 HRC after heat treatment. The machined surface produced by LAM ranged from 47 to
48.5 HRC, which was work hardened uniformly due to an increase of dislocations. The
hardening effect due to SPD in LAM was smaller than conventional cutting and did not produce
white layer as validated using an optical microscope. Because of thermal expansion, LAM
produced a deeper cut; however the resultant diameters after LAM were shown to be very
consistent, which indicated that depth of cut can be precisely controlled to achieve the desired
dimension. The samples produced by conventional machining displayed about twice the
variance in hoop residual stress than those produced by LAM. The residual stress penetration in
both directions was around 40~50 µm below the surface of the parts produced by LAM. The

155
larger feed of 0.075 mm/rev generated a deeper stress penetration and a larger peak
compressive stress than the smaller feed of 0.05 mm/rev in the hoop direction.
7.2. Conclusions
In this dissertation, 1) grain refinement due to mechanical deformation in cutting was
quantitatively modeled for metallic materials using a dislocation density-based model. This
work is the first of its kind in machining and agrees well with experimental measurements. 2)
Phase change was truly coupled in the machining models. A metallo-thermo-mechanical
coupled numerical framework was developed to solve for the evolution of microstructural phase
constituents, grain refinement, cutting temperature, chip morphology, and cutting force
simultaneously. This comprehensive machining model has never been successfully done by
others before and has been proved as a useful numerical tool in analyzing surface integrity
issues, like white layer and subsurface microhardness, which are developed in hard machining
and laser-assisted machining. 3) Novel laser-assisted machining and micromachining techniques
were exploited to improve machinability and surface integrity for difficult-to-machine materials.
Tool performance, surface integrity and microstructure alteration in LAM has been studied by
the simultaneous experimental and numerical investigations of the process. In conclusion, LAM
showed considerable improvement in the machinability of the difficult-to-machine metal alloys
through increased material removal rate, increased tool life, and improved surface finish and
surface integrity.
7.3. Future Work
Some ideas for future research on the modeling and experimental sides are summarized
as follows:
The modeling strategy outlined for the dislocation density-based grain refinement
simulations can be extended to predict the microstructural evolution in SPD
processes, such as surface material enhancement via laser shock peening and
surface mechanical attrition treatment. This model would therefore assist in
designing the process parameters to achieve the optimal surface microstructure.

156
The metallo-thermo-mechanical coupled numerical framework discussed in this
dissertation is ideally suited to study surface treatment of large wind turbine gears
and bearings for a long lifetime expectancy. As the size of wind turbines increase,
the difficulties of producing highly reliable parts are even more challenging to
manufacture. The multi-physics model can be further extended to laser hardening
and laser cladding of wind turbine gears and bearings to enhance surface properties
and improve fatigue life.
Current manufacturing methods involve the machining process of hardened bearing
steels, which often leads to the development of a surface white layer. The white
layer formation mechanisms discussed in this dissertation can be applied to milling
and drilling of hardened steels to solve for the critical surface microstructural
attributes such as phase composition, grain size, and microhardness.
More experimental analyses are needed for surface integrity and subsurface
microstructure of nickel-based high temperature alloys and titanium alloys to
demonstrate the benefits of LAMM over conventional micromachining.
Further experiments are needed to apply laser-assisted profile turning to difficult-
to-machine materials including metal alloys, metal matrix composites and ceramics.
The thermal model and the metallo-thermo-mechanical coupled model can be
applied to help design the LAM experiments to achieve the maximum material
removal rate, longest tool life, and best surface integrity.

LIST OF REFERENCES

158
LIST OF REFERENCES
[1] Shin, Y. C., "Laser assisted machining: Its potential and future," Proc. 29th International Congress on Applications of Lasers and Electro-Optics, ICALEO 2010, September 26, 2010 - September 30, 2010, Laser Institute of America, pp. 513-522.
[2] Sun, S., Brandt, M., and Dargusch, M. S., 2010, "Thermally enhanced machining of hard-to-machine materials--A review," International Journal of Machine Tools and Manufacture, 50(8), pp. 663-680.
[3] Ezugwu, E. O., 2005, "Key improvements in the machining of difficult-to-cut aerospace superalloys," International Journal of Machine Tools and Manufacture, 45(12-13), pp. 1353-1367.
[4] Grzesik, W., and Wanat, T., 2005, "Comparative assessment of surface roughness produced by hard machining with mixed ceramic tools including 2D and 3D analysis," Journal of Materials Processing Technology, 169(3), pp. 364-371.
[5] Skvarenina, S., and Shin, Y. C., 2006, "Laser-assisted machining of compacted graphite iron," International Journal of Machine Tools and Manufacture, 46(1), pp. 7-17.
[6] Anderson, M., Patwa, R., and Shin, Y. C., 2006, "Laser-assisted machining of Inconel 718 with an economic analysis," International Journal of Machine Tools and Manufacture, 46(14), pp. 1879-1891.
[7] Dandekar, C. R., Shin, Y. C., and Barnes, J., 2010, "Machinability improvement of titanium alloy (Ti-6Al-4V) via LAM and hybrid machining," International Journal of Machine Tools and Manufacture, 50(2), pp. 174-182.
[8] Ding, H., and Shin, Y. C., 2010, "Laser-assisted machining of hardened steel parts with surface integrity analysis," International Journal of Machine Tools and Manufacture, 50(1), pp. 106-114.
[9] Rozzi, J. C., Pfefferkorn, F. E., Incropera, F. P., and Shin, Y. C., 2000, "Transient, three-dimensional heat transfer model for the laser assisted machining of silicon nitride: I. Comparison of predictions with measured surface temperature histories," International Journal of Heat and Mass Transfer, 43(8), pp. 1409-1424.

159
[10] Lei, S., Shin, Y. C., and Incropera, F. P., 2000, "Deformation mechanisms and constitutive modeling for silicon nitride undergoing laser-assisted machining," International Journal of Machine Tools and Manufacture, 40(15), pp. 2213-2233.
[11] Lei, S., Shin, Y. C., and Incropera, F. P., 1999, "Experimental investigation of thermo-mechanical characteristics in laser-assisted machining of silicon nitride ceramics," American Society of Mechanical Engineers, Manufacturing Engineering Division, MED, 10, pp. 781-788.
[12] Rozzi, J. C., Incropera, F. P., and Shin, Y. C., 2000, "Transient, three-dimensional heat transfer model for the laser assisted machining of silicon nitride: II. Assessment of parametric effects," International Journal of Heat and Mass Transfer, 43(8), pp. 1425-1437.
[13] Pfefferkorn, F. E., Shin, Y. C., Tian, Y., and Incropera, F. P., 2004, "Laser-assisted machining of magnesia-partially-stabilized zirconia," Journal of Manufacturing Science and Engineering, Transactions of the ASME, 126, pp. 42-51.
[14] Tian, Y., and Shin, Y. C., 2006, "Thermal modeling for laser-assisted machining of silicon nitride ceramics with complex features," Journal of Manufacturing Science and Engineering, Transactions of the ASME, 128, pp. 425-434.
[15] Tian, Y., and Shin, Y. C., 2006, "Laser-assisted machining of damage-free silicon nitride parts with complex geometric features via in-process control of laser power," Journal of the American Ceramic Society, 89, pp. 3397-3405.
[16] Tian, Y., Wu, B., Anderson, M., and Shin, Y. C., 2008, "Laser-assisted milling of silicon nitride ceramics and inconel 718," Journal of Manufacturing Science and Engineering, Transactions of the ASME, 130, p. 0310131.
[17] Tian, Y., Wu, B., and Shin, Y. C., "Laser-assisted milling of silicon nitride ceramics," Proc. International Conference on Manufacturing Science and Engineering, MSEC 2006, October 8, 2006 - October 11, 2006, American Society of Mechanical Engineers.
[18] Dandekar, C. R., and Shin, Y. C., 2010, "Laser-assisted machining of a fiber reinforced metal matrix composite," Journal of Manufacturing Science and Engineering, Transactions of the ASME, 132.
[19] Pfefferkorn, F. E., Lei, S., Jeon, Y., and Haddad, G., 2009, "A metric for defining the energy efficiency of thermally assisted machining," International Journal of Machine Tools and Manufacture, 49(5), pp. 357-365.
[20] Aramcharoen, A., and Mativenga, P. T., 2009, "Size effect and tool geometry in micromilling of tool steel," Precision Engineering, 33(4), pp. 402-407.
[21] Chae, J., Park, S. S., and Freiheit, T., 2006, "Investigation of micro-cutting operations," International Journal of Machine Tools and Manufacture, 46(3-4), pp. 313-332.

160
[22] Shelton, J. A., and Shin, Y. C., 2010, "Comparative evaluation of laser-assisted micro-milling for AISI 316, AISI 422, Ti-6Al-4V and inconel 718 in a side-cutting configuration," Journal of Micromechanics and Microengineering, 20, p. 075012.
[23] Shelton, J. A., and Shin, Y. C., 2010, "Experimental evaluation of laser-assisted micromilling in a slotting configuration," Journal of Manufacturing Science and Engineering, Transactions of the ASME, 132, p. 0210081.
[24] Stolyarov, V. V., Zhu, Y. T., Alexandrov, I. V., Lowe, T. C., and Valiev, R. Z., 2003, "Grain refinement and properties of pure Ti processed by warm ECAP and cold rolling," Materials Science and Engineering A, 343(1-2), pp. 43-50.
[25] Ni, H., and Alpas, A. T., 2003, "Sub-micrometer structures generated during dry machining of copper," Materials Science and Engineering A, 361(1-2), pp. 338-349.
[26] Elmadagli, M., and Alpas, A. T., 2003, "Metallographic analysis of the deformation microstructure of copper subjected to orthogonal cutting," Materials Science and Engineering A, 355(1-2), pp. 249-259.
[27] Swaminathan, S., Shankar, M. R., Lee, S., Hwang, J., King, A. H., Kezar, R. F., Rao, B. C., Brown, T. L., Chandrasekar, S., Compton, W. D., and Trumble, K. P., 2005, "Large strain deformation and ultra-fine grained materials by machining," Materials Science and Engineering A, 410-411, pp. 358-363.
[28] Zhang, H., and Alpas, A. T., 2002, "Quantitative evaluation of plastic strain gradients generated during orthogonal cutting of an aluminum alloy," Materials Science and Engineering A, 332(1-2), pp. 249-254.
[29] Shankar, M. R., Rao, B. C., Lee, S., Chandrasekar, S., King, A. H., and Compton, W. D., 2006, "Severe plastic deformation (SPD) of titanium at near-ambient temperature," Acta Materialia, 54(14), pp. 3691-3700.
[30] Shankar, M. R., Verma, R., Rao, B. C., Chandrasekar, S., Compton, W. D., King, A. H., and Trumble, K. P., 2007, "Severe plastic deformation of difficult-to-deform materials at near-ambient temperature," Proc. Metallurgical and Materials Transactions A: Physical Metallurgy and Materials Science, Springer Boston, pp. 1899-1905.
[31] Calistes, R., Swaminathan, S., Murthy, T. G., Huang, C., Saldana, C., Shankar, M. R., and Chandrasekar, S., 2009, "Controlling gradation of surface strains and nanostructuring by large-strain machining," Scripta Materialia, 60(1), pp. 17-20.
[32] Shankar, M. R., Chandrasekar, S., King, A. H., and Compton, W. D., 2005, "Microstructure and stability of nanocrystalline aluminum 6061 created by large strain machining," Acta Materialia, 53(18), pp. 4781-4793.
[33] Shankar, M. R., Rao, B. C., Chandrasekar, S., Dale Compton, W., and King, A. H., 2008, "Thermally stable nanostructured materials from severe plastic deformation of precipitation-treatable Ni-based alloys," Scripta Materialia, 58(8), pp. 675-678.

161
[34] Shekhar, S., Cai, J., Wang, J., and Shankar, M. R., 2009, "Multimodal ultrafine grain size distributions from severe plastic deformation at high strain rates," Materials Science and Engineering: A, 527(1-2), pp. 187-191.
[35] Swaminathan, S., Brown, T. L., Chandrasekar, S., McNelley, T. R., and Compton, W. D., 2007, "Severe plastic deformation of copper by machining: Microstructure refinement and nanostructure evolution with strain," Scripta Materialia, 56(12), pp. 1047-1050.
[36] Chou, Y. K., and Evans, C. J., 1999, "White layers and thermal modeling of hard turned surfaces," International Journal of Machine Tools and Manufacture, 39(12), pp. 1863-1881.
[37] Jawahir, I. S., Brinksmeier, E., M'Saoubi, R., Aspinwall, D. K., Outeiro, J. C., Meyer, D., Umbrello, D., and Jayal, A. D., 2011, "Surface integrity in material removal processes: Recent advances," CIRP Annals - Manufacturing Technology, 60(2), pp. 603-626.
[38] Umbrello, D., Outeiro, J. C., M'Saoubi, R., Jayal, A. D., and Jawahir, I. S., 2010, "A numerical model incorporating the microstructure alteration for predicting residual stresses in hard machining of AISI 52100 steel," CIRP Annals - Manufacturing Technology, 59(1), pp. 113-116.
[39] Shi, B., and Attia, H., 2010, "Current status and future direction in the numerical modeling and simulation of machining processes: A critical literature review," Machining Science and Technology, 14(2), pp. 149-188.
[40] Rebro, P. A., Pfefferkorn, F. E., Shin, Y. C., and Incropera, F. P., "Comparative assessment of laser-assisted machining for various ceramics," Proc. NAMRC XXX, May 21, 2002 - May 24, 2002, Society of Manufacturing Engineers, pp. 1-8.
[41] Pfefferkorn, F. E., Incropera, F. P., and Shin, Y. C., 2005, "Heat transfer model of semi-transparent ceramics undergoing laser-assisted machining," International Journal of Heat and Mass Transfer, 48(10), pp. 1999-2012.
[42] Gratias, J. F., Fan, L. J., Marot, G., Cohen, P., and Moisan, A., 1993, "Proposition of a method to optimize the machining of XC42 steel with laser assistance," CIRP Annals - Manufacturing Technology, 42, pp. 115-118.
[43] Germain, G., Morel, F., Lebrun, J. L., Morel, A., and Huneau, B., 2006, "Effect of laser assistance machining on residual stress and fatigue strength for a bearing steel (100Cr6) and a titanium alloy (Ti6Al4V)," Materials Science Forum, 524-525, pp. 569-574.
[44] Germain, G., Morel, F., Lebrun, J.-L., and Morel, A., 2007, "Machinability and surface integrity for a bearing steel and a titanium alloy in laser assisted machining (optimisation on LAM on two materials)," Lasers in Engineering, 17, pp. 329-344.
[45] Dumitrescu, P., Koshy, P., Stenekes, J., and Elbestawi, M. A., 2006, "High-power diode laser assisted hard turning of AISI D2 tool steel," International Journal of Machine Tools and Manufacture, 46(15), pp. 2009-2016.

162
[46] Attia, H., Tavakoli, S., Vargas, R., and Thomson, V., 2010, "Laser-assisted high-speed finish turning of superalloy Inconel 718 under dry conditions," CIRP Annals - Manufacturing Technology, 59(1), pp. 83-88.
[47] Yang, J., Sun, S., Brandt, M., and Yan, W., 2010, "Experimental investigation and 3D finite element prediction of the heat affected zone during laser assisted machining of Ti6Al4V alloy," Journal of Materials Processing Technology, 210(15), pp. 2215-2222.
[48] Liu, C. R., and Mittal, S., 1996, "Single-step superfinish hard machining: Feasibility and feasible cutting conditions," Robotics and Computer-Integrated Manufacturing, 12(1), pp. 15-27.
[49] Rech, J., and Moisan, A., 2003, "Surface integrity in finish hard turning of case-hardened steels," International Journal of Machine Tools and Manufacture, 43(5), pp. 543-550.
[50] Aramcharoen, A., Mativenga, P. T., Yang, S., Cooke, K. E., and Teer, D. G., 2008, "Evaluation and selection of hard coatings for micro milling of hardened tool steel," International Journal of Machine Tools and Manufacture, 48(14), pp. 1578-1584.
[51] Melkote, S., Kumar, M., Hashimoto, F., and Lahoti, G., 2009, "Laser assisted micro-milling of hard-to-machine materials," CIRP Annals - Manufacturing Technology, 58, pp. 45-48.
[52] Jeon, Y., 2008, "Laser-assisted micro end milling," Ph.D., The University of Wisconsin - Madison, Madison, WI.
[53] Liu, K., and Melkote, S. N., 2007, "Finite element analysis of the influence of tool edge radius on size effect in orthogonal micro-cutting process," International Journal of Mechanical Sciences, 49(5), pp. 650-660.
[54] Lai, X., Li, H., Li, C., Lin, Z., and Ni, J., 2008, "Modelling and analysis of micro scale milling considering size effect, micro cutter edge radius and minimum chip thickness," International Journal of Machine Tools and Manufacture, 48(1), pp. 1-14.
[55] Liu, X., DeVor, R. E., and Kapoor, S. G., 2006, "An analytical model for the prediction of minimum chip thickness in micromachining," Journal of Manufacturing Science and Engineering, Transactions of the ASME, 128, pp. 474-481.
[56] Liu, X., Devor, R. E., and Kapoor, S. G., 2007, "Model-based analysis of the surface generation in microendmilling - Part II: Experimental validation and analysis," Journal of Manufacturing Science and Engineering, Transactions of the ASME, 129, pp. 461-469.
[57] Liu, X., DeVor, R. E., Kapoor, S. G., and Ehmann, K. F., 2004, "The mechanics of machining at the microscale: assessment of the current state of the science," Transactions of the ASME. Journal of Manufacturing Science and Engineering, 126, pp. 666-678.
[58] Simoneau, A., Ng, E., and Elbestawi, M. A., 2006, "Surface defects during microcutting," International Journal of Machine Tools and Manufacture, 46(12-13), pp. 1378-1387.

163
[59] Lee, K., and Dornfeld, D. A., 2005, "Micro-burr formation and minimization through process control," Precision Engineering, 29(2), pp. 246-252.
[60] Filiz, S., Conley, C. M., Wasserman, M. B., and Ozdoganlar, O. B., 2007, "An experimental investigation of micro-machinability of copper 101 using tungsten carbide micro-endmills," International Journal of Machine Tools and Manufacture, 47(7-8), pp. 1088-1100.
[61] Singh, R., Alberts, M. J., and Melkote, S. N., 2008, "Characterization and prediction of the heat-affected zone in a laser-assisted mechanical micromachining process," International Journal of Machine Tools and Manufacture, 48, pp. 994-1004.
[62] Singh, R., Joseph, V., and Melkote, S., 2010, "A statistical approach to the optimization of a laser-assisted micromachining process," The International Journal of Advanced Manufacturing Technology, pp. 1-10.
[63] Singh, R., and Melkote, S. N., 2007, "Characterization of a hybrid laser-assisted mechanical micromachining (LAMM) process for a difficult-to-machine material," International Journal of Machine Tools and Manufacture, 47(7-8), pp. 1139-1150.
[64] Singh, R., and Melkote, S. N., 2009, "Force modeling in laser-assisted microgrooving including the effect of machine deflection," Journal of Manufacturing Science and Engineering, Transactions of the ASME, 131, pp. 0110131-0110139.
[65] Jeon, Y., and Pfefferkorn, F. E., 2008, "Effect of laser preheating the workpiece on micro end milling of metals," Journal of Manufacturing Science and Engineering, Transactions of the ASME, 130, p. 011004.
[66] Miguélez, M. H., Munoz-Sanchez, A., Cantero, J. L., and Loya, J. A., 2009, "An efficient implementation of boundary conditions in an ALE model for orthogonal cutting," Journal of Theoretcial and Applied Mechanics, 47(3), pp. 599-616.
[67] Miguélez, M. H., Zaera, R., Molinari, A., Cheriguene, R., and Rusinek, A., 2009, "Residual stresses in orthogonal cutting of metals: The effect of thermomechanical coupling parameters and of friction," Journal of Thermal Stresses, 32, pp. 269-289.
[68] Nasr, M. N. A., Ng, E. G., and Elbestawi, M. A., 2007, "Modelling the effects of tool-edge radius on residual stresses when orthogonal cutting AISI 316L," International Journal of Machine Tools and Manufacture, 47(2), pp. 401-411.
[69] Nasr, M. N. A., Ng, E. G., and Elbestawi, M. A., 2008, "A modified time-efficient FE approach for predicting machining-induced residual stresses," Finite Elements in Analysis and Design, 44(4), pp. 149-161.
[70] Umbrello, D., and Filice, L., 2009, "Improving surface integrity in orthogonal machining of hardened AISI 52100 steel by modeling white and dark layers formation," CIRP Annals - Manufacturing Technology, 58(1), pp. 73-76.

164
[71] Lorentzon, J., Järvstråt, N., and Josefson, B. L., 2009, "Modelling chip formation of alloy 718," Journal of Materials Processing Technology, 209(10), pp. 4645-4653.
[72] Calamaz, M., Coupard, D., and Girot, F., 2008, "A new material model for 2D numerical simulation of serrated chip formation when machining titanium alloy Ti-6Al-4V," International Journal of Machine Tools and Manufacture, 48(3-4), pp. 275-288.
[73] Sima, M., and Özel, T., 2010, "Modified material constitutive models for serrated chip formation simulations and experimental validation in machining of titanium alloy Ti-6Al-4V," International Journal of Machine Tools and Manufacture, 50(11), pp. 943-960.
[74] Umbrello, D., 2008, "Finite element simulation of conventional and high speed machining of Ti6Al4V alloy," Journal of Materials Processing Technology, 196(1-3), pp. 79-87.
[75] Rao, B., Dandekar, C. R., and Shin, Y. C., 2011, "An experimental and numerical study on the face milling of Ti-6Al-4V alloy: Tool performance and surface integrity," Journal of Materials Processing Technology, 211(2), pp. 294-304.
[76] Hua, J., and Shivpuri, R., 2005, "A Cobalt Diffusion Based Model for Predicting Crater Wear of Carbide Tools in Machining Titanium Alloys," Journal of Engineering Materials and Technology, 127(1), pp. 136-144.
[77] Lorentzon, J., and Järvstråt, N., 2008, "Modelling tool wear in cemented-carbide machining alloy 718," International Journal of Machine Tools and Manufacture, 48(10), pp. 1072-1080.
[78] Usui, E., Shirakashi, T., and Kitagawa, T., 1984, "Analytical prediction of cutting tool wear," Wear, 100, pp. 129-151.
[79] Chuzhoy, L., DeVor, R. E., Kapoor, S. G., and Bammann, D. J., 2002, "Microstructure-level modeling of ductile iron machining," Journal of Manufacturing Science and Engineering, Transactions of the ASME, 124, pp. 162-169.
[80] Chuzhoy, L., DeVor, R. E., Kapoor, S. G., Beaudoin, A. J., and Bammann, D. J., 2003, "Machining Simulation of ductile iron and its constituents, part 1: estimation of material model parameters and their validation," Transactions of the ASME. Journal of Manufacturing Science and Engineering, 125(Copyright 2003, IEE), pp. 181-191.
[81] Chuzhoy, L., DeVor, R. E., and Kapoor, S. G., 2003, "Machining Simulation of ductile iron and its constituents, part 2: numerical Simulation and experimental validation of Machining," Transactions of the ASME. Journal of Manufacturing Science and Engineering, 125, pp. 192-201.
[82] Park, S., Kapoor, S. G., and DeVor, R. E., 2007, "Microstructure-level model for the prediction of tool failure in coated WC-Co cutting tool materials during intermittent cutting," Journal of Manufacturing Science and Engineering, Transactions of the ASME, 129, pp. 893-901.

165
[83] Park, S., Kapoor, S. G., and DeVor, R. E., 2006, "Microstructure-level model for the prediction of tool failure in WC-Co cutting tool materials," Transactions of the ASME. Journal of Manufacturing Science and Engineering, 128, pp. 739-748.
[84] Park, S., Kapoor, S. G., and DeVor, R. E., 2004, "Mechanistic cutting process calibration via microstructure-level finite element simulation model," Transactions of the ASME. Journal of Manufacturing Science and Engineering, 126, pp. 706-709.
[85] Vogler, M. P., DeVor, R. E., and Kapoor, S. G., 2003, "Microstructure-level force prediction model for micro-milling of multi-phase materials," Journal of Manufacturing Science and Engineering, Transactions of the ASME, 125, pp. 202-209.
[86] Vogler, M. P., Kapoor, S. G., and DeVor, R. E., 2004, "On the modeling and analysis of machining performance in micro-endmilling, Part II: Cutting force prediction," Transactions of the ASME. Journal of Manufacturing Science and Engineering, 126, pp. 695-705.
[87] Dikshit, A., Samuel, J., DeVor, R. E., and Kapoor, S. G., 2008, "Microstructure-Level Machining Simulation of Carbon Nanotube Reinforced Polymer Composites---Part I: Model Development and Validation," Journal of Manufacturing Science and Engineering, 130(3), p. 031114.
[88] Dikshit, A., Samuel, J., DeVor, R. E., and Kapoor, S. G., 2008, "Microstructure-Level Machining Simulation of Carbon Nanotube Reinforced Polymer Composites---Part II: Model Interpretation and Application," Journal of Manufacturing Science and Engineering, 130(3), p. 031115.
[89] Dhanorker, A., and Özel, T., 2006, "An experimental and modeling study on meso/micro end milling process," Proc. 2006 ASME International Conference on Manufacturing Science and Engineering, MSEC2006 p. 21127.
[90] Liu, K., and Melkote, S. N., 2006, "Material strengthening mechanisms and their contribution to size effect in micro-cutting," Transactions of the ASME. Journal of Manufacturing Science and Engineering, 128, pp. 730-738.
[91] Tian, Y., Wu, B., Anderson, M., and Shin, Y. C., 2008, "Laser-assisted milling of silicon nitride ceramics and Inconel 718," Journal of Manufacturing Science and Engineering, Transactions of the ASME, 130, p. 031013.
[92] Ding, H., Shen, N., and Shin, Y. C., 2011, "Experimental evaluation and modeling analysis of micromilling of hardened H13 tool steels," Transactions of the ASME. Journal of Manufacturing Science and Engineering, 133(4), p. 041007.
[93] Petryk, H., and Stupkiewicz, S., 2007, "A quantitative model of grain refinement and strain hardening during severe plastic deformation," Materials Science and Engineering A, 444(1-2), pp. 214-219.

166
[94] Beygelzimer, Y., 2005, "Grain refinement versus voids accumulation during severe plastic deformations of polycrystals: mathematical simulation," Mechanics of Materials, 37(7), pp. 753-767.
[95] Arsenlis, A., and Parks, D. M., 1999, "Crystallographic aspects of geometrically-necessary and statistically-stored dislocation density," Acta Materialia, 47(5), pp. 1597-1611.
[96] Arsenlis, A., and Parks, D. M., 2002, "Modeling the evolution of crystallographic dislocation density in crystal plasticity," Journal of the Mechanics and Physics of Solids, 50(9), pp. 1979-2009.
[97] Ma, A., and Roters, F., 2004, "A constitutive model for fcc single crystals based on dislocation densities and its application to uniaxial compression of aluminium single crystals," Acta Materialia, 52(12), pp. 3603-3612.
[98] Ma, A., Roters, F., and Raabe, D., 2007, "A dislocation density based constitutive law for BCC materials in crystal plasticity FEM," Computational Materials Science, 39(1), pp. 91-95.
[99] Mohamed, F. A., 2003, "A dislocation model for the minimum grain size obtainable by milling," Acta Materialia, 51(14), pp. 4107-4119.
[100] Starink, M. J., Qiao, X. G., Zhang, J., and Gao, N., 2009, "Predicting grain refinement by cold severe plastic deformation in alloys using volume averaged dislocation generation," Acta Materialia, 57(19), pp. 5796-5811.
[101] Estrin, Y., Tóth, L. S., Molinari, A., and Bréchet, Y., 1998, "A dislocation-based model for all hardening stages in large strain deformation," Acta Materialia, 46(15), pp. 5509-5522.
[102] Tóth, L. S., Molinari, A., and Estrin, Y., 2002, "Strain hardening at large strains as predicted by dislocation based polycrystal plasticity model," Transactions of the ASME. Journal of Engineering Materials and Technology, 124, pp. 71-77.
[103] Baik, S. C., Hellmig, R. J., Estrin, Y., and Kim, H. S., 2003, "Modeling of deformation behavior of copper under equal channel angular pressing," Zeitschrift fur Metallkunde, 94, pp. 754-760.
[104] Baik, S. C., Estrin, Y., Kim, H. S., and Hellmig, R. J., 2003, "Dislocation density-based modeling of deformation behavior of aluminum under equal channel angular pressing," Materials Science and Engineering: A, 351(1-2), pp. 86-97.
[105] Baik, S. C., Estrin, Y., Kim, H. S., Jeong, H.-T., and Hellmig, R. J., 2002, "Calculation of deformation behavior and texture evolution during equal channel angular pressing of IF steel using dislocation based modeling of strain hardening," Materials Science Forum, 408-412, pp. 697-702.
[106] Kim, H. S., and Estrin, Y., 2005, "Microstructural modelling of equal channel angular pressing for producing ultrafine grained materials," Materials Science and Engineering A, 410-411, pp. 285-289.

167
[107] Lemiale, V., Estrin, Y., Kim, H. S., and O'Donnell, R., 2010, "Grain refinement under high strain rate impact: A numerical approach," Computational Materials Science, 48(1), pp. 124-132.
[108] Hosseini, E., and Kazeminezhad, M., 2009, "A hybrid model on severe plastic deformation of copper," Computational Materials Science, 44(4), pp. 1107-1115.
[109] Hosseini, E., and Kazeminezhad, M., 2011, "Implementation of a constitutive model in finite element method for intense deformation," Materials & Design, 32(2), pp. 487-494.
[110] Zherebtsov, S. V., Dyakonov, G. S., Salem, A. A., Malysheva, S. P., Salishchev, G. A., and Semiatin, S. L., 2011, "Evolution of grain and subgrain structure during cold rolling of commercial-purity titanium," Materials Science and Engineering: A, 528(9), pp. 3474-3479.
[111] Stolyarov, V. V., Zeipper, L., Mingler, B., and Zehetbauer, M., 2008, "Influence of post-deformation on CP-Ti processed by equal channel angular pressing," Materials Science and Engineering: A, 476(1-2), pp. 98-105.
[112] Shin, D. H., Kim, I., Kim, J., Kim, Y. S., and Semiatin, S. L., 2003, "Microstructure development during equal-channel angular pressing of titanium," Acta Materialia, 51(4), pp. 983-996.
[113] Pachla, W., Kulczyk, M., Sus-Ryszkowska, M., Mazur, A., and Kurzydlowski, K. J., 2008, "Nanocrystalline titanium produced by hydrostatic extrusion," Journal of Materials Processing Technology, 205(1-3), pp. 173-182.
[114] Wu, S., Fan, K., Jiang, P., and Chen, S., 2010, "Grain refinement of pure Ti during plastic deformation," Materials Science and Engineering: A, 527(26), pp. 6917-6921.
[115] Argon, A. S., and Haasen, P., 1993, "A new mechanism of work hardening in the late stages of large strain plastic flow in F.C.C. and diamond cubic crystals," Acta Metallurgica et Materialia, 41(11), pp. 3289-3306.
[116] Zhu, K. Y., Vassel, A., Brisset, F., Lu, K., and Lu, J., 2004, "Nanostructure formation mechanism of [alpha]-titanium using SMAT," Acta Materialia, 52(14), pp. 4101-4110.
[117] Yang, D. K., Cizek, P., Hodgson, P. D., and Wen, C. E., 2010, "Microstructure evolution and nanograin formation during shear localization in cold-rolled titanium," Acta Materialia, 58(13), pp. 4536-4548.
[118] Zhu, Y. T., Huang, J. Y., Gubicza, J., Ungar, T., Wang, Y. M., Ma, E., and Valiev, R. Z., 2003, "Nanostructures in Ti processed by severe plastic deformation," Journal of Materials Research, 18, pp. 1908-1917.
[119] Inoue, T., 2002, "Metallo-thermo-mechanics—Application to quenching," Handbook of Residual Stress and Deformation of Steel, G. E. Totten, M. A. H. Howes, and T. Inoue, eds., ASM International, Materials Park, OH, pp. 296-311.

168
[120] Denis, S., Archambault, P., Gautier, E., Simon, A., and Beck, G., 2002, "Prediction of residual stress and distortion of ferrous and non-ferrous metals: Current status and future developments," Journal of Materials Engineering and Performance, 11(1), pp. 92-102.
[121] Bailey, N. S., Tan, W., and Shin, Y. C., 2009, "Predictive modeling and experimental results for residual stresses in laser hardening of AISI 4140 steel by a high power diode laser," Surface and Coatings Technology, 203, pp. 2003-2012.
[122] Ashby, M. F., and Easterling, K. E., 1984, "The transformation hardening of steel surfaces by laser beams--I. Hypo-eutectoid steels," Acta Metallurgica, 32(11), pp. 1935-1937.
[123] Skvarenina, S., and Shin, Y. C., 2006, "Predictive modeling and experimental results for laser hardening of AISI 1536 steel with complex geometric features by a high power diode laser," Surface and Coatings Technology, 201, pp. 2256-2269.
[124] Patwa, R., and Shin, Y. C., 2007, "Predictive modeling of laser hardening of AISI5150H steels," International Journal of Machine Tools and Manufacture, 47(2), pp. 307-320.
[125] Mahdi, M., and Zhang, L., 1998, "Applied mechanics in grinding—VI. Residual stresses and surface hardening by coupled thermo-plasticity and phase transformation," International Journal of Machine Tools and Manufacture, 38(10-11), pp. 1289-1304.
[126] Mahdi, M., and Zhang, L., 1999, "Applied mechanics in grinding. Part 7: residual stresses induced by the full coupling of mechanical deformation, thermal deformation and phase transformation," International Journal of Machine Tools and Manufacture, 39(8), pp. 1285-1298.
[127] Ramesh, A., and Melkote, S. N., 2008, "Modeling of white layer formation under thermally dominant conditions in orthogonal machining of hardened AISI 52100 steel," International Journal of Machine Tools and Manufacture, 48, pp. 402-414.
[128] Burns, T. J., Mates, S. P., Rhorer, R. L., Whitenton, E. P., and Basak, D., 2011, "Dynamic properties for modeling and simulation of machining: Effect of pearlite to austenite phase transition on flow stress in AISI 1075 steel," Machining Science and Technology, 15, pp. 1-20.
[129] Burns, T. J., Mates, S. P., Rhorer, R. L., Whitenton, E. P., and Basak, D., "Effect on flow stress of a rapid phase transition in AISI 1045 steel," Proc. Proceedings of the 2011 ASME International Manufacturing Science and Engineering Conference, MSEC2011-50229, American Society of Mechanical Engineers.
[130] Griffiths, B. J., 1987, "Mechanisms of white layer generation with reference to machining and deformation processes," Journal of Tribology, 109, pp. 525-530.
[131] Sauvage, X., Le Breton, J. M., Guillet, A., Meyer, A., and Teillet, J., 2003, "Phase transformations in surface layers of machined steels investigated by X-ray diffraction and Mössbauer spectrometry," Materials Science and Engineering A, 362(1-2), pp. 181-186.

169
[132] Li, J. G., Umemoto, M., Todaka, Y., and Tsuchiya, K., 2007, "A microstructural investigation of the surface of a drilled hole in carbon steels," Acta Materialia, 55, pp. 1397-1406.
[133] Todaka, Y., Umemoto, M., Li, J., and Tsuchiya, K., 2005, "Nanocrystallization of drill hole surface by high speed drilling," Journal of Metastable and Nanocrystalline Materials, 24-25, pp. 601-604.
[134] Ramesh, A., Melkote, S. N., Allard, L. F., Riester, L., and Watkins, T. R., 2005, "Analysis of white layers formed in hard turning of AISI 52100 steel," Materials Science and Engineering A, 390(1-2), pp. 88-97.
[135] Umbrello, D., Jayal, A. D., Caruso, S., Dillon, O. W., and Jawahir, I. S., 2010, "Modeling of white and dark layer formation in hard machining of AISI 52100 bearing steel," Machining Science and Technology, 14, pp. 128-147.
[136] Shi, J., and Liu, C. R., 2006, "On predicting chip morphology and phase transformation in hard machining," International Journal of Advanced Manufacturing Technology, 27, pp. 645-654.
[137] Umbrello, D., and Jawahir, I. S., 2009, "Numerical modeling of the influence of process parameters and workpiece hardness on white layer formation in AISI 52100 steel," International Journal of Advanced Manufacturing Technology, 44, pp. 955-968.
[138] Caruso, S., Di Renzo, S., Umbrello, D., Jayal, A. D., Dillon, O. W., and Jawahir, I. S., "Finite element modeling of microstructural changes in hard turning," Proc. 17th CIRP Conference on Modelling of Machining Operations, May 12, 2011 - May 13, 2011, Trans Tech Publications, pp. 960-968.
[139] ABAQUS, 2010, ABAQUS User's Manual, Version 6.10, Hibbitt, Karlsson & Sorensen, Inc., Pawtucket, RI.
[140] Joshi, S. S., and Melkote, S. N., 2004, "An explanation for the size-effect in machining using strain gradient plasticity," Transactions of the ASME. Journal of Manufacturing Science and Engineering, 126, pp. 679-684.
[141] Peyre, P., Chaieb, I., and Braham, C., 2007, "FEM calculation of residual stresses induced by laser shock processing in stainless steels," Model Simul Mater Sci Eng, 15, pp. 205-221.
[142] Kobayashi, T., Simons, J. W., Brown, C. S., and Shockey, D. A., 2008, "Plastic flow behavior of Inconel 718 under dynamic shear loads," International Journal of Impact Engineering, 35, pp. 389-396.
[143] CINDAS, 2011, "Thermophysical Properties of Matter Database (TPMD)," CINDAS LLC, West Lafayette, IN.
[144] Davis, J. W., 1997, "Shear Modulus of Inconel 718," Iter Material Properties Handbook, AD02-2112(3), pp. 1-3.

170
[145] Fukuhara, M., and Sanpei, A., 1993, "Elastic Moduli and Internal Frictions of Inconel 718 and Ti-6Al-4V as a Function of Temperature," Journal of Materials Science Letters, 12, pp. 1122-1124.
[146] Park, S. S., 2007, "Development of a microstructure-level finite element model for the prediction of tool failure by chipping in tungsten carbide-cobalt systems," Ph.D., University of Illinois at Urbana-Champaign, Urbana, IL.
[147] Özerdem, B., 2000, "Measurement of convective heat transfer coefficient for a horizontal cylinder rotating in quiescent air," International Communications in Heat and Mass Transfer, 27(3), pp. 389-395.
[148] Ohgo, K., 1978, "The adhesion mechanism of the built-up edge and the layer on the rake face of a cutting tool," Wear, 51, pp. 117-126.
[149] Estrin, Y., and Kim, H. S., 2007, "Modelling microstructure evolution toward ultrafine crystallinity produced by severe plastic deformation," Journal of Materials Science, 42, pp. 1512-1516.
[150] Mohamed, F. A., and Xun, Y., 2003, "Correlations between the minimum grain size produced by milling and material parameters," Materials Science and Engineering A, A354, pp. 133-139.
[151] Ding, H., Shen, N., and Shin, Y. C., 2010, "A numerical approach of predicting grain refinement during multi-pass cold rolling," Journal of materials processing technology.
[152] Fang, N., 2005, "A new quantitative sensitivity analysis of the flow stress of 18 engineering materials in machining," Transactions of the ASME. Journal of Engineering Materials and Technology, 127, pp. 192-196.
[153] Johnson, G. R., and Cook, W. H., 1983, "A constitutive model and data for metals subjected to large strains, high rates and high temperatures," in Proceedings of the Seventh International Symposium on Ballistics. The Netherlands: The Hague, pp. 541-547.
[154] Cai, J., Shekhar, S., Wang, J., and Shankar, M. R., 2009, "Nanotwinned microstructures from low stacking fault energy brass by high-rate severe plastic deformation," Scripta Materialia, 60(8), pp. 599-602.
[155] Pantleon, W., 2005, "On the apparent saturation of the average disorientation angle with plastic deformation," Scripta Materialia, 53(6), pp. 757-762.
[156] Ivester, R. W., Kennedy, M., Davies, M., Stevenson, R., Thiele, J., Furness, R., and Athavale, S., 2000, "Assessment of machining models: progress report," Machining Science and Technology, 4(3), pp. 511-538.
[157] Lakhkar, R. S., Shin, Y. C., and Krane, M. J. M., 2008, "Predictive modeling of multi-track laser hardening of AISI 4140 steel," Materials Science and Engineering A, 480, pp. 209-217.

171
[158] Lee, C.-H., and Chang, K.-H., 2009, "Finite element simulation of the residual stresses in high strength carbon steel butt weld incorporating solid-state phase transformation," Computational Materials Science, 46(4), pp. 1014-1022.
[159] Lee, C.-H., and Chang, K.-H., 2011, "Prediction of residual stresses in high strength carbon steel pipe weld considering solid-state phase transformation effects," Computers & Structures, 89(1-2), pp. 256-265.
[160] Deng, D., 2009, "FEM prediction of welding residual stress and distortion in carbon steel considering phase transformation effects," Materials & Design, 30(2), pp. 359-366.
[161] Simsir, C., and Gür, C. H., 2008, "3D FEM simulation of steel quenching and investigation of the effect of asymmetric geometry on residual stress distribution," Journal of Materials Processing Technology, 207(1-3), pp. 211-221.
[162] Bailey, N. S., and Shin, Y. C., "Optimization of laser hardening processes for industrial parts with complex geometry via predictive modeling," Proc. Proceedings of the 2009 ASME International Manufacturing Science and Engineering Conference, MSEC2009, American Society of Mechanical Engineers, pp. 647-656.
[163] Han, S., Melkote, S. N., Haluska, M. S., and Watkins, T. R., 2008, "White layer formation due to phase transformation in orthogonal machining of AISI 1045 annealed steel," Materials Science and Engineering A, 488, pp. 195-204.
[164] Lee, S.-J., Pavlina, E. J., and Van Tyne, C. J., 2010, "Kinetics modeling of austenite decomposition for an end-quenched 1045 steel," Materials Science and Engineering: A, 527(13-14), pp. 3186-3194.
[165] Bhadeshia, H. K. D. H., 2002, "Material factors," Handbook of Residual Stress and Deformation of Steel, G. E. Totten, M. A. H. Howes, and T. Inoue, eds., ASM International, Materials Park, OH, pp. 3-10.
[166] Iqbal, S. A., Mativenga, P. T., and Sheikh, M. A., 2007, "Characterization of machining of AISI 1045 steel over a wide range of cutting speeds. Part 2: Evaluation of flow stress models and interface friction distribution schemes," Proceedings of the Institution of Mechanical Engineers, Part B: Journal of Engineering Manufacture, 221, pp. 917-926.
[167] Davis, J. R., 1996, Cast Irons (ASM Specialty Handbook), ASM international, Materials Park, OH.
[168] Sharma, V. K., Breyer, N. N., Abe, N., and Schwartz, L. H., 1974, "Effects of plastic deformation on the density of a medium carbon martensite," Scripta Metallurgica, 8(6), pp. 699-701.
[169] Jaspers, S. P. F. C., and Dautzenberg, J. H., 2002, "Material behaviour in conditions similar to metal cutting: flow stress in the primary shear zone," Journal of Materials Processing Technology, 122(2-3), pp. 322-330.

172
[170] Iwamoto, T., Tsuta, T., and Tomita, Y., 1998, "Investigation on deformation mode dependence of strain-induced martensitic transformation in trip steels and modelling of transformation kinetics," International Journal of Mechanical Sciences, 40(2-3), pp. 173-182.
[171] Iwamoto, T., 2004, "Multiscale computational simulation of deformation behavior of TRIP steel with growth of martensitic particles in unit cell by asymptotic homogenization method," International Journal of Plasticity, 20(4-5), pp. 841-869.
[172] Simsir, C., and Gür, C. H., 2008, "A FEM based framework for simulation of thermal treatments: Application to steel quenching," Computational Materials Science, 44(2), pp. 588-600.
[173] Ferro, P., Porzner, H., Tiziani, A., and Bonollo, F., 2006, "The influence of phase transformations on residual stresses induced by the welding process-3D and 2D numerical models," Modelling and Simulation in Materials Science and Engineering, 14, pp. 117-136.
[174] Yaghi, A. H., Hyde, T. H., Becker, A. A., and Sun, W., 2008, "Finite element simulation of welding and residual stresses in a P91 steel pipe incorporating solid-state phase transformation and post-weld heat treatment," Journal of Strain Analysis for Engineering Design, 43, pp. 275-293.
[175] Rammerstorfer, F. G., Fischer, D. F., Mitter, W., Bathe, K. J., and Snyder, M. D., 1981, "On thermo-elastic-plastic analysis of heat-treatment processes including creep and phase changes," Computers and Structures, 13, pp. 771-779.
[176] Lalwani, D. I., Mehta, N. K., and Jain, P. K., 2009, "Extension of Oxley's predictive machining theory for Johnson and Cook flow stress model," Journal of Materials Processing Technology, 209(12-13), pp. 5305-5312.
[177] Karpat, Y., and Özel, T., 2006, "Predictive Analytical and Thermal Modeling of Orthogonal Cutting Process---Part I: Predictions of Tool Forces, Stresses, and Temperature Distributions," Journal of Manufacturing Science and Engineering, Transactions of the ASME, 128(2), pp. 435-444.
[178] Iqbal, S. A., Mativenga, P. T., and Sheikh, M. A., 2007, "Characterization of machining of AISI 1045 steel over a wide range of cutting speeds. Part 1: Investigation of contact phenomena," Proceedings of the Institution of Mechanical Engineers, Part B: Journal of Engineering Manufacture, 221, pp. 909-916.
[179] Ding, H., Shen, N., and Shin, Y. C., 2012, "Thermal and mechanical modeling analysis of laser-assisted micro-milling of difficult-to-machine alloys," Journal of Materials Processing Technology, 212(3), pp. 601-613.
[180] Özel, T., 2006, "The influence of friction models on finite element simulations of machining," International Journal of Machine Tools and Manufacture, 46(5), pp. 518-530.

173
[181] Oxley, P. L. B., 1989, The mechanics of machining: an analytical approach to assessing machinability, Ellis Horwood Ltd., England.
[182] Zhang, X., Wu, S., Wang, H., and Liu, C. R., 2011, "Predicting the Effects of Cutting Parameters and Tool Geometry on Hard Turning Process Using Finite Element Method," Journal of Manufacturing Science and Engineering, 133(4), p. 041010.
[183] Vander Voort, G. F., 1991, "Atlas of Time-Temperature Diagrams for Irons and Steels," ASM International.
[184] Li, B. L., Godfrey, A., Meng, Q. C., Liu, Q., and Hansen, N., 2004, "Microstructural evolution of IF-steel during cold rolling," Acta Materialia, 52(4), pp. 1069-1081.
[185] Ding, H., and Shin, Y. C., 2012, "Dislocation density-based modeling of subsurface grain refinement with laser-induced shock compression," Computational Materials Science, 53(1), pp. 79-88.
[186] Ding, H., and Shin, Y. C., "Dislocation density-based grain refinement modeling of orthogonal cutting of commercially pure titanium," Proc. Proceedings of the 2011 ASME International Manufacturing Science and Engineering Conference, MSEC2011-50220, American Society of Mechanical Engineers.
[187] Ding, H., Shen, N., and Shin, Y. C., 2011, "Modeling of grain refinement in aluminum and copper subjected to cutting," Computational Materials Science, 50(10), pp. 3016-3025.
[188] Marusich, T., 2011, AdvantEdge FEM 5.8 User's Manual, Third Wave Systems Inc., Minneapolis, MN.
[189] Chou, Y. K., and Hui, S., 2004, "Tool nose radius effects on finish hard turning," Journal of Materials Processing Technology, 148, pp. 259-268.
[190] Poulachon, G., Albert, A., Schluraff, M., and Jawahir, I. S., 2005, "An experimental investigation of work material microstructure effects on white layer formation in PCBN hard turning," International Journal of Machine Tools & Manufacture, 45, pp. 211-218.
[191] Guo, Y. B., and Sahni, J., 2004, "A comparative study of hard turned and cylindrically ground white layers," International Journal of Machine Tools and Manufacture, 44(2–3), pp. 135-145.
[192] Grzesik, W., Rech, J., and Wanat, T., 2007, "Surface finish on hardened bearing steel parts produced by superhard and abrasive tools," International Journal of Machine Tools and Manufacture, 47(2), pp. 255-262.
[193] XuePing, Z., Liu, C. R., and Zhenqiang, Y., 2007, "Experimental study and evaluation methodology on hard surface integrity," International Journal of Advanced Manufacturing Technology, 34, pp. 141-148.

174
[194] Jacobson, M., 2002, "Surface integrity of hard-turned M50 steel," Professional Engineering Publishing Ltd., pp. 47-54.
[195] Zorc, T. B. e. a. E., 1990, "Properties and Selection: Irons, Steels, and High-performance Alloys," Metals Handbook v1, 10th ed., ASM International.
[196] Murthy, J. Y., and Mathur, S. R., 1998, "A conservative numerical scheme for the energy equation," Transactions of the ASME. Journal of Heat Transfer, 120, pp. 1081-1086.
[197] Patankar, S. V., 1980, Numerical heat transfer and fluid flow, Hemisphere Pub. Corp. ; McGraw-Hill, Washington; New York.
[198] Rozzi, J. C., Krane, M. J. M., Incropera, F. P., and Shin, Y. C., "Numerical prediction of three-dimensional unsteady temperatures in a rotating cylindrical workpiece subjected to localized heating by a translating laser source," Proc. Proceedings of the 1995 ASME International Mechanical Engineering Congress and Exposition, November 12, 1995 - November 17, 1995, ASME, pp. 399-411.
[199] Davis, J. R., 2000, "Alloy Digest," ASM International, Alloy Digest Inc, New Jersey.
[200] Joeckle, R. C., Schellhorn, M., Stern, G., Sontag, A., and Gautier, B., 1994, "Influence of the wavelength for infrared laser effects on metals and dielectrics," SPIE Laser Applications, 2097, pp. 139-145.
[201] Stern, G., 1990, "Absorptivity of cw CO2, CO and YAG-laser beams by different metallic alloys," Proceedings of the 3rd European Conference on Laser Treatment of Materials, Erlangen, Germany, pp. 25-35.
[202] Pantsar, H., and Kujanp, V., 2004, "Effect of oxide layer growth on diode laser beam transformation hardening of steels, Surface & Coatings Technology," Surface & Coatings Technology, 200, pp. 2627-2633.
[203] Özel, T., Karpat, Y., and Srivastava, A., 2008, "Hard turning with variable micro-geometry PcBN tools," CIRP Annals - Manufacturing Technology, 57(1), pp. 73-76.
[204] Lampman, S. R., and Zorc, T. B., 1990, "Properties and Selection: Irons, Steels, and High-performance Alloys," Metals Handbook, ASM International, Materials Park, OH.
[205] Lee, W.-S., and Yeh, G.-W., 1997, "The plastic deformation behaviour of AISI 4340 alloy steel subjected to high temperature and high strain rate loading conditions," Journal of Materials Processing Technology, 71(2), pp. 224-234.
[206] Klopp, W. D., 1995, "Aerospace Structural Metals Handbook," Purdue Research Foundation, West Lafayette, Indiana.
[207] Ding, H., and Shin, Y. C., 2012, "Improvement of machinability of waspaloy via laser-assisted machining," International Journal of Advanced Manufacturing Technology, In Press, DOI: 10.1007/s00170-012-4012-8.

175
[208] Vander Voort, G. F., 2004, "ASM Handbook: Metallography and Microstructures," ASM International.

VITA

177
VITA
Hongtao Ding School of Mechanical Engineering, Purdue University
Hongtao Ding received his BSME (2002, with a minor in Applied Mathematics) from
Shanghai Jiao Tong University, China, and MSME (2004) from the University of Michigan at Ann
Arbor. His research interests are in experimental analysis and physics-based modeling of
manufacturing processes with a focus on a) thermally enhanced machining and micromachining
and b) microstructural alteration. He is a recipient of Best Paper Award from ASME/MSEC2011
for his research on grain refinement modeling in titanium cutting, and has received a Lambert
Teaching Fellowship from Purdue University.


![Corrosion Protection.ppt [Read-Only] - Engineering …css.engineering.uiowa.edu/~swan/courses/53086/corrosion_protection.pdfCorrosion Protection Basic corrosion theory and ... electrical](https://img.dokumen.tips/doc/110x75/5b0c34537f8b9af65e8ba3f1/corrosion-read-only-engineering-cssengineeringuiowaeduswancourses53086corrosionprotectionpdfcorrosion.jpg)