Embed Size (px)
Citation preview

Microsoft Cloud Practice
Development Study
November 2016
MDC Research

• All differences reported as “significant” are found to be significantly different at the 95% confidence level (or greater) using a standard t-test
t-test
WHO, WHAT, WHERE
Objectives and Methodology
WHY

Currently, 20% of overall revenue is driven by
cloud-based products and services; research
participants anticipate that proportion
will more than double in the next
two years, to 47%.
Referrals and LinkedIn are top sources for
identifying skilled labor. Once a candidate is
identified, work history, cultural fit, and years of
experience become the important considerations.
Roles associated with cloud practices typically
have at least 3 years’ experience. Furthermore,
most companies engage in at least annual
ongoing staff learning efforts like conferences,
events and online training. A median of
8.5% of technical resources time is spent
on training.
Two in three cite less than one year required for their company to reach profitability on new practices. Pain points in building those practices center around customer objections to cloud, employee training, and lead generation.
Leads are typically generated in-house through sales activities and demand generation.
Most survey participants have a Cloud Infrastructure and Management practice (78%) or a Cloud Application Development practice (53%). Fewer offer Mobility + Security (46%) and Data Platform & Analytics (43%). Just over half of these practices are less than two years old.
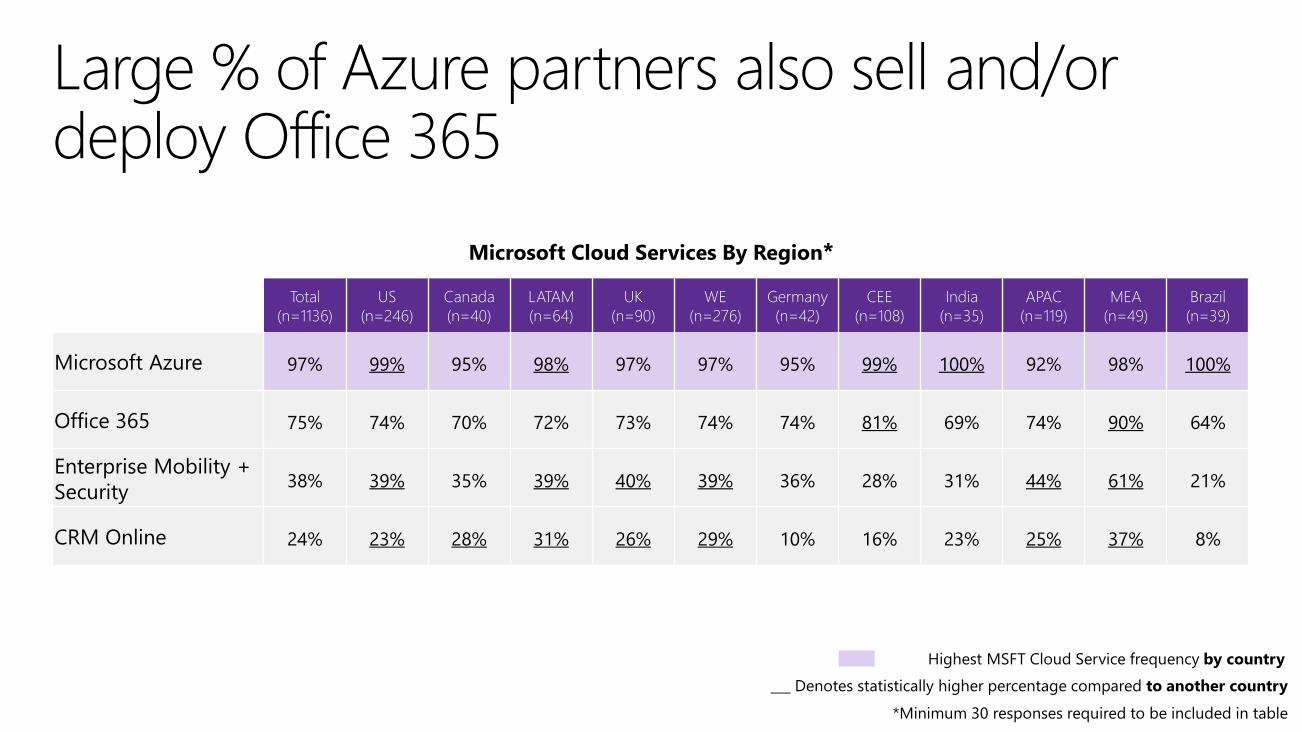
Nearly all offer Azure, while about three quarters offer Office 365. Fewer than half offer Enterprise Mobility + Security or CRM Online.
Value added services including Project Services,
Managed Services & Packaged Software
represent 74% of partner revenue in SMB and
82% in Enterprise.
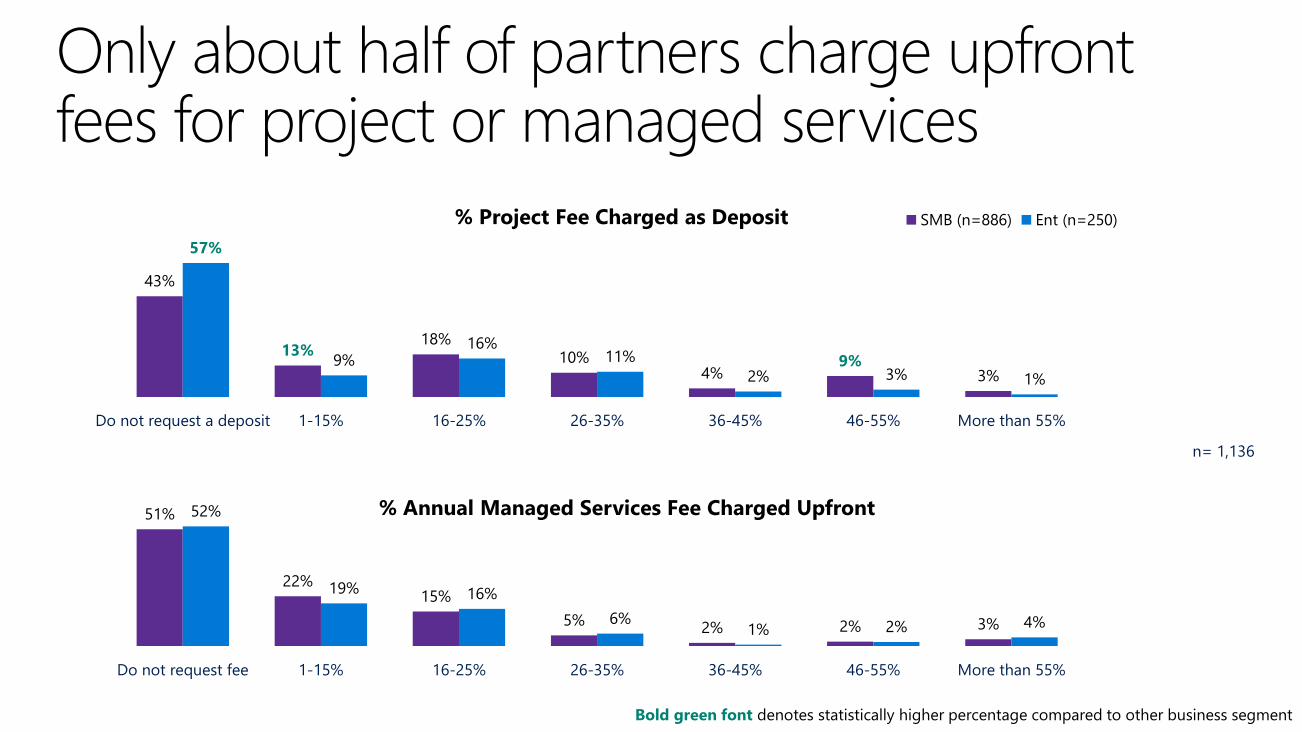
Only about half charge upfront fees for project or managed services. Those focusing on Enterprise customers are more likely to request a deposit on project fees.
30-day payment terms are typical among two thirds of those surveyed.
Businesses with mature cloud practices and higher proportions of revenue from cloud activities spend a larger proportion of revenue on marketing.
Partner Skillsets
RevenueMSFT Cloud Services & Practices
.
Key FindingsProfitability & Practice Building
Services Offered Investments & Payments

Revenue

Practice related demographics of survey sample
21% 22%
<100 users 100-249 users 250-999 users 1000+ users
78%
53%46% 43%
Cloud Infrastructure
& Management
Cloud Application
Development
Mobility & Security Data Platform &
Analytics
Target Customer Size
97%
78%
37%
25%
98%
64%
42%
23%
Microsoft Azure Office 365 Enterprise Mobility
+ Security
CRM Online
SMB (n=886) Ent (n=250)
MSFT Cloud Services Sold/Deployed
n=1,136
MSFT Cloud Practices Offered
n=1,136

21%
34%
18%
9%
17%
Less than 1
year
1-2 years 2-3 years 3-4 years More than
4 years
Cloud Infrastructure &
Management(n=866)
17%
33%
19%
9%
22%
Less than 1
year
1-2 years 2-3 years 3-4 years More than 4
years
Cloud Application Development(n=596)
Just over half of cloud-based practices are less than two years old
30%26%
16%
8%
20%
Less than 1
year
1-2 years 2-3 years 3-4 years More than 4
years
Data Platform & Analytics(n=486)
31% 33%
15%9%
13%
Less than 1
year
1-2 years 2-3 years 3-4 years More than 4
years
Mobility & Security(n=500)

38%
21%
11%
15%
7%
6%
Sales
49%
16%
8%
17%
4%6%
Sales
Project services
Managed services
Resale and referral of
third-party software
Packaged software or
services
Hardware products
All other products
and services
SMB-focused IT Revenue Sources Enterprise-focused IT Revenue Sources
Value added services including Project Services, Managed Services & Packaged Software represent 74% of partner revenue in SMB and 82% in Enterprise

1-10%,
10%
11-20%,
10%
21-30%,
14%
31-50%,
18%
51-70%,
16%
71-90%,
20%
91-100%,
10%
Don't
know, 2%
Projected Proportion of Revenue from
Cloud-Based Products and Services
Cloud-based services revenue proportions anticipated to more than double in the next two years
1-10%,
34%
11-20%,
16%21-30%,
12%
31-50%,
11%
51-70%,
9%
71-90%,
8%
91-100%,
6%
Don't
know, 3%
Current Proportion of Revenue from
Cloud-Based Products and Services
n= 1,136
Currently, a median of 20% of revenue is
cloud-based
In two years, a median 47% of revenue is projected to be cloud-based

n= 1,136
19%
45%
29%
5%
<1%1%
Less than 6 months 6 months to 1 year 1-2 years 2-3 years 3-4 years 5 or more years
Time Until New Practice Profitable
Most (74%) partners require between 6 months- 2 years to achieve new practice profitability

Azure (12%)
Barriers to cloud adoption
Total
(n=1136)
US
(n=246)
Canada
(n=40)
LATAM
(n=64)
UK
(n=90)
WE
(n=276)
Germany
(n=42)
CEE
(n=108)
India
(n=35)
APAC
(n=119)
MEA
(n=49)
Brazil
(n=39)
Overcoming cloud
objections from
customers32% 27% 30% 39% 32% 36% 38% 31% 26% 30% 35% 18%
Keeping employees up
to speed /trained on
latest technology31% 32% 25% 38% 34% 34% 31% 27% 23% 29% 37% 15%
Generating leads 29% 31% 35% 23% 47% 26% 21% 23% 31% 26% 24% 41%
Building our initial
solution/offering24% 21% 35% 33% 16% 24% 36% 24% 23% 26% 12% 38%
Differentiating our
business from the
competition24% 20% 25% 23% 26% 27% 21% 21% 29% 23% 22% 23%
Finding and hiring
skilled
employees/resources21% 19% 20% 13% 21% 25% 21% 23% 20% 19% 29% 15%
Building Cloud Practices Pain Points By Region*
*Minimum 30 responses required to be included in table
___ Denotes statistically higher significance compared to another country
Highest rated pain point by countryMarketing/sales support (16%)
“Better lead qualification from Microsoft account teams. Continued training and knowledge resources to help our teams learn and get up to speed on Microsoft offerings.”
“We are pretty happy with the current offering. To become more profitable, we need a larger user base, so Marketing & Sales is our biggest pain area right now. We would like to see more programs that help us generate more leads and traffic to our product sites.”
Lead Generation (13%)
Top Cloud Business Profitability Improvements Suggestions(Hover over icons to view sample quotes)
“More resources on Azure for building PoCs for the customer. Options for integrating with legacy or commercial applications, like to AWS Marketplace, so that the PoC / Demo could be convincing to the customer(s).”

39%
22%
11%
8%
5%
6%2%3%
Sales
44%
21%
9%
7%
7%
4%1%
7%
Sales
Your sales activities
Your own demand
generation/marketing activities
Your website
Your Partner Channel
Microsoft field/sales team
Other Marketplaces
Microsoft marketplaces
Other
SMB-focused IT Lead Sources Enterprise-focused IT Lead Sources
Top lead sources: Sales, demand gen & website

Cloud Practice
Opportunity

Top Microsoft Services Leveraged Across Practices
Virtual Machines & Networks 86%Azure Backup 71%Azure Site Recovery 49%Automation (Templates & scripts) 41%Operations Management Suite
(OMS)29%
ExpressRoute 18%StorSimple 13%Don't know 3%None of these 2%
SQL Database/SQL Server in VM 74%Azure Active Directory 68%SQL Data Warehouse 47%Azure Storage Blobs 45%Azure Data Factory 25%Azure ML 25%Azure Data Catalog 23%DocumentDB 23%Event Hubs/IoT Hub 21%Stream Analytics 20%Azure Search 20%Data Lake Analytics 18%Cognitive Services 18%Data Lake Store 15%HDInsight 14%Don't know 7%None of these 1%
SQL Database 82%Web Apps 74%Azure Active Directory 58%API Apps 45%Mobile Apps 35%API Management 30%App Service Environments 30%DocumentDB 20%Azure Search 18%CDN 17%Redis 12%Don't know 6%None of these 1%
Microsoft Intune 66%Azure Active Directory Premium 66%Azure Information/Data Protection 45%Virtual Desktop Services 38%Don't know 8%None of these 6%

Project Services
Backup & Storage Deployment 62%
Cloud Migration Planning 60%
Virtualization Migration & Deployment 56%
Proof of Concept 56%
Systems Integration 55%
Deployment Services 53%
Solution Configuration/Customization 47%
Disaster Recovery Deployment 47%
Solution Analysis, Scope, & Design 43%
Data Center Migration 40%
Cloud Readiness Assessment 39%
Solution Support & Training 38%
Simple File Server Migration 36%
Desktop Virtualization 35%
Cloud Solution Costing & Spend Optimization 35%
Health Checks 34%
Custom Application Development 33%
Training 29%
Network readiness assessment 27%
Security & Compliance Enablement 26%
Security & Compliance Assessment 25%
Scalability & Load Testing 23%
Mentoring 23%
Bandwidth Planning 21%
Network Remediation 19%
Security-Penetration Testing 14%
We do not offer any of these project services 2%
Cloud Infrastructure & Management Partner Services Attach Opportunity
Managed Services
Virtual Machine Management & Upgrading 55%
Configuration Management 44%
Microsoft support (interface between MSFT & customer) 43%
Domain Management 43%
Troubleshooting 43%
Update & Patch Management 42%
Hybrid Environment Support (Basic Infrastructure) 40%
User Rights & Account Management 40%
Azure Consumption Monitoring & Optimization 38%
Reactive Help Desk Support 37%
Disaster Recovery Monitoring & Testing 37%
Performance Monitoring and Reporting 36%
Proactive Backups & Anti-Virus Monitoring 36%
Virtualization Support & Efficiency Optimization 34%
PowerShell Script Automation 33%
Network Monitoring 33%
Reporting and Analytics 31%
Critical Response Support 30%
Anti-Virus Monitoring 29%
Reports and Dashboard Maintenance 28%
Security Management & Identity Protection 26%
Application Lifecycle Management & Support 25%
Virtual Database Administration 25%
Data Center Performance Monitoring & Optimization 25%
Regulatory Compliance via O365 Infrastructure 18%
Online Training and Self-Paced learning 13%
We do not offer any of these managed services 11%
Intellectual Property Services
Automated Backups & Disaster Recovery 34%
Automated Monitoring, Alerting, & Logging 26%Office Connectivity & Other Plug-Ins & Add-ons 21%Customer Self-Serve Portals 20%
Pre-Configured Dashboards 19%External Portals for End Customer Information 18%Automated Load Balancing 18%
Automated Consumption Monitoring & Reporting 16%Automated Disaster Recovery Testing 16%Online Training & Self-paced Learning 13%Middleware for Hybrid Synchronization 12%We do not offer any of these intellectual property services 40%
n=866

Cloud Infrastructure & Management Partner Services Attach Revenue Opportunity
Project Services
Total Median (n=164) $150,000
By Customer Focus
SMB (n=116) $137,500
Enterprise (n=48) $300,000
Managed Services
Total Median (n=118) $100,000
By Customer Focus
SMB (n=82) $75,000
Enterprise (n=36) $150,000
IP Services
Total Median (n=67) $50,000
By Customer Focus
SMB (n=45) $40,000
Enterprise (n=22)* $62,500
*Caution: small sample size. Note that regions with fewer than 3 respondents in a services category are not shown here.

Cloud Application Development Services Attach Opportunity
Managed Services
Application Lifecycle Management & Support 43%Application Support/Help Desk 40%Configuration Management 32%
Reporting and Analytics 30%Single Sign-On Management 29%Troubleshooting 29%
Azure Consumption Monitoring & Optimization 29%Microsoft support (interface between MSFT & customer) 27%Performance Monitoring and Reporting 26%
Virtual Database Administration 26%Reports and Dashboard Maintenance 25%PowerShell Script Automation 24%
Critical Response Support 23%Reactive Help Desk Support 22%Reports & View Adjustments 21%
Workload Performance Monitoring 20%Mobile Device Connectivity & Management 18%Network Monitoring 18%Data Center Performance Monitoring & Optimization 17%Security Management & Identity Protection 16%
Identity as a Service 15%Online Training and Self-Paced learning 13%Anti-Virus Monitoring 13%
Web defense (restricting URLs, phishing malware, spam) 12%We do not offer any of these managed services 22%
Intellectual Property Services
Industry-specific Workflows 26%Customer Self-Serve Portals 25%Vertical specific functionality 23%
Industry-specific Mobile Apps 22%e-Commerce functionality 21%Function-specific Workflows (e.g. HR, Procurement) 21%
External Portals for End Customer Information 20%Automated Monitoring, Alerting, & Logging 19%Office Connectivity & Other Plug-Ins & Add-ons 18%
Automated Backups & Disaster Recovery 18%Pre-Configured Dashboards 17%Turnkey BI Portals 14%
Middleware for Hybrid Synchronization 13%Automated Consumption Monitoring & Reporting 13%Automated Load Balancing 13%
Online Training & Self-paced Learning 12%Automated Disaster Recovery Testing 11%We do not offer any of these intellectual property services 38%
Project Services
Custom Application Development 65%Proof of Concept 52%Systems Integration 50%
Solution Analysis, Scope, & Design 45%Solution Configuration/Customization 45%Deployment Services 45%
Data Architecture Design 43%Database Infrastructure Development 40%Solution Support & Training 36%
Backup & Storage Deployment 33%Virtualization Migration & Deployment 30%User Experience Consulting 29%
Cloud Solution Costing & Spend Optimization 29%Training 29%Cloud Readiness Assessment 26%
Scalability & Load Testing 25%Disaster Recovery Deployment 24%Health Checks 20%Mentoring 20%Security & Compliance Enablement 18%
Security & Compliance Assessment 17%Bandwidth Planning 13%Network readiness assessment 13%
Security- Penetration Testing 11%We do not offer any of these project services 5%
n=596

Project Services
Total Median (n=203) $200,000
By Customer Focus
SMB (n=151) $150,000
Enterprise (n=52) $275,000
Managed Services
Total Median (n=134) $100,000
By Customer Focus
SMB (n=97) $50,000
Enterprise (n=37) $100,000
IP Services
Total Median (n=96) $100,000
By Customer Focus
SMB (n=68) $100,000
Enterprise (n=28)* $100,000
*Caution: small sample size. Note that regions with fewer than 3 respondents in a services category are not shown here.
Cloud Application Development Partner Services Attach Revenue Opportunity

Data Platform & Analytics Partner Services Attach Opportunity
Managed Services
Reporting and Analytics 49%
Reports and Dashboard Maintenance 40%Troubleshooting 37%Configuration Management 36%
Application Support/Help Desk 36%Microsoft support (interface between MSFT & customer) 35%
Application Lifecycle Management & Support 34%
Performance Monitoring and Reporting 34%Azure Consumption Monitoring & Optimization 34%Virtual Database Administration 33%Reports & View Adjustments 33%Reactive Help Desk Support 30%PowerShell Script Automation 30%Critical Response Support 29%Data Center Performance Monitoring & Optimization 24%
Network Monitoring 23%Security Management & Identity Protection 20%Online Training and Self-Paced learning 15%
Web defense (restricting URLs, phishing malware, spam) 13%
We do not offer any of these managed services 17%
Intellectual Property Services
Pre-Configured Dashboards 30%Automated Data Migration & Integration 26%
Customer Self-Serve Portals 26%Turnkey BI Portals 24%Automated Monitoring, Alerting, & Logging 23%
External Portals for End Customer Information 23%Vertical specific functionality 20%Automated Consumption Monitoring & Reporting 19%
Middleware for Hybrid Synchronization 15%Online Training & Self-paced Learning 14%We do not offer any of these intellectual property services 41%
Project Services
Proof of Concept 60%Systems Integration 54%
Data Architecture Design 52%Solution Analysis, Scope, & Design 49%Custom Application Development 47%
Database Infrastructure Development 46%Deployment Services 43%Data Warehousing Deployment 41%Solution Configuration/Customization 41%Solution Support & Training 41%
Backup & Storage Deployment 39%Virtualization Migration & Deployment 39%Cloud Solution Costing & Spend Optimization 32%
Training 32%User Experience Consulting 32%Cloud Readiness Assessment 31%
Data Center Migration 30%Health Checks 30%Data Cube Construction 30%
Disaster Recovery Deployment 29%Scalability & Load Testing 28%Security & Compliance Enablement 24%
Mentoring 24%Security & Compliance Assessment 22%Network readiness assessment 20%Data Lake Implementation 18%Data Lake Design 17%
Bandwidth Planning 16%Security- Penetration Testing 13%We do not offer any of these project services 4%
n=486

Project Services
Total Median (n=201) $55,000
By Customer Focus
SMB (n=153) $50,000
Enterprise (n=48) $250,000
Managed Services
Total Median (n=171) $30,000
By Customer Focus
SMB (n=135) $20,000
Enterprise (n=36) $90,000
IP Services
Total Median (n=108) $14,500
By Customer Focus
SMB (n=82) $10,000
Enterprise (n=26)* $75,000
*Caution: small sample size. Note that regions with fewer than 3 respondents in a services category are not shown here.
Data Platform & Analytics Partner Services Attach Revenue Opportunity

Mobility & Security Partner Services Attach Opportunity
Managed Services
Active Directory Federation & Management 52%
Single Sign-On Management 48%
Desktop & Device Management & Support 47%
Hybrid Environment Support (Basic Infrastructure) 47%
Domain Management 46%
Microsoft support (interface between MSFT & customer) 46%
New Accounts Added & Removed 46%
Troubleshooting 45%
User Rights & Account Management 45%
Reactive Help Desk Support 44%
Security Management & Identity Protection 38%
Managed Access to Email Groups 37%
Performance Monitoring and Reporting 37%
Identity as a Service 32%
Reporting and Analytics 31%
Reports and dashboard Maintenance 29%
Application Lifecycle Management & Support 25%
Online Training and Self-Paced learning 16%
We do not offer any of these managed services 18%
Intellectual Property Services
Mobility Solutions 43%
Customer Self-Serve Portals 26%
Pre-Configured Dashboards 23%
Online Training & Self-paced Learning 16%
Turnkey BI Portals 13%
We do not offer any of these intellectual property services 47%
Project Services
Deployment Services 57%
Proof of Concept 57%
Systems Integration 57%
Cloud Migration Planning 54%
Office Client Deployment 48%
Solution Analysis, Scope, & Design 47%
Solution Configuration/Customization 47%
Solution Support & Training 43%
Virtualization Migration & Deployment 42%
Cloud Readiness Assessment 40%
User Enablement 40%
Security & Compliance Assessment 37%
Training 36%
Health Checks 35%
Security & Compliance Enablement 35%
Cloud Solution Costing & Spend Optimization 34%
User Experience Consulting 34%
Device Procurement and Deployment 33%
Data Architecture Design 31%
Data Center Migration 31%
Mentoring 25%
Custom Application Development 23%
Security-Penetration Testing 18%
Data Cube Construction 10%
We do not offer any of these project services 5%
n=500

Project Services
Total Median (n=169) $50,000
By Customer Focus
SMB (n=129) $50,000
Enterprise (n=40) $150,000
Managed Services
Total Median (n=118) $50,000
By Customer Focus
SMB (n=95) $50,000
Enterprise (n=23)* $150,000
IP Services
Total Median (n=66) $20,000
By Customer Focus
SMB (n=48) $10,000
Enterprise (n=18)* $50,000
*Caution: small sample size. Note that regions with fewer than 3 respondents in a services category are not shown here.
Mobility & Security Partner Services Attach Revenue Opportunity

Partner Business
Skillsets

Top 10 Sources for Identifying Skilled Labor
Total (n=1136)
SMB(n=886)
Enterprise(n=250)
1 Referrals from employees or partnerships70% 69% 73%
2 LinkedIn59% 57% 66%
3 Posting on website47% 45% 54%
4 Local Universities38% 36% 46%
5 Local Technical Communities36% 35% 43%
6 Recruit from competitors30% 29% 36%
7 Meet ups29% 29% 30%
8 GitHub8% 8% 7%
9 Stack Overflow8% 8% 7%
10 Other job posting sites6% 6% 4%
___ Denotes statistically higher significance compared to other customer segment

Total (n=1136)
SMB(n=886)
Enterprise (n=250)
Work history 69% 68% 74%
Cultural fit 43% 40% 53%
Years of experience 42% 41% 47%
Professional certifications 32% 34% 22%
Referrals 28% 29% 26%
Professional training received 20% 21% 16%
Reputation through community 16% 15% 19%
Formal education 13% 14% 11%
Contract to hire or other means to test skills "hands-on" 13% 13% 13%
Publications 3% 3% 2%
Awards received 2% 2% 2%
Other 4% 4% 4%
___ Denotes statistically higher significance compared to other customer segment
Highest rated quality in a potential new hire’s skillset
Work history is the most important consideration for new hires. Cultural fit and years of experience are also key factors.

Most functions enjoy staff with at least 3 years’ experience; ranges vary widely
Med No such role
Architecting/Designing Networks 5 22%Consultative & in-person support 5 23%Implementing/Managing Networks 5 23%Backup Solution
Architecture/Design 5 24%Backup Solution
Implementation/Management 5 24%Application Development 5 27%Telephone support 5 27%Delivering Training or Mentoring 4 31%UX Design or Interaction Design 4 33%Cloud Solution Architecture/Design 3 17%Cloud Solution
Implementation/Migration/Mgmt 3 17%Prototype Design and Development 3 32%Modeling Solution Costs 3 33%
Med No such role
Implementing/Managing Relational
Databases 6 27%Architecting/Designing Relational
Databases 5 27%Consultative and in-person support 5 29%Prototype Design and Development 5 31%Application Development 5 70%Delivering Training or Mentoring 4 36%Modeling Solution Costs 3 37%Telephone support 3 37%Architecting/Designing Big Data
Solutions 2 32%Implementing/Managing Big Data
Solutions 2 32%Architecting/Designing Advanced
Analytic or Machine Learning
Solutions 2 36%Implementing/Managing Advanced
Analytic or Machine Learning
Solutions 2 37%
Med No such role
Application Development 5 19%Prototype Design and Development 5 25%Consultative and in-person support 5 26%User Experience Design or
Interaction Design 4 27%Cloud Solution Architecture/Design 3 21%Cloud Solution
Implementation/Migration/Mgmt 3 23%Telephone support 3 32%Delivering Training or Mentoring 3 33%Modeling Solution Costs 3 35%
Med No such role
Consultative and in-person
support 4 28%Identity Management Solution
Implementation/Management 3 28%Identity Management Solution
Architecting/Design 3 30%Telephone support 3 31%Security/Compliance
Assessment or Enablement 3 32%Modeling Solution Costs 2 35%Prototype Design and
Development 2 36%Delivering Training or
Mentoring 2 36%Application Development 2 37%Solution Hardening 2 40%
Darker shading indicates higher median experience
Bold % indicates 30% or more without that role/function

83%
63%
44%
23%
2%6%
1%
82%
64%
45%
32%
3%7%
1%
Send them to
conferences or
training events
Pay for online
training
Provide a
bonus when
certifications
are achieved
Hire trainers to
come on site
Internal
training
Other None/nothing
Annual+ Skillset Improvement Methods
SMB (n=886)
Ent (n=250)
Offsite events and paid online training are the most common staff learning mechanisms; median 8.5% of technical resources time spent on training
23%
39%
20%
10%
5%
3…
Less than 5%
5-10%
10-15%
15-20%
20%-30%
More than 30%
% Time Allocated for Ongoing
Learning
n= 1,136

Total
(n=1136)
US
(n=246)
Canada
(n=40)
LATAM
(n=64)
UK
(n=90)
WE
(n=276)
Germany
(n=42)
CEE
(n=108)
India
(n=35)
APAC
(n=119)
MEA
(n=49)
Brazil
(n=39)
Architect $80,000 $125,000 $87,500 $60,000 $80,000 $80,000 $80,000 $45,000 $40,000 $100,000 $30,000 $10,000
Developer $60,000 $100,000 $75,000 $25,000 $60,000 $50,000 $75,000 $30,000 $16,250 $70,000 $13,000 $10,000
Managed services
delivery
resource/employee$50,000 $77,500 $72,500 $29,500 $42,500 $50,000 $55,000 $30,000 $11,000 $50,000 $22,000 $1,500
Project services
delivery
resource/employee$65,000 $90,000 $80,000 $40,000 $50,000 $68,000 $66,000 $38,000 $15,000 $67,500 $26,000 $750
Sales and Marketing
resource/employee$60,000 $100,000 $90,000 $41,500 $50,000 $50,000 $75,000 $26,500 $14,500 $90,000 $45,850 $2,000
Tester/QA $40,000 $75,000 $60,000 $20,000 $50,000 $22,500 $25,000 $15,000 $11,000 $32,000 $10,000 $40
UI/UX designer $40,000 $82,500 $67,500 $14,000 $50,000 $25,000 $50,000 $25,000 $25,000 $50,000 $3,600 $0
Annual Median Cost of Online/Cloud Service Resources By Region*
*Minimum 30 responses required to be included in table
Highest median cost by country
In most regions, Architects are the most expensive online/cloud resource employees

Those focused on Enterprise customers consume a median $8107 in Azure for R&D research and development annually; those focused on SMB consume a median of $1933
14%
46%
17%15%
7%
1%
9%
23%
18%
23%
16%
12%
None $1-$2500 $2501-$5000 $5001-$10000 $10001-$30000 More than $30000
Annual Azure Consumption
SMB (n=886) Ent (n=250)
Bold green font denotes statistically higher percentage compared to other customer segment

Partner Investments &
Payments
Bold green font denotes statistically higher percentage compared to other business segment
Only about half of partners charge upfront fees for project or managed services
n= 1,136
43%
13%18%
10%4%
9%3%
57%
9%16%
11%
2% 3% 1%
Do not request a deposit 1-15% 16-25% 26-35% 36-45% 46-55% More than 55%
% Project Fee Charged as Deposit SMB (n=886) Ent (n=250)
51%
22%15%
5%2% 2% 3%
52%
19% 16%
6%1% 2% 4%
Do not request fee 1-15% 16-25% 26-35% 36-45% 46-55% More than 55%
% Annual Managed Services Fee Charged Upfront

9%
17%
63%
8%
2%
1%
5%
10%
68%
10%
4%
2%
10 days
15 days
30 days
60 days
90 days
Longer
than 90
days
Payment Terms
Ent (n=250)
SMB (n=886)
Those focused on SMBs are significantly more likely to request 10-15 day payment terms
Bold green font denotes statistically higher percentage compared to other customer segment
n= 1,136

Businesses with mature cloud practices and higher proportions of revenue from cloud activities spend a larger proportion of revenue on marketing
4.3%
3.6%
Mature (n=424) Emerging (n=637)
Series 1Marketing as % of Revenue by
Age of Cloud Practice
Any cloud practice at least 3 years old
At least one cloud practice 2 years old
2.7%
4.6%
5.2%
Low (1-10%)
n=384
Medium (11-50%)
n=450
High (51%+)
n=264
Series 1
Marketing as % of Revenue by
Cloud Revenue Proportion

Firmographics

Partners by Region(n=1136)
WE 24%
US 22%
APAC 10%
CEE 10%
UK 8%
LATAM 6%
MEA 4%
Germany 4%
Canada 4%
Brazil 3%
India 3%
France 1%
GCR 1%
Japan <1%
Russia <1%
Broad geographic range represented

Total
(n=1136)
US
(n=246)
Canada
(n=40)
LATAM
(n=64)
UK
(n=90)
WE
(n=276)
Germany
(n=42)
CEE
(n=108)
India
(n=35)
APAC
(n=119)
MEA
(n=49)
Brazil
(n=39)
<100 users 35% 34% 38% 28% 41% 34% 21% 42% 34% 38% 16% 44%
100-249 users 21% 19% 10% 25% 17% 24% 14% 27% 20% 18% 29% 21%
250-999 users 22% 21% 30% 20% 20% 23% 14% 20% 23% 20% 37% 26%
1,000+ users 22% 26% 23% 27% 22% 18% 50% 11% 23% 24% 18% 10%
Target Customer Employee Size By Region*
*Minimum 30 responses required to be included in table
Highest target customer employee frequency by country
Nearly a quarter target Enterprise customers; about a third target <100 customers
___ Denotes statistically higher significance compared to another country
Total
(n=1136)
US
(n=246)
Canada
(n=40)
LATAM
(n=64)
UK
(n=90)
WE
(n=276)
Germany
(n=42)
CEE
(n=108)
India
(n=35)
APAC
(n=119)
MEA
(n=49)
Brazil
(n=39)
Microsoft Azure 97% 99% 95% 98% 97% 97% 95% 99% 100% 92% 98% 100%
Office 365 75% 74% 70% 72% 73% 74% 74% 81% 69% 74% 90% 64%
Enterprise Mobility +
Security38% 39% 35% 39% 40% 39% 36% 28% 31% 44% 61% 21%
CRM Online 24% 23% 28% 31% 26% 29% 10% 16% 23% 25% 37% 8%
Microsoft Cloud Services By Region*
*Minimum 30 responses required to be included in table
Highest MSFT Cloud Service frequency by country
Large % of Azure partners also sell and/or deploy Office 365
___ Denotes statistically higher percentage compared to another country

Total
(n=1136)
US
(n=246)
Canada
(n=40)
LATAM
(n=64)
UK
(n=90)
WE
(n=276)
Germany
(n=42)
CEE
(n=108)
India
(n=35)
APAC
(n=119)
MEA
(n=49)
Brazil
(n=39)
Cloud Infrastructure
& Management78% 79% 80% 81% 74% 76% 69% 78% 74% 81% 90% 67%
Cloud Application
Development53% 57% 58% 58% 48% 56% 62% 50% 77% 40% 35% 54%
Mobility &
Security46% 47% 48% 36% 50% 46% 48% 40% 49% 50% 63% 31%
Data Platform &
Analytics43% 48% 48% 47% 38% 42% 43% 36% 54% 44% 47% 31%
Practices Offered to Customers by Region*
*Minimum 30 responses required to be included in table
Highest target customer employee frequency by country
Cloud Infrastructure & Management is the top practice offered by respondents to survey
___ Denotes statistically higher significance compared to another country

Annual IT revenue is significantly higher among those focused on Enterprise customers
16%
37%
24%
18%
4%
9%
21% 20%
31%
20%
Under $50,000 $50,000 to $1 million >$1 million to $5 million >$5 million to $50 million >$50 million to >$1 billions or
more
Annual IT Revenue
SMB (n=886) Enterprise (n=250)
Those focused on SMB customershave a median $902,417 in annual IT solutions revenue
Those focused on Enterprise customershave a median $5,200,000 in annual IT
solutions revenue