Embed Size (px)
Citation preview
ARCTIC
VOL. 68, NO. 1 (MARCH 2015) P. 79 – 92
http://dx.doi.org/10.14430/arctic4457
Micrometeorological and Thermal Control of Frost Flower Growth and Decayon Young Sea Ice
Ryan J. Galley,1,2 Brent G.T. Else,1 Nicolas-Xavier Geilfus,1,4 Alexander A. Hare,1 David Babb,1 Tim Papakyriakou,1 David G. Barber1 and Søren Rysgaard1,3,4
(Received 22 April 2014; accepted in revised form 20 June 2014)
ABSTRACT. Frost flowers are transient crystal structures that form on new and young sea ice surfaces. They have been implicated in a variety of biological, chemical, and physical processes and interactions with the atmosphere at the sea ice surface. We describe the atmospheric and radiative conditions and the physical and thermal properties of the sea ice and atmosphere that form, decay, and destroy frost flowers on young sea ice. Frost flower formation occurred during a high-pressure system that caused air temperatures to drop to −30˚C, with relative humidity of 70% (an undersaturated atmosphere), and very calm wind conditions. The sea ice surface temperature at the time of frost flower initiation was 10˚ – 13˚C warmer than the air temperature. Frost flowers grew on nodules raised above the mean surface height by 5 mm, which were 4˚ – 6˚C colder than the bare, brine-wetted, highly saline sea ice surface that provided the necessary moisture. The cold nodules created potential water vapour supersaturation zones above them with respect to air over the brine skim. Frost flowers formed and grew overnight in the absence of shortwave radiation, while the net longwave radiation was negative and dominated the net all-wave radiation balance at the surface. The observed crystal habits of the frost flowers were long needles, betraying their origin from the vapour phase at temperatures between −20˚C and −30˚C. After a night of growth, frost flowers decayed in association with increased solar radiation, a net surface radiation balance of 0 W m-2, increased air and surface temperatures, increased wind speed, and decreased relative humidity. We hypothesize that these conditions increased vertical mixing, which eroded near-surface water vapour saturation and initiated sublimation. The frost flowers finally were rapidly destroyed by snowfall.
Key words: Arctic; sea ice; frost flowers; new ice; young ice; leads
RÉSUMÉ. Les fleurs de glace sont des structures cristallines transitoires qui se forment sur des surfaces de glace de mer nouvelles et jeunes. Elles découlent de divers processus et interactions biologiques, chimiques et physiques avec l’atmosphère, à la surface de la glace de mer. Nous décrivons les conditions atmosphériques et radiatives de même que les propriétés physiques et thermiques de la glace de mer qui forment, détériorent et détruisent les fleurs de glace sur la jeune glace de mer. La formation de fleurs de glace s’est produite lorsqu’un système de haute pression a fait baisser les températures de l’air à −30 ˚C, avec une humidité relative de 70 % (atmosphère sous-saturée) et un régime des vents très calme. À l’amorçage des fleurs de glace, la température à la surface de la glace de mer était de 10˚ à 13 ˚C plus chaude que la température de l’air. Les fleurs de glace se sont formées sur des nodules élevés au-dessus de la hauteur moyenne de la surface dans une mesure de 5 mm, ce qui était entre 4˚ et 6 ˚C plus froid que la surface de glace de mer brute, saumurée et fortement saline qui a fourni l’humidité nécessaire. En ce qui a trait à l’air au-dessus de l’écume de saumure, les nodules de froid ont créé des zones potentielles de sursaturation de vapeur d’eau au-dessus. Des fleurs de glace se sont formées et ont grossi pendant la nuit, en l’absence de rayonnement de courtes longueurs d’onde, tandis que le rayonnement net de grandes longueurs d’onde était négatif et dominait l’équilibre du rayonnement net de toutes ondes à la surface. L’habitus cristallin observé dans les fleurs de glace prenait la forme de longues aiguilles, trahissant son origine de la phase vapeur à des températures variant de −20 ˚C à −30 ˚C. Après une nuit de croissance, les fleurs de glace se sont détériorées en présence du rayonnement solaire accru, du bilan radiatif de la surface de 0 W m-2, des températures accrues de l’air et de la surface, de la plus grande vitesse du vent et de l’humidité relative réduite. Nous formulons l’hypothèse que ces conditions ont eu pour effet d’augmenter le mélange vertical, ce qui a érodé la saturation de vapeur d’eau près de la surface et déclenché la sublimation. Par la suite, les fleurs de glace ont été rapidement détruites par la chute de neige.
Mots clés : Arctique; glace de mer; fleurs de glace; glace nouvelle; glace jeune; chenaux
Traduit pour la revue Arctic par Nicole Giguère.
1 Centre for Earth Observation Science, University of Manitoba, 125 Dysart Road, Winnipeg, Manitoba R3T 2N2, Canada 2 Corresponding author: [email protected] 3 Greenland Climate Research Center, Greenland Institute of Natural Resources, Kivioq 2, PO Box 570, 3900 Nuuk, Greenland 4 Department of Bioscience, Arctic Research Centre, Aarhus University, 8000 Aarhus C, Aarhus, Denmark © The Arctic Institute of North America
80 • R.J. GALLEY et al.
INTRODUCTION
As the Arctic icescape transitions from one dominated by multiyear sea ice to one dominated by first-year ice, new and young sea ice surfaces are expected to become a more prevalent feature in the Arctic (Kwok, 2007; Maslanik et al., 2007, 2011; Kwok and Cunningham, 2010). Frost flowers are relatively short-lived crystal structures formed exclu-sively on new and young sea ice (Perovich and Richter-Menge, 1994). They have received much attention for their potential roles in atmospheric chemistry (Rankin et al., 2002; Douglas et al., 2005, 2012; Roscoe et al., 2011; Sher-man et al., 2012) and carbon cycling (Geilfus et al., 2013), as sites of microbial accumulation (Bowman and Deming, 2010), and for their impact on microwave remote sensing of sea ice (Drinkwater and Crocker, 1988; Isleifson et al., 2014). Gallet et al. (2013) used a combination of in situ data and modeling to show that sublimation crystals modify the surface albedo and therefore surface forcing. Frost flowers and other sublimation crystals grow under specific condi-tions of temperature, relative humidity, and wind speed (e.g., Style and Worster, 2009; Gallet et al., 2013); studies of their growth have been limited to a few physical observa-tions (e.g., Perovich and Richter-Menge, 1994; Domine et al., 2005), laboratory experiments (e.g., Martin et al., 1996; Style and Worster, 2009), and theoretical explanation (e.g., Style and Worster, 2009).
Research on frost flower formation has focused on the origin of the water vapour from which they are formed. Perovich and Richter-Menge (1994) proposed that the brine skim that commonly forms on new sea ice was the water vapour source for frost flower formation, and that small-scale roughness features sticking out of the brine skim were preferential sites for frost deposition. Martin et al. (1995) were able to grow frost flowers in a cold laboratory using an external water vapour source (i.e., a vaporizer) and showed that colder temperatures tended to produce higher frost flower densities. Style and Worster (2009) provided a treat-ment of the conditions that may produce localized supersat-uration and frost deposition over ice surfaces; they were able to show that brine skim was not necessary for frost flower deposition in cases where the surface temperature was much warmer than the far-field air temperature. This temperature difference also explains why frost flowers grow only on new or young ice such as leads, and not on thicker, colder adja-cent sea ice floes. Wind conditions also seem to be a key fac-tor in the formation of frost flowers, as all previous studies have noted their existence under calm conditions.
Crystal forms grown from the vapour phase may be related to the air temperature at which they are formed (Nakaya, 1954; Magono and Lee, 1966; Perovich and Richter-Menge, 1994; Martin et al., 1996), which also affects their specific surface area (Domine et al., 2005). During the initial hours of sea ice growth in the field or laboratory, the presence of a highly saline (~100) skim of brine on the surface of the sea ice has been consistently observed (e.g., Drinkwater and Crocker, 1988; Wensnahan
et al., 1993; Perovich and Richter-Menge, 1994; Bowman and Deming, 2010; Douglas et al., 2012). This brine skim is typically 1 – 2 mm thick and is provided by the interior of the ice (Martin et al., 1995). During their initial forma-tion and throughout their growth on sea ice, frost flowers wick up brine present on the surface of newly forming sea ice, creating bulk salinities between ca. 30 and 120 (e.g., Rankin et al., 2002; Douglas et al., 2012), which Domine et al. (2005) showed may alter crystal growth. Frost flowers have been observed to grow radially outwards around the first crystals that form (Perovich and Richter-Menge, 1994; Domine et al., 2005).
In spite of the attention that these crystal structures have received in the literature, micrometeorological, ther-mal, and physical observations of frost flowers through their initiation, growth, and degradation or destruction are fairly scarce. The lack of observations relates to the logis-tical difficulties of observing frost flowers in the field and to the technical challenges of creating realistic conditions in the laboratory. We have attempted to minimize both of these issues by observing frost flower growth and degrada-tion in a large artificial sea ice tank on sea ice in natural conditions. This work documents observations of the physi-cal and thermal properties of a thin sea ice surface prior to and during frost flower formation, growth, and degradation, as well as the sea ice, atmospheric, and radiative conditions that accompanied the life cycle of these ice crystals.
SITE AND METHODS
The Sea-ice Environmental Research Facility (SERF) is an outdoor in-ground ocean-sea ice mesocosm at the University of Manitoba in Winnipeg, Manitoba, Canada. The 18.2 m × 9.1 m × 2.75 m tank has an approximate opera-tional seawater volume of 380 m3. Beginning on 13 January 2013, the SERF tank was used to grow sea ice from open water under ambient winter conditions using experimental seawater similar in chemical composition to average natural seawater (after Millero, 2006; see Hare et al., 2013 for chem-ical composition). During this experiment, 1 cm of snow fell on the sea ice surface on 14 – 15 January, and then 9 cm of snow fell between 18 and 22 January as a low-pressure sys-tem passed through the area. On the morning of 23 January, beginning at 9:00 a.m., the snow (6.3 cm thick) covering the sea ice was manually removed in less than one hour as part of an experiment conducted by other investigators exploring the physical effects of snow on temperature and mineral pre-cipitation in young sea ice (i.e., Rysgaard et al., 2013).
Micrometeorological measurements at the site included 2 m air temperature and relative humidity (Vaisala HMP45C), solar irradiance and reflected shortwave radia-tion (300 – 2800 nm), and incoming and emitted longwave radiation (4500 – 42 000 nm) (Kipp and Zonen CNR4 net radiometer, including an integrated ventilation unit). The atmospheric pressure was measured using a baromet-ric pressure sensor (Campbell Scientific (Canada), model

FROST FLOWER GROWTH AND DECAY • 81
61302V) vented through a poly tube to an RM Young Gill pressure port mounted 1 m above the sea ice surface. Near-surface (0.25 m height) and 10 m wind speed and direction were measured using two two-dimensional anemometers (Gill Instruments Ltd., accuracy = ± 2% at 12 ms-1). Type-T thermocouples (special-limits-of-error, Omega Engi-neering, Inc.) placed vertically in the pool measured the temperature of the seawater and sea ice each minute at 2 cm intervals from the surface to 64 cm depth, then at 5 cm intervals to 189 cm depth, then at 10 cm intervals to 249 cm depth. Using a MARK II coring system (Kovacs Enterprises), we extracted sea ice core samples in order to measure ice thickness and perform in situ temperature and bulk salinity analyses on sections 2 cm thick. Bulk sea ice salinity data were calculated from conductivity and temper-ature of melted ice core sections using a HACH sensION5 portable conductivity meter (Hach Company (± 0.01)) cal-ibrated against a 15N KCL solution at 20˚C. Ice tempera-˚C. Ice tempera-C. Ice tempera-tures were measured immediately following core extraction at the middle of each 2 cm thick section using a handheld digital thermometer probe (Traceable® model 4000, Control Company) inserted into holes drilled in the sea ice core per-pendicular to the direction of growth.
Surface temperature images were taken using a thermal infrared (IR) camera (FLIR® systems SC660, range = 750 to 1300 nm, accuracy = ± 1.0˚C) with a 640 × 480 pixel field-of-view (FOV) at a half-angle of 12˚ and a spatial resolution of 0.65 milliradians. The FLIR infrared camera employs a sensitive (0.04˚C) microbolometer detector that does not require cooling; mounted at a height of 0.87 m in an enclo-sure approximately 1.75 m from the north side of the SERF pond, the camera was exposed to the ambient temperature and shaded from solar irradiance. The camera yielded a horizontal (640 pixels) FOV of 0.18 m and a vertical FOV (480 pixels) of 13.5 cm; each pixel is 0.578 mm on each side (0.334 mm2). IR images were taken every 5 min between 23 January 2013 at 10:08 a.m. and 24 January 2013 at 3:13 p.m. (all times local, total number of images = 348) after snow was cleared from the sea ice surface. A recently cali-brated Apogee SI-111 Precision Infrared Radiometer (Apo-gee Instruments Inc., absolute accuracy = ± 0.2˚C between −10˚C and 65˚C) was installed viewing the same sea ice footprint to calibrate the absolute temperature data in the FLIR images. The average value of each surface tempera-ture image was calculated, and those values were regressed against the surface temperature value from the same time measured by the Apogee IR radiometer. This regression yielded a 1:1 relationship between the two datasets, with a y-intercept of −2.4. Therefore, the value of each pixel in all the infrared images was reduced by 2.4˚C. A subset (141 × 141 or 19 881 pixels) representative of the sea ice surface in each image was used for further analysis. These square subsets were 81.498 mm on each side, cov-ering a total area of 6641.92 mm2 (66.42 cm2). The sum-mary statistics calculated for each thermal image subset, from 10:08 a.m. on 23 January until 3:13 p.m. on 24 Jan-uary, included its mean, mode, minimum, maximum, and
standard deviation. Each image subset was color-scaled so that thermal features therein could be compared while the time series (~30 hours) trend in surface temperature was preserved in the images.
RESULTS
Conditions Following Snow Removal
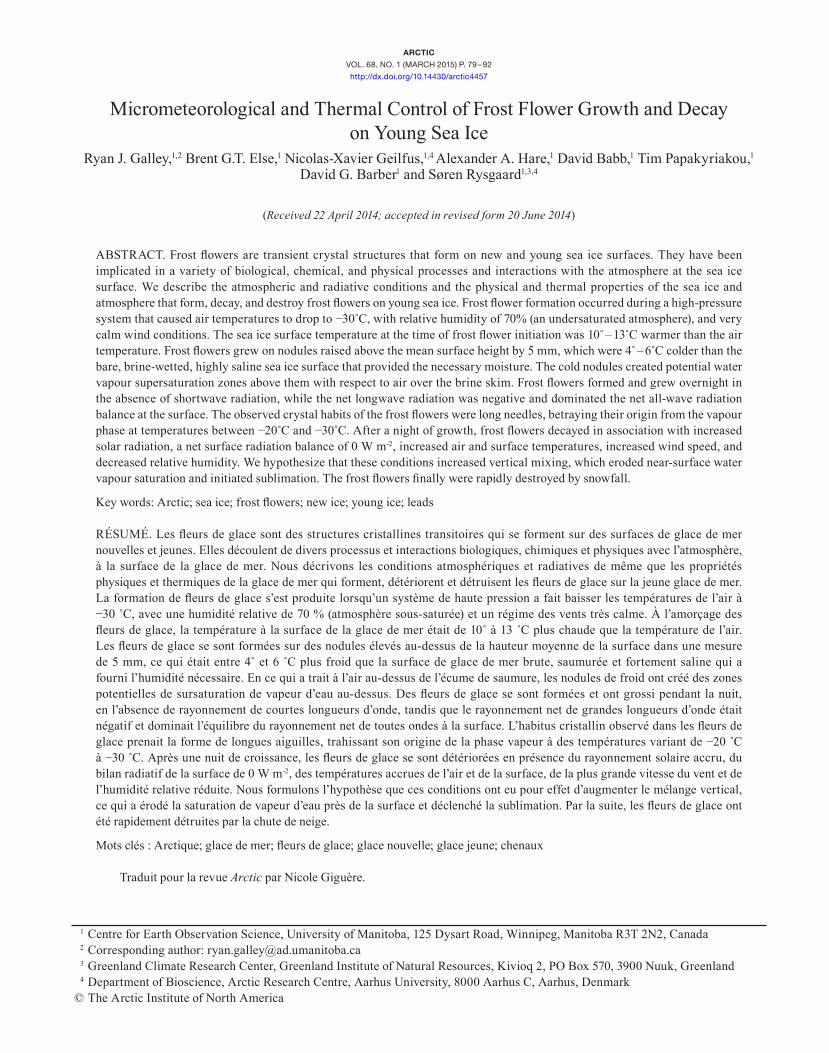
In the morning on 23 January, a high-pressure sys-tem was forming over the Winnipeg region (Fig. 1a). As the high intensified, the air temperature decreased, falling below −30˚C by evening (Fig. 1b), while relative humidity remained well below saturation (Fig. 1c). The wind speed increased slightly through the morning (max ~5 m s-1 at 10 m while the surface wind speed was < 2 m s-1), before decreasing to essentially calm by evening (Fig. 1d). The entire sea ice volume cooled rapidly after snow removal (Fig. 2). Before snow was removed, incoming shortwave was near zero (Fig. 3a). Snow removal resulted in a sub-stantial increase in long-wave radiation emitted from the surface (negative values indicate that energy is being lost by the surface, Fig. 3b) that temporarily dominated the net surface radiation budget until increased solar radiation took over the net radiation budget during the daylight hours of 23 January (Fig. 3c).
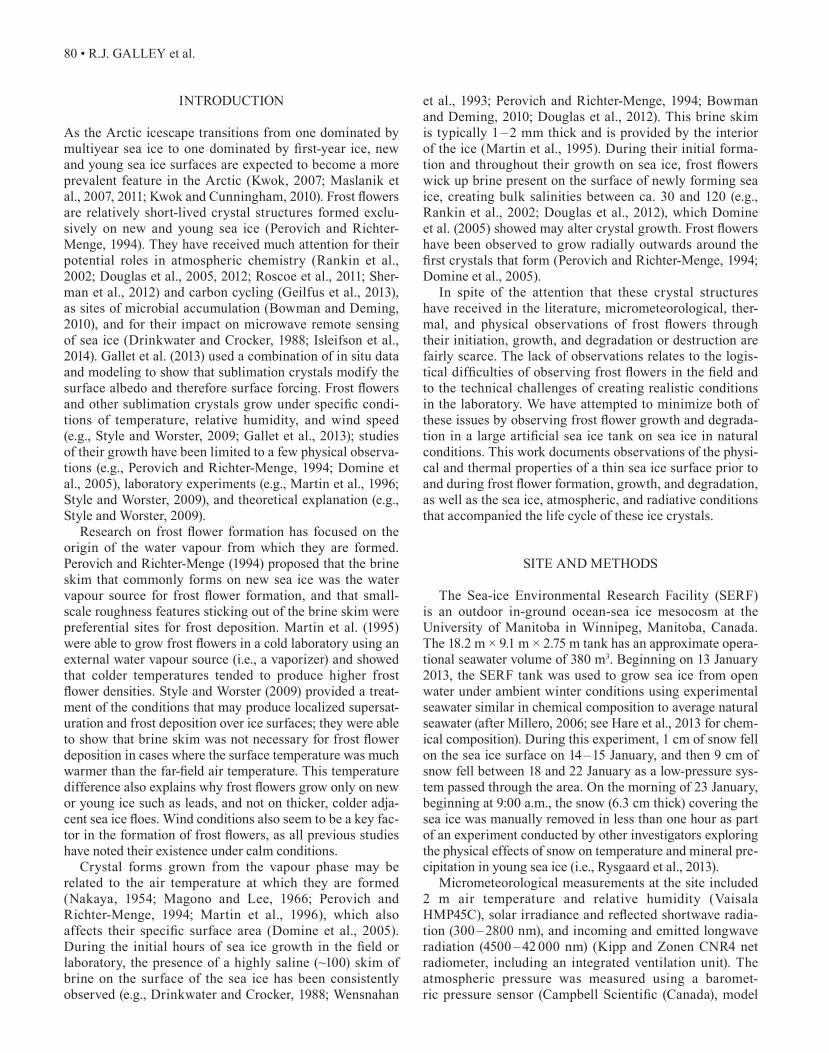
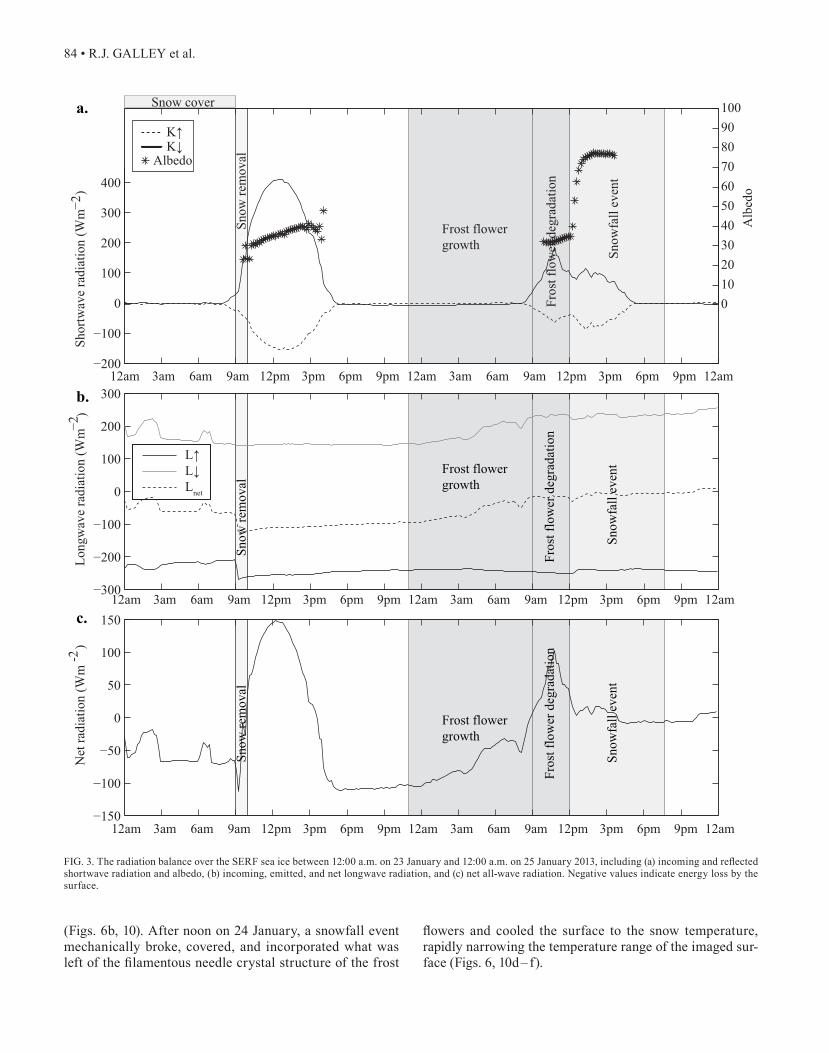
The sea ice bulk salinity profile was c-shaped (Fig. 4). The bare sea ice surface was overlaid by a saline liquid skim (Fig. 4) and covered by small nodules 3 – 30 mm2 (whiter points in Fig. 5a) raised 5 mm above the average surface. The surface also contained tiny depressions of similar mor-phology. The bare sea ice surface remained wet for the dura-tion, as evidenced by the ability of a Kimtech® low-lint wipe (Kimberly Clark®) to immediately wick up moisture when laid on the surface following the snow removal (Fig. 5b).
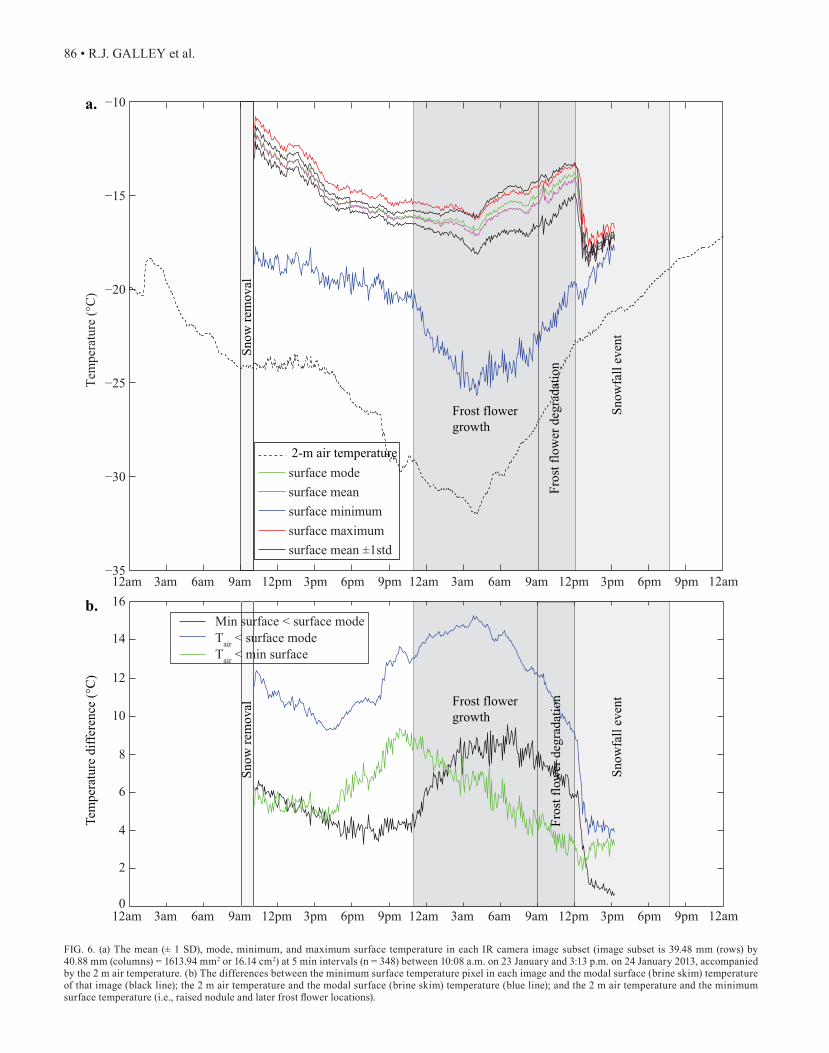
Summary statistics calculated using each pixel value for each of the 348 surface temperature images (Fig. 6), as well as example surface images (Fig. 7), illustrate the over-all surface cooling following snow removal during the day of 23 January. By 10:00 p.m., the mean and modal surface temperatures had cooled by 5˚C (Fig. 6a) but remained almost 14˚C warmer than the 2 m air temperature (Fig. 6b). There was a significant and consistent difference (4˚ – 6˚C) between the minimum (i.e., nodule sites) and the surface (i.e., brine skim) temperature mode through most of the day (Fig. 6b). The colder 5 mm nodules cooled at the same rate as the brine-wetted surface (Fig. 6) and were distinctly colder in the infrared imagery (Fig. 7) than the surface area devoid of nodules until approximately 11:00 p.m., when the frost flowers began to form.
Frost Flower Formation
The initiation of frost flower growth occurred just before 11:00 p.m. on 23 January as the surface air pressure reached its apex (Fig. 1a), the air temperature was just above −30˚C

82 • R.J. GALLEY et al.
Snow
rem
oval
Snow
fall
even
t
Snow
rem
oval
Snow
fall
even
t
Snow
rem
oval
Snow
fall
even
t
0
0.5
1
1.5
2
Surf
ace
win
d sp
eed
(m s-1
)
0
1
2
3
4
5
6M
ean
hour
ly 1
0-m
win
d sp
eed
(m s-1
)
0.25 m 10 m
12am 3am 6am 9am 12pm 3pm 6pm 9pm 12am 3am 6am 9am 12pm 3pm 6pm 9pm 12am98.5
99
99.5
100
100.5
101Su
rfac
e pr
essu
re (k
Pa)
a.
b.
d.
−35
−30
−25
−20
−15
Air
tem
pera
ture
(°C
)
0.25 m2 m
50
60
70
80
90
Rel
ativ
e hu
mid
ity (%
)
c.
Snow cover
Snow
rem
oval
Frost flower growth
Snow
fall
even
t
0.25 m2 m
12am 3am 6am 9am 12pm 3pm 6pm 9pm 12am 3am 6am 9am 12pm 3pm 6pm 9pm 12am
12am 3am 6am 9am 12pm 3pm 6pm 9pm 12am 3am 6am 9am 12pm 3pm 6pm 9pm 12am
12am 3am 6am 9am 12pm 3pm 6pm 9pm 12am 3am 6am 9am 12pm 3pm 6pm 9pm 12am
Frost flower growth
Frost flower growth
Frost flower growth
Fros
t flo
wer
deg
rada
tion
Fros
t flo
wer
deg
rada
tion
Fros
t flo
wer
deg
rada
tion
Fros
t flo
wer
deg
rada
tion
FIG. 1. (a) The near-surface atmospheric pressure at 1 m above the sea ice surface, (b) air temperature and (c) relative humidity at 0.25 m and 2 m heights over the SERF sea ice, and (d) wind speed at 0.25 m (left y-axis, in black) and 10 m (right y-axis, in grey) heights above the sea ice surface between 12:00 a.m. on 23 January and 12:00 a.m. on 25 January 2013.

FROST FLOWER GROWTH AND DECAY • 83
(Fig. 1b), relative humidity was around 70% (Fig. 1c), and the wind was very light (Fig. 1d). The surface radiation was dominated by negative but increasing net longwave radiation due to increasing upwelling longwave radiation (Fig. 3) from the cooling sea ice (Fig. 2). The frost flowers grew overnight as the air temperature continued to fall and the relative humidity remained steady both near the sea ice surface (0.25 m) and at 2 m, and the wind remained calm (Fig. 1d). During frost flower growth, there was no short-wave radiation; the net longwave radiation was negative but increased slightly overnight as incoming longwave radia-tion increased (Fig. 1b). This process resulted in a negative but increasing net radiation balance at the surface (Fig. 1c), coincident with decreasing atmospheric pressure (Fig. 1a) and scattered clouds. A liquid brine skim was present on the ice surface throughout the night. The bulk salinity of the top sea ice layer (2 cm thickness) fell compared to the previous evening, and this change was concurrent with the observed increase in brine skim salinity (Fig. 4).
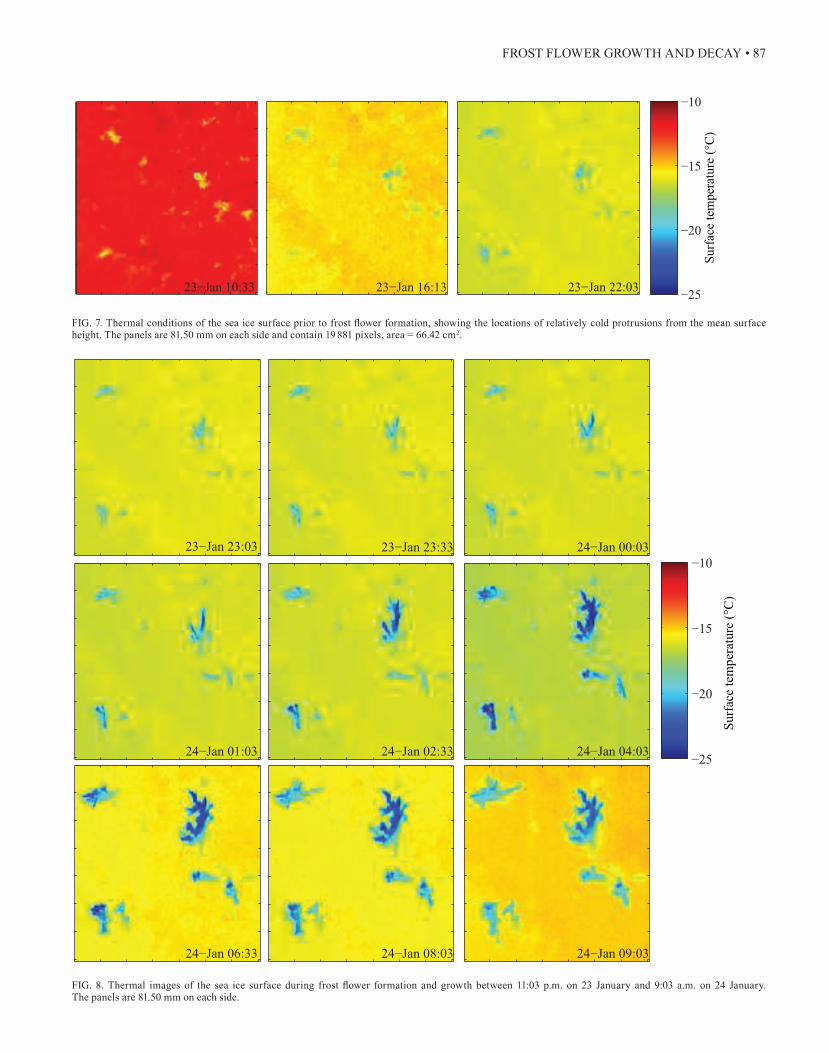
Surface temperature images during frost flower forma-tion (Fig. 8) show frost flowers grew at the same locations as the cold raised surface roughness nodules highlighted in the images from 23 January (Fig. 7). The surface tempera-tures of the growing frost flowers declined rapidly (see the minimum image temperature on Fig. 6a, blue line), creat-ing a temperature difference of up to 8˚C (Fig. 6b, black line) relative to the brine skim, i.e., the modal surface tem-perature (Fig. 6, magenta line). The brine skim remained warmer than the air temperature by up to 15˚C (Fig. 6b, blue line), while minimum frost flower temperatures at the cold nodule locations decreased toward the air tempera-ture throughout the overnight period of frost flower growth (Fig. 6b, green line).
Hourly example images from 11:03 p.m. on 23 Janu-ary to 9:03 a.m. on 24 January (Fig. 8, where each pixel is 0.334 mm2) illustrate the advancement of filamentous nee-dle crystal habit structures overnight, clearly showing the evolution of six individual frost flowers from their origi-nating nodule positions (see Fig. 7). Optical photographs of the same surface at 9:33 a.m. on 24 January showed these
six well-developed frost flowers with filamentous needle crystal habits between 10 mm and 15 mm in height (Fig. 9). These flowers were more horizontally developed from their originating nodules than vertically developed (Figs. 8, 9). Two of the frost flowers imaged were oblong and had major axis lengths of up to 25 mm, while the rest were more square in aspect and had side lengths between 13 mm and 18 mm (Fig. 9). Two of the frost flower images show evi-dence of dendrite formation on their needle ends (Fig. 9c).
Frost Flower Degradation and Destruction
In the morning on 24 January, the atmospheric pres-sure decreased (Fig. 1a), the air temperature rose stead-ily (Fig. 1b) while the relative humidity steadily decreased (Fig. 1c), and the wind speed continued to increase. Dur-ing the period of frost flower degradation, the surface wind speed was only slightly above 1 m s-1, while the 10 m wind speed increased from under 2 m s-1 to under 3 m s-1 (Fig. 1d). The increased cloudiness observed that morning is reflected in the incoming shortwave radiation compared to the clear sky values from 23 January (Fig. 3a) and fur-ther evidenced by the increase in net longwave radiation (Fig. 3b), which resulted in reduced net all-wave radiation at the surface compared to clear sky conditions on the pre-vious day (Fig. 3c). This forming depression brought snow-fall, which began about 12:05 p.m. on 24 January (signified by the abrupt increase in albedo, Fig. 3a), associated with increased relative humidity (Fig. 1c). The frost flower deg-radation period is marked by continual reduction in the temperature difference between the minimum surface tem-perature (i.e., the frost flower temperature) and the 2 m air temperature, and degradation began when that difference was less than 5˚C (Fig. 6b).
Fully formed frost flowers at 9:00 a.m. on 24 January (Figs. 8, 9) sublimated rapidly as their peripheries warmed (Fig. 10a – c); the difference between the frost flower surface temperature and the air temperature continued to decrease as it had overnight (as they grew into colder air), though now as a result of warming of the surface constituents
Dep
th (c
m)
12am 3am 6am 9am 12pm 3pm 6pm 9pm 12am 3am 6am 9am 12pm 3pm 6pm 9pm 12am
5
10
15
20 −18
−16
−14
−12
−10
−8
−6
−4
−20 Snow cover
Snow
rem
oval
Frost flowergrowth
Fros
t flo
wer
deg
rada
tion
Snow
fall
even
t
Tem
pera
ture
(°C
)
FIG. 2. Sea ice temperatures (˚C) at 2 cm increments in the SERF between 12:00 a.m. on 23 January and 12:00 a.m. on 25 January 2013.
84 • R.J. GALLEY et al.
(Figs. 6b, 10). After noon on 24 January, a snowfall event mechanically broke, covered, and incorporated what was left of the filamentous needle crystal structure of the frost
flowers and cooled the surface to the snow temperature, rapidly narrowing the temperature range of the imaged sur-face (Figs. 6, 10d – f).
Snow
rem
oval
Frost flowergrowth
Fros
t flo
wer
deg
rada
tion
Snow
fall
even
t
Snow
rem
oval
Frost flowergrowth
Fros
t flo
wer
deg
rada
tion
Snow
fall
even
t
12am 3am 6am 9am 12pm 3pm 6pm 9pm 12am 3am 6am 9am 12pm 3pm 6pm 9pm 12am−200
−100
0
100
200
300
400
Shor
twav
e ra
diat
ion
(Wm
)
0102030405060708090100
Alb
edo
K↓K↑
Albedo
−300
−200
−100
0
100
200
300
Long
wav
e ra
diat
ion
(Wm−2
)
L↑L↓Lnet
−2
−150
−100
−50
0
50
100
150
Net
radi
atio
n (W
m-2
)
Fros
t flo
wer
deg
rada
tion
Snow
fall
even
t
Snow
rem
oval
Frost flowergrowth
Snow covera.
b.
c.12am 3am 6am 9am 12pm 3pm 6pm 9pm 12am 3am 6am 9am 12pm 3pm 6pm 9pm 12am
12am 3am 6am 9am 12pm 3pm 6pm 9pm 12am 3am 6am 9am 12pm 3pm 6pm 9pm 12am
FIG. 3. The radiation balance over the SERF sea ice between 12:00 a.m. on 23 January and 12:00 a.m. on 25 January 2013, including (a) incoming and reflected shortwave radiation and albedo, (b) incoming, emitted, and net longwave radiation, and (c) net all-wave radiation. Negative values indicate energy loss by the surface.
FROST FLOWER GROWTH AND DECAY • 85
DISCUSSION
The thermal imaging of frost flowers provides a unique insight into their formation and degradation. Our results indicate that roughness elements are preferential sites for frost flower formation; frost flowers were observed to form only on nodules raised above the mean sea ice sur-face that were 4˚ – 6˚C colder than the modal surface temperature prior to frost flower formation (Fig. 6b). Though the estimated spatial density of frost flowers observed here was 903 m-2 sea ice surface, in this instance it appears that the frost flower spatial density was dependent upon the spa-tial density of raised nodules prior to frost flower formation since frost flowers formed only at these nodule locations.
A conceptual model of frost flower formation and deg-radation is presented in Figure 11; in Figure 11a, we show schematically how these nodules work in conjunction with the brine skim to form frost flowers. We suggest that the warm brine skim provides the necessary water vapour for frost flower deposition on the adjacent nodules. Although Style and Worster (2009) showed that a solid ice surface could provide water vapour through sublimation, brine skim is a common feature of new sea ice (e.g., Perovich and Richter-Menge, 1994) and probably acts as the main vapour supply when it is present. The highly saline brine skim (Figs. 4, 5b) was present for the duration of our study. It is
likely the result of continual brine expulsion from the top 2 cm layer of the sea ice as sea ice temperatures continued to cool overnight (Fig. 2), causing brine volume reduction. This expulsion hypothesis is supported by the decreased (24 to 18) bulk salinity in the top 2 cm layer of sea ice dur-ing the same period while the brine skim salinity increased from 65 to more than 85 (Fig. 4).
During the frost flower growth period, the high-pressure system (Fig. 1a) brought calm near-surface wind speeds overnight (Fig. 1d), which reduced or eliminated turbulence that otherwise might have rapidly transported water vapour away from the surface. With water vapour contained near the surface, any horizontal advection over the cold nod-ules would create a region of localized supersaturation (Fig. 11a). We illustrate the dramatic difference between vapour pressure at the brine skim surface (e′b, which we cal-culate using the saturation value for water, ew, corrected for its high bulk salinity, Sb, after Sverdrup et al., 1942):
0 5 10 15 20 25
0
2
4
6
8
10
12
14
16
18
Bulk salinity
Dep
th (c
m)
2013−01−23 2pm2013−01−24 8am
8580757065Brineskim
FIG. 4. Profiles of sea ice bulk salinity (dotted lines) and temperature (black lines) in SERF at 2:00 p.m. on 23 January and 8:00 a.m. on 24 January 2013.
FIG. 5. (a) Oblique view of the bare sea ice surface at SERF, where the ice thickness was 15 cm. The end of the white horizontal I-beam in the top left corner of the image is 10 cm high by 6 cm wide (for scale). Small-scale roughness elements above the mean surface height are visible as small white areas. (b) Photograph of a Kimtech® low-lint wipe, which immediately began wicking up liquid from the surface when laid on the brine-wetted sea ice (elapsed time less than five seconds).
86 • R.J. GALLEY et al.
12am 3am 6am 9am 12pm 3pm 6pm 9pm 12am 3am 6am 9am 12pm 3pm 6pm 9pm−35
−30
−25
−20
−15
−10Te
mpe
ratu
re (°
C)
12am
surface modesurface meansurface minimumsurface maximumsurface mean ±1std
2-m air temperature
Snow
rem
oval
Frost flowergrowth
Fros
t flo
wer
deg
rada
tion
Snow
fall
even
t
0
2
4
6
8
10
12
14
16Min surface < surface modeTair < surface modeTair < min surface
Tem
pera
ture
diff
eren
ce (°
C)
Frost flowergrowth
Snow
fall
even
t
Snow
rem
oval
a.
b.
12am 3am 6am 9am 12pm 3pm 6pm 9pm 12am 3am 6am 9am 12pm 3pm 6pm 9pm 12am
Fros
t flo
wer
deg
rada
tion
FIG. 6. (a) The mean (± 1 SD), mode, minimum, and maximum surface temperature in each IR camera image subset (image subset is 39.48 mm (rows) by 40.88 mm (columns) = 1613.94 mm2 or 16.14 cm2) at 5 min intervals (n = 348) between 10:08 a.m. on 23 January and 3:13 p.m. on 24 January 2013, accompanied by the 2 m air temperature. (b) The differences between the minimum surface temperature pixel in each image and the modal surface (brine skim) temperature of that image (black line); the 2 m air temperature and the modal surface (brine skim) temperature (blue line); and the 2 m air temperature and the minimum surface temperature (i.e., raised nodule and later frost flower locations).
FROST FLOWER GROWTH AND DECAY • 87
23−Jan 10:33 23−Jan 16:13 23−Jan 22:03 −25
−20
−15
−10
Surf
ace
tem
pera
ture
(°C
)
FIG. 7. Thermal conditions of the sea ice surface prior to frost flower formation, showing the locations of relatively cold protrusions from the mean surface height. The panels are 81.50 mm on each side and contain 19 881 pixels, area = 66.42 cm2.
23−Jan 23:03 23−Jan 23:33 24−Jan 00:03
24−Jan 01:03 24−Jan 02:33 24−Jan 04:03
24−Jan 06:33 24−Jan 08:03 24−Jan 09:03
−25
−20
−15
−10
Surf
ace
tem
pera
ture
(°C
)
FIG. 8. Thermal images of the sea ice surface during frost flower formation and growth between 11:03 p.m. on 23 January and 9:03 a.m. on 24 January. The panels are 81.50 mm on each side.

88 • R.J. GALLEY et al.
FIG. 9. Optical photographs at 9:33 a.m. on 23 January of frost flowers imaged using the thermal camera (Ruler for scale in mm).
e′b = ew (1 − 0.000537Sb) [1]
where: [2]
compared to the saturation vapour pressure over the cold ice (ei) nodules:
[3]
where P is the atmospheric pressure in millibars and T is the surface temperature at each pixel in the infrared images in degrees Celsius. Equations 2 and 3 are from Andreas et al. (2002).
Near the time of initial frost flower formation, the cal-culated vapour pressure over the brine skim was around 2.5 mbar (Fig. 12a). In contrast, the saturation vapour pressure over the cold nodules was around 1.75 mbar (Fig. 12d). This means that advection of air overlying the brine skim over a cold nodule would result in a supersatu-ration of ~140%. Interestingly, the degree of supersatura-tion increased over the frost flower formation period as the frost flowers grew upwards and became colder relative to the brine skim (Figs. 7, 12). This suggests that frost flower growth may be a self-accelerating process, at least until the flowers grow to a height that matches that of the zone of supersaturation (Fig. 11a). The long needle crystal habits observed here (e.g., Fig. 9) were oriented more horizontally than vertically from the nodule origin of the frost flow-ers, which may be a sign of preferential horizontal crys-tal growth within the zone of supersaturation rather than growth upwards out of that zone.
The long needle ice crystal habits of the observed frost flowers (Fig. 9) are consistent with previously observed crystal habits formed at the same air temperatures and are further evidence of their origin by deposition from the vapour phase (e.g., Magono and Lee, 1966; Hobbs, 1974; Perovich and Richter-Menge, 1994). Specifically, Magono and Lee (1966) showed that needles grown from the vapour phase formed between −20˚C and −30˚C; Hal-˚C; Hal-C; Hal-lett and Mason (1958) showed that small rod crystal habits formed under very high supersaturation conditions between −18˚C and −25˚C; and Martin et al. (1996) observed rod-like flowers between −16˚C and −25˚C. The high bulk salinity of the brine skim and top layer of sea ice (Fig. 4) and the observation of high frost flower bulk salinity during this experiment (Rysgaard et al., 2013) mean that these crys-tal structures were likely brine-wetted by capillary action, which may have blunted their crystal growth (e.g., Fig. 9c) as suggested by Domine et al. (2005). Elongated crystal habits are favoured at comparatively quick growth rates because new projections form at the ends and edges of the crystal, where vapour pressure supersaturation is great-est (Colbeck, 1982; Style and Worster, 2009), in part as a result of a large temperature gradient. This supersaturation
ei = [1.0003+ 4.18 10 6P] 6.1115 exp 22.452T272.55+T
ew = [1.0007+3.46 10 6P] [6.1121 exp 17.966T247.15+T
]

FROST FLOWER GROWTH AND DECAY • 89
FIG. 10. Thermal images of the sea ice surface during frost flower degradation (panels a–c) and then destruction by snowfall (panels d–f) between 10:33 a.m. and 12:38 p.m. on 24 January 2013. The panels are 81.50 mm on each side.
also helps explain the initial formation of frost flowers on raised nodules on the sea ice surface and the preference for horizontal growth observed in this case (e.g., Figs. 8, 9). The thermal imagery shows that frost flower degradation occurred as a result of mass loss through sublimation at the peripheries of the imaged frost flowers (Fig. 10) between 9:00 a.m. and noon on 24 January, a time that coincided with increased air temperature (Fig. 1b), an abrupt decrease in relative humidity (Fig. 1c) and increased wind speeds (Fig. 1d). The surface net radiation balance switched from negative to positive as a result of increased incoming short-wave radiation at sunrise, while the net longwave radia-tion balance remained near zero throughout the morning (Fig. 3). Put in the context of the work of Style and Wor-ster (2009), the differences in temperature between (i) the minimum surface (frost flower) and the modal sur-face (brine skim), (ii) the air at 2 m and the brine skim, and (iii) the air at 2 m and the frost flowers continued to decrease throughout the degradation period (Fig. 6b). We also observed a reduction in relative humidity over the sur-face during the degradation period. We postulate that sur-face warming at sunrise promoted mixing at the surface, as well as the reduction in relative humidity at 2 m, allowing for increased sublimation. The decrease in relative humid-ity at 2 m steepens the gradient between the surface and the far-field, allowing moisture to be removed more quickly from the near-surface layer. Another key physical mecha-nism of frost flower degradation was the increase in wind
“warm” brine skim
cold nodule
e(z)
es(Tw) es(Ti)
e(z = ∞)a.
“warm” brine skim
cold nodule
e(z)
es(Tw) es(Ti)
b.e(z = ∞)
FIG. 11. Schematic of (a) growth and (b) decay mechanisms for frost flowers. (a) Water vapour (e) supplied by the warm brine skim is at the saturation value with respect to water (es(Tw)) at the surface and decreases with height (z) towards the far-field value (e(z = ∞)), following a shape typical of diffusion-controlled transport (Style and Worster, 2009). Under calm conditions, advective motion is laminar, which preserves the e(z) shape over the cold nodules. Since the saturation value with respect to ice (es(Ti)) is so much lower, local supersaturation occurs, and water vapour is deposited in the form of frost flowers. (b) Decay is initiated when increased winds drive turbulent mixing. The mixing of unsaturated far-field water vapour down towards the surface erodes the supersaturated layer over the nodules, and the frost flowers sublimate.
24−Jan 10:33 24−Jan 11:03 24−Jan 12:03
24−Jan 12:13 24−Jan 12:23 24−Jan 12:38
−25
−20
−15
−10
Surf
ace
tem
pera
ture
(°C
)
a.
d.
b. c.
e. f.

90 • R.J. GALLEY et al.
Brine
Ice1
1.5
2
2.5
e (m
bar)
a.
d.
b. c.
e. f.
23-Jan 10:33 23-Jan 16:13 23-Jan 22:03
23-Jan 10:33 23-Jan 16:13 23-Jan 22:03
speed, which would have increased turbulent mixing, erod-ing the supersaturated near-surface layer. Therefore, we propose that the frost flowers degraded by sublimation in much the same way that low clouds burn off as the sun becomes more intense during morning hours. Degradation was further enabled by wind mixing (shown schematically in Fig. 11b), before frost flowers were eventually covered by fresh snowfall.
CONCLUSIONS
Frost flowers were formed overnight on raised nodules 0.3 cm2 or smaller with heights of 5 mm above the mean surface of brine-wetted young sea ice. These nodules were 4˚ to 6˚C colder than the mean surface before frost flowers formed; therefore, when air overlying the brine skim was advected over a nodule, it became supersaturated above the nodule. The observed saline brine skim was present prior to formation of frost flowers and throughout their growth and degradation. The near-surface layer of sea ice was the source of the brine skim, which was supplied by expul-sion due to cooling of the ice volume. Frost flowers began to form overnight during the formation of a high-pressure system, which brought extremely cold air temperatures, 70% relative humidity, very low wind speeds, and a net radiation balance at the surface of less than −100 Wm-2. The minimum surface temperature imaged (first indicative of
the nodules and later of the frost flowers) was 9˚C warmer than the air temperature when frost flower formation began, and that difference decreased continually as the frost flow-ers grew and throughout their sublimation and eventual mechanical destruction. The frost flowers developed more horizontally than vertically. They consisted of well-defined filamentous needle crystal habits, which have been shown to form at the same range of air temperatures. Some of the frost flower needles were blunted at their ends by the for-mation of small spatial dendrites.
Frost flower degradation began at sunrise in associa-tion with increased incoming shortwave radiation that led to a net radiation balance of ~0 Wm-2 when the frost flow-ers began to sublimate, losing ice mass from the extremi-ties of the frost flower crystals. Increased air and surface temperatures decreased the difference in the surface and far-field temperatures. Frost flower degradation via subli-mation was further associated with increased wind speeds and decreased relative humidity. A snowfall event led to the final destruction of the frost flowers by crystal fracture, and they were incorporated into the snow in less than 30 minutes.
ACKNOWLEDGEMENTS
The Canada Excellence Research Chair program, the Canada Research Chair program and the Natural Sciences and
FIG. 12. Saturation vapour pressure with respect to the saline brine-wetted sea ice surface (panels a – c) and with respect to an ice surface (panels d – f) calculated using the infrared image surface temperature at each pixel location.

FROST FLOWER GROWTH AND DECAY • 91
Engineering Research Council of Canada contributed funding to this study. The Canada Foundation for Innovation, the Canadian Excellence Research Chair program, the Manitoba Research and Innovation Fund, and the University of Manitoba funded the SERF. The authors thank three anonymous reviewers for their thoughtful and constructive comments that improved our work. This work is a contribution to the Arctic Science Partnership and the ArcticNet Networks of Centres of Excellence programs.
REFERENCES
Andreas, E.L., Guest, P.S., Persson, P.O.G., Fairall, C.W., Horst, T.W., Moritz, R.E., and Semmer, S.R. 2002. Near-surface water vapor over polar sea ice is always near ice saturation. Journal of Geophysical Research 107(C10).
http://dx.doi.org/10.1029/2000JC000411Bowman, J.S., and Deming, J.W. 2010. Elevated bacterial
abundance and exopolymers in saline frost flowers and implications for atmospheric chemistry and microbial dispersal. Geophysical Research Letters 37, L13501.
http://dx.doi.org/10.1029/2010GL043020Colbeck, S.C. 1982. An overview of seasonal snow metamorphism.
Reviews of Geophysics 20(1):45 – 61. http://dx.doi.org/10.1029/RG020i001p00045Domine, F., Taillandier, A.S., Simpson, W.R., and Severin, K.
2005. Specific surface area, density and microstructure of frost flowers. Geophysical Research Letters 32, L13502.
http://dx.doi.org/10.1029/2005GL023245Douglas, T.A., Sturm, M., Simpson, W.R., Brooks, S., Lindberg,
S.E., and Perovich, D.K. 2005. Elevated mercury measured in snow and frost flowers near Arctic sea ice leads. Geophysical Research Letters 32, L04502.
http://dx.doi.org/10.1029/2004GL022132Douglas, T.A., Domine, F., Barret, M., Anastasio, C., Beine, H.J.,
Bottenheim, J., Grannas, A., et al. 2012. Frost flowers growing in the Arctic ocean-atmosphere – sea ice – snow interface: 1. Chemical composition. Journal of Geophysical Research 117, D00R09.
http://dx.doi.org/10.1029/2011JD016460Drinkwater, M.R., and Crocker, G.B. 1988. Modelling changes
in the dielectric and scattering properties of young snow-covered sea ice at GHz frequencies. Journal of Glaciology 34(118):274 – 282.
Gallet, J.-C., Domine, F., Savarino, J., Dumont, M., and Brun, E. 2013. The growth of sublimation crystals and surface hoar on the Antarctic plateau. The Cryosphere Discussions 7:5971 – 5999.
http://dx.doi.org/10.5194/tcd-7-5971-2013Geilfus, N.-X., Carnat, G., Dieckmann, G.S., Halden, N., Nehrke,
G., Papakyriakou, T., Tison, J.-L., and Delille, B. 2013. First estimates of the contribution of CaCO3 precipitation to the release of CO2 to the atmosphere during young sea ice growth. Journal of Geophysical Research Oceans 118:244 – 255.
http://dx.doi.org/10.1029/2012JC007980
Hallett, J., and Mason, B.J. 1958. The influence of temperature and supersaturation on the habit of crystals grown from the vapour. Proceedings of the Royal Society of London A 247(1251):440 – 453.
http://dx.doi.org/10.1098/rspa.1958.0199Hare, A.A., Wang, F., Barber, D., Geilfus, N.-X., Galley, R.J., and
Rysgaard, S. 2013. pH evolution in sea ice grown at an outdoor experimental facility. Marine Chemistry 154:46 – 54.
http://dx.doi.org/10.1016/j.marchem.2013.04.007Hobbs, P.V. 1974. Ice physics. Oxford: Clarendon Press. 837 p.Isleifson, D., Galley, R.J., Barber, D.G., Landy, J.C., Komarov,
A.S., and Shafai, L. 2014. A study on the C-band polarimetric scattering and physical characteristics of frost flowers in experimental sea ice. IEEE Transactions on Geoscience and Remote Sensing 52(3):1787 – 1798.
http://dx.doi.org/10.1109/TGRS.2013.2255060Kwok, R. 2007. Near zero replenishment of the Arctic multiyear
sea ice cover at the end of 2005 summer. Geophysical Research Letters 34, L05501.
http://dx.doi.org/10.1029/2006GL028737Kwok, R., and Cunningham, G.F. 2010. Contribution of melt in
the Beaufort Sea to the decline in Arctic multiyear sea ice coverage: 1993 – 2009. Geophysical Research Letters 37, L20501.
http://dx.doi.org/10.1029/2010GL044678Magono, C., and Lee, C.W. 1966. Meteorological classification
of natural snow crystals. Journal of the Faculty of Science - Hokkaido University, Series 7, Geophysics 2(4):321 – 335.
Martin, S., Drucker, R., and Fort, M. 1995. A laboratory study of frost flower growth on the surface of young sea ice. Journal of Geophysical Research 100(C4):7027 – 7036.
http://dx.doi.org/10.1029/94JC03243Martin, S., Yu, Y., and Drucker, R. 1996. The temperature
dependence of frost flower growth on laboratory sea ice and the effect of the flowers on infrared observations of the surface, Journal of Geophysical Research 101(C5):12111 – 12125.
http://dx.doi.org/10.1029/96JC00208Maslanik, J.A., Fowler, C., Stroeve, J., Drobot, S., Zwally, J.,
Yi, D., and Emery, W. 2007. A younger, thinner Arctic ice cover: Increased potential for rapid, extensive sea-ice loss. Geophysical Research Letters 34, L24501.
http://dx.doi.org/10.1029/2007GL032043 Maslanik, J., Stroeve, J., Fowler, C., and Emery, W. 2011.
Distribution and trends in Arctic sea ice age through spring 2011. Geophysical Research Letters 38, L13502.
http://dx.doi.org/10.1029/2011GL047735Millero, F.J. 2006. Chemical oceanography. Boca Raton, Florida:
CRC Press.Nakaya, U. 1954. Snow crystals: Natural and artificial. Cambridge,
Massachusetts: Harvard University Press.Perovich, D.K., and Richter-Menge, J.A. 1994. Surface
characteristics of lead ice. Journal of Geophysical Research 99(C8):16341 – 16350.
http://dx.doi.org/10.1029/94JC01194
92 • R.J. GALLEY et al.
Rankin, A.M., Wolff, E.W., and Martin, S. 2002. Frost flowers: Implications for tropospheric chemistry and ice core interpretation. Journal of Geophysical Research 107(D23), 4683.
http://dx.doi.org/10.1029/2002JD002492Roscoe, H.K., Brooks, B., Jackson, A.V., Smith, M.H., Walker,
S.J., Obbard, R.W., and Wolff, E.W. 2011. Frost flowers in the laboratory: Growth, characteristics, aerosol, and the underlying sea ice. Journal of Geophysical Research 116, D12301.
http://dx.doi.org/10.1029/2010JD015144Rysgaard, S., Wang, F., Galley, R.J., Grimm, R., Lemes, M.,
Geilfus, N.-X., Chaulk, A., et al. 2013. Dynamic ikaite production and dissolution in sea ice – control by temperature, salinity and pCO2 conditions. The Cryosphere Discussions 7:6075 – 6099.
http://dx.doi.org/10.5194/tcd-7-6075-2013
Sherman, L.S., Blum, J.D., Douglas, T.A., and Steffen, A. 2012. Frost flowers growing in the Arctic ocean-atmosphere – sea ice – snow interface: 2. Mercury exchange between the atmosphere, snow, and frost flowers. Journal of Geophysical Research 117, D00R10.
http://dx.doi.org/10.1029/2011JD016186Style, R.W., and Worster, M.G. 2009. Frost flower formation on
sea ice and lake ice. Geophysical Research Letters 36, L11501. http://dx.doi.org/10.1029/2009GL037304Sverdrup, H.U., Johnson, M.W., and Fleming, R.H. 1942. The
oceans: Their physics, chemistry, and general biology. Englewood Cliffs, New Jersey: Prentice-Hall. 1087 p.
Wensnahan, M.R., Grenfell, T.C., Winebrenner, D.P., and Maykut, G.A. 1993. Observations and theoretical studies of microwave emission from thin saline ice. Journal of Geophysical Research 98(C5):8531 – 8545.
http://dx.doi.org/10.1029/93JC00136