Embed Size (px)
Citation preview

MICROFINANCE: Enabling The Power of Ideas & Entrepreneurial
Energy for the Other Half
Vinod KhoslaMay 2004
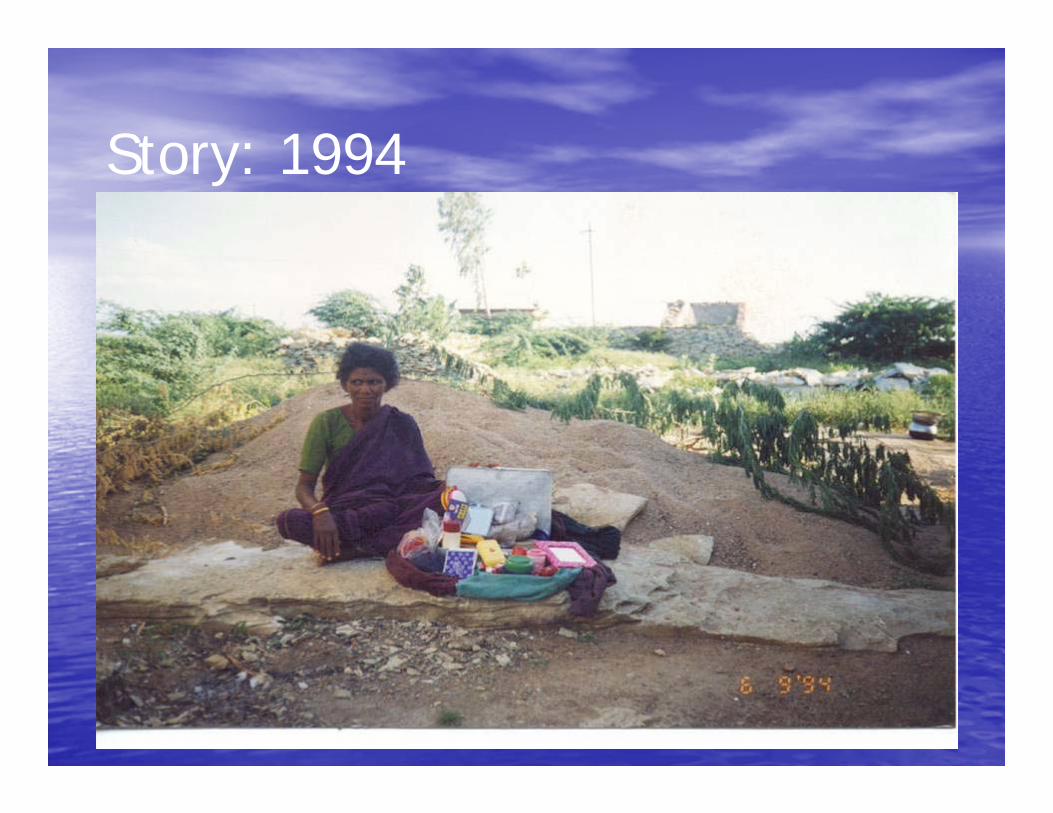
Story: 1994
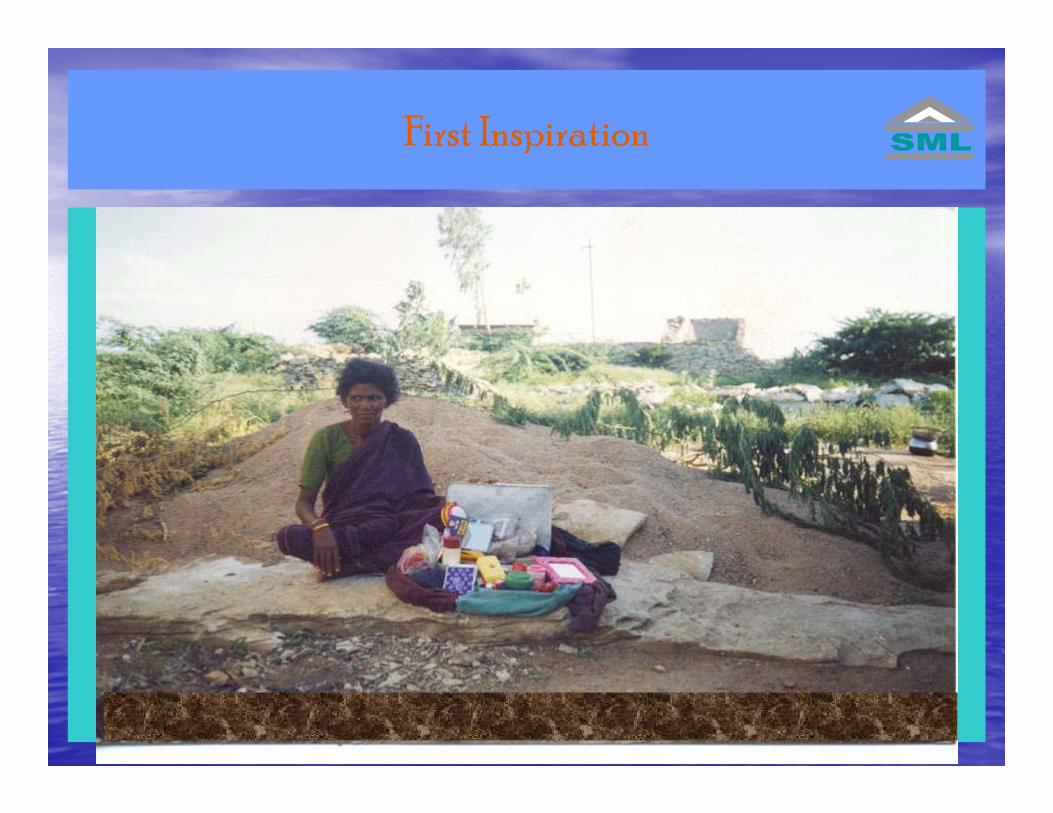
First Inspiration

SHARE: History
Source: Company Information
1998-99 1999-2000 2000-2001 2001-02 2002-03 2003-04
Active Clients 14,155 30,629 48,868 85,644 132,084 197,722
Yrly Disbursed 1,921,035 4,651,210 6,047,275 12,868,419 20,358,382 36,479,044
Cum Disbursed 3,254,810 7,906,020 13,604,790 25,825,362 43,938,060 81,393,506
Loan Portfolio 1,098,896 2,616,531 4,101,330 6,728,653 10,738,703 18,209,566
Financial Self Sufficiency 71% 74% 84% 100% 104% 110%
Cost per $ Loan 0.13 0.09 0.09 0.09 0.08 0.07

No of States : 3No of Districts : 20No of Branches: 108
No. of States-03No. of districts-20No. of branches-128No. Villages- 3000

SHARE: Dreams
Source: Company Information
2004-5 2005-6 2006-7 2007-8 2008-9
Branches 186 266 346 426 500
Staff 1728 2486 3215 3945 4622
Active Members 335,757 505,931 679,093 854,762 1,028,018
Total Disbursments($ Mil) 59.4 91.5 126 162.9 200.1
Loan Portfolio ($ Mil) 31.2 47.3 64.6 83 101.6
Self Sufficiency (Financial) 106 110 112 112 112
Equity ($ Mil) 0.6 0.7 0.7 0.4 0.4
Pref. Capital 3.3 1.1 1.1 1.1 1.1

TARGET:
• SML provides access to financial resources to people excluded from the conventional, formal financial system.
• Rural Poor Women;
• Whose asset value is less than Rs. 20,000/- (US $ 444.44);
• Whose per capita income is less than Rs. 350/- (US $ 7.77) per month and
• Who live in poor housing conditions.

Impact:

Impact Study(Bath, Sheffield & Sussex Universities – England)
1) 76.8% of the clients experienced significant reduction in their poverty over the last four years of which;
i. 38.4% moved from Very Poor to Moderate Poorii. 17.6% moved from Very Poor to Not Pooriii. 20.8% moved from Moderate Poor to Not Poor
2) 38.4% are in the Non Poor category.3) 80% witnessed increase in income levels.4) Women actively participate in family decisions.5) Most of the members’ children are being sent to schools.6) 17 different combinations were used as paths out of poverty.

• Began in 1976 in Bangladesh
• 3.5 million borrowers• $4.4 billion lent
– 500 types of micro-businesses– average amount: $160– peer support and pressure– $4.1 billion repaid
• 120,000 GB families overcomepoverty each year (1992 WB survey) Prof. Muhammad Yunus,
Founder, Grameen Bank

Grameen Foundation, USA’s Partners in India
SHARE ASA CFTS SKSGrameen
Koota SNEHA Total
# of ActiveClients
197,943 68,781 27,769 21,946 9,083 6,059 331,581
Branches 99 27 17 9 9 4 165
CumLoansDisbursed(US$)
71,031,219 14,124,871 11,183,363 5,529,670 1,228,917 1,824,421 104,922,461
PortfolioO/S (US$) 16,773,450 3,528,145 2,213,363 1,766,496 494,654 483,189 25,259,296
PAR > 30Days 0% 2.7% 4.44% 0% 0% 0%
• $2.1 million invested since December 2000• Quadruple growth from 80,000 to 330,000
borrowers in 3 years

GF-USA Results
Scale up leading MFI in Pakistan (Kashf) 15,000 to 60,000 clients in 20 months GF-USA invests $356,000
Guarantee for SHARE securitization Largest in history; only second overall GF-USA invests $325,000 (doubling past $) Leverage: 12:1; 25,000 new clients in Q1
Industry-leading technology projects Replication of Grameen Telecom in Uganda
(5,000 phones; 400 in place & 60/month) Village Computing Project in India
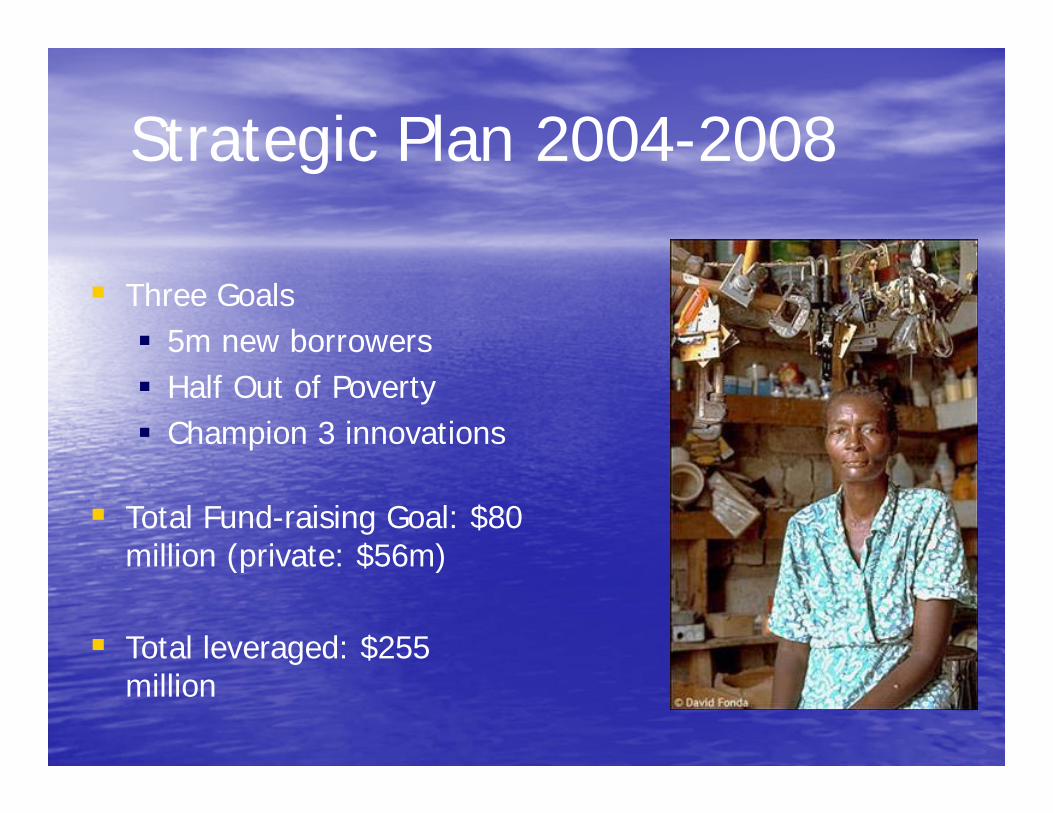
Strategic Plan 2004-2008
Three Goals 5m new borrowers Half Out of Poverty Champion 3 innovations
Total Fund-raising Goal: $80 million (private: $56m)
Total leveraged: $255 million
DREAM the DREAMS!
• Microcredit Summit 1997– Reach the Poorest– Empower Women– Build Financially Self-Sufficient Institutions– Positive Measurable Impact
• 100m by 2005 (x5)
Source: The State of the Microcredit Summit Campaign Report 2003
Remove The Myths
• The poorest are too costly to reach & motivate
• Institutions for the poor cannot be financially self-sufficient
• Such institutions will only add a debt burden to the poor
Source: The State of the Microcredit Summit Campaign Report 2003

ImpactReaching 100M Poorest
0
20
40
60
80
100
120
1997 1998 1999 2000 2001 2002 2003 2004 2005
Year
Clie
nts
reac
hed
(M)
Actual Forecast
Source: The State of the Microcredit Summit Campaign Report 2003

Impact:

Exponential Growth:
Institutions Reporting Clients Reached (Mil) "Poorest" Clients Reached (mil)
Dec-97 618 13.5 7.6
Dec-98 925 20.9 12.2
Dec-99 1065 23.6 13.8
Dec-00 1567 30.7 19.3
Dec-01 2186 54.9 26.9
Dec-02 2572 67.6 41.6
Source: The State of the Microcredit Summit Campaign Report 2003

Exponential Growth:
Source: The State of the Microcredit Summit Campaign Report 2003
Size of Institution (in terms of clients) Number of Institutions Combined Number of Clients %
> 1 million 8 13,545,168 32.56%100,000 - 999,999 25 6,414,155 15.42%10,000 - 99,999 222 5,961,996 14.33%2,500 - 9,999 410 1,958,777 4.71%< 2500 1904 1,003,372 2.41%Networks 3 12,711,310 30.56%

Economic Basis
Source: The State of the Microcredit Summit Campaign Report 2003
• Ratings
• Professional Boards
• Audit Functions
• Market Cost of Funds
• Incentive Compensation
• ….and much more

SustainabilitySustainability & Portfolio Size
0
20
40
60
80
100
120
<40 40-140 140-500 >500
Portfolio '000s US$
Perc
enta
ge (%
)
OSSFSS
Notes:
• Operational Self-Sufficiency (OSS) is the ability of a MFI to meet all its operational and financial costs out of its income from operations
• Financial Self-Sufficiency (FSS) measures the extent to which its income from operations covers operating costs after adjusting for all forms of subsidy and the impact of inflation
Source: M-CRIL Microfinance Review 2003

Capitalism Scaled?
• Virtuous Pyramid Scheme• Sustainable• “Better NOT Best Alternative” Methodology• Incentive Schemes for Workforce• Scalability: Commercial basis at ALL levels• Economic Efficiency from Darwinian Model

Powers of…
• Entrepreneurship
• Power of Ideas
• Self preservation, Survival & Betterment
• Appropriate Capital
• Appropriate Assistance
Regulation

Securitization: Creating a Secondary Market for Micro-finance
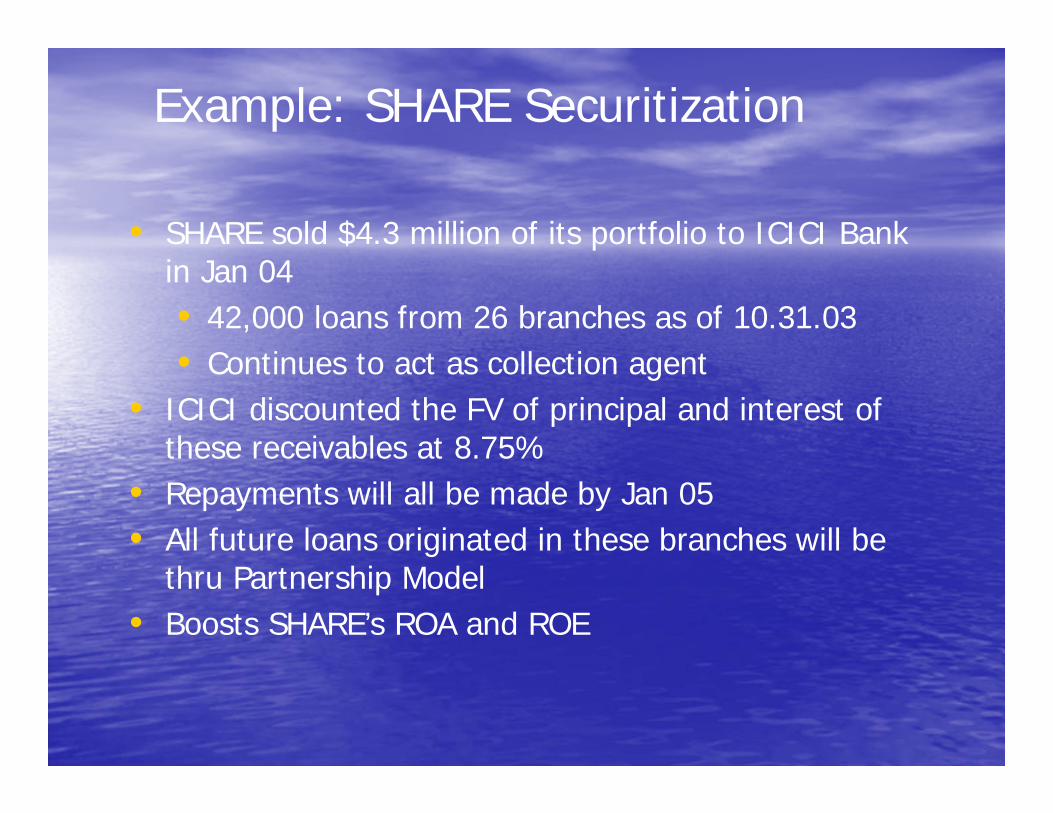
Example: SHARE Securitization
• SHARE sold $4.3 million of its portfolio to ICICI Bank in Jan 04• 42,000 loans from 26 branches as of 10.31.03• Continues to act as collection agent
• ICICI discounted the FV of principal and interest of these receivables at 8.75%
• Repayments will all be made by Jan 05• All future loans originated in these branches will be
thru Partnership Model• Boosts SHARE’s ROA and ROE

• Investors and lenders demand increased efficiency and transparency New efficiencies can mean lower costs to
borrowers Increased transparency and professionalism
leading to lower risk of error and fraud• Tapping into virtually unlimited sources of capital for
expansion• Reduction of time management spends “fund-
raising”
Benefits of Commercialization

Do Good , Do Well

Technology’s Role:
• ICT for cost management
• ICT as “products”
• ………?– MIT Media Labs– UC Berkeley
Debates?
• Sustainability vs MFI+• Definition of BPL• Impact Assessment Issues• Usurious Interest?• NGO or “For Profit”• Role of Government• Role of Big Institutions
Lessons From Silicon Valley
• David or Goliath?• Process or Passion?• Help vs Enablement vs “Get out of the Way”• Entrepreneurial Innovation• Entrepreneurial Persistence• Entrepreneurial Capital Efficiency• Entrepreneurial Energy• Venture Capital & Venture Assistance
Mix of $
• Research• “Programs”• Impact Assessment• Equity• Loans

• Exclusion of poorest people and areas to reduce perceived portfolio risk among MFI
lenders/owners• Phasing out of complementary services (BDS, credit
with education) and social impact experimentation to reduce costs and increase profits
• “Mission Drift”: Overarching poverty reduction objective slowly diluted/lost
• Ownership is increasingly foreign and from traditional banking sector
Risks of Commercialization

• Right mix of incentives for MFI loan officers Grameen Bank Five Star System2 for social impact3 stars for financial performance
• Apex organizations choice of MFIs Case of SHARE & GF-USA
• MFI choices for key management and governance posts (case of Fonkoze)
• Donors/Investors attention and valuing of: Poverty targeting, poverty impact (monitoring &
results), experimentation & complementary services Ensuring that ownership is predominantly local and
ideally includes clients themselves
Risk Mitigation

Goal 1: 5m new clients
4m from ~12 MFIs Mostly Asian Capacity-building & financing
Directly Invest $40m Leverage $240m
Final 1m: “Seedbed” MFIs (smaller, ensure pipeline for future growth) Latin America, China, Arab World