Embed Size (px)
Citation preview

MICROENCAPSULATION OF MUSCADINE GRAPE EXTRACTS TO PRODUCE SHELF
STABLE NUTRACEUTICAL POWDER
by
NEELANJAN RAY
(Under the Direction of Manjeet S. Chinnan)
ABSTRACT
Phenolic compounds found in muscadine pomace were extracted using enzyme
treatment, bladder press and microfiltration operation. These extracts were microencapsulated
using coating materials of gum arabic and whey protein and spray drying operation. The
microcapsules were characterized using Scanning electron microscopy and particle size
distribution. Microencapsulation yield of particles was 99.17% and 88.15% for particles coated
with whey protein and gum arabic respectively. Microencapsulated and uncoated samples were
kept at controlled environmental conditions. Uncoated powder samples changed color from
purple to black while appearance changed from free flowing to rubbery. In coated samples, the
color changed and appearance changed from free flowing to caking. Half lives were obtained
from the storage of samples over 8 weeks and indicate that microencapsulation helps in
protecting the antioxidants at 4 °C as compared to 25 °C. It was that found maximum
degradation was found in following order pure compound>whey protein>gum arabic.
INDEX WORDS: Phenolic, whey protein, gum arabic, Microencapsulation, scanning
electron microscopy, degradation.

MICROENCAPSULATION OF MUSCADINE GRAPE EXTRACTS TO PRODUCE SHELF
STABLE NUTRACEUTICAL POWDER AND STORAGE STUDIES
by
NEELANJAN RAY
B. Tech., SMC College of Dairy Science, Gujarat Agricultural University, India, 2002
A Thesis Submitted to the Graduate Faculty of The University of Georgia in Partial Fulfillment
of the Requirements for the Degree
MASTER OF SCIENCE
ATHENS, GEORGIA
2008

© 2008
Neelanjan Narayan Ray
All Rights Reserved

MICROENCAPSULATION OF MUSCADINE GRAPE EXTRACTS TO PRODUCE SHELF
STABLE NUTRACEUTICAL POWDER AND STORAGE STUDIES
by
NEELANJAN NARAYAN RAY
Major Professor: Manjeet S. Chinnan
Committee: Robert D. Phillips William L. Kerr
Electronic Version Approved: Maureen Grasso Dean of the Graduate School The University of Georgia December 2008

iv
ACKNOWLEDGEMENTS
I would like to express my appreciation to my major professor for his guidance, support,
encouragement and critical assessment. He gave equal importance to work and work ethics
which is important when you go and work for somebody else. I am also grateful to the members
of my advisory committee Dr. Phillips and Dr. Kerr for their comments and inputs which made
this research possible. I also acknowledge help of Glen Farrell in setting up the experiments.
The members of food engineering lab were really helpful: Shripad Tandale, for
encouragement and words of advice, Hannah Smith, for help with anything whenever I asked
for. I would like to thank other people in food science department Sue Ellen, Sandra, Larry
Hitchcock for help with my work. I would like to thank Mr. Jerry Davis for his help with
statistical data analysis.
To my friends Dharmendra Singh Pawar, Suvang, Neha for company. To my brother
Nirmalya and family back in India for support and words of encouragement.

v
TABLE OF CONTENTS
Page
ACKNOWLEDGEMENTS........................................................................................................... iv
LIST OF TABLES........................................................................................................................ vii
LIST OF FIGURES ....................................................................................................................... ix
CHAPTER
1 INTRODUCTION .........................................................................................................1
2 LITERATURE REVIEW ..............................................................................................6
MUSCADINE GRAPE .............................................................................................6
BIOLOGICAL IMPORTANCE OF WINE AND GRAPE COMPONENTS ..........7
FUNCTIONAL FOODS ...........................................................................................8
MICROENCAPSULATION.....................................................................................9
MICROENCAPSULATION TECHNIQUES.........................................................10
COATING MATERIALS .......................................................................................16
ANALYTICAL TESTING......................................................................................21
MICROENCAPSULATION YIELD......................................................................22
PHYSICAL PROPERTIES OF SPRAY DRIED PARTICLES .............................23
FILTRATION .........................................................................................................25
SCALES OF MEMBRANE FILTRATION ...........................................................27
EXTRACTION PROCESSES AND TECHNOLOGY ..........................................29
SAMPLE STORAGE FOR SHELF LIFE DETERMINATION ............................31

vi
REFERENCES........................................................................................................54
3 MICROFILTRATION OF MUSCADINE GRAPE POMACE AND PREPARATION
OF SPRAY DRIED POWDERS .................................................................................61
ABSTRACT ............................................................................................................62
INTRODUCTION...................................................................................................63
MATERIALS AND METHODS ............................................................................65
RESULTS AND DISCUSSION .............................................................................71
CONCLUSIONS .....................................................................................................74
REFERENCES........................................................................................................91
4 MICROENCAPSULATION OF GRAPE EXTRACTS WITH WHEY PROTEIN
CONCENTRATE AND GUM ARABIC USING SPRAY DRYING AND
STORAGE STUDIES..................................................................................................94
ABSTRACT ............................................................................................................95
INTRODUCTION...................................................................................................96
MATERIALS AND METHODS ............................................................................98
RESULTS AND DISCUSSION ...........................................................................103
CONCLUSIONS ...................................................................................................109
REFERENCES......................................................................................................128
5 SUMMARY AND CONCLUSIONS ........................................................................131

vii
LIST OF TABLES
Page
Table 2.1: Phenolic in muscadine grapes (milligrams per 100 g of fresh whole fruit)a ................35
Table 2.2: Dry matter of muscadine grape fruits and fruit parts....................................................36
Table 2.3: Definitions of functional foods.....................................................................................37
Table 2.4: Various microencapsulation techniques and processes involved in each technique ....38
Table 2.5: Advantages and disadvantages of spray drying............................................................39
Table 2.6: Spray drying parameters ...............................................................................................40
Table 2.7: Coating materials for microencapsulation of functional food additives.......................41
Table 2.8: Analytical data for the gum obtained from Acacia Senegal………………………….42
Table 2.9: Maximum usage levels (%) of gum arabic permitted in accordance with the FDA Code of federal regulations (title 21)……................…………………………………..43 Table 2.10: Uses of whey proteins in human foods.......................................................................44 Table 2.11: Examples of zero and first order reactions .................................................................45
Table 2.12: Quality function forms and half life times for different order reactions ....................46
Table 3.1: Composition of grape extract after enzyme treatment..................................................76
Table 3.2: Change in total phenols and total anthocyanins during processing of muscadine Pomace...........................................................................................................................................77
Table 3.3: Experimental data for change in total phenols, total anthocyanins in aqueous extracts
of muscadine pomace during microfiltration with bladder press...................................................78

viii
Table 3.4: Experimental data for change in total phenolics, total anthocyanins in aqueous extracts
of muscadine pomace during microfiltration without bladder press .............................................80
Table 4.1: Particle size distribution of spray dried powder particles (in different dispersants) ..111
Table 4.2: Degradation reaction rates (k), standard errors of the slope (sk), half life periods (T1/2)
and correlation coefficients (r2) for encapsulated whey protein samples stored at different
temperatures, light and dark conditions and 0.64 water activity .................................................112
Table 4.3: Degradation reaction rates (k), standard errors of the slope (sk) and half life periods
(T1/2) and correlation coefficients (r2) for uncoated samples stored at different temperatures, light
and dark conditions and 0.64 water activity ................................................................................113

ix
LIST OF FIGURES
Page
Figure 1.1: Choices for processed muscadine products...................................................................4
Figure 2.1: Positioning of food categories and pharmaceuticals in relation to bioactivity and
market value...................................................................................................................................47
Figure 2.2a: Schematic representation of two types of microcapsules..........................................48
Figure 2.2b: Various forms of microcapsules ............................................................................48
Figure 2.3: Schematic diagram of a spray-drying encapsulation process......................................49
Figure 2.4: Picture of spray dryer ..................................................................................................50
Figure 2.5: Chemical structure of gum arabic ...............................................................................51
Figure 2.6: Chemical structure of pectin ......................................................................................51
Figure 2.7: Structures involved in starch (a) Linear chain of alpha-1,4-glucan (b) Alpha-1,6
branch point ...................................................................................................................................52
Figure 2.8: Composition of single-pass, batch, and feed-and-bleed configurations for cross-flow
filtration. The dashed line in the middle panel represents an optional partial recycle stream in
batch configuration .......................................................................................................................53
Figure 3.1: (A) Urschel mill (B) Bladder Press (Top and side view) ............................................81
Figure 3.2: Photograph of microfiltration unit with its parts .........................................................82
Figure 3.3: Extraction tank with gas fired heater...........................................................................83
Figure 3.4: Experimental schemes for making muscadine grape extract from pomace ................84
Figure 3.5: Change in total phenol with time during microfiltration with bladder press ..............85

x
Figure 3.6: Change in total anthocyanin with time during microfiltration with bladder press......86
Figure 3.7: Change in total phenol with time during microfiltration without bladder press…….87 Figure 3.8: Change in total anthocyanin with time during microfiltration without bladder press.88
Figure 3.9: Change in concentration of total phenols, TP (g/kg) and total anthocyanins, TA (g/kg) at different processing steps with bladder press………………………………………….89 Figure 3.10: Change in concentration of total phenols, TP (g/kg) and total anthocyanins, TA (g/kg) at different processing steps without bladder press..………….…………………………..90 Figure 4.1: Experimental schemes for making microencapsulated grape extract powder using
gum Arabic and whey protein and without any coating ..............................................................114
Figure 4.2: Wooden chamber fitted with black light to see effect on storage of powder............115
Figure 4.3: Photograph of spray dried powder in glass display jars (A) No Lid (B) Lid and semi
permeable cloths cover ................................................................................................................116
Figure 4.4: Particle size distributions of spray dried powder particles with medium (A) Ethyl
alcohol (B) Water.........................................................................................................................117
Figure 4.5: Cumulative percentage particle size distribution in medium (A) Ethyl alcohol (B)
Water............................................................................................................................................118
Figure 4.6: SEM micrographs of grape extract powder particles without microencapsulation with
magnifications of (A) 1000X (B) 2000X and (C) 3000X............................................................119
Figure 4.7: SEM micrographs of grape extract microencapsulated with gum arabic coating with
magnifications of (A) 2000X (B) 2000X (C) 2000X and (D) 5000X .........................................120
Figure 4.8: SEM micrographs of grape extract microencapsulated with whey protein coating with
magnifications of (A) 100X (B) 1000X (C) 2000X (D) 3000X (E) 20,000X and (F) 50,000X..121

xi
Figure 4.9: Degradation kinetics of total phenol in powder at 4°C (A) Dark and (B) UV light
conditions.....................................................................................................................................122
Figure 4.10: Degradation kinetics of total phenol in powder at 25°C (A) Dark and (B) UV light
conditions.....................................................................................................................................123
Figure 4.11: Degradation kinetics of total phenol microencapsulated in gum arabic at 4°C (A)
Dark and (B) UV light conditions................................................................................................124
Figure 4.12: Degradation kinetics of total phenol microencapsulated in gum arabic at 25°C (A)
Dark and (B) UV light conditions................................................................................................125
Figure 4.13: Degradation kinetics of total phenol microencapsulated in whey protein at 4°C (A)
Dark and (B) UV light conditions................................................................................................126
Figure 4.14: Degradation kinetics of total phenol microencapsulated in whey protein at 25°C (A)
Dark and (B) UV light conditions................................................................................................127

1
CHAPTER 1
INTRODUCTION
The muscadine grape (Vitis rotundeflora) is a native to southeastern United States. Many
modifications in the cultivar have made these grapes resistant to pests and have increased their
phenolic content and yield. Muscadine grapes have significant amounts of resveratrol, a
compound in French red and white wines that is being touted as an agent for lowering cholesterol
levels and the risk of coronary heart disease. It has been reported that extracts from muscadine
grapes (phenolics and anthocyanins) were responsible for a 50% decrease in cancer cell
populations indicating that polyphenols from muscadine grapes may have anticancer properties
(Akoh and others 2005). There is high level of gallic acid, catechin, epicatechin, ellagic acid,
and resveratrol acid found in the skins and seeds of muscadine which gives it a high antioxidant
capacity. Antioxidants prevent or reduce destructive oxidation reactions. They protect the cell
components from the effect of free radicals which are formed as a result of cellular metabolism.
These free radicals are harmful to the body and can damage cell components. Antioxidants
scavenge these free radicals preventing destruction of cells and tissue. A number of components
contribute to the antioxidant capacity of muscadine grapes such as vitamins, phenols, carotenoids
and flavanols. As per Pastrana and others (2003) the maximum amount of phenolics in
Muscadine grapes is found in the seeds and skins. Baydar and others (2006) used grape seed
extracts from three varities and found them to be bacteriocidal against E. coli O157:H7, S aureus
and A hydrophila which indicates a potential use for extracts. Baydar and others (2007)
investigated grape extracts for prolonging shelf life of food grape extracts, they found these to be
2
alternative natural antioxidants to the synthetic antioxidants (BHA or BHT) used in food
industry.
The functional and organic foods market in the USA is currently estimated to be around
100 billion dollars (Source: http://www.nutraingredients-usa.com/). This includes
functional/fortified foods and beverages (38.6 bn $), vitamins, minerals, dietary supplements
(21.7 bn $) and organic and natural foods. In 2007 demand for dietary supplements increased at
the rate of 7 % whereas, demand for organic and natural foods and beverages increased at rate of
20 to 29%. As per report by Burdock and others (2006) the market for dietary supplements was
20.5 billion dollars.
Microencapsulation is a process in which very small pieces of the ingredients are
packaged in small capsules to facilitate their release later on. The capsule size can range in size
from microns to several millimeters. The ingredient release takes place by mechanical rupture of
capsule cell wall, dissolution of the cell wall or diffusion from the cell wall. By controlled
release of certain ingredients, manufacturers have the ability to: increase shelf life, enhance
flavor and quality, deliver functional ingredients, provide ingredient stability, improve health and
wellness, prevent ingredient interaction, improve the efficacy of active ingredients in
pharmaceutical applications, act as or facilitate delivery systems. Microencapsulation of the
functional ingredients here polyphenolic can help in protecting the antioxidants and help in their
use in other foods as additives or it can be sold as a dietary supplement. Microencapsulation
helps in creation of non sticky powders which are easy to handle and have longer shelf life than
without microencapsulation. Consumers are looking at functional foods as a means of
preventing or healing disease and creation of muscadine grape extract powder can help fill this
market gap and create revenue for farmers from by products.

3
Georgia is a large producer of muscadine grapes which is used to make jams, jellies,
juice, wine, etc. The press part of wine making is pomace and skin which has the maximum
amount of polyphenolic antioxidants. The press fraction is 40% of the weight of the total fruit.
There is an effort to develop products so that a producer can realize the benefits in terms of
dollars at farm level. Figure 1.1 illustrates various types of products which can be processed
from muscadine. The by-product of processing, pomace, can be used to make colorants,
ingredients, dried fruit and nut mixtures and nutraceuticals. The aim of the project was to use
muscadine grape pomace to make functional food additives (nutraceuticals) using
microencapsulation.
The main objectives of this study were to 1) microfilter extracts obtained from muscadine
pomace, 2) spray dry microfiltered extracts with and without microencapsulating agents, 3)
characterize microencapsulated powders, and 4) examine degradation of nutraceuticals from
microencapsulated powder made from muscadine grape extracts.

4
Fig 1.1: Choices for processed muscadine products (Morris and Brady 2004)
Juice and Pulp By-Products
Juice and Juice Concentrate
Wine
Vinegar
Bottled Juice
Sweet Spreads
Purees
Leathers
Pomace
Colorants
Ingredients
Dried Fruit and Nuts mixtures
Nutraceuticals
Seeds
Seed Extracts and Oils
Nutraceuticals
Value Added Alternatives for muscadines

5
REFERENCES
Akoh CC, Fischer J, Weiguang Y. 2005. Study of anticancer activities of muscadine grape
phenolics in vitro. J Agric & Food Chem 53:8804-8812.
Baydar N, Sagdic O, Ozkhan G, Cetin S. 2006. Determination of antibacterial effects and total
phenolic contents of grape (Vitis vinifera L.) seed extracts. Int J Food Sci & Technol 41:799-
804.
Baydar N, Ozkan G, Yasar S. 2007. Evaluation of the antiradical and antioxidant potential of
grape extracts. Food Control 18:1131-1136.
Burdock GA, Carabin IG, Griffiths JC. 2006. The importance of GRAS to the functional food
and nutraceutical industries. Toxicology 221:17-27.
Morris JR, Brady PL. 2004. The Muscadine experience: Adding value to enhance profits. 76p.
November 5 2008. Functional and organic foods drive $100bn health and wellness boom.
France. Available from http://www.nutraingredients-usa.com/Consumer-Trends/Functional-
and-organic-foods-drive-100bn-health-and-wellness-boom.
Pastrana-Bonilla AC, Sellappan S, Krewer G, Akoh CC. 2003. Phenolic content and antioxidant
capacity of muscadine grapes. J Agric & Food Chem 51:5497-5503.

6
CHAPTER 2
LITERATURE REVIEW
Muscadine grape
The muscadine grape (Vitis rotundifolia Michx) is found in the wild from Delaware to the
Gulf of Mexico and westward to Missouri, Kansas, Oklahoma, and Texas. The plant is sensitive
to temperature variations and is not grown in regions where temperatures frequently go below
10°F. There are many cultivars of muscadine grape such as Black Beauty, Black Fry, Darlene,
Fry, Higgins, Jumbo, Scuppernong, Sugargate, Summit, Supreme, Sweet Jenny, Carlos, Cowart,
Dixieland, Dixie Red, Fry Seedless, Magnolia, Nesbitt, Noble, Redgate, Regale, and Sterling
(California Rare Fruit Growers, Inc 1999).
Vitis rotundofolia
The three American species of the subgenera Muscadinia are V. rotundifolia found in
southern US, V. munsoniana found in central and southern Florida and V. popenoei in New
Mexico. Muscadine grapes are best suited for the southern states from eastern Texas to the
Atlantic seaboard. Vitis rotundofolia is commonly known as “muscadine”. Muscadine grapes are
found as small, loose clusters of large berries with a thick skin and dense pulp. The bronze
skinned varieties are known as scuppernongs. Cultivars in the rotundifolia species with the most
commercial importance are the Carlos, Noble and Magnolia. The muscadine grape is more
disease and pest resistant as compared to vinifera. The advantage of the V. labrusca and V.
rotundifolia are their resistance to fungal diseases and winter killing. The entire family of

7
phenols, phenolics, and tannins are referred to as polyphenols. Polyphenols or phenolic
compounds are categorized into two major categories, flavonoids and nonflavonoids. Flavonoids
are large polymer molecules involved with wine color and tannins. The various phenolic
compounds found in muscadine grapes are: gallic acid, 4 hydroxy benzoic acid, catechin, caffeic
acid, epicatechin, p-coumaric acid, ferulic acid, ellagic acid, resveratrol, myricitin, quercetin, and
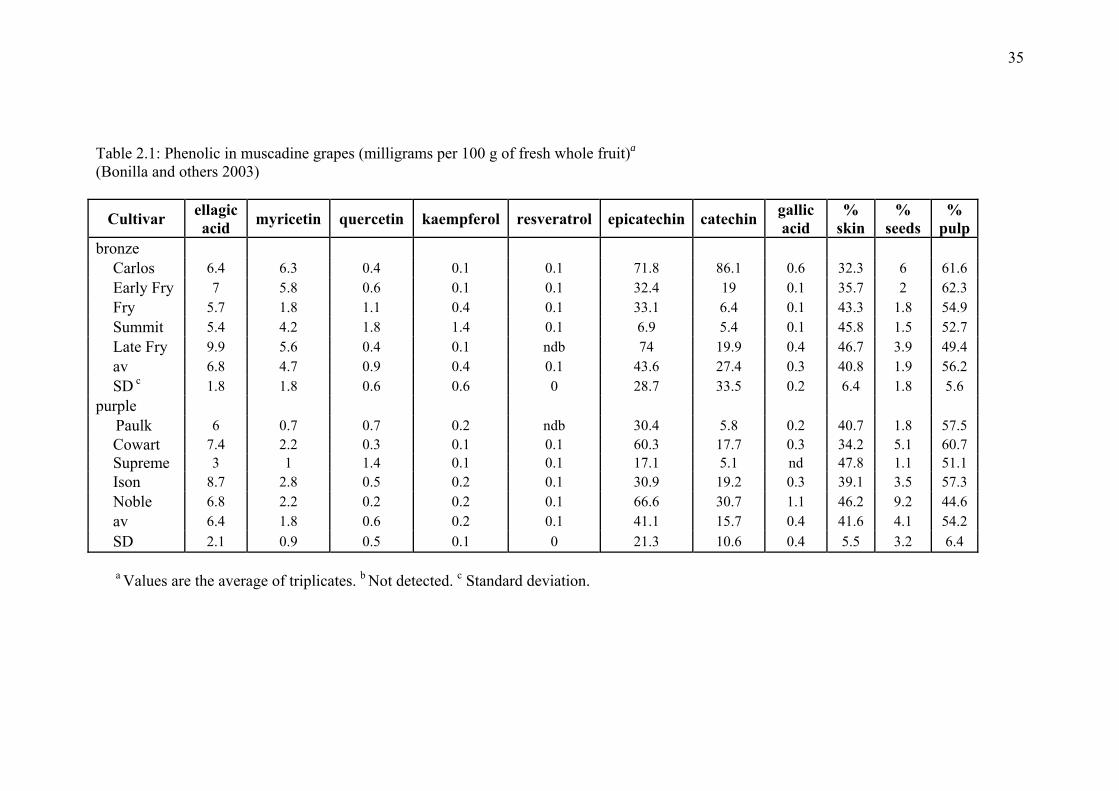
kaempferol. The highest concentration of phenolic compounds found in muscadine grapes are
gallic acid and Catechin (Table 2.1). The phenolics in muscadine grapes are shown in Table 2.1.
On the average, approximately 65% of grape polyphenols are found in the seeds; 22% in the
stems; 12% in the skins and only 1% in the pulp (Vine 2002). The weight of various muscadine
grape parts for several common cultivars is shown in Table 2.2. The polyphenol content of seeds
may range from 5 to 8% by weight (Polyphenolics Inc 2003).
Biological Importance of Wine and Grape Components
In 1991, 60 minutes CBS News presented a scientific report entitled “The French
Paradox” It showed epidemiological data that compared dietary intakes and disease incidences in
various countries including Britain, France, United States and others. Renaud and De Lorgeril
(1992) reported that red wine consumption offered a degree of protection from atherosclerosis
and cardiovascular diseases in the French population. The report revealed that according to the
MONICA (Monitoring of Trends and Determinants in Cardiovascular Disease) data, the French
population had lower death rates related to atherosclerosis. The death rates from the 13 coronary
vascular diseases (CVD) were much lower in the French population in spite of having dietary
food consumption patterns similar to that of many developed nations that had high incidences of
CVD. Coronary heart disease can be defined as atherosclerosis of the coronary arteries.
Atherosclerosis results in abnormally thickened regions called plaques on the vascular wall. As

8
plaques develop, they narrow the arteries and decrease blood supply, which causes damage to the
heart and brain. A clot may form on the abnormal surface of the plaque region and block the
artery. This may eventually lead to a heart attack or stroke (Stanley and Mazier 1999). Scientists
postulated that the polyphenolic compounds found in red wine acted as a source of dietary
antioxidants that reduced the risk associated with the development of CVD (Kinsella and others
1993). Studies have shown that high dietary intakes of cholesterol and saturated fats are directly
associated with risk factors related to the development of coronary heart disease (German and
Walzem 2000; De Lorimier 2000).
Numerous epidemiological studies have documented that a reduced risk of coronary
heart disease usually accompanies regular consumption of a moderate level of ethanol. It has
also been recently reported that ethanol consumption reduces the risk of development of adult
onset or Non Insulin Dependent Diabetes Mellitus (NIDDM) (Bisson and others 1995). In recent
years, understanding the “French Paradox” has stimulated new research interest to investigate
whether polyphenolic antioxidants may offer protective effects beyond the cardiovascular
system, and whether polyphenols from other botanical sources may similarly offer beneficial
effects to human health. Studies with resveratrol, an important component of grape polyphenols,
also show protective effects on neuron cell death induced by ethanol and other oxidative agents
(Sun and others 2002).
Functional Foods
Functional foods is a term that is usually applied to foods that have been modified or
combined in order to enhance the health benefits but may include any food that naturally
possesses components with demonstrable pharmacologic activity. The concept of functional
foods differs in different countries for historical, cultural and regulatory reasons. These foods

9
provide functions in addition to its nutritional value and help in enhancing the physiological and
cognitive functions of the human body. It is assumed that a functional food should be consumed
in a way a natural food ingredient is consumed in order for it to be considered a functional food
ingredient. If the ingredients are incorporated into pills, sachets, or other dosage forms they are
considered as dietary supplements or nutraceuticals. The International Life Sciences Institute of
North America (ILSI NA) defines such foods as those that provide a health benefit beyond basic
nutrition through the presence of physiologically active food components. Health Canada
considers functional foods as “similar in appearance to a conventional food, consumed as part of
the usual diet, with demonstrated physiological benefits, and/ or to reduce the risk of chronic
disease beyond nutritional functions.” The Institute of Medicine of the US National Academy of
Sciences defines it as “those in which the concentrations of one or more ingredients has been
manipulated or modified to enhance their contribution to a healthful diet”. There is an
increasing awareness of connection between diet and health and along with soaring health care
costs; both consumers and governments have great interest in capitalizing the benefits of
functional foods for health promotion. Though there is no standard definition of functional food
the guidelines state that it is a food which provides health benefits beyond that provided by basic
nutrition (Galland 2005). The various terms associated with functional foods and their
definitions are listed in Table 2.3. There is no universally accepted definition of functional foods
but considering their market value and bioactivity they could be placed between clinical foods
and pharmaceutical products as shown in fig 2.1 (Korhonen 2002).
Microencapsulation
Microencapsulation has been employed by the food industry and food scientists to
incorporate food ingredients in food systems for more than 60 years. Microencapsulation is

10
defined as the technology of packaging solids, liquids, or gases in miniature, sealed capsules that
can release their contents at controlled rates under specific conditions (Shahidi and Han 1993).
Shahidi and others (1993) said that the miniature packages called microcapsules may range in
diameter from a few micrometers to several millimeters.
The architecture of microencapsulation is generally divided into several arbitrary and
overlapping classifications (fig 2.2). One such is matrix encapsulation in which the wall is
surrounded by a structure of uniform thickness. There is a single core in each matrix wall. The
other is multicore encapsulation where a number of cores are encapsulated in the same matrix.
Microencapsulation is essential in the delivery of essential flavor oils (Porzio MA 2007).
For example: a dried herb ingredient that retains the color and flavor character of the fresh herb
can be prepared using a patented encapsulation process; a fruit-flavored dry drink mix requires
incorporating and stabilizing the volatile flavor chemical acetaldehyde as a “freshness” top note;
an injectable flavor oil with controlled-release properties for application in marinades usually
requires encapsulation in the form of a cross-linked complex coacervate that forms a membrane
to surround and protect the liquid flavor droplet; stable flavored vinegars to complement a
product line of flavor oils; a stable lemon-flavor powder for use in cake and pudding mixes can
be delivered in the form of β-cyclodextrin and lemon oil; thermally stable flavors; and flavor
masking .
Microencapsulation Techniques
There are several alternatives by which microencapsulation can be achieved which is
shown in Table 2.4; a brief description of each of these techniques is described below.

11
Spray Drying
Spray drying encapsulation technology has been used in food industry since late 1950 to
provide protection to oils against oxidation. Spray drying is the most commonly used
encapsulating technique in the food industry because it is economical; flexible; and produces
particles of good quality (Desai and Park 2005). In this method the material for encapsulation is
homogenized with the carrier material. The mixture is then fed into the spray dryer and
atomized with a nozzle or a spinning disc (fig 2.3). Water is evaporated by the hot air contacting
the atomized material. The microcapsules are then collected after they fall to the bottom of the
drier. The picture of spray dryer used in the study is shown in fig 2.4. The advantages and
disadvantages of spray drying are shown in Table 2.5 and spray drying parameters are shown in
Table 2.6 respectively.
Spray Cooling or Spray Chilling
Spray chilling or spray cooling is a variation of the normal spray drying process. In
spray cooling the coating material is some form of vegetable oil or its derivative. However a
wide range of other encapsulating materials may be used like fat and stearin with melting points
of 45-122°C (Desai and Park 2005). In spray-chilling the coating material is typically a
hydrogenated or fractionated vegetable oil with a melting point in the range of 32-42 °C (GEA
Process Engineering Inc).
Spray cooling finds applications in the chemical, food, and pharmaceutical industries. It
is a most convenient method of transforming melted feedstocks into free-flowing particulates of
controlled particle size.

12
Fluidized Bed Coating
Fluidized bed coating is being increasingly used by the food industry for the
encapsulation of the functional food ingredients. This process provides a wide variety of
encapsulated versions of food ingredients and additives. In this method solid particles are
suspended in a temperature and humidity controlled chamber of high-velocity air where the
coating material is atomized (Desai and others 2005). This technique is available for hot melt
coatings like hydrogenated vegetable oil, stearines, fatty acids and emulsifiers and waxes, or
solvent based coatings such as starches, gums, and maltodextrins.
Fluidized bed coating was developed by W.E. Wurster and hence the term “Wurster
process”. The different methods for fluidized bed coating are: 1) top spray, 2) bottom spray, and
3) tangential spray.
Fluidized bed technique is used to encapsulate nutritional substances such as vitamin C,
B vitamins, ferrous sulfate, ferrous fumarate, sodium ascorbate, potassium chloride, and a
variety of vitamin/mineral premixes. These encapsulated products are used as nutritional
supplements. In the case of bakery products, it is also used to encapsulate the leavening
ingredients, as well as vitamin C, acetic acid, lactic acid, potassium sorbate, sorbic acid, calcium
propionate, and salt. In the meat industry several food acids have been fluid-bed encapsulated to
develop color and flavor systems. They are also used to achieve a reproducible pH in cured
meat products and to shorten their processing time. Fluid-bed encapsulated salt is used in meats
to prevent development of rancidity, as well as premature set due to myofibrilar binding
(Dewettinck and Huyghebaert 1999).

13
Extrusion
Extrusion, as it is applied to flavor encapsulation, is a relatively low temperature
entrapping method, which involves forcing a core material in a molten carbohydrate mass
through a series of dies into a bath of dehydrating liquid. The pressure and temperatures used
are <100 psi and 115°C, respectively. The coating material hardens on contacting the liquids,
forming an encapsulating matrix to entrap the core material. Then the extruded filaments are
separated from the liquid bath, dried, and sized (Desai and others 2005).
The primary benefit of this method is that the material is completely surrounded by the
wall material (true encapsulation), and any residual oil or core material is removed from the
surface in an alcohol bath. This method provides excellent stability to oxidation and prolongs
the shelf life of the product by 1-2 years without any substantial quality degradation. This
method may be also classified as a glass encapsulation system or a controlled-release system,
depending on the polymeric substances used (Desai and others 2005).
Centrifugal Extrusion
Centrifugal extrusion is a liquid co-extrusion process utilizing nozzles consisting of
concentric orifices located on the outer circumference of a rotating cylinder (head). The
encapsulating cylinder or head consists of a concentric feed tube through which coating and core
materials are pumped separately to the many nozzles mounted on the outer surface of the device.
While the core material passes through the center tube, coating material passes through the outer
tube. The entire device is attached to a rotating device such that the head rotates around its
vertical axis. Centrifugal force impels the rod outward, causing it to break into tiny particles.
By the action of surface tension the coating material envelopes the core material. Centrifugal

14
extrusion has been used to encapsulate flavorings, seasoning, and vitamins (Desai and others
2005).
Lyophilization
Lyophilization or freeze drying is a process which has been utilized for the dehydration
of freeze dried aromas. It has a disadvantage in that it requires a long time for freeze drying (up
to 20 hrs). Freeze drying is a costly operation but can be for encapsulating high value
ingredients. Heinzelmann and Franke (1999) showed that the production of dried
microencapsulated fish oil by freezing and subsequent freeze drying resulted in product with
good resistance to oxidation. The retention of volatile components during freeze drying is
dependent on the nature of the system.
Coacervation
Coacervation consists of separation of a liquid phase of coating material from a
polymeric solution followed by the coating of that phase as a uniform layer around suspended
core particles. The coating is then solidified. The batch type process consists of three stages:
1. Formation of a three-immiscible chemical phase
2. Deposition of the coating
3. Solidification of the coating
A large number of coating materials have been evaluated for coacervation like
gelatin/gum acacia system, gliadin, heparin/gelatin, carrageenan, chitosan, soy protein, polyvinyl
alcohol, gelatin/carboxymethycellulose, β-lactoglobulin/gum acacia, and guar gum/dextran
(Desai and others 2005). The coacervation method has some drawbacks in that it is expensive
and complex and the cross linking of the wall material usually involves glutaraldehyde which

15
must be carefully controlled and used per the country’s legislation. The problems related to
harmful chemical cross-linkers could be solved by using enzymatic cross-linkers.
Centrifugal Suspension Separation
Centrifugal suspension is a more recent microencapsulation process which involves
mixing the core and the wall materials and then adding to a rotating disk. It is used for foods
that are sensitive or readily absorb moisture like aspartame, vitamins, or methionine (Desai and
others 2005).
Co-crystallization
Co-crystallization is a new method which utilizes sucrose as a coating material for
encapsulation of the core materials. The sucrose syrup is concentrated to a supersaturated state
and then maintained at a high enough temperature to prevent crystallization. A predetermined
amount of core is then added to the syrup and then agitation is continued vigorously for the
sucrose mixture to crystallize. As the syrup reaches the temperature at which transformation and
crystallization takes place, a large amount of heat is liberated. Agitation is continued in order to
promote and extend transformation/crystallization until the agglomerates are discharged from the
vessel. The encapsulated products are then dried to the desired moisture and screened to a
uniform size, which are required to control the rate of nucleation and crystallization as well as
the thermal balance during various phases (Desai and others 2005).
The advantage of this technique is that it can be used to achieve particle drying. Products
offer direct tableting characteristics because of their agglomerated structure and therefore offer
significant advantages to the candy and the pharmaceutical industries.
16
Liposome Entrapment
Liposomes consist of an aqueous phase that is completely surrounded by a phospholipid-
based membrane. When phospholipids such as lecithin are dispersed in an aqueous phase, the
liposomes form spontaneously. Liposomes have been used for the delivery of vaccines,
hormones, enzymes and vitamins. As per study carried out by Kheader and others (2000),
liposome entrapped enzymes could be used for flavor entrapment in cheese and accelerated
flavor development to prevent the problems associated with use of free enzymes. The main
issues for liposome encapsulation for food industry are the scaling up of the microencapsulation
process at an acceptable cost in use levels and delivery form of the liposome encapsulated
ingredients.
Inclusion Complexation
Molecular inclusion is another means of achieving encapsulation. It takes place at a
molecular level and β-cyclodextrin is used as the encapsulating medium. β-cyclodextrin is a
cyclic derivative of starch made up of seven glucopyranose units. They are partially prepared
from starch by an enzymatic process. The outer part of β-cyclodextrin is hydrophilic while the
interior part is hydrophobic. The guest molecules can be entrapped in the apolar internal cavity
which is 0.65nm in diameter which permits inclusion of essential oil compounds and can take
one or more flavor volatile molecules (Desai and others 2005). There are three methods of
inclusion complexation using β-cyclodextrin, flavor molecule and water. It has been found that
the one using less water leads to better entrapment of flavor molecules.
Coating Materials
There are a variety of coating materials available in the market for coating of flavors,
light sensitive materials, antioxidants against degradation by environment. Various materials

17
commonly used for coating functional food additives is given in Table 2.7. Here are a few
criteria for selecting the ideal coating materials listed by Shahidi and Han (1993).
• Functionality that the encapsulated ingredients provide to the final product.
• The type of coating material to be selected from the large variety available.
• Processing conditions the encapsulated ingredient must survive before
releasing its contents.
• The optimum concentration of the active material in the microcapsule.
• Mechanism by which the ingredient be released from the microcapsule.
• The particle size, density, and stability requirements for the encapsulated
ingredients.
• The cost constraints of the encapsulated ingredients.
There is a direct relationship between homogenization degree and retention of oil during
spray drying. Therefore, it appears advantageous to efficiently homogenize the feed material.
Water soluble materials may be encapsulated by homogenization. There is no clear boundary
between the core and the coating here and we have a homogenous blended matrix of the
material. Following is a brief description of some of the commonly used coating materials.
Gum Arabic
Gum Arabic, a natural gum also called gum acacia, is a substance obtained from two sub-
Saharan species of the acacia tree, Acacia senegal and Acacia seyal. It is used primarily in the
food industry as a stabilizer, but has had more varied uses in the past, including viscosity control
in inks. Analytical data for gum obtained from acacia Senegal is in Table 2.8 (Verbeken and
others 2003). Its E number (E numbers are number codes for food additives and are usually
found on food labels throughout the European Union) is E-414.

18
The gum produced by the trees in question reseals the plant's bark in the event of damage
- a process called gummosis. Gum arabic is a complex mixture of saccharides and
glycoproteins, which gives it one of its most useful properties: it is completely edible. As
compared to other chemicals Acacia Gum is resistant to various physico-chemical conditions
(especially acidic conditions). This makes it a good choice for microencapsulation of muscadine
grape juice having an acidic pH. It was used for microencapsulation of camu-camu (Myrciaria
dubia) juice by Taxi and others (2003) by spray drying, using gum arabic as the coating material,
the optimum conditions for juice yield and Vitamin C retention were established as 15% wall
material; air entry temperature of 150°C; resulting in a yield of more than 24% and vitamin C
retention of 6%. Gum arabic used in food has to be in accordance with FDA code of federal
regulations as shown in Table 2.9 (Verbeken and others 2003). The structure of gum arabic is
shown in fig 2.5. Gum arabic is composed of several simple sugars, galactose, arabinose,
rhamnose, and glucuronic acids as well as a protein fraction which play an important role in its
stability. Gum arabic is an effective encapsulating agent because of its high water solubility, low
viscosity and emulsification properties. It is used in soup and dessert mixes.
Pectin
Pectins are groups of polysaccharides occurring in the cell walls and intercellular layers
of all land plants. Native pectin is a mixture of polysaccharides, with the major component a
polymer of α-D-galacturonic acid, mainly as the methyl ester and often with some acetyl groups
on the hydroxyls at C-2, although some may be on the C-3 hydroxyls. The chemical structure of
pectin is shown in fig 2.6. Aqueous solutions of commercial pectin of 2-3% concentration may
be easily prepared in warm or hot water. Pectin along with glucose syrup was used to
microencapsulate fish oil rich in polyunsaturated fatty acids (Drusch 2006). Physicochemical

19
parameters like particle morphology, particle size and extractable fat generally represent good
microencapsulation efficiency and therefore indicate a good oxidative stability.
Starch
Starch is a carbohydrate that is found in the stems, leaves, fruits, roots of higher plants.
Starch functions as the main storage or reserve form of carbohydrate and is second only to
cellulose as a reserve form of carbohydrate. Starch is isolated commercially from cereal grain
seeds, roots and tubers and stems and pith.
Structure and architecture
Starch which is a polymer of glucose is an alpha-glucan predominantly containing alpha-
1, 4-glucosidic linkages with a relatively small amount of alpha-1, 6-glucosidic linkages forming
branch points. Two major compounds present in starch are amylase and amylopectin. The
structure of starch is shown in fig 2.7.
Microencapsulation
Starch based wall material is commonly for extrusion and spray drying. Starch cannot be
used alone for microencapsulation due to its lack of emulsifying capacity except in case of
encapsulating water soluble substances. Starch along with other wall materials such as protein is
used for encapsulating vitamins, flavors and oils (Forssell and others 2004).
Proteins
Proteins play several important roles in biological and food systems. Some of these
include biocatalysts (enzymes), structural components of cells and organs (e.g., collagen, keratin,
elastin, etc.), contractile proteins (actin, myosin, tubulin), hormones (insulin, growth factor, etc.),
transport proteins (serum albumin, transferrin, hemoglobin), metal chelation (phosvitin, ferritin),
antibodies (immunoglobulin’s), protective proteins (toxins, and allergens), and storage proteins
20
(seed proteins, casein micelles, egg albumen) as nitrogen and energy source for embryos
(Damodaran and Paraf 1997).
Proteins are the major constituents of the food and they perform several critical functions
in food that include thickening, gelation, emulsification, foaming, texturization, water binding,
adhesion and cohesion, and lipid and flavor binding and retention. The properties of proteins are
also affected by their structural states in the foods. Proteins are made up of amino acids -
essential and non essential amino acids. It is essential to take the essential amino acids in our
diet as the body cannot synthesize them like isoleucine, leucine, lysine, etc. Proteins have many
other functions in the body such as enzymatic catalysts, used as transport molecules and storage
molecules, needed for mechanical support (skin and bone containing collagen- a fibrous protein).
Whey proteins
Whey from the cheese industry is obtained in two stages: 1) Soft whey which is obtained
from the rennet coagulation of milk 2) Acid whey obtained from fresh soft cheese production.
Whey proteins consist of a mixture of several diverse proteins which are responsible for its
diverse functional properties. The main proteins are ß-lactoglobulin and α-lactalbumin which are
70% of the proteins and are responsible for the hydration, gelling and surface active properties
(emulsifying and foaming properties) of the whey protein ingredients. The uses of whey proteins
in food industry are listed in Table 2.10.
Whey Protein Isolate+Lactose
Whey protein isolate (WPI) or soy protein isolate (SPI) in combination with dried
glucose syrup (DGS) were tested for stabilization of microencapsulated spray-dried emulsions
containing tuna oil, palm stearin, or a tuna oil-palm stearin blend (Augustin and others 2006).
Pre-emulsions containing heated (100°C/30 min) protein-DGS mixtures and oils at oil/protein

21
ratios of 0.75:1 to 4.5:1 were homogenized at two passes (35+10 or 18+8 MPa) and spray-dried
to produce 20-60% oil powders. Powder containing Palm Stearin was more stable to oxidation
than powder containing 1:1 ratio of palm stearin and tuna oil or tuna oil only. Heated WPI-DGS
formulations were superior to corresponding formulations made up of SPI-DGS, producing
spray-dried powders with higher micro encapsulation efficiency and superior oxidative stability.
Beristain and others (2004) microencapsulated conjugated linoleic acid (CLA) as free
acid using whey protein concentrate (WPC) as a wall material. The encapsulation efficiency was
89.6% and surface oil concentration was 1.77 g/100 g of sample. Microcapsules stored at
aw=0.743-0.898 had good stability against oxidation so WPC is considered as an effective
microencapsulating agent.
Analytical testing Quantification of polyphenolics
There are numerous spectrophotometric methods available for quantification of
polyphenolic compounds. These methods are based on different principles and are specific for
different functional groups.
Spectrophotometric assays
The Folin-Denis Assay is the most widely used assay for total phenolic. The principle of
this assay is reduction of phosphomolybdic-phosphotungstic acid (Folin Denis) to a blue colored
compound by polyphenol compounds. Most of the researchers have used Folin-Ciocalteaux
method (Singleton 1965) which is based on the same principle as above. The Folin-Ciocalteau
reagent gives greater color than Folin-Denis reagent with all phenols and particularly the less
responsive ones, but it also gave slightly less color in proportion to that from Folin-Denis for the
possibly interfering reductants ascorbic acid, ferrous ion, and sulfur dioxide. These effects are
attributed to the relatively high content of active oxidant in the Folin-Ciocalteau preparation

22
which promotes the more complete oxidation measurement of the slowly reacting phenols. The
interfering substances are less limited to alkaline reaction conditions and are more easily
oxidized than some phenols, which probably explain their disproportionate reaction with the
weaker Folin-Denis reagent.
Giusti (2001) used the pH differential method to determine total anthocyanins. The
principle of this method is dependent on the structural changes of anthocyanins due to pH
change. It is observed that colored oxonium and colorless hemiketal form dominate at pH of 1.0
and 4.5, respectively. The absorbance of the solution is measured at two different wavelengths
(510 and 700nm). The monomeric anthocyanin pigments is calculated as follows
Absdiff = [A510 – A700] pH1.0 – [A510 – A700] pH4.5
Monomeric anthocyanins pigment (mg/L) = (A × MW × DF × 1000)/(e × 1) Where MW = molecular weight of cyanidin–3 glucoside (449.2).
e = molar absorptivity (26,900) DF = dilution factor A = Absdiff
The other methods for determination of antioxidants are FRAP (Ferric Reducing
Antioxidant Power), ORAC (Oxygen Radical Absorbance Capacity), TEAC (Trolox Equivalent
Antioxidant Capacity), HPLC (High Performance Liquid Chromatography).
Microencapsulation Efficiency
Microencapsulation efficiency is defined as the proportion of core that could not be
extracted by the solvent under test conditions (Young and others 1993).. The retention of core
material and final content of core in the dry microcapsules is of great practical significance and
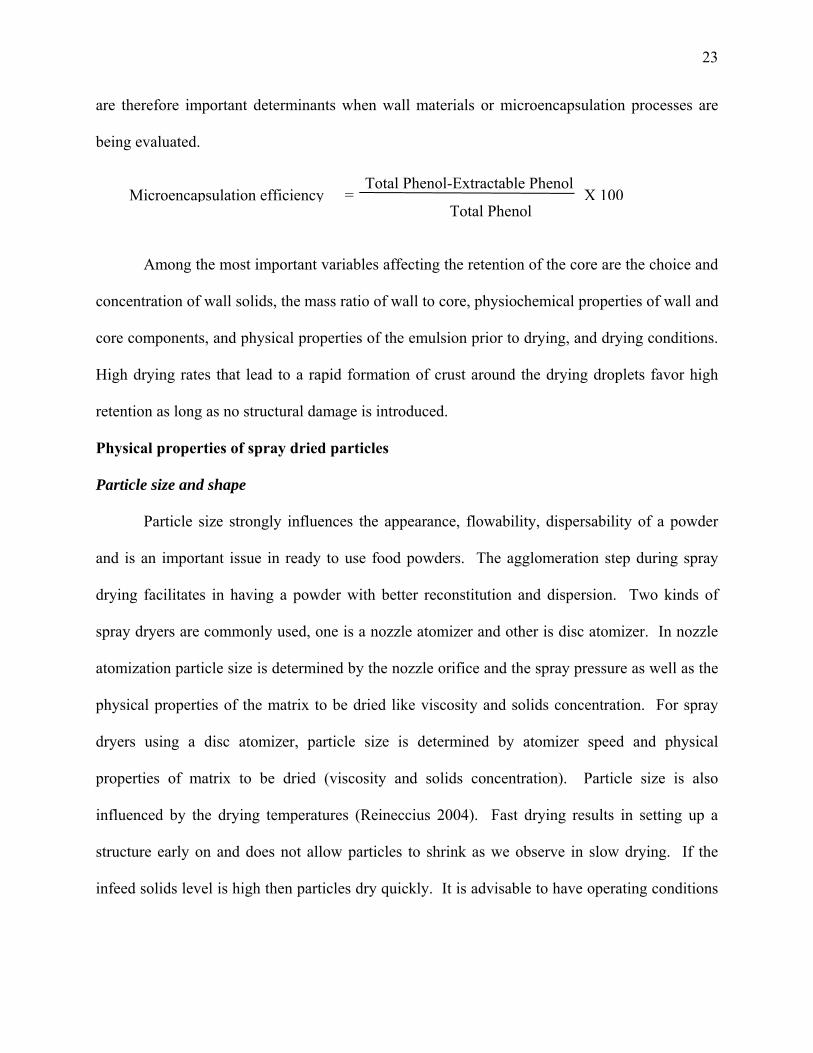
23
are therefore important determinants when wall materials or microencapsulation processes are
being evaluated.
Among the most important variables affecting the retention of the core are the choice and
concentration of wall solids, the mass ratio of wall to core, physiochemical properties of wall and
core components, and physical properties of the emulsion prior to drying, and drying conditions.
High drying rates that lead to a rapid formation of crust around the drying droplets favor high
retention as long as no structural damage is introduced.
Physical properties of spray dried particles
Particle size and shape
Particle size strongly influences the appearance, flowability, dispersability of a powder
and is an important issue in ready to use food powders. The agglomeration step during spray
drying facilitates in having a powder with better reconstitution and dispersion. Two kinds of
spray dryers are commonly used, one is a nozzle atomizer and other is disc atomizer. In nozzle
atomization particle size is determined by the nozzle orifice and the spray pressure as well as the
physical properties of the matrix to be dried like viscosity and solids concentration. For spray
dryers using a disc atomizer, particle size is determined by atomizer speed and physical
properties of matrix to be dried (viscosity and solids concentration). Particle size is also
influenced by the drying temperatures (Reineccius 2004). Fast drying results in setting up a
structure early on and does not allow particles to shrink as we observe in slow drying. If the
infeed solids level is high then particles dry quickly. It is advisable to have operating conditions
Total Phenol-Extractable Phenol = X 100Microencapsulation efficiency
Total Phenol
24
setup so as to obtain spherical particles because they have better aroma retention, high bulk
densities and best flow ability.
Absolute and bulk densities
Absolute density is defined as the weight of a given particle volume of powder while
bulk density is defined as the weight of a given total volume of powder. Absolute density is
determined by He pycnometry and considers volume of particles not permeable to displacing
gas. Bulk density may be determined by taking a given weight of powder, filling it in graduated
cylinder and tapping it a fixed number of times or until it reaches a fixed volume (Reineccius
2004). Absolute density is primarily influenced by amount of entrapped air in the powder matrix
during atomization process, steam formation in particle during drying, drying air temperature,
particle size, atomization conditions and infeed matrix. Higher feed solids content increases
particle absolute density. Bulk density is important in packaging and shipping as it is an
indication of how much product will fill in a package and determines the packing and shipping
cost.
Flowability
Flowability is an important characteristic in the processing and packing operation as it
effects powder performance. For measuring flowability one can allow the powder to flow
through the funnel and measure the angle of the powder pile above horizontal also known as the
angle of repose (Reineccius 2004). A smaller angle of repose is desirable to have better
flowability.
Dispersability
Dispersability is important in the manufacture or final reconstitution of powder.
Generally dispersability is primarily influenced by particle size, density and the carrier matrix;

25
low density powder particles are difficult to disperse (Reineccius 2004). The problem of
dispersability can be overcome by instantizing the process whereby you rewet the powder in the
fluidized bed and allow the powder to agglomerate and redry.
Structural Strength
Structural strength assumes importance when dry blending of powders with salt or sugar
or when the active material of a microcapsule is a liquid or soft paste. The dry blending process
is very abrasive and will crack or damage powders high in liquid actives or those that are low in
density (Reineccius 2004). Usually it is advisable to have 20% core when spray drying flavor
ingredients as higher core ratios usually lead to loss of flavor and the particle may lose structural
strength and break (Reineccius 2004).
Filtration
Filtration is the process of separating two or more components in a fluid stream or
passing a mixture of a fluid containing suspended or dissolved solids through a porous medium
that entraps a portion of the solids in its matrix or retains them on its surface (dead-ended
filtration) or rejects the solids and allows them to continue along with a circulating feed stream
(cross-flow filtration) (LCI Corporation 2006).
Often the filtration process is used to clarify or purify the material passing through the
barrier and other times the filter barrier is used to collect or concentrate the material that does not
pass through; the recovery of enzymes or the washing of modified starch in wet corn milling are
good examples.

26
Membrane Filtration
Membrane separation systems are used for a wide variety of applications in a broad
cross-section of industries, including power, waste treatment, textile, grain, food and beverage,
pharmaceutical, biotechnology and many others.
The membrane’s function is to separate or reject particles of various sizes. Depending
upon the intended use, membranes may be produced in many different configurations: cartridges,
plate and frame devices, tubes, disks, etc. Commonly used membrane substrate materials
include polymeric compounds such as polysulfone, TFE fluorocarbon, polyamide, polyethylene
and polyacrylonitrile. Cellulose acetate is also used, as are certain ceramics, carbon and stainless
steel.
Scepter Membrane system
The Scepter system has a porous stainless steel tube of 1 inch diameter at its heart. These
tubes may be used singly for small scale applications or for pilot systems. Scepter’s tubular
filtration technology, combined with the process compatibility, stainless steel construction,
allows processing of a wide variety of streams, including dirty and/ or hostile fluids, over a broad
range of chemical conditions, pressures and temperatures. When used in cross-flow mode, the
rugged large-diameter tubes allow for high velocity in the tubes even with very dirty (having
high solids content) process fluids. This maximizes “sweeping” action at the membrane surface
and minimizes foulant buildup (LCI Corporation 2006). The large diameter tubes also give the
Scepter cross-flow systems the ability to handle extremely viscous process feeds (up to 100,000
centipoises), and complex mixtures of solutes and suspended particles (up to 50%, depending on
the fluid).

27
Scales of Membrane Filtration
Depending on their performance characteristics, particularly their nominal pore size,
membranes used in cross-flow filtration devices are placed in one of the four categories;
microfiltration (MF), ultra filtration (UF), nanofiltration (NF) or reverse osmosis (RO). Because
of the barrier surface formed by the rejected material, referred to as a polarized layer, boundary
layer, or gel layer and the “parallel to pore” flow, cross-flow filters often reject particles smaller
than the nominal opening in the filter media (LCI Corporation 2006).
Microfiltration
Microfiltration (MF) is used to separate suspended solids from dissolved substances in a
process stream, or to concentrate fine colloidal suspensions. Microfiltration membranes are the
most open of the four membrane filtration categories. Generally MF membranes separate or
reject particles from about 0.05-0.1 micron to about 1 micron. On a molecular weight basis,
these membranes can separate/reject macromolecules in the 100,000 to 500,000 MW ranges.
Water, dissolved solids, and macromolecules generally less than 100,000 MW can pass through
the membrane (LCI Corporation 2006).
The separation mechanism of microfiltration is commonly attributed to geometry; i.e.,
passage through the membrane is a function of particle size relative to opening or pore
dimensions of the membrane.
Cross-flow filtration devices using MF membranes usually operate at low trans-
membrane pressure (the pressure difference from one side of the membrane and the other), 0.7 to
3.4 bar (10 to 50 psig), to limit flow through the membrane. Increasing flow initially increases
flow through the membrane; however, because of mass transfer phenomena, higher pressures do
not result in increasing permeate flow. It is possible to influence this plateau by intensifying the

28
sweeping action by increasing the cross-flow velocity. The microfiltration unit being used
rejects particles anywhere in the range of 0.05-0.1 micron range.
There are three basic configurations used in commercial applications of cross-flow
microfiltration: single-pass, batch and feed and bleed (fig 2.8).
I. Single –Pass Operation
In the single-pass configuration, the feed is pumped through the membrane unit and the
retentate is collected or fed to a subsequent processing step. This is the simplest process
configuration, and it can be used for both batch and continuous processing (Zemen and Zydney
(1996). The single-pass system is used extensively for the reverse osmosis where the products
permeate (pure water) and retentate which is of low economic value is easily disposed of.
II. Batch
In batch filtration process, the entire retentate stream is recycled back to a single large
feed tank, allowing the permeate removal per pass to be dramatically smaller than in a single-
pass system. The concentration of the retained solutes/particles in the feed tank increases with
time as permeate is removed, causing a continual decline in filtrate flux due to the increase in the
bulk solute concentration (Zemen and Zydney 1996). This processing protocol will be used in
current operation.
III. Feed-and-Bleed
The feed-and-bleed configuration is used in almost all large-scale continuous membrane
processes. Part of the retentate stream is recycled back to the unit to obtain the desired flow rate,
Q, and thus the desired mass transfer coefficient, k0. The rest of the retentate is continuously fed
to any subsequent processing steps or to an appropriate holding tank. The membrane area
required for feed-and-bleed configuration is about three times that required for batch filtration.

29
The very large membrane required for feed-and-bleed configuration is due to the fact that the
entire system operates at the final Retentate concentration, corresponding to the lowest filtrate
flux, throughout the filtration. In contrast, the batch filtration begins at a relatively low bulk
solute concentration, and thus at a relatively high filtrate flux, and only attains the final bulk
concentration towards the end of the process (Zemen and Zydney 1996).
Extraction Processes and Technologies for Phenolics from Plant Material
During the extraction process, the solvent used for extraction is mixed with the plant
material. The extraction is completed by addition of solvent to the sample and this extract has to
be completely dried to powder form. After the solvent has been added SFE (Supercritical fluid
Extraction) can be used to obtain the powder without final drying or spray drying can be used.
There are various methods for extraction and concentration of polyphenolic compounds from
plant material (Nawaz and others 2001) such as:
1. Solvent Extraction
a. Hexane and methanol
b. Ethanol and benzene
c. Hot water
d. Water and ethanol
e. Water and methanol
f. Ethyl acetate and water
g. Sulfur dioxide and water
2. Microwave-assisted extraction
3. Polyphenolic Concentration and Purification by Membrane Technology
4. Polyphenol Concentration by Evaporation and Drying

30
Membrane extraction of polyphenolics
Zaid and others (2006) carried out nanofiltration on apple juice concentrate using size 1
and 0.25 kDa molecular weight cut-off (MWCO) spiral wound membranes. For the 1 kDa
MWCO membrane, the concentration of polyphenolic on the retentate side increased by a factor
of up to 4 and the sugar concentration increased by 1.5 times. When nanofiltration was
performed on permeate collected using 0.25 kDa membrane the concentration of phenolic
compounds increased by a factor of 2 on retentate side. This indicates that membrane separation
is an efficient and cost effective technology to separate phenolics from fruit juice to be used as a
functional ingredient.
Nawaz and others (2006) used a solvent extraction method utilizing 50% ethanol and
50% water as solvent when ultrafiltration was used for the extraction of polyphenols from grape
seeds. With the concentration step of UF the procedure led to high extraction rates, shorter
extraction time and significant labor savings.
Velic and others (2007) used different solid-liquid ratio, four particle sizes and different
temperatures to check extraction kinetics of polyphenols from grape seeds. Temperature, solid–
liquid ratio and milling degree had a positive influence on extraction rate and extent of
extraction. The amount of total polyphenols extracted was 1.47-6.68% per dry matter of grape
seeds in 200 minutes.
Kammerer and others (2005) used enzymatic hydrolysis of grape skins, using
pectinolytic and cellulotic enzymes, enzyme-substrate ratio and time temperature regime. It was
observed that the extraction of polyphenols was increased by treatment of pomace with hot water
and cell wall degrading enzymes.

31
Rektor and others (2004) used membrane filtration for must preservation and
concentration. They used microfiltration and reverse osmosis on white and red grape juice
samples which gave a concentrate with high sugar content.
Spigno and others (2007) performed extraction of polyphenolics from grape marc with
different concentrations of solvent (ethanol), different temperatures and different extraction
temperatures. They found that phenols content increased for water content of ethanol from 10 to
30%, remained constant from 30 to 60% water and started decreasing after 50%. The extraction
rate at 60°C was higher compared to 45°C.
Vaillant and others (2005) clarified melon juice from fruits discarded by exporters and
concentrated it using osmotic evaporation (OE). This integrated membrane process helped in
obtaining two valuable products: a clarified concentrate of melon juice which had not undergone
any thermal treatment and a retentate rich in provitamin A.
Usually ethanol and water as solvents are considered to be safe for human consumption.
The present work will use water as solvent and enzyme (pectinase) for extraction of
polyphenolic compounds from grape pomace. It will use membrane filtration for concentration
of phenolics from muscadine pomace.
Sample Storage for Shelf Life Determination
Shelf life is a multifaceted property that is important to the food processors and
manufacturers as well as the consumers. Shelf life is defined as (IFST 1993) “the period of time
during which the food product will
a. Remain safe.
b. Be certain to retain its desired sensory, chemical, physical, microbiological and
functional characteristics.

32
c. Where appropriate, comply with any label declaration of nutrition data, when
stored under the recommended conditions”.
In physical chemistry, chemical kinetics or reaction kinetics is the study of reaction rates
in a chemical/biochemical reaction. Analyzing the influence of different reaction conditions on
the reaction rate gives information about the reaction mechanism and the transition state of a
chemical reaction and thus can depict quality changes in foods.
Kinetics deals with experimental determination of reaction rates from which a rate law
and reaction rate constant are derived. Essential rate laws exist for zero order reactions (for
which reaction rates are independent of initial concentration), first order reactions, second order
reactions and can be derived for others through calculus. In consecutive reactions, the rate-
determining step often determines the kinetics. In consecutive first order reactions, a steady state
approximation can simplify the rate law. The activation energy for a reaction is experimentally
determined through the Arrhenius equation and the Eyring equation. The main factors that
influence the reaction rate include: the physical state (solid, liquid, gas) of the reactants, the
concentrations of the reactants, the temperature at which the reaction occurs, and whether or not
any catalysts (enzymes) are present in the reaction.
The rate of food quality change may be expressed as a combination of composition and
environmental factors (Saguy and Karel 1980):
DQ/dt =F (Ci, Ej)
where Ci are compositional factors such as concentration of reactive compounds, inorganic
catalysts, enzymes, reaction inhibitors, pH, water activity and microbial activity and Ej are
environmental factors like temperature, relative humidity, total and partial pressure of gases,
light and mechanical stress.

33
Kinetic studies on the degradation of beetroot pigment encapsulated in three different
polymer matrices (pullulan and two maltodextrin samples) were carried out by Serris and
Biliaderis (2001) under different water activity and storage temperatures. The highest amount of
rate constants for degradation of pigments were observed at intermediate water activity level
(aw=0.64) for all matrices and all three storage temperatures studied. The reaction rates (K)
increased with increase in temperature. This trend can be explained by the fact that the
degradation reaction is controlled by the mobility of the reactants. This was also observed by
Tandale (2007) which led to selecting aw of 0.64 instead of using multiple water activities. The
photodegradation of phenol was studied by Maleki and others (2006) in a batch reactor
configuration illuminated with a 400 W medium pressure mercury lamp. The effects of
parameters such as pH, kinetic constants and initial phenol concentration on the photolytic
degradation and toxicity assay were studied. The experimental results showed that lower pH and
lower concentration of phenols favor the phenol degradation. The disappearance of phenol in
each case approximately followed first-order kinetics with the apparent first-order decay constant
increasing with decreasing solute concentration. Kowska and others (2004) studied the effects of
UV irradiation, temperature and storage on the stability of anthocyanins copigment complexes.
They reported an increase in copigmentation with copigment content, and a decrease in the
stability of copigment complexes (greater than heating at 80 C). Direct sunlight has a negative
effect on copigment complexes. These studies indicated that phenol is degraded by light
exposure which led to choosing of UV light conditions in experiment.
The majority of reactions that have been studied are pseudo-zero order or pseudo-first
order reactions (Labuza 1984). Some examples of zero and first order reactions are shown in the
Table 2.11. To determine the reaction order one assumes different values of m (0, 1 or other)

34
and tries out a graphical or a least square linear fit to the corresponding equations (Table 2.12) of
the experimental data. If the experiment has been carried out to at least 50% conversion or
preferably 75%, it is easy to determine which reaction order and equation gives the best fit, either
graphically or using statistical goodness. The coefficient of determination (R2) is often a useful
criterion. Once the apparent order of the quality deterioration reaction has been decided, further
statistical analysis and statistical evaluation of the parameter k, the rate constant is required, to
get an estimate of the error in the determination of k (Labuza and Saguy 1997). If a linear
regression is used to estimate the parameters, their 95% estimation can be obtained using the
student t distribution.
35
Table 2.1: Phenolic in muscadine grapes (milligrams per 100 g of fresh whole fruit)a
(Bonilla and others 2003)
Cultivar ellagic acid myricetin quercetin kaempferol resveratrol epicatechin catechin gallic
acid %
skin %
seeds %
pulpbronze
Carlos 6.4 6.3 0.4 0.1 0.1 71.8 86.1 0.6 32.3 6 61.6 Early Fry 7 5.8 0.6 0.1 0.1 32.4 19 0.1 35.7 2 62.3 Fry 5.7 1.8 1.1 0.4 0.1 33.1 6.4 0.1 43.3 1.8 54.9 Summit 5.4 4.2 1.8 1.4 0.1 6.9 5.4 0.1 45.8 1.5 52.7 Late Fry 9.9 5.6 0.4 0.1 ndb 74 19.9 0.4 46.7 3.9 49.4 av 6.8 4.7 0.9 0.4 0.1 43.6 27.4 0.3 40.8 1.9 56.2 SD c 1.8 1.8 0.6 0.6 0 28.7 33.5 0.2 6.4 1.8 5.6
purple Paulk 6 0.7 0.7 0.2 ndb 30.4 5.8 0.2 40.7 1.8 57.5
Cowart 7.4 2.2 0.3 0.1 0.1 60.3 17.7 0.3 34.2 5.1 60.7 Supreme 3 1 1.4 0.1 0.1 17.1 5.1 nd 47.8 1.1 51.1 Ison 8.7 2.8 0.5 0.2 0.1 30.9 19.2 0.3 39.1 3.5 57.3 Noble 6.8 2.2 0.2 0.2 0.1 66.6 30.7 1.1 46.2 9.2 44.6 av 6.4 1.8 0.6 0.2 0.1 41.1 15.7 0.4 41.6 4.1 54.2 SD 2.1 0.9 0.5 0.1 0 21.3 10.6 0.4 5.5 3.2 6.4
a Values are the average of triplicates. b Not detected. c Standard deviation.

36
Table 2.2: Dry matter of muscadine grape fruits and fruit parts (Grams per Gram of Fresh Weight)a (Bonilla and others 2003)
Cultivar Skin Seed Pulp Whole Fruit
Carlos 0.179 0.532 0.137 0.174
Early Fry 0.159 0.562 0.149 0.161
Fry 0.139 0.523 0.144 0.148
Summit 0.165 0.571 0.166 0.18
Late Fry 0.161 0.516 0.152 0.162
Paulk 0.163 0.578 0.146 0.159
Cowart 0.149 0.531 0.121 0.139
Supreme 0.169 0.514 0.137 0.186
Ison 0.182 0.559 0.157 0.184
Noble 0.135 0.596 0.122 0.151
a Values are the average of triplicates.

37
Table 2.3: Definitions of functional foods
Functional Food Definitions
Edible Plants and Phytochemicals
The consumptions of fruits, vegetables, cereal grains, nuts, seeds are known to enhance the health of human beings and are most wide range of functional foods.
Probiotics and Prebiotics Probiotics are live microbes that exert health benefits when ingested in sufficient quantities. Prebiotics are nondigestable food ingredients that stimulate the growth or modify the metabolic activity of intestinal tract bacteria that have the potential to improve the health of their human host.
Immune Modulators Several substances produced by animals and fungi are seen to function as immune modulators. Eg. fish oils, mushrooms, flax seed meal.
Designer Foods They are the combination of numerous ingredients to achieve a specific set of goals, rather than efforts to uncover the potential health benefits of a single food source. Eg. DHA in infant formulas and sport drinks.

38
Table 2.4: Various microencapsulation techniques and processes involved in each technique (Desai and others 2005)
Sr. No Microencapsulation technique Major steps in encapsulation
1 Spray-drying
a. Preparation of the dispersion b. Homogenization of the dispersion c. Atomization of the in feed dispersion d. Dehydration of the atomized particles
2 Spray-cooling a. Preparation of the dispersion b. Homogenization of the dispersion c. Atomization of the in feed dispersion
3 Spray-chilling a. Preparation of the dispersion b. Homogenization of the dispersion c. Atomization of the in feed dispersion
4 Fluidized-bed coating a. Preparation of coating solution b. Fluidization of core particles. c. Coating of core particles
5 Extrusion a. Preparation of molten coating solution b. Dispersion of core into molten polymer c. Cooling or passing of core-coat mixture through dehydrating liquid
6 Centrifugal extrusion a. Preparation of core solution b. Preparation of coating material solution c. Co-extrusion of core and coat solution through nozzles
7 Lyophilization a. Mixing of core in a coating solution b. Freeze-drying of the mixture
8 Coacervation a. Formation of a three-immiscible chemical phases b. Deposition of the coating c. Solidification of the coating
9 Centrifugal suspension separation
a. Mixing of core in a coating material b. Pour the mixture over a rotating disc to obtain encapsulated tiny particles c. Drying
10 Co crystallization a. Preparation of supersaturated sucrose solution b. Adding of core into supersaturated solution c. Emission of substantial heat after solution reaches the sucrose crystallization temperature
11 Liposome entrapment a. Micro fluidization b. Ultrasonication c. Reverse-phase evaporation
12 Inclusion complexation Preparation of complexes by mixing or grinding or spray-drying
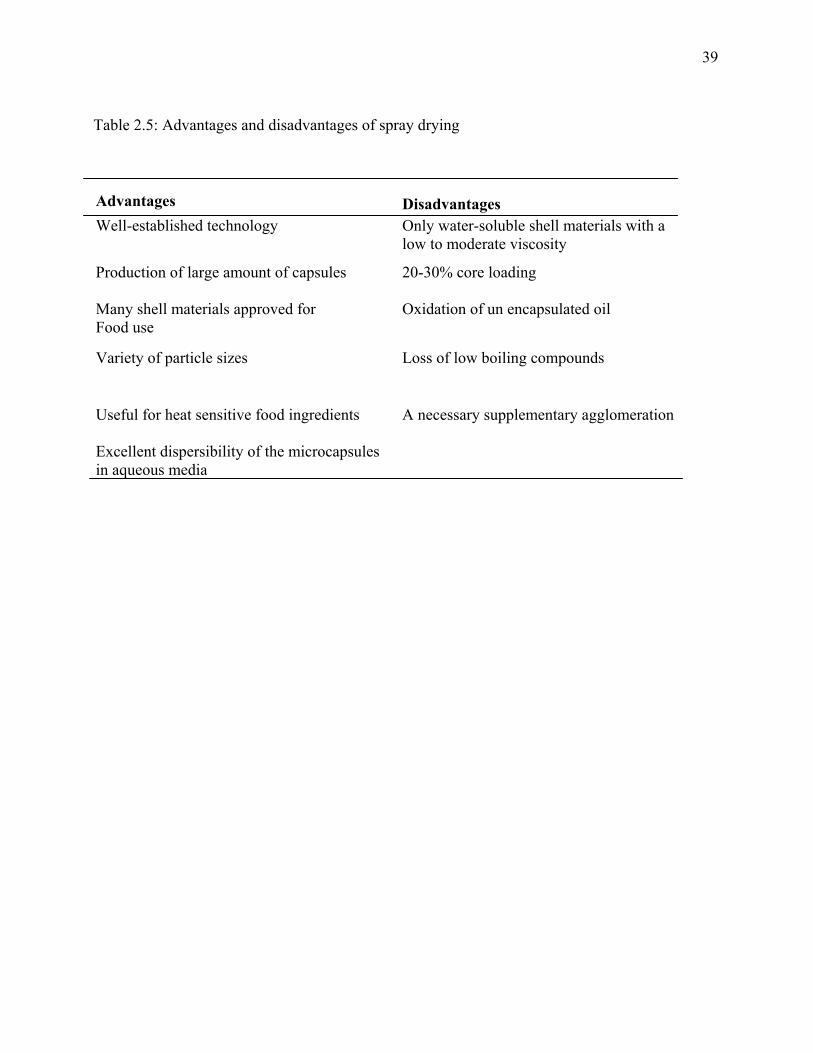
39
Advantages Disadvantages Well-established technology
Only water-soluble shell materials with a low to moderate viscosity
Production of large amount of capsules
20-30% core loading
Many shell materials approved for Food use
Oxidation of un encapsulated oil
Variety of particle sizes Loss of low boiling compounds
Useful for heat sensitive food ingredients
A necessary supplementary agglomeration
Excellent dispersibility of the microcapsules in aqueous media
Table 2.5: Advantages and disadvantages of spray drying

40
Table 2.6: Spray drying parameters Parameter Value Inlet temperature 170-1900C Outlet temperature 90-950C Air pressure 4 kg/cm3 Orifice diameter 2 mm Atomizer speed, variable up to 50,000 rpm Feed concentration 20% Total solids
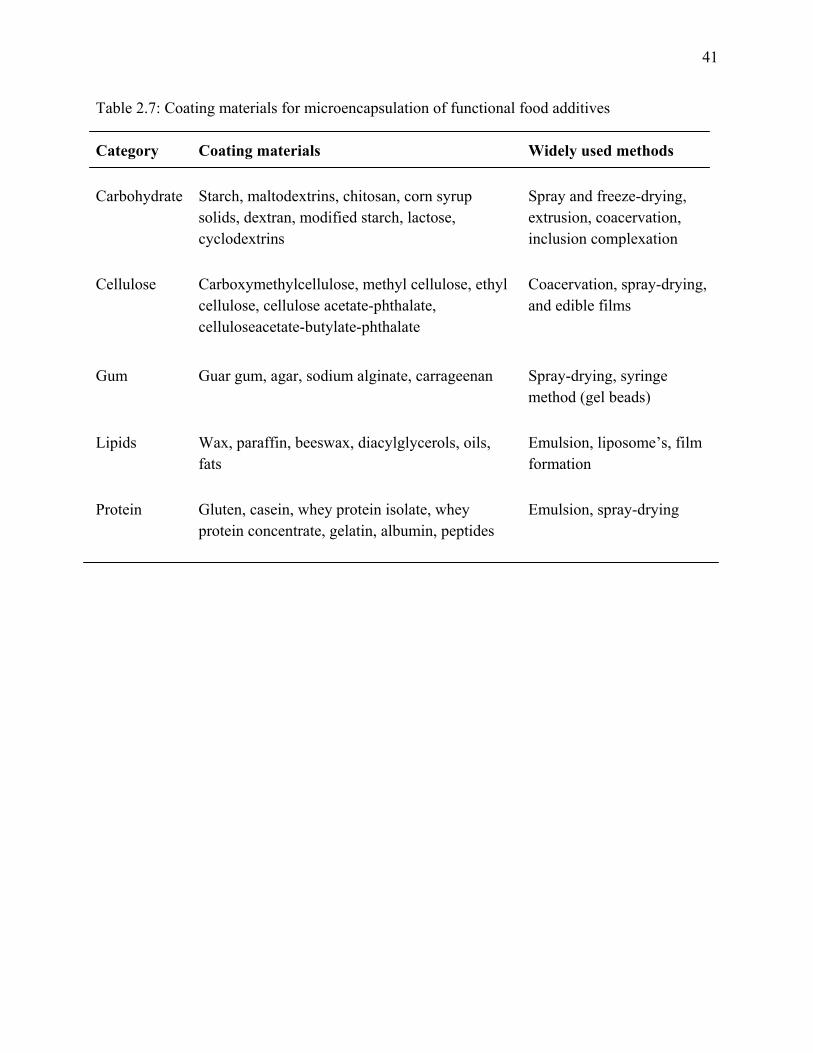
41
Table 2.7: Coating materials for microencapsulation of functional food additives Category Coating materials Widely used methods
Carbohydrate Starch, maltodextrins, chitosan, corn syrup solids, dextran, modified starch, lactose, cyclodextrins
Spray and freeze-drying, extrusion, coacervation, inclusion complexation
Cellulose Carboxymethylcellulose, methyl cellulose, ethyl cellulose, cellulose acetate-phthalate, celluloseacetate-butylate-phthalate
Coacervation, spray-drying, and edible films
Gum Guar gum, agar, sodium alginate, carrageenan Spray-drying, syringe method (gel beads)
Lipids Wax, paraffin, beeswax, diacylglycerols, oils, fats
Emulsion, liposome’s, film formation
Protein Gluten, casein, whey protein isolate, whey protein concentrate, gelatin, albumin, peptides
Emulsion, spray-drying

42
Table 2.8: Analytical data for the gum obtained from Acacia Senegal (Idris and others 1998)
Parameter Range
Moisture content (%) 12.5-16.0
Specific rotation -32.7º to -27.0 º
Nitrogen (%) 0.22-0.39
Protein (%) 1.5-2.6
Galactose (%) 39-42
Arabinose (%) 24-27
Rhamnose (%) 12-16
Glucuronic acid (%) 15-16
Equivalent mass (Da) 1,118-1,238

43
Table 2.9: Maximum usage levels (%) of gum arabic permitted in accordance with the FDA Code of federal regulations (title 21) Food (as served) Percentage Function Beverages and beverage bases 2.0
Emulsifier and emulsifier salt, flavoring agent/adjuvant, formulation aid, stabilizer/thickener.
Chewing gum 5.6 Flavoring agent/adjuvant, humectant, surface-finishing agent
Confections and frostings
12.4 Formulation aid, stabilizer/thickener, surface-finishing agent
Dairy products analogues
1.3 Formulation aid, stabilizer/thickener
Fats and oils 1.5 Formulation aid, stabilizer/thickener
Gelatins, puddings, and fillings
2.5 Emulsifier, emulsifier salt, formulation aid, stabilizer/thickener
Hard candy and cough drops
46.5 Flavoring agent/adjuvant, formulation aid
Nuts and nut products 8.3 Formulation aid, surface-finishing agent
Quiescently frozen confectionery
6.0 Formulation aid, stabilizer/thickener
Snack foods 4.0 Emulsifier, emulsifier salt, Formulation aid
Soft candy 85.0 Emulsifier, emulsifier salt, firming agent, flavoring agent/adjuvant, formulation aid, humectant, stabilizer/thickener, surface-finishing agent
Other food categories 1.0 Emulsifier, emulsifier salt, flavoring agent/adjuvant, formulation aid, stabilizer/thickener, surface-finishing agent, texturizer
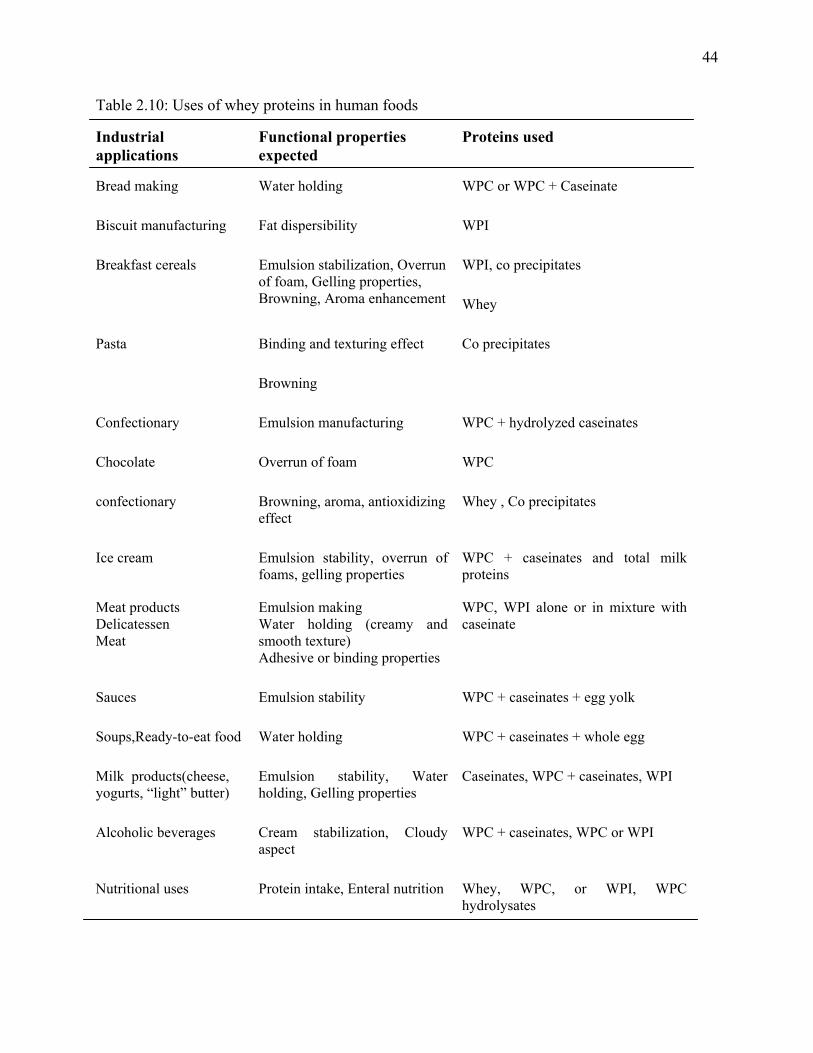
44
Table 2.10: Uses of whey proteins in human foods
Industrial applications
Functional properties expected
Proteins used
Bread making Water holding WPC or WPC + Caseinate
Biscuit manufacturing Fat dispersibility WPI
Breakfast cereals Emulsion stabilization, Overrun of foam, Gelling properties, Browning, Aroma enhancement
WPI, co precipitates
Whey
Pasta Binding and texturing effect Co precipitates
Browning
Confectionary Emulsion manufacturing WPC + hydrolyzed caseinates
Chocolate Overrun of foam WPC
confectionary Browning, aroma, antioxidizing effect
Whey , Co precipitates
Ice cream Emulsion stability, overrun of foams, gelling properties
WPC + caseinates and total milk proteins
Meat products Delicatessen Meat
Emulsion making Water holding (creamy and smooth texture) Adhesive or binding properties
WPC, WPI alone or in mixture with caseinate
Sauces Emulsion stability WPC + caseinates + egg yolk
Soups,Ready-to-eat food Water holding WPC + caseinates + whole egg
Milk products(cheese, yogurts, “light” butter)
Emulsion stability, Water holding, Gelling properties
Caseinates, WPC + caseinates, WPI
Alcoholic beverages Cream stabilization, Cloudy aspect
WPC + caseinates, WPC or WPI
Nutritional uses Protein intake, Enteral nutrition Whey, WPC, or WPI, WPC hydrolysates

45
Table 2.11: Examples of zero and first order reactions
Zero order Non enzymatic browning
Overall quality loss of frozen foods
First order Vitamin loss
Microbial growth/death
Oxidative color loss
Texture loss in food processing

46
Table 2.12: Quality function form and half life times for different order reactions
Apparent reaction Quality function Half life time order Q(A)t t1/2
0 A0-At A0/ (2k0)
1 ln (A0/At) ln2/k1
2 1/A0-1/At 1/ (k2A0)
A01-m 1/m-1(At
1-m-A01-m) 2m-1-1/km (m-1)
(m#1)
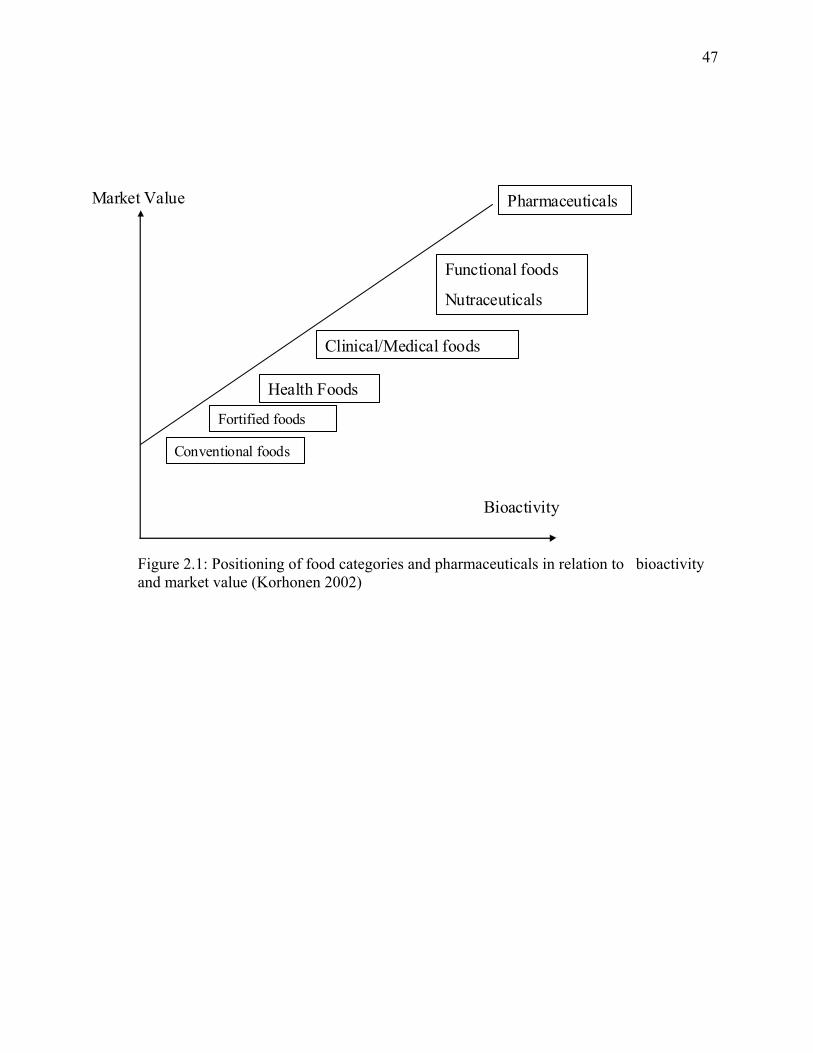
47
Figure 2.1: Positioning of food categories and pharmaceuticals in relation to bioactivity and market value (Korhonen 2002)
Bioactivity
Market Value
Conventional foods
Fortified foods
Health Foods
Clinical/Medical foods
Functional foods
Nutraceuticals
Pharmaceuticals

48
Figure 2.2a: Schematic representation of two types of microcapsules (Desai and Park 2005)
Figure 2.2b: Various forms of microcapsules (Gharsallaoui and others 2007)
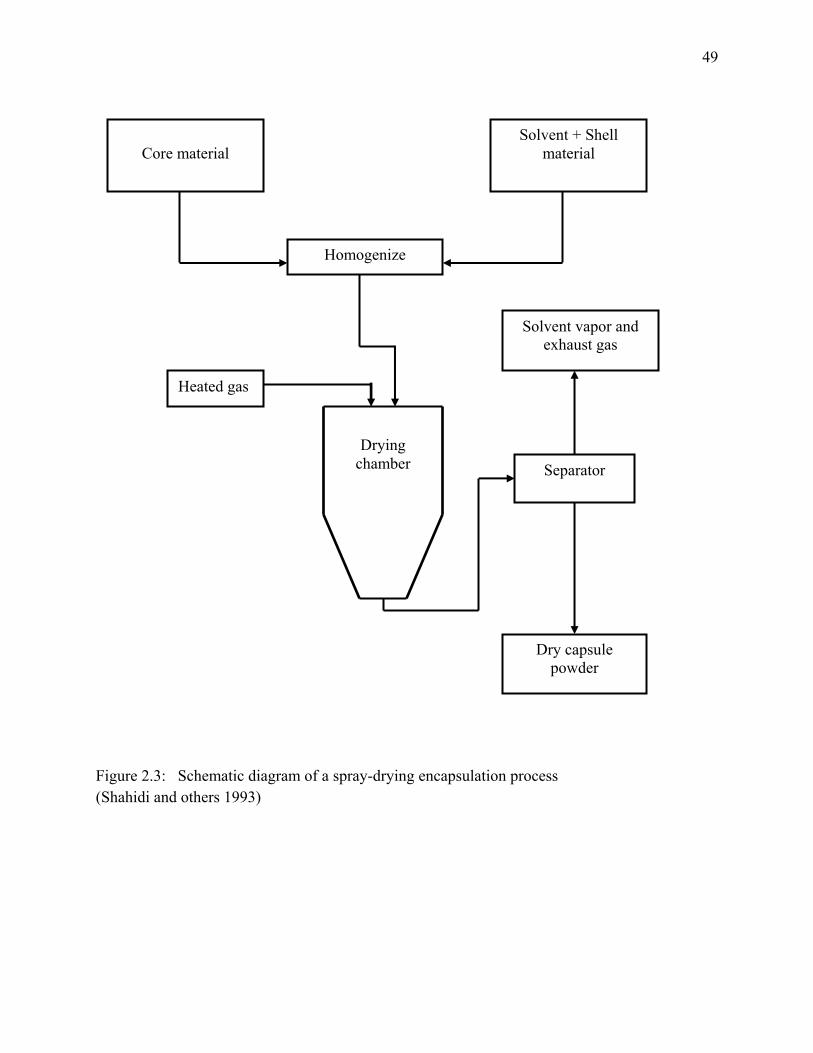
49
Figure 2.3: Schematic diagram of a spray-drying encapsulation process (Shahidi and others 1993)
Core material
Solvent + Shell material
Homogenize
Heated gas
Drying chamber Separator
Solvent vapor and exhaust gas
Dry capsule powder

50
Figure 2.4: Picture of spray dryer

51
Figure 2.5: Chemical structure of gum arabic
Figure 2.6: Chemical structure of pectin (Source: http://food.oregonstate.edu/images/learni/55.gif)

52
(a)
(b) Figure 2.7: Structures involved in starch (a) Linear chain of alpha-1, 4-glucan (b) Alpha-1, 6 branch point

53
Figure 2.8: Composition of single-pass, batch, and feed-and-bleed configurations for cross-flow filtration. The dashed line in the middle panel represents an optional partial recycle stream in the batch configuration. (Zemen and Zydney 1996)

54
REFERENCES Baydar N, Ozkan G, Sagdic O. 2004. Total phenolic contents and antibacterial activities of
grape (Vitis vinifera L.) extracts. Food Control 15:335-339.
Beristain CI, Garcia HS, Jimenez M. 2004. Spray-drying microencapsulation and oxidative
stability of conjugated linoleic acid. Eur Food Res & Technol 219:588-592.
Bisson L, Butzke C, Ebeler S. 1995. The role of moderate ethanol consumption in health and
human nutrition. Am J Enol Vitic 46:449-462.
Bucic-Kojic A, Planinic M, Tomas S, Bilic M, Velic D. 2007. Study of solid-liquid extraction
kinetics of total polyphenols from grape seeds. J Food Eng 81:236-242.
California Rare Fruit Growers, Inc. 1999.
www.crfg.org/pubs/ff/muscadinegrape.html.
Damodaran S, Paraf A. 1997. Food proteins and their applications. New York: Marcel &
Dekker. 681p.
Del PID, Del FMA, Talcott ST, Brenes C. 2007. Stability of copigmented anthocyanins and
ascorbic acid in muscadine grape juice processed by high hydrostatic pressure. J Food Sci &
Technol 72:S247-S253.
Desai H, Goud K, Park HJ. 2005. Recent developments in microencapsulation of food
ingredients. Drying Technology 23:1361-1394.
Dewettinck k, Huyghebaert A. 1999. Fluidized bed coating in food technology. Trends in Food
Sci & Technol 10:163-168.
Drusch S. 2007. Sugar beet pectin: A novel emulsifying wall component for microencapsulation
of lipophilic food ingredients by spray-drying. 21:1223-1228.

55
Forssell P. 2004. Starch-based microencapsulation. ln: Eliasson AC. Starch In Food:
Cambridge, England. CRC press. 461-471. Starch in food: Structure, Function and
Applications. P 461-471.
Ersus S, Yurdagel U. 2007. Microencapsulation of anthocyanin pigments of black carrot
(Daucuscarota L.) by spray drier. J Food Eng 80:805-812.
GEA Process Engineering Inc. 2008.
http://www.niroinc.com/food_chemical/spray_cooling_congealing.asp.
Galland L. 2005. Health effects and clinical applications. Funct Foods 360-375.
German J, Walzem R. 2000. The health benefits of wine. Ann.Rev. Nutr.20: 561-93. Gharsallaoui A, Roudaut G, Chambin O, Voilley A, Saurel R. 2007. Applications of spray
drying in microencapsulation of food ingredients. Food Res Int 40:1107-1121.
Girard B, Mazza G. 1998. Functional grape and citrus products. ln: Mazza G, editor. Functional
foods. Lancaster, Pennsylvania: Technomic Publishing Company. p 139-178.
Giusti MM, Wrolstad RE. 2001. Characterization and measurement of anthocyanins by UV-
visible spectroscopy. ln: Wrolstad RE, Acree TE, An H, Decker EA, Penner MH, Reid DS,
Schwartz SJ, Shoemaker CF, Sporns P, editors. Current protocols in food analytical
chemistry. New York: Wiley. pp F1.2.1-F1.2.13.
Heinzelmann K, Franke K. 1999. Using freezing and drying techniques of emulsions for the
microencapsulation of fish oil to improve oxidation stability. Colloids and Surfaces B:
Biointerfaces 12 (3–6), 223–229.
Hogan S, McNamee B, Riordan O, Sullivan MO. 2001. Microencapsulating properties of whey
protein concentrate 75. J Food Sci 66:675-680.
http://food.oregonstate.edu/images/learni/55.gif

56
Kammerer D, Claus A, Schieber A, Carle R. 2005. A novel process for the recovery of
polyphenols from grape (Vitis vinefera L.) pomace. J Food Sci 70:C157-C163.
Kammerer D, Schieber A, Carle R. 2005. Characterization and recovery of phenolic compounds
from grape pomace-A review. J Appl Bot & Food Quality 79:189-196.
Kheader EE, Vuillemard JC, El Deeb SA. 2000. Accelerated cheddar cheese ripening with
encapsulated preotinases. Int J Food Sci Technol 35:483-495.
Kinsella JE, FrankelE, German J. 1993. Possible mechanisms for the protective role of
antioxidant in wine and plant foods. Food Technol 47:85-89.
Korhonen H. 2002. Technology options for new nutritional concepts. Int J Dairy Technol 55:79-
88.
Kowska AB, Kucharska AZ, Ski JO. 2004. The effects of heating, UV irradiation, and storage on stability of the anthocyanin–Polyphenol copigment complex. Food Chem.81(3):349–355.
Labuza TP, Taoukis PS, Saguy IS. 1997. Kinetics of food deterioriation and shelf life prediction.
ln: Valentas KJ, Rotestein E, Singh RP, editors. Handbook of food enginerring and practice.
CRC press. P 361-404
Lagana F, Barbieri G, Drioli E. 2000. Direct contact membrane distillation: modeling and
concentration experiments. J Membr Sci 166:1-11.
LCI Corporation. 2006. Plant manual for microfiltration laboratory system. Charlotte, NC; P 1-
1 – P12-11.
Maleki A, Mahvi AH, Alimohamadi M, Ghasri A. 2006. Advanced oxidationof phenol by
ultraviolet irradiation in aqueous system. Pak J Bio Sci 9(12):2338-2341.
McNamee B, O’Riordan E, O’Sullivan M. 1998. Emulsification and microencapsulation properties
of gum arabic. J Agric & Food Chem 46:4551-4555.

57
Nawaz H, Shi J, Mittal G, Kakuda Y. 2006. Extraction of polyphenols from grape seeds and
concentration by ultrafiltration. Sep & Purific Technol 48:176-181.
Pastrana-Bonilla AC, Sellappan S, Krewer G, Akoh CC. 2003. Phenolic content and antioxidant
capacity of muscadine grapes. J Agric & Food Chem 51:5497-5503.
Polyphenolics Inc. 2003.
http://www.polyphenolics.com/pdf/HealthBenefitsofVinox.pdf.
Porzio MA. 2007. Flavor delivery and product development. Food Technol 61:22-29.
Prado F, Parada J, Pandey A, Soccol C. 2008. Trends in non-dairy probiotic beverages. Food
Res Int 41:111-123.
Rawel H, Kroll J, Hohl U. 2001. Model studies on reactions of plant phenols with whey
proteins. Nahrung 45:72-81.
Reineccius GA, Bangs WE. 1985. Spray drying of food flavors. III. Optimum infeed
concentrations for the retention of artificial flavors. Perfumer & Flavorist 9:27-29.
Reineccius GA. 2004. The spray drying of food flavors. Drying Technol 22 (6):1289-1324.
Rektor A, Vatai G, Bekassy-Molnar E. 2006. Multi-step membrane processes for the
concentration of grape juice. Desalination 191:446-453.
Rektor A, Pap N, Kokai Z, Szabo R, Vatai G, Molnar EB. 2004. Application of membrane
filtration methods for must processing and preservation. Desalination 162:271-277.
Renaud S, De Lorgeril M. 1992. Wine, alcohol, platelets, and the French paradox for coronary
heart disease. The Lancet 339:1523-1526.
Robbins R. 2003. Phenolic acids in foods: an overview of analytical methodology. J Agric &
Food Chem 51:2866-2887.

58
Roginsky V, DeBeer D, Harbetson J, Kilmartin P, Barsukova T, Adams D. 2006. The
antioxidant activity of Californian red wines does not correlate with wine age. J Sci Food &
Agric 86(5):834-840.
Rusli J, Sanguansri L, Augustin M. 2006. Stabilization of oils by microencapsulation with
heated protein-glucose syrup mixtures. J Am Oil Chem Soc 83:965-972.
Saguy I, Karel M. 1980. Modeling of quality deterioration during food processing and storage.
Food Technol. 34(2) 78-85.
Sah H. 1999. Protein behavior at the water/methylene chloride Interface. J Pharm Sci 88:1320-
1325.
Saleh SZ, Stanley R, Wibisono R. 2006. Seperation and concentration of health compounds by
membrane filtration. Int J Food Eng 2:1-14.
Serris G, Biliaderis C. 2001. Degradation kinetics of beetroot pigment encapsulated in
polymeric matrices. J Sci Food & Agric 81:691-700.
Shahidi F, Han FQ. 1993. Encapsulation of food ingredients. Crit Rev Food Sci Nutr 33:501-
547.
Shi J, Nawaz H, Pohorly J, Mittal G, Kakuda Y, Jiang Y. 2005. Extraction of polyphenolics
from plant material for functional foods-Engineering and technology. Food Rev Int 21:139-
166.
Singleton VL, Rossi JA. 1965. Colorimetry of total phenolics with phosphomolybdic
phosphotungstic acid reagents. Am J Enol Vitic 16:144-158.
Spigno G, Tramelli L, De Faveri D. 2007. Effects of extraction time, temperature and solvent on
concentration and antioxidant activity of grape marc phenolics. J Food Eng 81:200-208.

59
Stanley L, Mazier P. 1999. Potential explanations for the French paradox. Nutr Research.
19(1):3-15.
Sun A, Simonyl A, Sun G. 2002. The “French Paradox” and beyond: Neuroprotective effects of
polyphenols. Free Radical Biol & Med 32:314-318.
Tandale S. 2007. Microencapsulation of Vitamin C and Gallic acid in whey protein concentrate
by spray and freeze drying- characterization and degradation kinetics (MS Thesis). Athens,
Ga.: University of Georgia. 142p.
Taxi D, Menezes HC, Santos AB, Grosso CRF. 2003. Study of the microencapsulation of
camu-camu (Myrciaria dubia) juice. J Microencapsulation 20: 443-448.
Vaillant F, Millan A, Dornier M, Decloux M, Reynes M. 2001. Strategy for economical optimization
of the clarification of pulpy fruit juices using crossflow microfiltration. J Food Eng 48(1):83-
90.
Vaillant F, Cisse M, Chaverri M, Perez A, Dornier M, Viquez F, Dhuique-Mayer C. 2005.
Clarification and concentration of melon juice using membrane processes. Innovative Food
Sci & Emerging Technol 6(2):213-220.
Verbeken D, Dierckx S, Dewettinck K. 2003. Exudate gums: occurrence, production, and
applications. Appl Microbiol & Biotechnol 63:10-21.
Vine R, Harkness E, Browning T, Wagner C. 2002. Winemaking: From Grape Growing to Marketplace. New York: Springer. 476p.
Waterhouse A. 2002. Wine phenolics. Ann New York Acad Sci 957:21-36.
Yang J, Paulino R, Janke S, F. Abawi F. 2007. Free-radical-scavenging activity and total
phenols of noni (Morinda citrifolia L.) juice and powder in processing and storage. Food
Chem 102:302-308.

60
Young S, Sarda X, Rosenberg M. 1993. Microencapsulating properties of whey proteins. 1.
Microencapsulation of anhydrous milk fat. J Dairy Sci 76:2868-2877.
Zaid SS, Roger S, Reginald W. 2006. Seperation and concentration of health compounds by
membrane filtration. Int J Food Eng 2 (4):1-16.
Zemen JL, Zydney AL. 1996. Process configurations. ln: Zemen JL, Zydney AL, editors.
Microfiltration and ultrafiltration. New York: Marcel Dekker. P 380-396.
61
CHAPTER 3
MICROFILTRATION OF MUSCADINE GRAPE POMACE AND
PREPARATION OF SPRAY DRIED POWDER
______________________________________________________________________ Ray N., Chinnan M.S., and Phillips R.D. To be submitted in Journal of Food Science
62
ABSTRACT
Muscadine grapes are an excellent source of antioxidants which are mainly located in the
skin and seeds (pomace) and aim of this research is to make muscadine powders which are rich
in antioxidants. The study evaluated effect of microfiltration with or without bladder press. The
total phenols increased from 7.25-7.93 to 8.33-8.92 and 6.25-7.98 to 7.01-8.73 g gallic acid/kg
pomace with and without bladder press. The total anthocyanins decreased from 1.95-2.05 to
1.71-1.80 and 1.46-1.65 to 1.26-1.41 g cyanidine-3 glucoside equivalents/kg pomace with and
without bladder press, respectively. It was found that flux rate did not change for constant cross
flow velocity. It is also found that microfilter, bladder press and enzyme treatment is significant
to extraction of total anthocyanins while microfilter is significant to extraction of total phenols.
Key words: Microfiltration, muscadine, pomace, spray drying, extracts, total phenols, total anthocyanins.

63
INTRODUCTION
Muscadine grapes are native to southeast US where they grow in abundance because of
the warm and humid climate. The color of fruit ranges from greenish bronze to bronze, pinkish
red, purple, and almost black (California Rare Fruit Growers, Inc 1999). Georgia has about
1,200 acres of commercial muscadine grapes (Georgia Faces 2004).
The major phenols found in muscadine are ellagic acid, kaempferol, myricetin, and
quercetin. The seeds have highest antioxidant capacity compared to other fruit parts (Pastrana
and Bonilla 2003). Muscadines have about 40% of their weight in the skin and seeds (Morris
and Brady 2004). Thus for processing operations about half of fruit weight is lost as press
fraction. The use of this press fraction (pomace) could have a big impact on muscadine wine
and juice industry. The pomace can be used to produce colorants, nutraceuticals additives, seed
extracts and oil and as ingredients for food industry. It can be used for production of ethanol or
for the recovery of organic acids such as tartarates, malates, and citric acid (Schieber and others
2001).
Grape seed is a source of high quality cooking oil (Hang 1988). Grape seed oil has about
10 milligrams of vitamin E, slightly more than sunflower or safflower oil which are also high in
vitamin E. Pigments extracted from grape seed oils are also receiving considerable attention as
food ingredients. Depending on usage level, these pigments have potential to both color
products and increase nutraceuticals content of foods containing them (Katz 2004). The grape
extracts show wide range of biological activities which include antibacterial, antiviral, anti-
inflammatory, anticarcinogenic, and lipid peroxidation (Bagchi and others 2000).

64
Membrane filtration has been used since a long time for filtration of materials or
recovering of phenols or other valuable components from the wastes of food processing. Here
are a few examples of the same as below.
Nanofiltration was carried out on apple juice retentate using membrane of sizes 0.1 and
0.25 kDa molecular weight cut-off (MWCO) and it was found that by using 1 kDa membrane
concentration of phenolics increase by 4 times on retentate (Zaid and others 2006). When using
0.25kDa membrane on the collected permeate concentration of phenolics increased by two times
on retentate side. A solvent extraction method utilizing 50% ethanol and 50% water as solvent
and ultrafiltration (UF) was used for extraction of polyphenols from grape seeds (Nawaz and
others 2006) and found that UF procedure led to high extraction rates, shorter extraction times
and significant labor savings. For extraction of polyphenol from grape seeds Bucic and others
(2007) used different solid-liquid ratio, four particle sizes and different temperatures and found
that temperature, solid–liquid ratio and milling degree had a positive influence on extraction rate
and extent of extraction and could extract as much as 1.47-6.68% of total polyphenol per dry
matter of grape seeds in 200 minutes. To extract polyphenols from grape skins Kammerer and
others (2005) used enzymatic hydrolysis of grape skins, using pectinolytic and cellulosic
enzymes, different enzyme-substrate ratio and time temperature regime and observed that
extraction of polyphenols was increased by treatment of pomace with hot water and cell wall
degrading enzymes. Membrane filtration was used for must preservation and concentration
using microfiltration and reverse osmosis on white and red grape juice samples (Rektor and
others 2004) and obtained a retentate with high sugar and anthocyanins content indicating good
membrane retention. During extraction of polyphenols from grape marc with different
concentrations of solvent (ethanol), it was found that polyphenols content increased for water

65
content of ethanol from 10 to 30 % remained constant from 30 to 60% water and started
decreasing after 50%. It was also observed that there was more extraction at 60°C as compared
to 45°C. All the above studies indicate that grape pomace can be used for extracting polyphenol
and making nutraceuticals out of them. These nutraceuticals can be added to food or used as an
ingredient in food. There are various factors affecting the removal of polyphenol from solvent
like solvent type, particle size, temperature and time of extraction, solvent to solid ratio, solvent
pressure. The objectives of this study are: 1) Use muscadine pomace to extract polyphenols
using microfiltration 2) To investigate effects of microfiltration process on extraction of
polyphenols and prepare spray dried powders from it.
MATERIALS AND METHODS
Materials
Muscadine pomace of Supreme variety was obtained as gift from Paulk Vineyards
(Wray, GA).
Chemicals
Gallic acid, Folin Ciocalteau reagent, ascorbic acid, sodium carbonate, potassium iodide,
sodium acetate was obtained from Sigma Aldrich (St. Louis, MO).
Grinding
Grinding of muscadine pomace was done by Urschel mill (fig 3.1A) (Urschel Comitrol
Processor Model 1700, Urschel Laboratories Inc., Valparaiso, IN). The ratio of solid to liquid
was kept at 1:3 (1 part of pomace: 3 parts of water). Fifty five kg of pomace was used while
using bladder press (fig 3.1B) (RLS Equipment Corp., Egg Harbor City, NJ) and microfilter (fig
3.2) and thirty kg of pomace was used while using only microfilter (LCI Corp., Charlotte, NC).
The microfilter being used in Sceptor membrane system had two microfilter tubes of 5 feet
66
length each. The tubes are made of Stainless steel 316L with TiO2 coating on it. While grinding
pomace (55 kg), weight of water (55kg) added was same as quantity of pomace taken to ease in
grinding operation. The remaining quantity of water (110 kg) was added while heating pomace.
The ground muscadine pomace was mixed with ascorbic acid (0.2%) to prevent oxidation. It
was ground two more times by passing it through Urschel mill. There are two sets of blades
(teeth) which move in opposite direction and help in crushing pomace to fine size. The teeth
count could be kept either at 120, 140, or 200. Attempts were made to grind pomace with all
teeth sizes and it was found that Urschel mill could not grind pomace at 200 teeth count, and
could grind at 120 and 140 teeth count. In this study the teeth count was kept at 140. More
deionized water was added during regrinding pomace second and third time. Grinding grape
seeds also helps in extraction kinetics of polyphenol and solvent has better access to grape seed
polyphenol (Bonilla and others 1999; Nawaz and others 2005).
Aqueous Extraction
Ground muscadine pomace (60 kg) was transferred to an extraction tank (fig 3.3) of
capacity 55 gallon and 60 liters of deionized water was added to it. The extraction tank was then
covered with a lid coupled with a stirrer (Stir-pak Model 50002- 02 Stirrer Controller Cole-
Parmer Instrument Co., Vernon Hills, IL). The tank was heated by a gas burner until the
temperature reached 60°C (Biswas 2007). The photograph of extraction tank is given in fig 3.3.
The extraction was done at 60° C for 1 h with added Pectinex BE enzyme ® (30ml). The extracts
were then collected into buckets before filtration. The weights of extracts were noted. A
flowchart of extraction procedure is shown in fig 3.4.
While doing extraction using bladder press (weight of sample taken= 55 kg) the extracts
were taken from extraction tank as in last process and passed through bladder press subjected to
67
pressure of 3 kg/cm2. The collected filtrate was passed through a second bag filter of 50 micron
pore size and then passed through microfilter. The press cake obtained from bladder press was
weighed and discarded and extract was used for microfiltration.
Microfiltration of Muscadine Grape Pomace
Microfiltration of muscadine grape pomace was done by either of the two processing
steps
a) Passing it through microfilter
b) Passing it through bladder press and then microfilter
Each process was repeated two times. The temperature and pH of sample was checked
every fifteen minutes from both permeate and retentate sides during microfiltration.
Muscadine grape pomace was micro filtered without bladder press or after using bladder
press and operated at constant low trans membrane pressure (TMP), constant cross flow velocity.
Various parameters can be modified to optimize flux across the membrane, transmembrane
pressure is of significant importance. Transmembrane pressure is the average of pressure
difference between the retentate and permeate sides. The transmembrane pressure can be
controlled by backpressure valve and the pump flow rate. The cross flow velocity was
maintained at 68.13-75.7 L/min; inlet pressure at 150 psi, outlet pressure at 130 psi; and the trans
membrane pressure at 35 psi. The flux varied between 0.32-0.35 L/min at cross flow velocity of
68.89 L/min. Samples were taken from permeate and retentate sides to monitor changes in total
phenolics, total anthocyanins, pH and temperature.
Spray Drying
The aqueous extracts obtained from microfilter operation were spray dried using pilot
scale spray drier (Anhydro Inc., Olympia Fields, IL). The inlet temperature was set at 180 °C
68
and outlet 90 °C. The system was initially stabilized with deionized water before running the
extracts. The flow rate was set at 47-53 ml/minute. The atomizer was set to run at 70 percent of
its rated capacity (50,000 RPM). The spray dried powder was collected in bottles and kept in
amber colored glass bottles which were flushed with nitrogen gas before being stored in freezer
at -20 °C.
Moisture Determination of Pomace
Moisture analysis of pomace was done by vacuum oven method at 70 °C and 25mm Hg
for 8h (AOAC 934.06).
Total Solids Determination of Extract
An isotemp oven model (Lindberg Blue M, Asheville, NC,) was used for determination
of total solids. Aluminum dishes were dried for 24 hr at 85°C, placed in dessicator and weighed.
The samples (five to ten grams) were taken and placed in an aluminum dish and left for 24 h at
85 °C in oven. The samples were placed in dessicator and weighed using Fisher Scientific A-250
analytical scale (Chamul 1990). The weight difference was used to calculate total solids.
Soluble Solids (°Brix)
A Palette digital handheld “Pocket” refractometer (Atago Co, Ltd Tokyo) was used to
measure percent soluble solids. The refractometer was calibrated using distilled water (0° Brix)
prior to making sample measurements. The soluble solids (° Brix) was measured for one drop of
juice at room temperature (22°C) and performed in duplicate.
Titratable Acidity
Twenty milliliters of juice was placed in a 50-ml Erlenmeyer flask and phenolphthalein
(three drops of a 5 % phenolpthaniel solution) was added as an indicator. The juice sample was
titrated against an aqueous 0.1 N NaOH solution till final endpoint of 8.2 on pH meter.

69
Titratable acidity (TA) was expressed as percent tartaric acid using the formula below in which
mill equivalent factor used for tartaric acid was 0.075 (Liu 1999).
TA (%) = ml of NaOH x normality of NaOH x meq. wt acid x 100 ml of sample
pH
The pH of extract was determined by a pH tester (Oakton pH Testr 3, Singapore) every
fifteen minutes.
Cleaning
Cleaning was done by first flushing unit with hot water. Then sodium hydroxide was
circulated after adjusting pH to 12.0 at 70-75°C for 30 minutes followed by flushing it with
water at 70-75°C. Again aqueous sodium hydroxide was circulated in system and flushed with
water at 70-75°C. Permeate and retentate sides were checked with a pH paper to keep pH of 7.0.
Total phenol
Total phenol was estimated colorimetrically using Folin-Ciocalteau method (Singleton
and Rossi 1965). A sample aliquot of 200µL was added to 800µL of deionized water, 5 ml of
Folin Ciocalteau reagent and 4 ml of saturated sodium carbonate solution (75g/L). The
absorbance was measured at 765 nm with a Hewlett Packard 8451A diode array
spectrophotometer (Avondale, PA) after incubation for two hours at room temperature (~25 °C).
Quantification was based on standard curve generated with 50, 100, 200, 300, 400, 600, 800 and
1000 mg/L of gallic acid. The final concentration of phenols was calculated based on total
volume of extract and initial weight of pomace; and expressed as mg/kg dry weight. The
experiment was conducted under yellow light.

70
Total anthocyanin
Total anthocyanin was measured by pH differential method (Giusti and Wrolstad 2001)
using two buffer systems - potassium chloride buffer, pH 1.0 (0.025 M) and sodium acetate
buffer, pH 4.5 (0.4 M). Extracts were diluted with water to give absorbance in range of 0.1 - 1.2
at 510 nm. Aliquots of 0.2 ml of diluted extracts were mixed with 1.8 ml of each buffer, vortexed
and read against a blank at 510 and 700 nm with a Hewlett Packard 8451A diode array
spectrophotometer (Avondale, PA).
Absorbance was calculated as
A= [A510 nm - A700 nm] pH 1.0 – [A510 nm - A700 nm] pH 4.5
Monomeric anthocyanin pigment concentration in the extract was calculated as
cyanidine-3 glucoside
Monomeric anthocyanin pigment (mg/L) = A × MW × DF × 1000/ (e × l)
Where A = absorbance, MW = molecular weight (449.2), DF = dilution factor, e = molar
absortivity (29,600), l = path length (1 cm).
The final concentration of total anthocyanins was calculated based on total volume of extract and
weight of starting fruit, and expressed as mg/kg dry weight.
Statistical analysis
The statistical analysis software (SAS® Proprietary Software, 2003-2005), Release 9.1
for Windows (SAS® Institute Inc., Cary, NC) was used for data analysis. The Proc GLM
procedure was used to check change in total phenol and total anthocyanins due to bladder press,
filter, repetition and interaction of bladder press and filter at 90 and 95% level of significance
(α=0.1 and α=0.05).

71
Calculations
The weights of samples were taken after each processing step. However volume was not
known at all processing steps. To determine the volume lab tests were done to determine the
volumes at each corresponding steps. After determining densities at different steps the values
were then applied to actual tests to determine volumes.
RESULTS AND DISCUSSION
Total Soluble Solids
The total soluble solids increased from 2.4 to 2.8 on permeate side and 2.4 to 3.7% on
retentate side during microfiltration.
pH
The pH of the slurry decreased from 3.7 (before heating) to 3.35 after enzyme treatment.
The lowering of pH helps in extraction of phenols from cell walls.
Microfiltration with Bladder Press
The total phenols changed from 1.78-2.19 to 3.33-3.50 g gallic acid equivalents/L and
upto 2.77-3.16 g gallic acid equivalents/L in the retentate and permeate sides (fig 3.5). The total
anthocyanin content changed from 0.42-0.56 to 0.64-0.75 g cyanidine-3 glucoside equivalents/L
and upto 0.45-0.56 g cyanidine-3 glucoside equivalents/L on the retentate and permeate sides as
shown in fig 3.6. The total anthocyanin content increased on retentate side whereas
concentrations of total phenol increased on both permeate and retentate sides (fig 3.5 and 3.6).
The concentration of total phenol decreased from 7.25 -7.93 (enzyme treatment) to 6.35-6.48 g
gallic acid equivalents/kg pomace after passing through bladder press. After microfiltration it
increased from 6.35-6.48 to 8.33-8.92 g gallic acid equivalents/kg pomace. The concentration of
total anthocyanin decreased from 1.95-2.05 to 1.63-1.67 g cyaniding-3 glucoside after bladder

72
press and increased to 1.78-1.80 g cyanidine-3 glucoside equivalents/kg pomace after
microfiltration (Table 3.2 and fig 3.10). While using microfilter, flux change in permeate was
not observed over time due to high cross flow velocity and as a result there was no caking of
membrane. It may also be due to the fact that the flow-rate was not maintained constant for a
long time to observe changes in flux-rate (Table 3.3 and 3.4).
Microfiltration without Bladder Press
The total phenol in retentate changed from 1.87-2.27 to 2.73-3.56 g gallic acid
equivalents/L and upto 1.79-1.85 g gallic acid equivalents/L on retentate and permeate sides (fig
3.7). The total anthocyanin content changed from 0.274-0.310 to 0.427-0.506 g cyanidine-3
glucoside equivalents/L and upto 0.302-0.315 g cyanidine-3 glucoside equivalents/L on permeate
and retentate sides (fig 3.8). There was an increase in concentration of anthocyanins on permeate
side whereas there was a decrease on the retentate side. There was an increase in concentration
of phenols on both retentate and permeate sides (fig 3.7 and 3.8). The concentration of total
phenols increased from 6.28-7.98 g gallic acid equivalents/kg pomace after enzyme treatment to
7.0-8.92 g gallic acid equivalents/kg pomace after passing through the bladder press. The
concentration of total anthocyanins decreased from 1.43-1.65 to 1.26-1.44 g cyanidine-3
glucoside/kg pomace after microfiltration (Table 3.2 and fig 3.10). When bladder press was not
used the microfiltration operation could not be continued beyond two hours and fifteen minutes
because of high total solids in retentate as the particle size was too large and trans membrane
pressure approached the maximum operating pressure. Here we were also unable to see flux
changes because of sudden stopping of operation. According to the manufacturer membrane
could handle viscous solids up to 50 percent whereas in our study the feed had total solids

73
concentration of 12.5 per cent. It may be advisable to dilute feed to 10 times instead of 4 times
as done in this experimental setup.
The concentration of total phenol and total anthocyanins is 1.5 times on concentrate side
as compared to permeate (after microfiltration). It was observed that weight of total phenol and
total anthocyanin on permeate side was 80 percent and remaining 20 percent on the retentate
side. We could use some membranes like UF having appropriate pore sizes for concentration of
permeate obtained to get higher concentration of total phenol and total anthocyanin. We may
also use low temperature flash evaporation for removal of excess water and then spray dry
extracts to get powder which is more concentrated.
Since there was no heat exchanger to control temperature during microfiltration, an
increase was seen in concentration of total phenol with temperature as opposed to a plateau
which should be observed as reported by Bucic and others (2007) when operating at different
extraction temperatures.
Grape seed polyphenols are sensitive to light, oxygen, acid and alkaline conditons but are
less sensitive to heat (Shi and others 2005). As per study carried out by Spigno and others
(2007), there was more extraction of phenols at 60°C as compared to 45°C. This explains the
increase in extraction of phenols with temperature increase and increase in concentration of
polyphenols with temperature rise. There are four kinds of bonds existing between proteins and
polyphenols: hydrogen, hydrophobic, ionic and covalent bonds (Shi and others 2005). More than
33 % of dry weight of proteins is polyphenolic compounds bound by hydrogen bond (Shi and
others 2005). Some of these bonds are broken during microfiltration which lead to release of
phenols from the cellulose and protein matrix.

74
There are various factors which could contribute to degradation of total anthocyanins like
structural effects, concentration effects, pH, temperature, oxygen, light, enzymes, ascorbic acid
and sugars. The degradation rate of anthocyanins increase during processing and storage as
temperature rises (Maccarone and others 1985). Temperature rise in pH 2-4 induces loss of
glycosyl moieties of anthocyanins, by hydrolysis of the glycosidic bond (Adams 2006). This
leads to further loss of anthocyanins color, since aglycones are much less stable than their
glycosidic forms. The presence of oxygen, together with elevated temperature, was most
detrimental combination of the many factors which were tested against color deterioration of
different berry juices and isolated anthocyanins (Nebesky and others 1949). Sugars as well as
their degradation products are known to decrease anthocyanins stability (Meschter 1953; Thakur
and Arya 1989). Of typical sugar degradation products, furfural accelerated anthocyanins
pigment deterioration more prominently than hydroxyl-methylfurfural (Meschter 1953). The
reactions of anthocyanins with both degradation products of sugars and ascorbic acid yield in the
formation of brown pigment polymers (Krifi and others 2000).
Statistical analysis
It was found that microfilter; bladder press and enzyme treatment had significant effect
on yield of total anthocyanins at 0.10 level of significance. It was also found that the use of
microfilter was significant to extraction of total phenols at 0.05 level of significance but there
was no significant effect with use of bladder press (fig 3.9 and 3.10).
CONCLUSIONS
Extraction of muscadine grape pomace was carried out using enzyme treatment, bladder
press and microfilter. It was found that use of microfilter was significant to extraction of phenols
and use of enzyme treatment, bladder press and microfilter was significant to extraction of total

75
anthocyanins. These results can be used in designing a system of continuous extraction of
phenols using a series of filters kept in parallel.

76
Table 3.1 Composition of grape extract after enzyme treatment
Parameter Value
pH 3.56
Soluble Solids °Brix 2.20
Titratable acidity (Tartaric acid)/ g/100ml 0.37
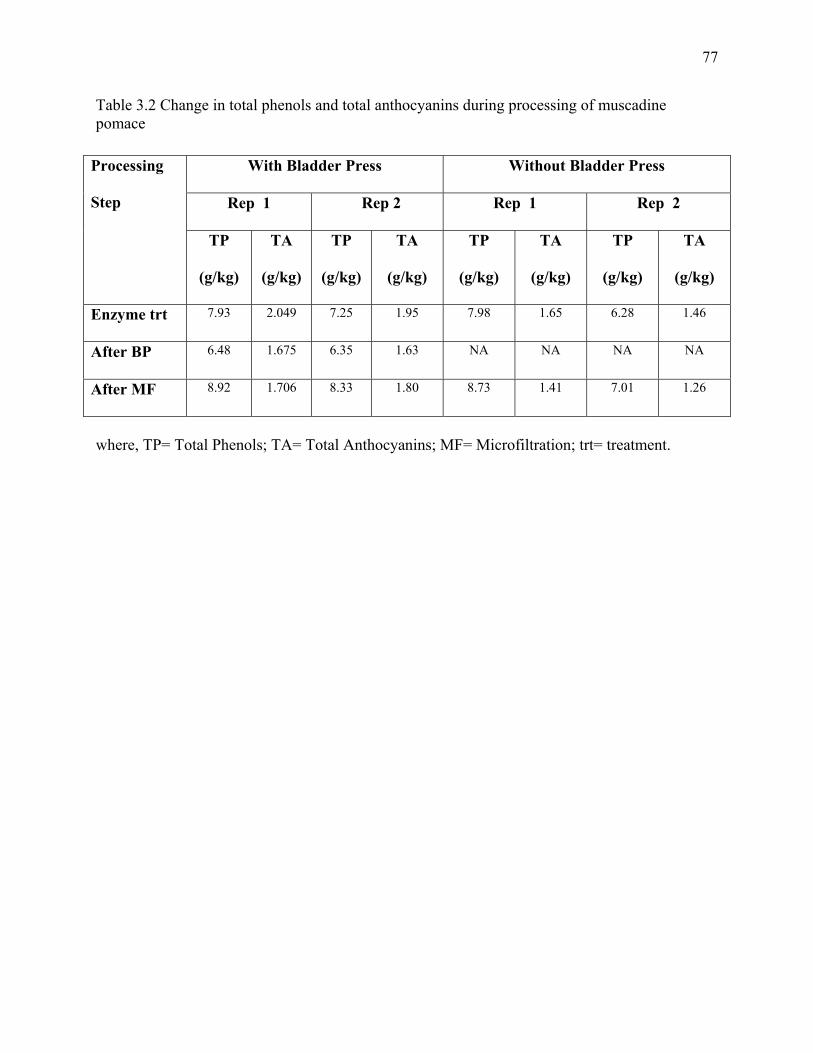
77
Table 3.2 Change in total phenols and total anthocyanins during processing of muscadine pomace
where, TP= Total Phenols; TA= Total Anthocyanins; MF= Microfiltration; trt= treatment.
With Bladder Press Without Bladder Press
Rep 1 Rep 2 Rep 1 Rep 2
Processing
Step
TP
(g/kg)
TA
(g/kg)
TP
(g/kg)
TA
(g/kg)
TP
(g/kg)
TA
(g/kg)
TP
(g/kg)
TA
(g/kg)
Enzyme trt 7.93 2.049 7.25 1.95 7.98 1.65 6.28 1.46
After BP 6.48 1.675 6.35 1.63 NA NA NA NA
After MF 8.92 1.706 8.33 1.80 8.73 1.41 7.01 1.26

78
Table 3.3 Experimental data for change in total phenolics, total anthocyanins in aqueous extracts of muscadine pomace during microfiltration without bladder press
Time Total Solids
(%) Total Phenol
(mg/L) Anthocyanin
(mg/L) Pressure (Psi) Flowrate (L/min) Freq
Temperature (°C)
Min Ret Per Ret Per Ret Per Inlet Outlet Permeate TMP Ret Per % Ret Per 15 1.93 1.53 2821.56 2618.89 566.74 566.74 150 140 110 35 66.24 27.1 39 10 30 150 140 110 35 66.24 0.25 27.1 40 10 45 150 145 110 35 46.94 19.6 41.7 19 60 1.94 1.56 2835.04 2645 648.74 533.75 150 140 110 37.5 47.32 0.21 19.6 41.8 19.1 75 150 140 110 35 46.56 19.6 41.8 18.1 90 150 140 110 35 47.32 0.2 19.6 42 17.6 105 150 140 110 35 47.32 19.7 42 17.3 120 1.98 1.51 2761.1 2705.49 639.44 505.41 150 140 110 35 47.32 19.7 42.7 16.4 135 150 140 110 35 48.45 19.7 43.4 15.4 150 150 140 110 35 66.24 0.27 27.1 44.3 16.3 165 150 140 110 35 66.24 27.1 45.2 17.8 180 2.04 1.51 2896.97 2685.07 657.82 503.54 150 140 110 35 66.24 0.28 27.1 46.3 18 195 150 140 110 35 66.24 27.7 47.7 17.4 210 150 140 110 35 67.76 0.29 28 49.3 17.6 225 150 140 110 35 68.14 28 50.4 11.3 240 2.1 1.56 3045.67 2737.57 727.77 513.89 150 140 110 35 68.52 28 51.9 11.4 255 150 140 110 35 68.52 28 53.3 10.6 270 150 140 110 35 68.89 0.33 28 54.9 10.1 285 150 140 110 35 68.89 28 60.3 8.1 300 2.21 1.57 3018.57 2884.44 683.83 522.44 150 140 110 35 68.89 0.32 28 61.3 8.4 315 150 140 110 35 68.89 28 62.4 9.1 330 150 140 110 35 68.89 0.32 28 63.1 9.4 345 150 140 110 35 68.89 28 64.1 9.4 360 2.32 1.63 3003.78 2914.27 711.875 523.9475 150 140 110 35 68.89 28 64.4 9.3

79
375 150 140 110 35 68.89 28 63.8 9.7 390 150 140 110 35 68.89 0.3 28 61.7 10.1 405 150 140 110 35 68.89 28 61.7 10.1 420 2.58 1.72 3228.61 3161.79 724.495 553.225 150 140 110 35 68.89 0.35 28 61.4 10.5 435 150 140 110 35 68.89 28 61.4 10.5 450 150 140 110 35 68.89 28 64.5 10.5 465 150 140 110 35 68.89 28 64.5 10.3 480 3.06 1.82 3507.85 3172.68 757.585 564.4075 150 140 110 35 68.89 0.33 28 66 9.5
Where, Phen=Phenols, Ret=Retentate, TMP= Trans membrane pressure, Freq= Frequency.

80
Table 3.4 Experimental data for change in total phenolics, total anthocyanins in aqueous extracts of muscadine pomace during microfiltration without bladder press
Time Total Solids
(%) Total Phenol
(mg/L) Anthocyanin
(mg/L) Pressure (Psi) Flowrate (L/min) Freq
Temperature (°C)
Min Ret Per Ret Per Ret Per Inlet Outlet Permeate TMP Ret Per % Ret Per 0 1.74 9.51 2344.23 2116.23 548.38 346.34 150 135 110 32.5 66.24 0.22 31.5 54
15 1.74 8.38 2934.38 2155.96 525.03 399 150 132 110 31 66.24 0.35 30.7 52.8 30 150 125 110 27.5 66.24 30.7 50.4 * 45 2.6 2.3 3136.7 1853.25 507.75 272.44 150 125 110 27.5 66.24 0.38 30.7 62 60 150 110 100 30 66.24 30.8 69 75 1.90 17.97 3044.1 1854.39 490.82 295.59 150 110 100 30 66.24 0.4 30.8 90 150 110 100 30 66.24 30.8 52
105 1.95 16.4 3343.2 1843.18 492.07 306.57 150 110 100 30 66.24 30.8 120 150 110 100 30 66.24 0.35 30.8 60.2 135 1.97 17.69 3563.27 1856.91 506.42 314.79 150 110 100 30 66.24 30.8 60.2
* Taken in buckets and kept in cold store at 2° C. Where, Min= Minutes, Per= Permeate, Ret= Retentate, Freq= Frequency, Temp= Temperature, TMP= Transmembrane pressure.

81
Figure 3.1 A) Urschel mill B) Bladder Press (Top and side view)

82
Figure 3.2 Photograph of microfiltration unit with its parts
Retentate tank Permeate
tank
Control panel
Microfilter tubes

83
Fig 3.3 Extraction tank with gas fired heater

84
(A) (B) (A) (B)
Figure 3.4 Experimental schemes for making grape extract from muscadine pomace
Slurry obtained is passed through bladder press and a second bag filter
of finer mesh size (50µ)
Microfilter
Microfilter
Retentate Permeate
Retentate Permeate
Aqueous extracts
Powder
Muscadine pomace
Protect antioxidants by nitrogen flushing and addition of ascorbic acid (0.1%)
Macerate fruit by high efficiency grinder Urschel Comitrol
Heat to 60°C
Incubate with Pectinase enzyme @ 1ml/kg
Direct extraction of Juice/water extraction (Bladder Press) Pectinase T=60°C; 3h
Spray dry
Without Bladder Press With Bladder Press
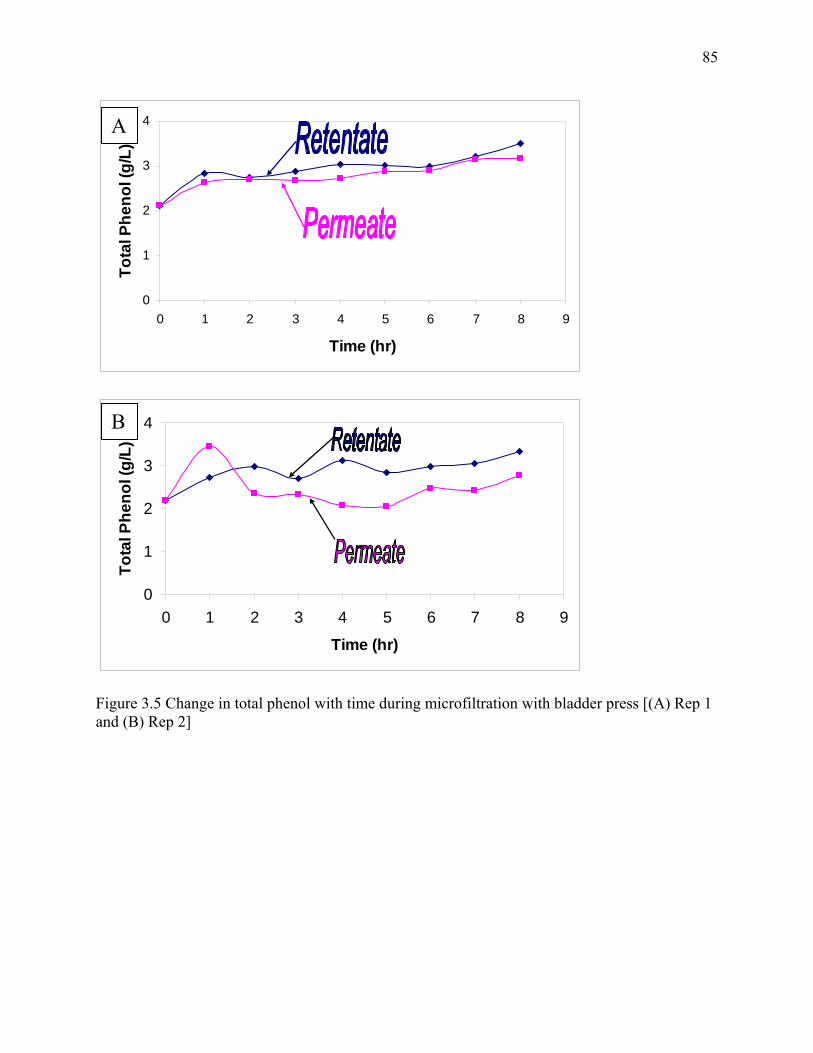
85
0
1
2
3
4
0 1 2 3 4 5 6 7 8 9
Time (hr)
Tota
l Phe
nol (
g/L)
0
1
2
3
4
0 1 2 3 4 5 6 7 8 9
Time (hr)
Tota
l Phe
nol (
g/L)
Figure 3.5 Change in total phenol with time during microfiltration with bladder press [(A) Rep 1 and (B) Rep 2]
A
B

86
00.10.20.30.40.50.60.70.8
0 1 2 3 4 5 6 7 8 9
Time (hr)
To
tal
An
tho
cy
an
ins
(g
/L)
0
0.1
0.2
0.3
0.4
0.5
0.6
0.7
0.8
0 1 2 3 4 5 6 7 8 9
Time (hr)
Tota
l Ant
hocy
anin
s(g
/L)
Figure 3.6 Change in total anthocyanins with time during microfiltration with bladder press [(A) Rep 1 and (B) Rep 2]
A
B

87
0
1
2
3
4
0.0 0.5 1.0 1.5 2.0 2.5
Time (hr)
Tota
l Phe
nol (
g/L)
0
1
2
3
4
0.0 0.5 1.0 1.5 2.0 2.5
Time (hr)
Tota
l Phe
nol (
g/L)
Figure 3.7 Change in total phenol with time during microfiltration without bladder press [(A) Rep 1 and (B) Rep 2]
A
B

88
0
0.2
0.4
0.6
0 0.5 1 1.5 2 2.5
Time (hr)
Tota
l Ant
hocy
anin
s (g
/L)
0
0.1
0.2
0.3
0.4
0.5
0.6
0 0.5 1 1.5 2 2.5
Time (hr)
Tota
l Ant
hocy
anin
s (g
/L)
Figure 3.8 Change in total anthocyanins with time during microfiltration without bladder press [(A) Rep 1 and (B) Rep 2]
A
B

89
0
5
10
TP TA TP TA
Rep 1 Rep 2
Enzyme TrtAfter BPAfter MF
Where BP= Bladder Press, MF= Microfiltration Figure 3.9 Change in concentration of total phenols, TP (g/kg) and total anthocyanins, TA (g/kg) at different processing steps with bladder press
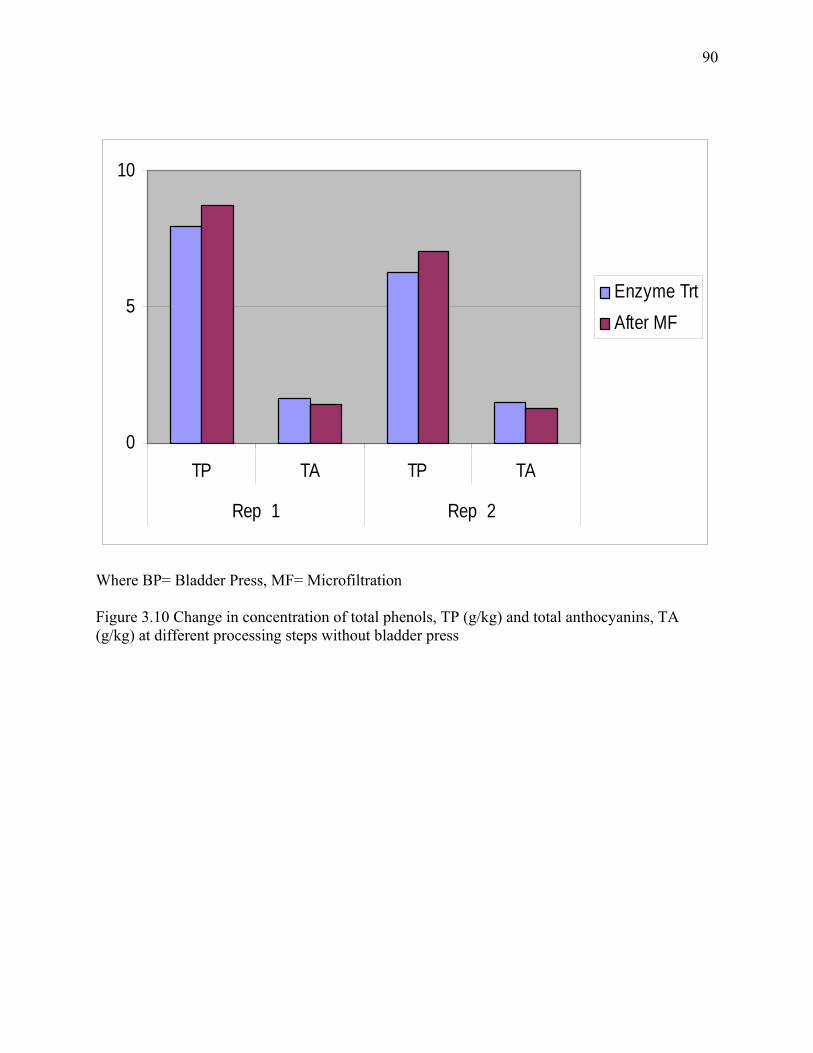
90
0
5
10
TP TA TP TA
Rep 1 Rep 2
Enzyme TrtAfter MF
Where BP= Bladder Press, MF= Microfiltration Figure 3.10 Change in concentration of total phenols, TP (g/kg) and total anthocyanins, TA (g/kg) at different processing steps without bladder press

91
REFERENCES
Adams JB. 2006. Thermal degradation of anthocyanins with particular reference to the 3-
glycosides of cyanidin. I. In acidified aqueous solution at 100°C. J Sci Food Agric 24(7):747-
762.
Bagchi D, Bagchi M, Stohs SJ, Das DK, Ray SD, Kuszynski CA, Joshi SS, Pruess HG. 2000.
Free radicals and grape seed proanthocyanidin extract: importance in human health and
disease prevention. Toxicology 148:187-197.
Biswas R. 2007. Development of technologies for the production of polyphenolic
neutraceuticals from muscadine grapes and rabbiteye blueberries (Phd Thesis). Athens, Ga.:
University of Georgia. 332p.
Bucic-Kojic A, Planinic M, Tomas S, Bilic M, Velic D. 2007. Study of solid-liquid extraction
kinetics of total polyphenols from grape seeds. J Food Eng 81: 236-242.
California Rare Fruit Growers, Inc. (1999).
http://www.crfg.org/pubs/ff/muscadinegrape.html.
Chamul SR. 1990. Process mass and energy balances, physico chemical changes during
processing and storage, and pigment composition of bronze muscadine grape juice. Chapter 3
Materials and methods (MS Thesis). Mississippi, MS.:Mississippi State University. 80p.
Georgia faces
http://georgiafaces.caes.uga.edu/getstory.cfm?storyid=2301
Hang YD. 1988. Recovery of food ingredients from grape pomace. Process Biochem 23:2-4.
Kammerer D, Claus A, Schieber A, Carle R. 2005. A novel process for the recovery of
polyphenols from grape (Vitis vinefera L.) pomace. J Food Sci 70:C157-C163.
Katz F. 2004. The natural color of health. Food Processing 65(4):54.

92
Krifi B, Chouteau F, Boudrant J, Metche M. 2000. Degradation of anthocyanins from blood
orange juices. Int J Food Sci Techn 35: 275-283.
Liu GW. 1999. Aroma impact compounds of muscadine grape pomace. Chapter 3. Materials
and Methods(MS Thesis). Mississippi, MS.: Mississippi State University. 39p.
Maccarone E, Maccarrone A, Rapisarda P. 1985. Stabilization of anthocyanins of blood orange
fruit juice. J Food Sci 50: 901-904.
Meschter EE. 1953. Effects of carbohydrates and other factors on color loss in strawberry
products. J Agric Food Chem 1: 574-579.
Morris JR, Brady PL. 2004. The Muscadine experience: Adding value to enhance profits. 76p.
Nawaz H, Shi J, Mittal G, Kakuda Y. 2006. Extraction of polyphenols from grape seeds and
concentration by ultrafiltration. Sep Purif Technol 48: 176-181.
Nebesky EA, Esselen WB, Jr., McConnell JEW, Fellers CR. 1949. Stability of color in fruit
juices. Food Research 14: 261-274.
Pastrana-Bonilla AC, Sellappan S, Krewer G, Akoh CC. 2003. Phenolic content and antioxidant
capacity of muscadine grapes. J Agric & Food Chem 51:5497-5503.
Rektor A, Vatai G, Bekassy-Molnar E. 2006. Multi-step membrane processes for the
concentration of grape juice. Desalination 191: 446-453.
Rektor A, Pap N, Kokai Z, Szabo R, Vatai G, Molnar EB. 2004. Application of membrane
filtration methods for must processing and Preservation. Desalination 162, 271-277.
Schieber A, Kammerer D, Stingzing FC, Carle R. 2001. By-products of plant food processing as
a source of functional compounds-recent developments. Trends Food Sci Technol 12:401-
413.
93
Shi J, Nawaz H, Pohorly J, Mittal G, Kakuda Y, Jiang Y. 2005. Extraction of polyphenolics from
plant material for functional foods-Engineering and technology. Food Rev Int 21: 139-166.
Spigno G, Tramelli L, De Faveri. 2007. Effects of extraction time, temperature and solvent on
concentration and antioxidant activity of grape marc phenolics. J Food Eng 81: 200-208.
Thakur BR, Arya SS. 1989. Studies on stability of blue grape anthocyanins. Int J Food Sci Tech
24: 321-326.
Zaid SS, Roger S, Reginald W. 2006. Seperation and concentration of health compounds by
membrane filtration. Int J Food Eng 2 (4):1-16.
Zemen JL, Zydney AL. 1996. Process configurations. ln: Zemen JL, Zydney AL, editors.
Microfiltration and Ultrafiltration. New York: Marcel Dekker. P 380-396.

94
CHAPTER 4
MICROENCAPSULATION OF GRAPE EXTRACTS WITH WHEY PROTEIN
CONCENTRATE AND GUM ARABIC USING SPRAY DRYING AND STORAGE STUDIES
ON RESULTING MICROCAPSULES
________________________________________________________________________ Ray N., Chinnan M. S., and Phillips R.D. To be submitted in Journal of Food Science
95
ABSTRACT
Muscadine pomace is rich source of polyphenols which are known to have lot of health
benefits including protection against oxidation of high density lipids, while helping to lower low
density lipids, anti-ulcer, anti-carcinogenic and anti mutagenic activities.
These extracts are high in total phenol but unstable due to oxidation and so were
microencapsulated. Microencapsulation also protects the phenols in powder by making them
free flowing and preventing stickiness. Morphology of microcapsules was studied with scanning
electron microscope (SEM) and particle size using Mastersizer. Accelerated shelf life testing
was carried out under various environmental conditions of temperature (4 and 25 ˚C), humidity
64%, UV light and dark condition, coating materials (gum arabic and whey protein) and one
uncoated sample, bladder press and no bladder press in sealed containers for 8 weeks. It was
observed that maximum degradation was observed in uncoated sample followed by whey protein
and gum arabic coating.
Key words: Muscadine pomace, accelerated shelf life testing, SEM, whey protein, gum arabic
96
INTRODUCTION
Microencapsulation is defined as the technology of packaging solids, liquids, or gases in
miniature, sealed capsules that can release their contents at controlled rates under specific
conditions (Dziezak 1988). Shahidi and others (1993) reported that the miniature packages called
microcapsules may range in diameter from few micrometers to several millimeters. The
microcapsules have ability to preserve a substance in a finely divided state and release it as
required. Their structure depends to a large extent on wall and core materials and drying
conditions. Microencapsulation is also used to prevent off-flavors produced by vitamins and
minerals, taste masking of certain food ingredients, prevent interaction among various food
ingredients, improve the stability and handling of colors, improve flavor and texture of food
products. There are many other advantages to microencapsulation of food such as protection of
core material from environmental conditions such as light, oxygen and water, to decrease the
transfer rate of core to environment, to control the release of core material or dilute the core
material as required, etc. Microcapsule offers the manufacturer a choice to protect the sensitive
food compounds, ensure against nutritional loss, utilize sensitive ingredients, incorporate unusual
or time-release mechanisms into formulation, mask or preserve flavors and aromas and transform
liquids to solid ingredients that are easier to handle. The properties that the encapsulated
ingredients provide give the food technologist greater choice in developing new food ingredients
that are not only more nutritious but meet the expectations of today’s consumer.
Spray drying is the most commonly used encapsulating technique in the food industry
because of cost considerations and flexibility (Desai and Park 2005). In this method the material
for encapsulation is homogenized with carrier material. The mixture is then fed into a spray

97
dryer and atomized with a nozzle or a spinning disc. Water is evaporated by hot air contacting
atomized material. The microcapsules are then collected after they fall to the bottom of drier.
Muscadine grapes are native to southeast United States. Hot and humid climate are
favorable for their growth. The fruits are round with a tough skin surrounding it. Muscadine
grapes and seeds are rich source of polyphenolic compounds (Yilmaz and others 2004; Bonilla
and others 2003).
Byproducts of grape industries are produced in large quantities every year and are
economically profitable but difficult to dispose off. Various by products are produced from
grape pomace such as colorants, ingredients for the food and beverage industry, dried fruit and
nut mixtures, nutraceuticals, grape seed oil and grape seed powder. The spray dried extracts
prepared after microfiltration are hygroscopic because they contain sugars and are not shelf
stable as they absorb moisture and degrade. The problem of stickiness is also caused by very
low glass transition temperatures (Tg) of glucose, fructose, tartaric acid, citric acid, and other
small molecular weight sugars. It is therefore essential to add high molecular weight compounds
having high Tg so as to have successful drying under practical conditions (Adhikari and others
2005). Microencapsulation also provides a protective coating to the spray dried product and
prevents it from oxidation.
The current extracts from fruits high in phenolic compounds available in the market are
highly pure and expensive at the same time. The aim of this project is to have a low cost
alternative to long extraction and purification procedures for total phenol and anthocyanin from
muscadine pomace by coating the extracts obtained with two materials and examine their effect
on storage stability of total phenol. The specific objectives of this experiment are 1) To develop
a low cost alternative to long extraction and purification procedures for extraction of total phenol

98
which can be utilized by the producers at producer level. 2) To prepare microencapsulated
grape extract powder using two coating materials (gum arabic and whey protein) and without
coating, characterize microcapsules using SEM and particle size analysis. 3) To evaluate
degradation of total phenol over time by storing at different environmental storage conditions.
MATERIALS AND METHODS
Samples
Grape extract samples were produced following the extraction procedure in fig 4.1. P1
and P2 were permeate samples produced without bladder press. P3 and P4 were permeate
samples produced with bladder press. C3 and C4 were retentate samples produced with bladder
press. These samples were microencapsulated with gum arabic (GA) and whey protein
concentrate (WP) and then subjected to storage study.
Chemicals
Gallic acid, sodium bicarbonate, TCA (Trichloro acetic acid) and Folin-Ciocalteau
reagent were purchased from Sigma Aldrich (St. Louis, MO, USA). Ethanol (95%) and
isopropyl alcohol (99.9%) were obtained from Central Research Store at UGA. Whey protein
concentrate-80 (WP) was obtained from Glanbia Foods (East Gooding, ID, USA) whereas gum
arabic was provided by TIC gums (Belcamp, MD). Composition of WP was protein (dry basis) –
79.3%, moisture – 3.7%, fat - 8.9% while composition of gum arabic was carbohydrate (dry
basis) - 85%, moisture -10%, protein-2%.
Microencapsulation of Grape Extract with Gum Arabic and Whey Protein Concentrate by Spray Drying
Eighty grams of whey protein was hydrated for one hour in 320 ml of grape extract. The
total solids of solution was kept at 20% w/v. The solution was homogenized using a high speed
shear stirrer LabTek (Omni International Inc, Gainesville, VA) at 8000 rpm for 10 minutes. The

99
procedure was repeated using gum arabic as coating material. The solution was covered with an
aluminum foil at all times and homogenization was carried out under yellow light conditions.
Solution of grape extract without any coating material was also taken for spray drying. The three
solutions were spray dried using spray dryer (Anhydro Inc., Olympia Fields, IL) at a feed rate of
57-65 ml/min, inlet air temperature 190°C, outlet air temperature 90°C, atomizer speed of 30,000
rpm (60% of maximum 50,000rpm). The powders obtained from spray drier were then stored in
amber colored air tight glass containers flushed with nitrogen gas and stored in freezer at -20°C
until further use.
Particle Size Distribution (PSD)
Particle size analysis was done using Malvern Mastersizer S laser diffraction system with
QSpec small volume sample dispersion unit operating at 2300 rpm (Malvern Instruments,
Worcestershire, U.K.). Mastersizer type used was S 300 RF with particle size range between 0.5
to 900 μm. The Mastersizer S uses the mie theory of light diffraction for particle size
measurement which assumes an equivalent sphere size of particles and performs particle size
calculations on the fact that angle of light diffraction is inversely proportional to particle size
(Rawle 2002). The 10% (w/w) solution of spray dried powder was prepared in deionized water
and allowed to hydrate for 10 minutes and stirred before applying to dispersion unit of the
mastersizer. The powders were further suspended in ethanol and isopropanol using the above
protocol to determine particle size distribution due to medium changes. Before proceeding with
determination of particle size distribution, we checked the percentage of particles retained by
suspending sample in different mediums. The raw measurement data obtained from the
mastersizer consisted of particle size distribution PSD (di = 0.05-865 μm) of the respective
sample expressed as volumetric mean diameter of particles. Additionally, particle size

100
percentiles, summary statistics of PSD was calculated using the mastersizer data acquisition
software package (Mastersizer S long Bed v2.19). Triplicate samples were evaluated for each
type of spray-dried powder. Since the results obtained for Isopropyl alcohol and ethyl alcohol
were similar, we have represented the results for ethyl alcohol.
Scanning Electron Microscope (SEM)
Morphology of microcapsules was observed using scanning electron microscope LEO
982 (FE-SEM, Carl Zeiss SMT Inc. One Corporation Way, Peabody, MA 1960) using
methodology described by Sheu and Rosenberg (1998). The powders were fixed on 10 mm stubs
with double sided adhesive tape which were made electrically conductive by coating under
vacuum with gold using SPI-module sputter coater for 60 seconds (15.3 nm; it is thickness of
gold coating). Digital images were obtained in the slow scan mode, working distance of 4mm,
excitation voltage of 3kV, resolution of 1024*768 pixels and magnification varying from 50 to
50,000X.
Microencapsulation Yield (MEE)
In order to determine MEE of microencapsulated whey protein powder, 100mg of
microencapsulated (whey protein) grape extract powder was taken and dissolved in 15ml of
deionized water. Subsequently, 10ml of 33% trichloro acetic acid solution was added to it for
precipitating proteins. This solution was centrifuged in an induction drive centrifuge (Beckman
J2-21M, Fullerton, CA) at 14000 RPM for 15 minutes. The supernatant was taken in 25ml
volumetric flask and made upto mark with deionized water (Georgetti and others 2007). In order
to determine MEE of microencapsulated gum arabic powder, 100mg of microencapsulated (gum
arabic) grape extract powder was taken and 1.0 ml of water was added to it and stirred for 5
minutes. Further 20 ml of 80% ethyl alcohol was added and stirred for 15 minutes. The ethanol
101
solution was centrifuged at 14000 rpm for 20 minutes and supernatant fractions collected in 25ml
of volumetric flask where volume was made up to mark with deionized water (Zhang and others
2007; Ersus and Yurdagel 2007). Supernatant fraction was taken from volumetric flask and
analyzed for microencapsulation yield using the Folin Ciocalteau method and the absorbance
was compared against standard solution of gallic acid at λmax= 766 nm using Hewlett Packard
8451A diode array spectrophotometer (Avondale, PA, USA). For determination of total phenol
concentration, equivalent amount of gum arabic absorbance at 766 nm was subtracted from total
absorbance of microencapsulated gum arabic. Experiments were done in duplicate and MEE
was determined based on formula given below.
Accelerated Shelf Life Testing
Microencapsulated grape extract coated with whey protein concentrate and gum arabic
were spread in small sample cups and care was taken to see that the layer of powder did not
exceed few millimeters so as to avoid uneven exposure to humidity and ultraviolet (UV) light
conditions. Two wooden chambers were constructed for storage at 4 and 25 ˚C and each wooden
chamber had two shelves (fig 4.2). The upper top shelf was fitted with black light which emitted
UV light confined to top shelf. The UV light intensity was measured by UVX Radiometer
(Upland, CA, USA). The UV light intensity of the lights was 83µW/cm2 . We checked the UV
light intensity emitted by direct Sun and it was 65 µW/cm2. The UV light intensity after it passed
through the glass lid was 16.5 µW/cm2 and when it passed the semi permeable cloths cover the
intensity was 10.7 µW/cm2 .Dark conditions were maintained in bottom shelf. Both the shelves
were covered with opaque black plastic covers to avoid outside light exposure. The small sample
Total Phenol- Extractable Phenol = X 100Microencapsulation efficiency
Total Phenol

102
cups were covered with transparent loosely knitted cloth to allow the passage of UV light and
moisture but which would prevent cross-contamination between samples (fig 4.3). Saturated salt
solutions of sodium bromide, sodium nitrite were prepared and transferred to transparent glass
display jars where they would generate water activity of 0.64 at 4 and 25 °C
(http://tinyurl.com/6res2e), respectively. The RH inside the glass display jars was monitored
using temperature-humidity data loggers. The top of display jar was sealed with airtight lid.
Once saturated salt solutions reached the optimum RH levels, sample cups containing spray-
dried microcapsules were kept inside. There were three powder types 1) Pure grape extract
sample, 2) microencapsulated grape extract with whey protein and 3) microencapsulated grape
extract with gum arabic. Again there were three sample types in each powder types. P1 and P2
were samples of permeate without bladder press, P3 and P4 were samples of permeate with
bladder press and C3 and C4 were retentate samples with bladder press. The concentration of
total phenol on day one is considered as zero week sample. Samples were taken out every week
for 8 weeks, from glass containers to determine the change in total phenol content and returned
to the glass containers.
Total Phenol
Total phenol was estimated colorimetrically using the Folin-Ciocalteau method
(Singleton and Rossi 1965). A sample aliquot of 200µL was added to 800 µL of deionized
water, 5 mL of Folin-Ciocalteau reagent, and 4 mL of saturated sodium carbonate solution
(75g/L) and mixed in vortex stirrer (Fisher vortex Genie 3, Fisher Scientific, Pittsburgh, PA).
The absorbance was measured at 765nm with a Hewlett Packard 8451A diode array
spectrophotometer (Avondale, PA) after incubation for two hours at room temperature (~25°C).
Quantification was based on the standard curve generated with 0, 50, 100, 200, 300, 400, 600,

103
800 and 1000 mg/L of gallic acid. The final concentration of total phenol in extract samples was
calculated as mg/L. The experiment was conducted under yellow light.
Statistical analysis
Linear regression analysis was used to obtain the degradation rate constants (k) for all the
samples studied. The standard errors of the rate constant k (sk, standard errors of the slope) were
calculated using (SAS Proprietary Software, 2003-2005), Release 9.1 for Windows (SAS
Institute Inc., Cary, NC) and for determining the correlation coefficients.
RESULTS AND DISCUSSION
Particle Size Distribution
The particle size distribution of spray dried powder particles was carried out in solvents
ethyl alcohol and water (Table 4.1). To determine the solubility in different solvents the
particles were dissolved in ethyl alcohol and isopropyl alcohol. One gram of sample was taken
and dispersed in 50 ml of solvent (deionized water, 50% ethanol, 95% ethyl alcohol, 99%
isopropyl alcohol); stirred for 5 minutes and kept undisturbed for 15 minutes before being
filtered through Whatman filter paper no 42. The filter paper has a cutoff size of 2.5 μm. The
weight of particles retained after passing through the filter paper was recorded. It was observed
that with deionized water 2.03% of particles were retained, with 50% ethyl alcohol 7.05% of
particles were retained and with 95% ethyl alcohol and 99% isopropyl alcohol 89% of the
particles were retained. This indicated that the particle size using ethanol and isopropyl alcohol
were substantially different than that obtained with water. The mean particle size ranged from
1.04µm to 92.70µm when using water as dispersant; ranged from 23.14µm to 92.70µm when
using ethyl alcohol as dispersant. The particle size distribution of particles in ethyl alcohol and
water and cumulative percentage of particles is shown in fig 4.4 and 4.5 respectively. While

104
measuring size of particles made from whey protein using water and ethyl alcohol as dispersant
the mean size was around 15µm and 50 µm, respectively. While measuring size of particles
made from gum arabic using water and ethyl alcohol as dispersant the mean particle size was
around 15µm and 40µm, respectively. The change in the particle size is attributed to change in
solubility of particles in different solvents. It also indicates that it is better to use a dispersant
other than water for particle size distribution as particles got solublized in water resulting in
erroneous results for particle size distribution.
Scanning Electron Microscopy Particles made without any wall material were more solid and compact compared to particles
with wall material (fig 4.6). The outer wall material affected the morphology and structure of the
spray-dried microcapsules. It was observed that the structure was more spherical with whey
protein compared to gum arabic (fig 4.7 and 4.8). Smaller capsules exhibited deep surface dents
indicating solidification of the walls prior to onset of expansion (Sheu and Rosenberg 1998).
The wall of microcapsule made of gum arabic is more homogenous, compact and thick as
compared to whey protein where the wall is thin and has some voids in it (fig 4.7 and 4.8).
Further (fig 4.8D, 4.8E and 4.8F) it is seen that there are voids in the microcapsule wall (whey
protein) and pores on the wall surface which are absent in fig 4.7B, 4.7C and 4.7D microcapsule
wall (gum arabic), respectively.
The micrographs of microcapsules also show that indentation of surface is more prevalent
in smaller particles than larger ones indicating that solidification of walls occurred prior to
expansion of microcapsules (fig 4.7A, 4.7C and 4.8C). It can also be attributed to drying rate.
High drying rates, associated with small particles usually lead to rapid wall formation and
preventing occurrence of dent smoothening.

105
Spray dried particles are usually hollow particles. Figure 4.7B, 4.7D, and 4.8D indicate
that there is a vacuole in the microcapsule center which occupies most of microcapsule volume.
Vacuole formation happens from a shrinking process that occurs after case hardening of the outer
surface followed by expansion of air bubbles trapped inside the droplet.
Spray-dried microcapsules with wall material consisting of polysaccharides exhibit
considerable surface indentations and the formation of indentations has been attributed to the
effects of wall composition, atomization and drying parameters, uneven shrinkage at early stages
of drying, and to the effect of a surface tension-driven viscous flow (Sheu and Rosenberg 1998).
The thermal expansion of air or water vapor inside the drying particles also known as
“ballooning” associated with high drying rates can smooth out dents to a large extent. The rate at
which the dent smoothes out is dependent on the drying rate and viscoelastic properties of the
wall matrix. Results from fig 4.7 and 4.8 indicate that surface indentation was more prevalent in
small particles than in large ones.
Microencapsulation Efficiency (MEE)
Microencapsulation efficiency (MEE) represents the degree of retention of the core, the
active ingredient within the wall material. The most useful microencapsulation process would
lead to a least loss of the core material from the wall material and is a useful determination in
selecting the wall material. Among the most important variables affecting the retention of the
core are the choice and concentration of wall solids, the mass ratio of wall to core,
physiochemical properties of wall and core components, and physical properties of the emulsion
prior to drying, and drying conditions. High drying rates that lead to a fast formation of crust
around the drying droplets favor high retention as long as no structural damage is introduced.
Microencapsulation efficiency (MEE) was determined by extracting total phenols after spray

106
drying process. The microencapsulation yield of grape extract with whey protein and gum arabic
was 99.15% and 88.15%, respectively.
Accelerated Shelf Life Testing
In our study, we examined the effects of temperature (4 and 25 °C); light conditions (UV
light and dark condition); coating materials (gum arabic and whey protein concentrate) vs. no
coating material; effect of processing method (with bladder press vs. without bladder press) on
the degradation kinetics of total phenol. Degradation kinetics of total phenol in pure grape
extract powder, grape extract powder microencapsulated with gum arabic, and grape extract
powder microencapsulated with whey protein is shown in fig 4.9-4.10, 4.11- 4.12, 4.13- 4.14,
and Table 4.2-4.3 respectively.
From fig.4.9 it is noted that the concentration of total phenol in permeate (P1) decreases
from 634.59mg/L to 574.92mg/L at 4 °C. It is observed from fig. 4.10 that concentration of total
phenol in permeate (P1) decreases from 634.59mg/L to 462.59 mg/L at 25 °C. It is also seen
from fig 4.10 that the concentration of total phenol in retentate (C3) decreases from 606.21 to
356.59mg/L under dark conditions and from 606.21 to 294.28mg/L under light conditions at 25
°C. This shows that there is more degradation at 25 °C compared to 4 °C and more in retentate
over permeate. As per study carried out by Chang and others (2006) on total phenol stability in
Hawthorn fruits and drink, they found that phenolic were stable at 4 °C but were relatively
unstable at higher temperatures (23 °C and 40 °C) with varying rates of degradation. At room
temperature of 23 °C there was degradation of 50% and 30% in epicatechin and procyanidin B2
after storage for period of 6 months.
In spray dried grape extract samples there is decrease in total phenol content from week
1 to week 8. The color of spray dried powder changes from purple to black at the end of week 8.
107
The structure of powder changed from free flowing to glassy to rubbery observed in both the
powders kept at 4 and 25 °C. It is observed from fig. 4.11 that concentration of total phenol in
permeate (P1) increased from 44.14 to 49.36mg/L and in retentate (C3) from 57.0 8 to 81.51
mg/L at 4 °C. It is observed from fig. 4.12 that concentrations of total phenol in permeate (P1)
increased from 44.14 to 46.03 mg/L and in retentate (C3) from 57.08 to 64.20 mg/L at 25 °C.
Singleton and Rossi (1965) reported that phenols react with protein and carbohydrates which
gives a higher total phenol reading than is expected. Kinetic studies on the degradation of
beetroot pigment encapsulated in three different polymer matrices (pullulan and two
maltodextrin samples) were carried out by Serris and Biliaderis (2001) under different water
activity and three different storage temperatures. The highest amount of rate constants for
degradation of pigments were observed at intermediate water activity level (aw=0.64) for all
matrices and all three storage temperatures studied. The reaction rates (K) increased with
increase in temperature. This trend can be explained by the fact that the degradation reaction is
controlled by the mobility of the reactants. This was also observed by Tandale (2007) which led
to selecting aw of 0.64 instead of using multiple water activities. In powders encapsulated with
gum arabic where there is an increase or no change in the total phenol concentration at 4 and 25
°C. It can be related to the protein fraction of gum arabic reacting with phenols forming
polymers and giving higher readings. The anthocyanin contents of encapsulated black carrot
powder which were encapsulated with three different coating materials was decreased by 33% at
end of 64 days storage period at 25 °C (Ersus and Yurdagel 2007). They reported that at 50 °C
stability of polar phenolic compounds was reduced to 72% over the initial value. In study
carried out on immature acerola juice (Righetto and Netto 2005) microencapsulation using
maltodextrins DE25, gum arabic, or a mixture of both in different proportions; the Tg of gum
108
arabic varied from 62 (aw =0.33) to 42.6 °C (aw =0.54), respectively. Tg decreased to 1.84-8.05
°C (aw=0.54) when juice from immature acerola was added. This is observed in
microencapsulated gum arabic powders made from grape extract in present study where the
powders were caking both at 4 °C and 25 °C which indicated that powder was near Tg and
therefore did not have significant changes in phenolic content over time. The powder color had
changed from pink to red over period of 8 weeks.
It is observed from fig. 4.13 that concentration of total phenol in permeate (P1) decreased
from 44.47 mg/L to 41.97 mg/L at 4 °C while on retentate (C3) it decreased from 59.31 mg/L to
51.50 mg/L at 4 °C. It is observed from fig. 4.14 that concentration of total phenol in permeate
(P1) decreased from 44.47 mg/L to 28.74 mg/L at 25 °C while on retentate (C3) side it
decreased from 59.31 to 26.48 mg/L at 25 °C. Thus there is a decrease in total phenol with
increase in temperature and more decrease is observed in retentate over permeate side. Cai and
Corke (2000) reported that in spray dried Amaranthus betacyanin extracts, the bulk density of
pigment powder decreased with increase in spray drying temperature. Although higher drying
rate was obtained at higher drying temperature, higher ratio of surface-to-volume for the spray
dried powder caused lower bulk density of the powder. The lower the bulk density, the more
occluded air within the powders and therefore, greater the possibility of oxidative degradation of
pigments and reduced storage stability. Also we observed (fig 4.8D, 4.8E and 4.8F) that there
are voids on the microcapsule and pores in microcapsule wall which are sources of oxidation.
The color of the sample was faint pink initially which turned to nearly white at the end of eight
weeks of storage.
109
Statistical analysis
The results of linear regression shows that samples (whey protein and no coating) follow
zero order reaction. Samples encapsulated with gum arabic seem to have increase in
concentration with storage time and do not follow any reaction order. The rate constants and the
half lives (table 4.2 and 4.3) of samples with whey protein coating and without any coating show
change with changes in temperature but do not show any change with change in light and dark
conditions. The half lives at 25 °C is one third to one fifth to that at 4 °C. It is found that (table
4.2) samples coated with whey protein which have a half life of 25 to 66 g/ml /week at 4 °C have
a half life of 8 to 10 weeks at 25 °C. It is found that samples coated with whey protein have a
rate constant of 0.3 to 3.7 g/ml /week; samples without coating have a rate constant from 7.0 to
45.0 g/ml /week depending on temperature. This indicates that it is beneficial to have a coating
of whey protein or gum arabic for protecting the phenolic antioxidants in the extract powder
which would degrade faster without any coating. The samples should be stored in closed airtight
containers at refrigerated temperature to have increased shelf life.
CONCLUSIONS
Microencpsulation of muscadine grape extract was carried out with two coating materials
whey protein and gum arabic. Particle size distribution was carried out on the encapsulated
particles and particle size was determined using scanning electron microscopy. Accelerated
shelf life testing was carried out by exposing the encapsulated and uncoated samples to various
environmental conditions. It was found that maximum degradation was observed in uncoated
samples followed by whey protein and gum arabic. The samples were shown to follow zero
order reaction and their half life was also determined using linear regression. The results of the

110
present study indicate that it is better to encapsulate samples with whey protein and gum Arabic
to have increase in shelf life.
ACKNOWLEDGEMENTS
The authors would like to thank Glanbia Foods Inc. for graciously providing whey
protein concentrate and TIC gums for providing gum arabic. The authors would like to thank Mr.
Glenn D. Farrell for his technical help and Jerry Davis for Statistical analysis. We would also
like to thank Dr. John Shields for his help preparing scanning micrographs.

111
Table 4.1 Particle size distribution of spray dried powder particles (in different dispersants)
Volume mean diameter of Particles* in
Dispersing Medium (μm) Sample
Type** Water Ethyl Alcohol
P1 18.02 75.38 P3 92.70 92.45 C3 1.04 23.14 WP P1 15.99 56.22 WP P3 14.80 50.20 WP C3 15.54 48.11 GA P1 20.82 43.18 GA P3 16.62 36.82 GA C3 3.50 39.22 *Average of triplicates **P1 and P3 - permeate, C3 - retentate, WP - whey protein, GA- gum arabic.
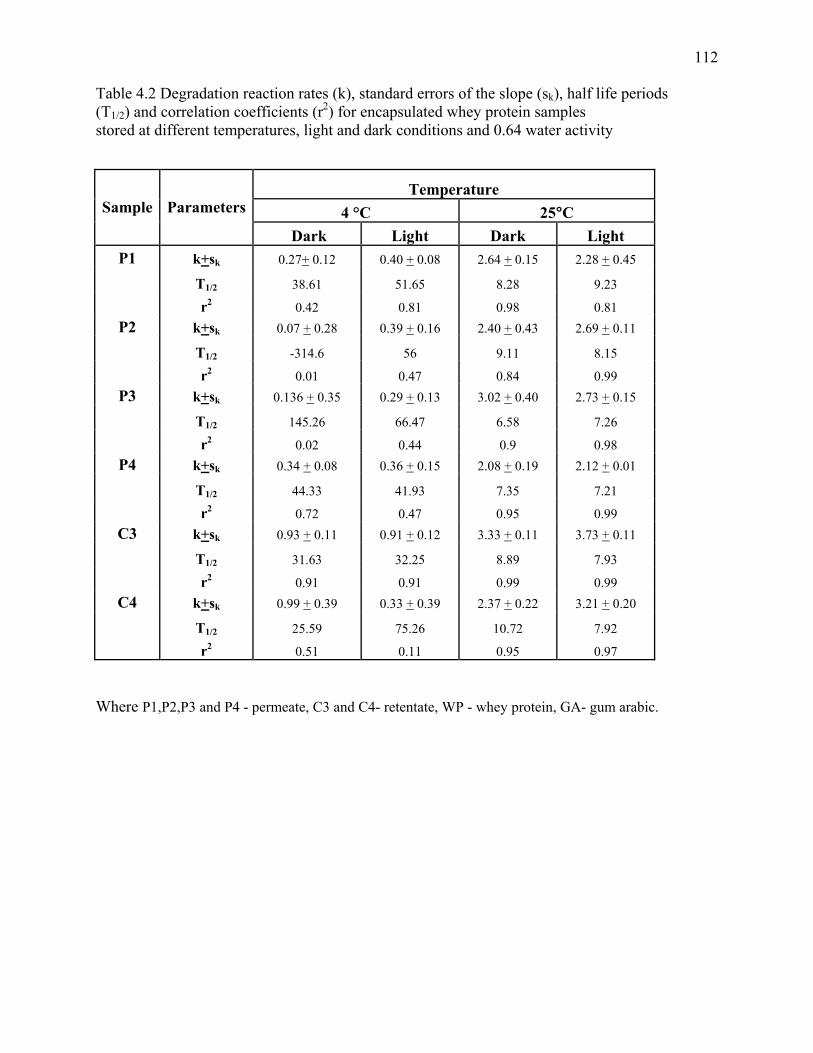
112
Temperature 4 °C 25°C Sample Parameters
Dark Light Dark Light P1 k+sk 0.27+ 0.12 0.40 + 0.08 2.64 + 0.15 2.28 + 0.45
T1/2 38.61 51.65 8.28 9.23
r2 0.42 0.81 0.98 0.81 P2 k+sk 0.07 + 0.28 0.39 + 0.16 2.40 + 0.43 2.69 + 0.11
T1/2 -314.6 56 9.11 8.15
r2 0.01 0.47 0.84 0.99 P3 k+sk 0.136 + 0.35 0.29 + 0.13 3.02 + 0.40 2.73 + 0.15
T1/2 145.26 66.47 6.58 7.26
r2 0.02 0.44 0.9 0.98 P4 k+sk 0.34 + 0.08 0.36 + 0.15 2.08 + 0.19 2.12 + 0.01
T1/2 44.33 41.93 7.35 7.21
r2 0.72 0.47 0.95 0.99 C3 k+sk 0.93 + 0.11 0.91 + 0.12 3.33 + 0.11 3.73 + 0.11
T1/2 31.63 32.25 8.89 7.93
r2 0.91 0.91 0.99 0.99 C4 k+sk 0.99 + 0.39 0.33 + 0.39 2.37 + 0.22 3.21 + 0.20
T1/2 25.59 75.26 10.72 7.92
r2 0.51 0.11 0.95 0.97
Where P1,P2,P3 and P4 - permeate, C3 and C4- retentate, WP - whey protein, GA- gum arabic.
Table 4.2 Degradation reaction rates (k), standard errors of the slope (sk), half life periods (T1/2) and correlation coefficients (r2) for encapsulated whey protein samples stored at different temperatures, light and dark conditions and 0.64 water activity

113
Temperature 4 °C 25°C Sample Parameters
Dark Light Dark Light P1 k+sk 7.45 + 0.39 8.61 + 0.82 21.50 + 1.44 25.31 + 13.63
T1/2 42.50 36.80 14.57 12.53
r2 0.99 0.99 0.77 0.99 P2 k+sk 13.41 + 0.94 7.06 + 1.27 22.94 + 4.75 26.32 + 12.84
T1/2 23.12 43.88 13.51 11.77
r2 0.99 0.96 0.80 0.96 P3 k+sk 11.96 + 0.56 7.07 + 0.005 23.87 + 7.32 25.33 + 9.61
T1/2 18.74 31.7 9.38 8.84
r2 0.99 1.00 0.88 0.91 P4 k+sk 7.37 + 1.76 2.30 + 3.15 24.65 + 9.52 27.63 + 3.03
T1/2 30.21 96.59 9.03 8.05
r2 0.94 0.35 0.98 0.87 C3 k+sk 10.58 + 0.41 11.68 + 0.32 31.20 + 10.56 40.19 + 8.88
T1/2 28.62 25.95 9.71 7.54
r2 0.99 0.99 0.95 0.89 C4 k+sk 18.61 + 0.70 18.64 + 0.70 37.81 + 11.90 45.39 + 10.10
T1/2 17.63 17.63 8.69 7.24
r2 0.99 0.97 0.95 0.91
Where P1,P2,P3 and P4 - permeate, C3 and C4 - retentate, WP - whey protein, GA- gum arabic.
Table 4.3 Degradation reaction rates (k), standard errors of the slope (sk), half life periods (T1/2) and correlation coefficients (r2) for samples without coating stored at different temperatures, light and dark conditions and 0.64 water activity

114
(A) (B) (A) (B)
Figure 4.1 Experimental schemes for making microencapsulated grape extract powder using gum arabic and whey protein and without any coating
Slurry obtained passed through bladder press and a second bag filter
of finer mesh size (50µ) Microfilter
Microfilter
Retentate C3, C4
Permeate P3, P4
Retentate Unusable
Permeate P1, P2
Aqueous extracts
Spray Dry
Muscadine pomace
Protect antioxidants by nitrogen flushing and addition of ascorbic acid (0.1%)
Macerate fruit by high efficiency grinder Urschel Comitrol
Heat to 60°C
Incubate with Pectinase enzyme @ 1ml/kg
Direct extraction of Juice/water extraction (Bladder Press) Pectinase T=60°C; 3h
Encapsulate with gum arabic and whey protein
Without Bladder Press
With Bladder Press
Powder

115
Figure 4.2 Wooden chambers fitted with black light to see effect on storage of powder
UV light source Top and
bottom shelf
Dark conditions
Glass containers
Wooden chamber

116
Figure 4.3 Photograph of spray dried powder in glass display jars (A) No lid (B) Lid and semi permeable cloths cover
B
A

117
-1
0
1
2
3
4
5
6
0 20 40 60 80 100 120 140
Particle Size (um)
Volu
me
(%)
Particle Size Distribution
0
1
2
3
4
5
6
7
0 20 40 60 80 100 120 140
Particle Size (um)
Volu
me
(%)
Figure 4.4 Particle size distributions of spray dried powder particles with medium [(A) Ethyl alcohol, (B) Water]
A
B

118
0
20
40
60
80
100
120
0 20 40 60 80 100 120 140
Cumulative (%)
Parti
cle
size
(um
)
0
20
40
60
80
100
120
0 20 40 60 80 100 120 140
Cumulative (%)
Parti
cle
size
(µm
)
Figure 4.5 Cumulative percentage particle size distribution in medium [(A) Ethyl Alcohol, (B) Water]
A
B
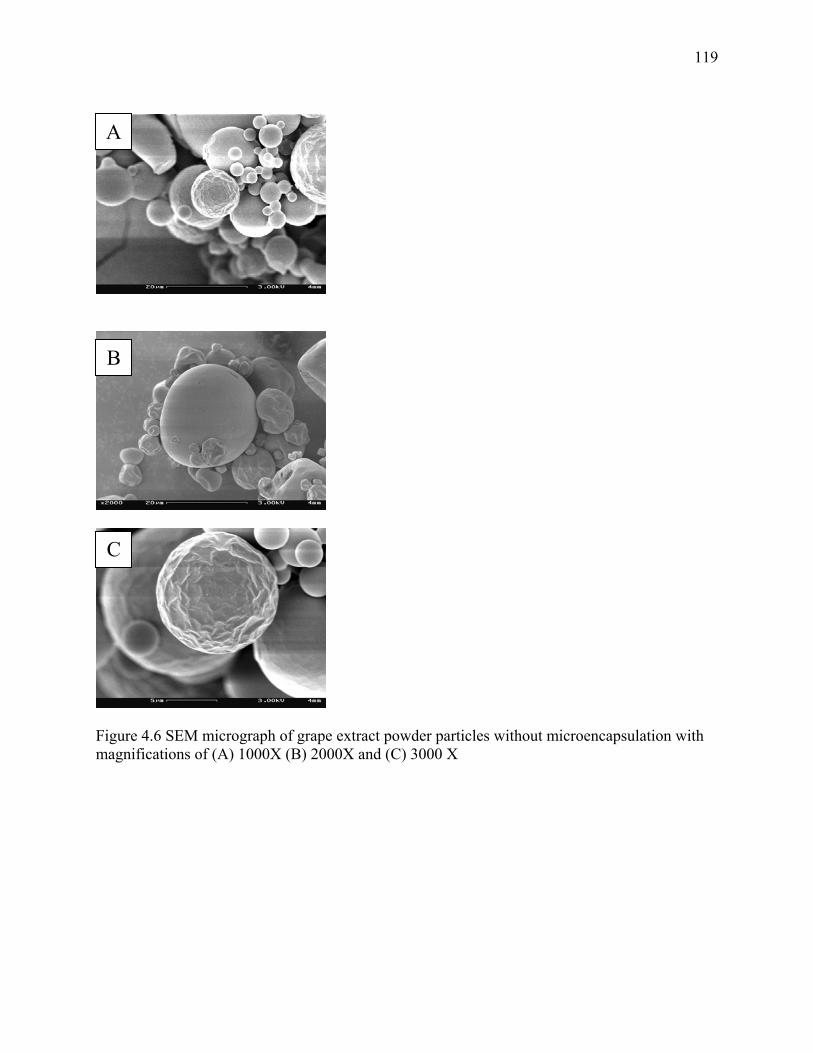
119
Figure 4.6 SEM micrograph of grape extract powder particles without microencapsulation with magnifications of (A) 1000X (B) 2000X and (C) 3000 X
A
B
C

120
Figure 4.7 SEM micrographs of grape extract microencapsulated with gum arabic coating with magnifications of (A) 2000X (B) Cut out of shell of gum arabic microcapsule with magnification 2000X (C) Magnified view of cut out of shell of microcapsule 3000X and (D) Magnified view of the cut out of shell wall of microcapsule 5000X
A B
C D

121
Figure 4.8 SEM micrographs of grape extract microencapsulated with whey protein coating with magnifications of (A) 100X (B) 1000X (C) 2000X (D) Broken hollow part of microcapsule 3000X (E) Magnified view of cut out of shell shown in fig 4.8D 20,000X and (F) Magnified view of fig 4.8 E 50,000X.
A B
C D
E F

122
0
200
400
600
800
0 1 2 3 4 5 6 7 8Week
Tota
l Phe
nols
(mg/
L)P1P2P3P4C3C4
0
200
400
600
800
0 1 2 3 4 5 6 8Week
Tota
l Phe
nols
(mg/
L)
P1P2P3P4C3C4
Figure 4.9 Degradation kinetics of total phenol in powder at 4 °C (A) Dark and (B) UV light conditions. Where P1,P2,P3 and P4 - permeate, C3 and C4 - retentate, WP - whey protein, GA- gum arabic.
A
B
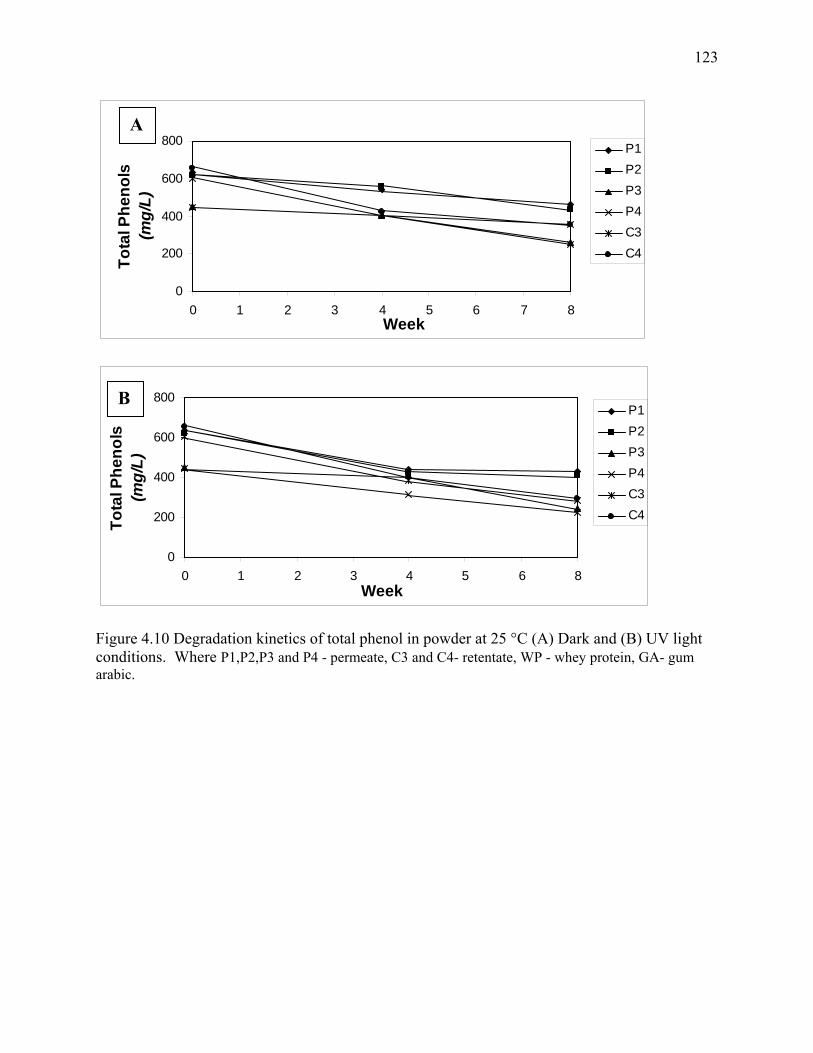
123
0
200
400
600
800
0 1 2 3 4 5 6 7 8Week
Tota
l Phe
nols
(mg/
L)P1P2P3P4C3C4
0
200
400
600
800
0 1 2 3 4 5 6 8Week
Tota
l Phe
nols
(mg/
L)
P1P2P3P4C3C4
Figure 4.10 Degradation kinetics of total phenol in powder at 25 °C (A) Dark and (B) UV light conditions. Where P1,P2,P3 and P4 - permeate, C3 and C4- retentate, WP - whey protein, GA- gum arabic.
A
B

124
0
10
20
30
40
50
60
70
80
90
100
0 1 2 3 4 5 6 7 8weeks
Tota
l Phe
nols
(m
g/L)
P1P2P3P4C3C4
0
10
20
30
40
50
60
70
80
90
100
0 1 2 3 4 5 6 7 8weeks
Tota
l Phe
nols
(m
g/L)
P1P2P3P4C3C4
Figure 4.11 Degradation kinetics of total phenol microencapsulated in gum arabic at 4 °C (A) Dark and (B) UV light conditions. Where P1,P2,P3 and P4 - permeate, C3 and C4 - retentate, WP - whey protein, GA- gum arabic.
A
B

125
0
10
20
30
40
50
60
70
80
90
100
0 1 2 3 4 5 6 7 8
weeks
Tota
l Phe
nols
(m
g/L)
P1P2P3P4C3C4
0
10
20
30
40
50
60
70
80
90
100
0 1 2 3 4 5 6 7 8
weeks
Tota
l Phe
nols
(m
g/L)
P1P2P3P4C3C4
Figure 4.12 Degradation kinetics of total phenol microencapsulated in gum arabic at 25 °C (A) Dark and (B) UV light conditions. Where P1,P2,P3 and P4 - permeate, C3 and C4 - retentate, WP - whey protein, GA- gum arabic.
A
B

126
0
10
20
3040
50
60
70
0 1 2 3 4 5 6 7 8
Week
Tota
l Phe
nols
(mg/
L)P1P2P3P4C3C4
0
10
20
30
40
50
60
70
0 1 2 3 4 5 6 7 8
Week
Tota
l Phe
nols
(m
g/L)
P1P2P3P4C3C4
Figure 4.13 Degradation kinetics of total phenol microencapsulated in whey protein at 4 °C (A) Dark and (B) UV light conditions. Where P1,P2,P3 and P4 - permeate, C3 and C4 - retentate, WP - whey protein, GA- gum arabic.
A
B

127
0
10
20
3040
50
60
70
0 1 2 3 4 5 6 7 8
Week
Tota
l Phe
nols
(mg/
L)P1P2P3P4C3C4
0
10
20
30
40
50
60
70
0 1 2 3 4 5 6 7 8
Week
Tota
l Phe
nols
(mg/
L)
P1P2P3P4C3C4
Figure 4.14 Degradation kinetics of total phenol microencapsulated in whey protein at 25 °C (A) Dark and (B) UV light conditions. Where P1,P2,P3 and P4 - permeate, C3 and C4 - retentate, WP - whey protein, GA- gum arabic.
A
B

128
REFERENCES
Adhikari B, Howes T, Lecomte D, Bhandari BR. 2005. A glass transition temperature approach
for the prediction of the surface stickiness of a drying droplet during spray drying. Powder
Technol. 149:168-179.
Chang Q, Zhong Z, Chow MS, Ho WK. 2006. Effect of storage temperature on phenolics
stability in hawthorn (Crataegus pinnatifida var. major) fruits and a hawthorn drink. Food
Chem 98:426-430.
Cai YZ, Corke H. 2000. Production and properties of spray-dried Amaranthus Betacyanin
pigments. J Food Sci 65:1248-1252.
Desai K, Park H. 2005. Recent developments in microencapsulation of food ingredients. Drying
Technol 23:1361-1394.
Dziezak JD. 1988. Microencapsulation and encapsulated ingredients. Food Technol 136-151.
Ersus S, Yurdagel U. 2007. Microencapsulation of anthocyanin pigments of black carrot
(Daucuscarota L.) by spray drier. J Food Eng 80:805-812.
Georgetti S, Casagrande R, Souza C, Oliveira W, Fonseca M. 2007. Spray drying of the soybean
extract: Effects on chemical properties and antioxidant activity. LWT-Food Sci & Technol
41(8):1521-1527.
Grattard N, Pernin M, Marty B, Roudaut G, Champion D, Le Meste M. 2002. Study of release
kinetics of small and high molecular weight substances dispersed into spray-dried
ethylcellulose microspheres. J Controlled Release 84:125-135.
Labuza TP. 2008. aw and Tg resource page. St Paul, MN: University of Minnesota. Available
from: http://tinyurl.com/6res2e. Accessed Nov 21.

129
Lee S, Rosenberg M. 2000. Preparation and some properties of water-insoluble, whey protein-
based microcapsules. J Microencapsulation 17(1):29-44.
Pastrana-Bonilla E, Sellappan S, Krewer G, Akoh CC. 2003. Phenolic content and antioxidant
capacity of muscadine grapes. J Agric & Food Chem 51:5497-5503.
Rawle A. 2002. The importance of particle sizing to the coatings industry Part 1: Particle size
measurement. Advances in Color Sci & Technol 5(1):1-12.
Reineccius G, Bangs W. 1985. Spray Drying of Food Flavors. III. Optimum infeed
concentrations for the retention of artificial flavors. Perfumer & Flavorist 27-29.
Righetto A, Netto F. 2005. Effect of encapsulating materials on water sorption, glass transition
and stability of juice from immature acerola. Int J Food Properties 8:337-346.
Rosenberg M, Sheu TY. 1996. Microencapsulation of volatiles by spray-drying in whey protein-
based wall systems. Int Dairy J 6:273-284.
Serris G, Biliaderis C. 2001. Degradation kinetics of beetroot pigment encapsulated in polymeric
matrices. J Sci Food & Agric 81:691-700.
Shahidi F, Xiao QH. 1993. Encapsulation of food ingredients. Critical Rev in Food Sci and Nutr
33(6):501-547.
Sheu TY, Rosenberg M. 1998. Microstructure of microcapsules consisting of whey proteins and
carbohydrates. J Food Sci 63(3):491-494.
Tandale S. 2007. Microencapsulation of Vitamin C and Gallic acid in whey protein concentrate
by spray and freeze drying- characterization and degradation kinetics (MS Thesis). Athens,
Ga.: University of Georgia. 142p.
Yilmaz Y, Toledo R. 2004. Major flavonoids in grape seeds and skins: antioxidant capacity of
catechin, epicatechin, and gallic acid. J Agric Food Chem 52:255-260.

130
Yoshii H, Soottitantawat S, Liu XD, Atarashi T, Furuta T, Aishima S, Ohgawara M, Linko O.
2001. Flavor release from spray-dried maltodextrin/gum arabic or soy matrices as a function
of storage relative humidity. Innov Food Sci & Emerging Technol 2:55-61.
Zhang L, Mou D, Du Y. 2007. Procyanidins: Extraction and microencapsulation. J Sci Food
Agric 87:2192-2197.

131
CHAPTER 5
SUMMARY AND CONCLUSIONS
Muscadine grapes are rich source of phenolics compounds which have excellent health
benefits like antiulcer, anti-carcinogenic, anti-ageing and also help in reducing the quantity of
HDL (high density lipids) while increasing the content of LDLS (low density lipids).
Microfiltration was carried out to examine the effects of microfiltration in extracting
phenolics compounds and preparing spray dried powders. Extraction was carried out by heating
muscadine grape pomace at 60 degree C for one hour with enzyme pectinase followed by
filtration first with bladder press and then microfilter. It was observed that the concentration of
total phenols increased after microfiltration (with or without bladder press) while the
concentration of total anthocyanins decreased during the same time. It was found that
microfilter; bladder press and enzyme treatment had significant effect on yield of total
anthocyanins. It was also found that the use of microfilter was significant to extraction of total
phenols but there was no significant effect with use of bladder press. It was found that there is
increase in concentration of phenols with temperature increase instead of observing a plateau
after a period of time.
Since grape extracts are high in phenolic compounds, it can be used to produce powders
which are high in nutraceutical content. However these compounds are prone to oxidation and
rapid degradation; microencapsulation was carried out to investigate the protective effects of
microencapsulation on the encapsulated phenolic compounds. Grape extract powder was
prepared using grape extract, microencapsulated with whey protein and
132
gum arabic; which were characterized using particle size distribution and SEM (Scanning
Electron Microscopy) analysis. It was seen that the outer wall material affected the structure and
morphology of microcapsules. The wall of microcapsules made of gum arabic was more
compact, homogenous, thick and had no pores on the wall surface as compared to whey protein
where the wall was thin and had more pores on the wall surface. The micrographs of the
capsules showed that greater indentation on particle walls for smaller size particles compared to
large ones indicating solidification occurred prior to expansion of the walls. The particle size
distribution varied considerably when using water and ethanol as dispersants during particle size
measurements. The mean particle size for particles encapsulated with whey protein in water was
15 µm whereas the same particle size was 50 µm dispersed in alcohol. The microencapsulation
yield of the particles ranged from 99.15% for whey protein and 88.15% for gum arabic.
The other aim of the project was to examine the effectiveness of microencapsulation by
coating with two materials gum arabic and whey protein and evaluate the degradation of total
phenol over time by storing at two temperatures (4 and 25°C), light and dark conditions and 0.64
water activity. It was found that maximum degradation occurred in the uncoated samples
followed by samples coated with whey protein and gum arabic, respectively. The color of
uncoated powder changed from purple to black whereas the appearance of powder changed from
free flowing to rubbery. In samples coated with whey protein the color of powder changed from
light pink to white at the end of eight weeks of storage whereas the appearance changed from
free flowing to caking. In samples coated with gum arabic the color of samples changed from
pink to red at the end of four weeks whereas the appearance of powder changed from free
flowing to caking. The concentration of total phenols decreased from 634.59 mg/L to 462.59
mg/L at 25 °C (uncoated sample). It was also observed that concentration of P1 (extract with

133
bladder press) increased from 44.14 to 46.04 mg/L at 25 °C in sample coated with gum arabic. It
was observed that concentration of P1 decreased from 44.47 to 38.74 mg/L at 25 °C in sample
coated with whey protein.
The half life of the samples was determined using linear regression. The samples
followed zero order rate of reaction. The half life of the samples was 32 to 52 weeks for samples
coated with whey protein coating stored at 4 °C while it was 7 to 11 weeks at 25 °C. The half
life of samples without any coating material was 18-44 weeks at 4 °C while it was 7 to 14 weeks
at 25 °C. This indicates that it is better to store the particles at 4 °C as compared to 25 °C.
Samples coated with gum arabic did not follow any trend and so half life could not be
determined for these samples.
The results of this study indicate that it is better to store the product at 4 °C as compared
to 25 °C. Microencapsulating the grape extracts definitely has benefits such as it protects the
structure and color of powder. It also helps in reducing the degradation rate. The half life
obtained using whey protein coating was 32 to 52 weeks at 4 °C at 0.64 water activity compared
to 18 to 44 weeks without any coating material. If we store the product in a controlled
environment such as air tight containers and low temperatures we should be able to obtain better
shelf life. It is therefore recommended to microencapsulate the grape extract using whey protein
to have longer shelf life for grape extract powder.