Embed Size (px)
Citation preview
0
MICROECONOMICS OF COMPETITIVENESS
COUNTRY: KENYA
CLUSTER: TEA
BY:
Marta Amde Philip Chan Mamo Mihretu Kaleb Tamiru
1
Kenya Summary Independence 1963 GDP per capita, PPP $1,542 Gini Index 48 Population 37,530,726 Life Expectancy at Birth 54 Land Area (sq. km) 56,9140 Source: WDI 2008
INTRODUCTION Unlike its neighbors, Kenya is located in East Africa
with good access to the sea. In 2007, its aggregate
GDP was composed of the service sector (59%),
agriculture (24%), and industry (17%) (EIU, 2009). It
has gained international prominence for its breadth of
tourism attractions as well as its location as a gateway
to Eastern Africa. Since independence, it has had three presidents: Jomo Kenyatta (1963
– 1978); Daniel Arap Moi (1978 – 2002); and Mwai Kibaki (2002 – Present).
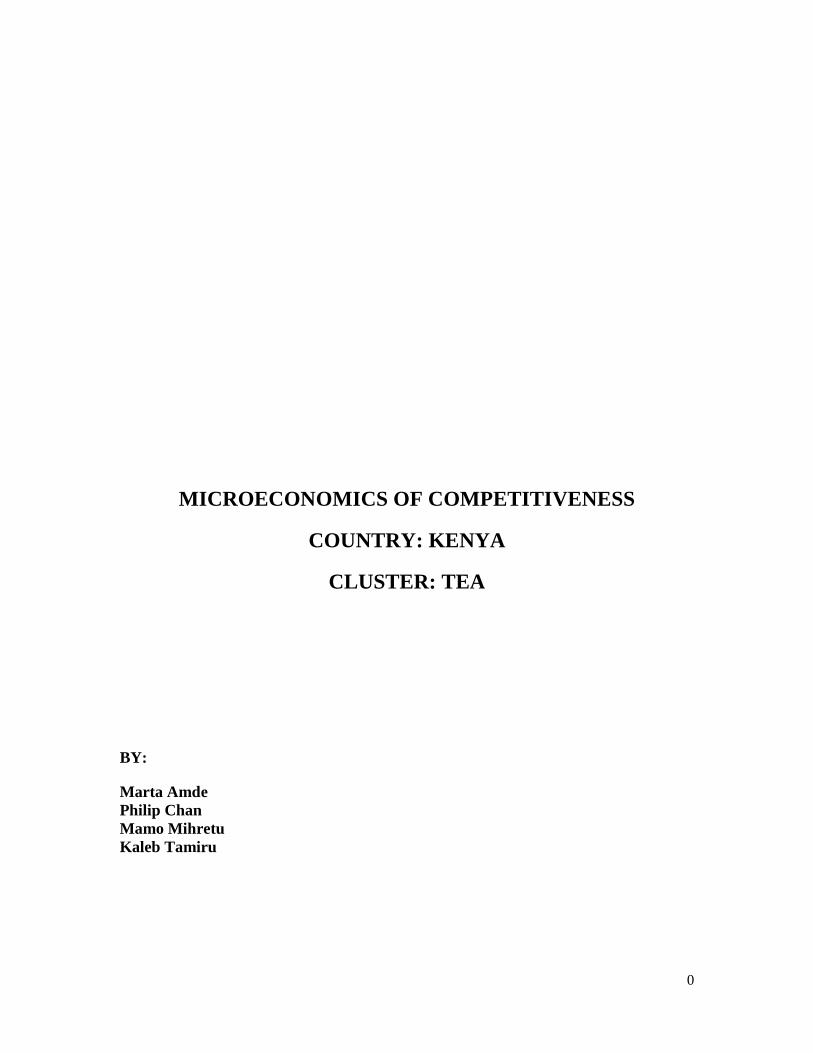
ECONOMIC PERFORMANCE Although Kenya’s PPP adjusted GDP per capita growth – from $ 31.42 in 1996 to $63.39
in 2009 - is commendable, it is outstripped by its neighbors from a relatively lower
starting point in 1996 (EIU, 2009).
Figure 1: Comparison of PPP Adjusted GDP Per Capita
Between the mid-1990s and 2007, the real GDP growth rate of Kenya has been modest
and steady. However, since 2007 it has been declining much faster than neighboring
countries (EIU, 2009). This has coincided with the post-election civil disturbances which
saw tourism receipts plummeting to a record low.
0.00
20.00
40.00
60.00
80.00
100.00
Sudan Ethiopia Kenya Tanzania
PPP Adjusted GDP Per Capita (USD)

2
Figure 2: Comparison of Real GDP Growth Rate
As figure 3 highlights, the clusters that have the highest volume in Kenya’s export share
are Agricultural Products, Transportation & Logistics, and Tourism & Hospitality.
However, their share in world export portfolio is very minimal. Moreover, its export
share of agriculture has been declining in recent years.
Figure 3: Kenya’s Export Performance in Goods by Cluster 1997-2003
POLITICAL CONTEXT
-20.00
-10.00
0.00
10.00
20.0019
90
1991
1992
1993
1994
1995
1996
1997
1998
1999
2000
2001
2002
2003
2004
2005
2006
2007
2008
2009
Real GDP Growth (%)
Ethiopia Kenya Sudan Tanzania Sub-Saharan Africa
Agricultural Products
Transportation & Logistics
Hospitality & Tourism
Apparel
Communication & Services
Metal Mining & Manufacturing
Tobacco
-0.300%
-0.200%
-0.100%
0.000%
0.100%
0.200%
-0.050% 0.000% 0.050% 0.100% 0.150% 0.200% 0.250% 0.300% 0.350%
Wor
ld E
xpor
t Sh
are
2007
Percentage Change in World Export Share (1997 - 2007)
Export Performance in Goods by Cluster, 1997 - 2007
Source: International Cluster Competitiveness Project

3
The political crisis and subsequent violence that ensued after the 2007 elections
was a blemish on Kenya’s reputation as a relatively stable country in its neighborhood.
In early 2008, supporters of President Kibaki and the opposition leader Raila Odinga took
an election dispute to street violence (Prunier, 2008). The crisis saw over 1000 people
dying and close to 350,000 displaced – causing major disruptions on economic activity
(IMF 2008). The tourism sector which accounts for 10.8 % of GDP and 8.7% of
national employment was hit the hardest with a 90 % decline in February 2008 (World
Travel & Tourism Council 2008)
Like in its neighbors, the socioeconomic condition of Kenya is beset with a public
health crisis. With HIV prevalence rate of 6.1% (one of the highest on the continent) in
the 15-49 age group, Kenya’s life expectancy has been eroded to 54 years at birth (HDR,
2008; WDI 2008). Furthermore, the Human Development Report ranked Kenya 148th
out of 177 countries (HDR, 2008). At the same time, primary and secondary school
enrollment rates have risen, thanks in large part to the abolition of school fees for primary
and secondary education in 2003 and 2008 respectively.
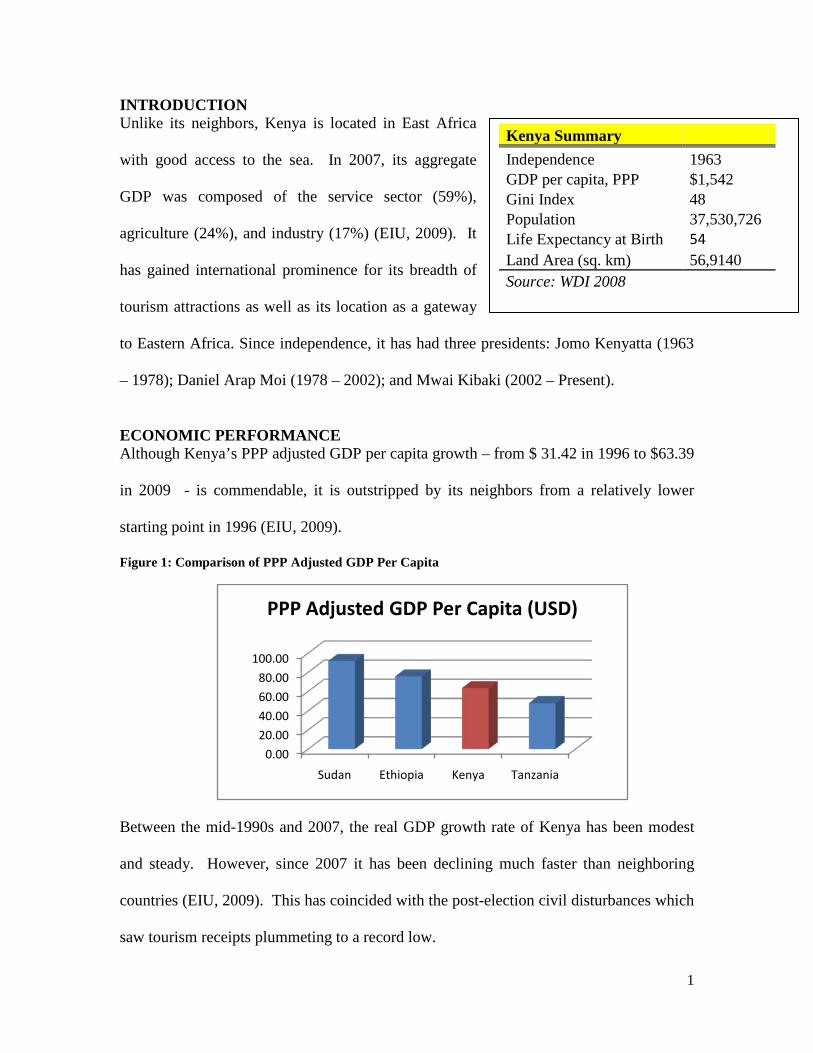
Although labor productivity is higher than the average in its neighborhood, since
1990 it has been on a declining trajectory while Sudan is steadily outpacing Kenya’s rate
of labor productivity growth. The World Bank’s Investment Climate Assessment
indicates that although manufacturing value added labor productivity of Kenya is
comparable to that of China and India, it has been characterized by a much higher capital
intensity (WB; 2008). This suggests that the level as well as quality of skills
development will need to improve to be competitive globally.
Figure 4: Comparison of Labor Productivity Growth
4
In addition, the growth rate of Total Factor Productivity (TFP) which also accounts for
capital utilization, increased only by 4 percent annual rate on average over the past four
years, primarily due to utilization of existing capacity rather than new investment (WB;
2008).
Assessment of National Business Environment
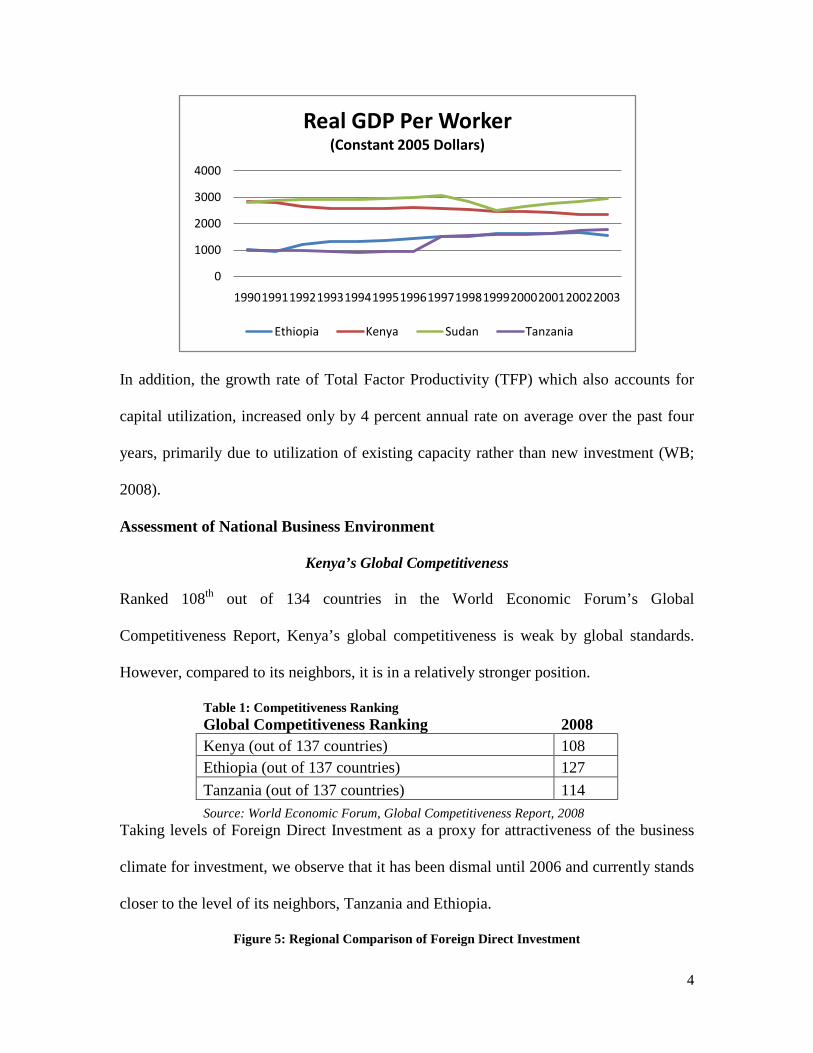
Kenya’s Global Competitiveness Ranked 108th out of 134 countries in the World Economic Forum’s Global
Competitiveness Report, Kenya’s global competitiveness is weak by global standards.
However, compared to its neighbors, it is in a relatively stronger position.
Table 1: Competitiveness Ranking Global Competitiveness Ranking 2008 Kenya (out of 137 countries) 108 Ethiopia (out of 137 countries) 127 Tanzania (out of 137 countries) 114 Source: World Economic Forum, Global Competitiveness Report, 2008
Taking levels of Foreign Direct Investment as a proxy for attractiveness of the business
climate for investment, we observe that it has been dismal until 2006 and currently stands
closer to the level of its neighbors, Tanzania and Ethiopia.
Figure 5: Regional Comparison of Foreign Direct Investment
0
1000
2000
3000
4000
19901991199219931994199519961997199819992000200120022003
Real GDP Per Worker (Constant 2005 Dollars)
Ethiopia Kenya Sudan Tanzania

5
The story is consistent with the World Bank’s Doing Business Ranking, where Kenya
ranks 82 out of 181 countries. Although is low by global standards, regionally Kenya is
in a very competitive position compared to its neighbors (Table..). According to the
World Bank Study, Kenya ranks particularly well in dealing with (construction) permits
and ease of access to credit for entrepreneurs.
Table 2: Doing Business Ranking
Economy Kenya Ethiopia Sudan Tanzania Ease of Doing Business Rank 82 116 147 127
Starting a Business 109 118 107 109 Dealing with Construction Permits 9 59 135 172
Employing Workers 68 95 144 140 Registering Property 119 154 35 142
Getting Credit 5 123 131 84 Protecting Investors 88 113 150 88
Paying Taxes 158 37 67 109
Trading Across Borders 148 152 139 103
Enforcing Contracts 107 78 143 33 Closing a Business 76 74 181 111
Source: Doing Business Report 2009 However, the following areas in particular need improvement to enhance the
competitiveness of Kenya regionally as a place for doing business: paying taxes and
enforcing contracts. Even with the recent reduction in tax rates, Kenyan firms are
required to pay half of their corporate income in taxes while the profit tax rate for firms
0
1,000
2,000
3,000
4,000
1996
1997
1998
1999
2000
2001
2002
2003
2004
2005
2006
2007
2008
Mill
ion
USD
Foreign Direct Investment
Ethiopia
Kenya
Sudan
Tanzania

6
stands at a whopping 32.5 percent (World Bank 2008). This high tax rate leads to
evasion as well as a spawning informal sector. Equally, the tax administration system
needs to be simplified with approximately one-third of firms surveyed rating it as a
bottleneck. Firms report spending an average of 430 hours in preparing, filing, and
paying taxes (World Bank 2008).
According to the Investment Climate Assessment, for firms in the top 75th percentile of
labor productivity and employment, corruption remains one of the most severe
constraints (World Bank 2008). According to Transparency Inter national’s Corruption
Perception index, Kenya ranks poorly compared to neighboring countries – 147th
compared to Tanzania’s 102 and Ethiopia’s 126 (TI online database).
Figure 5: World Bank Kaufmann Governance Indicators
This is further confirmed by the World Bank’s governance indicators where Kenya’s
ratings for “Rule of Law” (-1.02) and “Control of Corruption” (-0.98) are much worse
than the regional averages of -0.73 and -0.83 respectively. According to Investment
Climate Assessment, corruption costs Kenyan firms a conservatively estimated 4 percent
of sales (World Bank 2008). In addition, according to Enterprise Surveys, the percentage
of firms that report expectations of paying informal bribes to public officials stands at a
7
high of 79 percent – much higher than the African average of 41 percent. Worse still, the
same survey indicates that the percentage of firms who report having to give gifts to
secure government contracts stands at 71 percent (Enterprise Surveys, 2007). This
strongly underscores that corruption is a serious impediment in the business environment
that requires more intensive policy engagement.
National Diamond
Using the country diamond framework (Porter, 1998), Kenya’s business
environment was assessed along the following dimensions: factor (input) conditions;
demand conditions; context for firm strategy and rivalry; and related and supporting
industries. Assessment of factor (input) conditions indicates that Kenya benefits from
relatively strong human capital as compared to its neighbors. In particular, the strong
historical emphasis on education and the introduction of recent government policies on
free primary and secondary education have placed Kenya on a better competitive position
regionally. Although Kenya has a very well-developed port (Mombasa), other areas of
infrastructure are impediments to the country’s competitiveness. Poor quality roads, high
cost of energy, and insufficient electricity supply need dramatic improvement.

8
The Global Competitiveness Report ranks the overall logistical infrastructure of Kenya at
83 out of 134 countries, while its communication infrastructure is ranked even lower at
112 out of 134 countries. According to the Investment Climate Assessment, close to 80
percent of firms in Kenya lose up to seven percent of sales due to power disruptions,
which are among the highest in cross country comparisons (World Bank 2008). In
addition, though the Mombasa port serves regional neighbors, the poor quality of the road
infrastructure combined with complicated port clearing procedures drive up costs. Low
levels of skills development as evidenced by declining labor productivity is confirmed by
the Enterprise Survey data which indicates that only 40 % of firms in Kenya offer formal
training to their employees (Enterprise Surveys 2009). Large manufacturing and export-
oriented firms identify lack of specialized training as one of the biggest bottlenecks. Put
in international context, Kenya lags behind comparator countries with respect to on-the-
job training. Whereas 70 percent of firms in China and 60 percent in South Africa
provide on-the-job training, only 40 percent of Kenyan firms provide training to their
employees (World Bank 2008).
9
On Demand Conditions, Kenya benefits from access to a much larger regional
market as a member of the East Africa community. However, its neighbors are similarly
characterized by low per capita income levels which implies low, unsophisticated local
and regional demand for Kenya.
On the context for strategy and Rivalry, Kenya is characterized by politically
relatively stable – notwithstanding the recent post-election violence in 2007. Although
the business environment has improved considerably since President Kibaki came to
power, there are a number of areas of improvement to upgrade the country’s
competitiveness. Financial services are costly while financial instruments are not always
business friendly. High levels of corruption, concerning crime rates, and weak legal
institutional frameworks compound the business environment. Nearly 70 percent of
firms surveyed in Enterprise Surveys ranked corruption as a binding constraint (World
Bank 2008).
On Related and Supported Industries, Kenya benefits from relatively strong value
chains and distribution channels as well as suppliers. However, there are relatively a
small number of clusters in the economy as a whole and the link between the relatively
strong research institutions and manufacturing industry will need to be strengthened to
spur innovation.
STRATEGIC ISSUES
Current Policies
Kenya vision 2030 is the new long -term development blueprint of the country. The aim
of the development strategy document is to build a “ globally competitive and prosperous
country with a high quality of life by 2030” (Kenya Vision 2030, 2007). Current efforts

10
of the government of Kenya are focused on macroeconomic stability, continuity in
governance reforms, enhanced equity and wealth creation opportunities for the poor,
infrastructure, energy, science, land reform, human resource development, security and
public reforms.
Specifically, the government of Kenya has committed to improving the investment
climate. In 2007, the government launched its first-ever Private Sector Development
Strategy, which underscores that growth can only be achieved through prosperous private
sector (WB-ICA, 2008). The new private sector strategy is based on five pillars:
Improving Kenya’s business environment, accelerating institutional transformation,
facilitating growth through greater trade expansion, improving productivity of
enterprises, supporting entrepreneurship, and small and medium enterprise.
CURRENT CHALLENGES
Although Kenya has recorded some progress in improving productivity, the Kenyan
Private sector still faces a challenging business environment. An assessment of the
Kenyan business environment indicates that the top constraints identified by Kenyan
companies include high tax rate, corruption, limited access to finance, poor infrastructure
services (especially electricity and transportation), and business licensing. Although
Kenya has reduced the tax burden, in particular, the corporate tax rate, comparison with
Kenya’s comparator countries indicate that Kenyan firms are still required to pay a high
percentage of tax. In addition Kenya maintains different kinds of fees and taxes on
production inputs and services (WB-ICA, 2008). One potential impact of such a high tax
burden is tax evasion, as well as the presence of a large informal sector. Going forward,
broadening the tax base and reducing the tax rate is a better strategy. Corruption still
remains one of the top bottlenecks for doing business in Kenya. According to the World

11
Bank’s Investment Climate Assessment (2008), a staggering 75% of firms in Kenya
reported having to make informal payments to get things done. Corruption costs Kenya
firms approximately 4 % of annual sales, which is a considerable amount by international
standards.
Electricity and transport are the main infrastructure bottlenecks affecting Kenyan firms.
Close to 80 percent of firms in Kenya experience losses because of power interruptions.
This is the highest value of all comparator countries (WB,2008). As a consequence,
almost 70 percent of firms have generators, which are costly to obtain and operate. Power
disruption costs Kenyan firms approximately 7 percent of sales (WB, 2008).
Access to credit is significantly more difficult for microenterprises and small enterprises.
Access to credit is particularly difficult for small enterprises because, compared to
medium and large firms, report that collateral requirements discouraged loan
applications. The complexity of the application process is another impediment for micro
and small firms.
POLICY RECOMMENDATIONS
Kenya needs to improve its business environment by catalyzing public-public sector
dialogue while at the same time building adequate and good quality infrastructure in
transportation and energy. To address these constraints, the following specific
recommendations are suggested.
Tax Reform: Kenya has recently reduced the tax rate faced by corporations. This is
commendable. However, the government should also considering broadening the tax base
and improving the administration of the tax system while reducing the tax burden on
production inputs and services

12
Anti -Corruption Campaign: Intensify the anti-corruption program already in place
through better investigation and prosecution, eliminating discretionary decision-making
in a public service that is prone to bribery, public education; supporting the development
of a code of conduct within the private sector and judicial and legal reform, improve
efficiency and effectiveness of the service delivery in public sector.
Improve Infrastructure: Increase public investment in transport infrastructure, energy
generation, transmission, and distribution to increase connectivity; encourage increased
private financing, and investment in the infrastructure sector, develop the legal
framework for investments in energy, transport, telecommunication, provide incentives to
attract FDI, cultivate a social attitude of respect and care for public infrastructure
facilities and services amongst all citizens.
Access to Finance: Access to credit by small Kenyan business is fraught with immense
difficulties. To address these constraints the government needs to design a development
of a policy framework for SME financing that provides mechanism for, preferential loan,
and credit guarantees. It is also important to promote the application of innovative
products and technology by microfinance institutions to expand access to finance. Efforts
to computerize property registration process should also continue as the ability to easily
transfer land titles is an important vehicle for providing property owners with access to
collateralized financing.
THE GLOBAL TEA INDUSTRY Origin
Tea was introduced by the British in India, Sri Lanka, and by the Dutch in Indonesia.
Later, in the 20th century commercial production began in Kenya, Tanzania, and Malawi.
Tea is produced by more than 35 countries. Global production in 2006 reached 3.5

13
million tons. Three quarters of this production is accounted for by the top four producers,
China, India, Sri Lanka, and Kenya (SOMO; 2007). Given the labor intensive nature of
its production, millions of rural populations depend on the industry for their livelihoods.
Table 3: Global Tea Production and Exports 2006 Kenya and Sri Lanka control 40
percent of world exports and have
large smallholder subsector (SOMO;
2007) Tea production is therefore
important within the economy and
is a critical form of export income.
While domestic consumption of tea
in Kenya accounts for 5 percent of
production, 56% of all tea produced
worldwide is consumed locally. In the last 3 decades world tea production has doubled
but demand has lagged behind creating a situation of oversupply (Agritrade; 2008). Until
recently the price trend for tea has been
downward. According to the Food and
Agriculture Organization (FAO) composite
index the price of tea has been gradually
increasing. However longer term analysis
taking inflation into account indicates that the real tea price dropped substantially as
producers now receive less than half what they did 3 decades ago (Agritrade; 2008).
Low world market prices and high production costs have put pressure on working
conditions (i.e. casualisation of labor and inadequate health and safety conditions), and
Country Production Share Export Share China 1,028,064 0.29 286,549 0.18 India 995,907 0.27 200,866 0.13 Sri Lanka 310,822 0.09 314,915 0.20 Kenya 310,607 0.09 313,721 0.20 Turkey 142,000 0.04 5,500 0.00 Indonesia 140,049 0.04 95,339 0.06 Vietnam 132,000 0.04 106,666 0.07 Japan 99,500 0.03 1,681 0.00 Argentina 80,000 0.02 70,723 0.04 Bangladesh 53,265 0.02 4,794 0.00 Malawi 45,010 0.01 41,963 0.03 Uganda 36,726 0.01 32,699 0.02 Tanzania 31,348 0.01 24,132 0.02 Iran 20,000 0.01 6,000 0.00 Taiwan 19,345 0.01 1,962 0.00 Other 128,157 0.04 64,920 0.04 Total 3,532,800 1,571,808
-505
10152025
2003
2004
2005
2006
2007
2008
FAO Composite prices US$/kg
TEA PRICE

14
0.58 0.85 0.99 1.18 1.53 1.7
0
1
2
Indicative Cost of Production (in USD/kg)
affected modes of tea production (i.e. increased small holder, out-grower models,
employee buy-out production). These conditions have driven various levels of
restructuring of the sector in major producing countries.
Figure 6: Cost of Production (USD/kg)
This restructuring of the industry ranges
from dismantling of the plantation system
in India to the rise of smallholder
production in Sri Lanka.1
The tea supply chain is comprised of a complex web of actors, producers, collectors,
traders/brokers and packers. Tea production has traditionally been associated with large
estates or plantations controlled by a handful of multinational companies, but
smallholders are becoming increasingly important in the industry as well.
These two
countries have the highest production costs
owing to older and lower-yielding tea bushes, low labor productivity in Sri Lanka. In
addition in both countries there has been a negative impact on environment through high
agrochemical usage and deforestation. Information on the Chinese Tea industry is not
readily available. Kenya is considered a tea exporting “super power” of Africa with only
Sri Lanka exporting as much tea globally. Sri Lanka, Kenya’s closest competitor is far
more successful moving up the value chain and commands higher prices for its tea.
Kenya however, has relatively lower production cost, higher labor productivity
(2,235kg/ha) and production is growing faster than in Sri Lanka (1,611) and India (1,690)
(SOMO; 2007).
Structure

15
Figure7: Tea Industry Value Chain
Unilever, James Finlay Ltd., and Tata Ltd are three dominant multinational players in the
market. They are active in every segment of production and usually carry out the high
value added (80% of retail price) (SOMO; 2007) blending, packing and marketing of tea
in western countries. This gives them considerable influence on world prices and has led
to uneven value distribution along the supply chain. Blending for example means that
many tea qualities become interchangeable and can be bought wherever they are
cheapest. Companies have considerable leverage over producing countries as they need
not rely on any one producing country. Hence while retail prices have remained stable,
average auction prices between 2000 and 2005 were around half of those in the eighties.
Supported by government, smallholders in Kenya and Sri Lanka produce approximately
65 and 62% of total production respectively. Smallholders are generally price takers and
sell their green leaves to collectors, plantations or processor. Key challenges in the in the
smallholder subsector include: low farm gate prices, poor extension services, limited
market channels, poor access to credit and low level of farmer organization.
Tea Plucker / Worker
Smallholder Plantation / Estate
Collector Factory Workers
Buying Center Estate Factory
Bought Leaf Factory
Transport
Warehouses
Traders /Buying Agents
Blender / Packer Retailer Consume
Producing Country
Freight Handler
Consuming Country
Tea Auction / Broker

16
Industry Challenges and Progress
Global tea production cost are high owing to high power tariffs, increasingly high labor
costs, expensive inputs like fertilizers, machinery and packaging materials, and poor
infrastructure in producing countries. Rising production costs, falling prices, and
increased competition among producing countries are driving the restructuring process in
the tea industry. These changes have important implications for competition as it relates
to the traditional structure of the industry (SOMO; 2007). The estate model in India for
example has been abandoned owing to its burdensome and costly labor laws. The
smallholder model has become increasingly popular in all producing countries.2
Owing to limited regulation, family costs, and use of seasonal labor, smallholder
production is seen as increasingly viable as production costs are often lower that for large
estates. This is contrary to theory on economies of scale since it would be most
advantageous in cutting the cost of production know to agricultural bulk commodity
chains. In the tea sector it seems as if there is a contrasting development as tea growing
requires little investment and labor intensity greatly affects the cost of production. Hence
it is argued that Kenya and Sri Lanka have become more competitive on the world
market as a result of increased small holder production (SOMO; 2007). There are
concerns around sustainability issues for the industry in two ways. One is that regulation
in the subsector is less strict and farming practices less environmentally friendly. As a
result, the second issue is that it would be difficult to include these producers in the
export-oriented supply chains which would require with increasing quality, social and
Production cost on smallholder farms remain relatively lower than estates owing to
hidden family costs and the fact that they do not bear any social costs.
2 Except for Malawi.

17
0
2000
4000
2000 2001 2002 2003 2004 2005 2006 2007
Tota
l ave
rage
Yie
ld
Year
Total Average Yield
Smallholders
environmental standards. This is so since the smallholder models also create challenges
in terms of lower traceability, quality and continuous supply of tea leaves
History of Kenyan Tea Cluster
Tea is produced in the east and west of the Great Rift Valley. 3
Sixty two percent or 229 million
kilograms was produced by the small
holder subsector, while 38% or 140
million by plantation/ estates owned by
multinational companies. This accounts
for 10 percent of world production and 22% of world exports. Over 3 million Kenyans or
about 10 percent of its population is involved directly or indirectly in its tea cluster. There
are between 400,000-500,000 registered tea growers in Kenya, 93 registered tea factories,
12 brokers and 100 buyers in Kenya (TEA EXPO MACAO 2008).
Since 2003 there has been increasing output of tea in Kenya. This is partly attributed to
increased land use in Kenya. Large growers have generally produced higher average
yields than small holders.
Kenya’s equatorial climate
allows tea growing and harvesting all year round. Kenya is Africa’s largest tea producer
and tea is its leading export crop. After India, China and Sri Lanka Kenya is the fourth
largest producer of black tea of which it produces 369 Million kilograms in 2007.
Figure 8: Total Average Yield
3 It is ideal for these crops given the higher altitude (1,500-2,700 metres above sea Level), rich tropical volcanic red soils,
and well distributed rainfall (1200 mm to 1400 mm per annum).

18
Origin of Kenya Tea Cluster
The Kenyan Tea cluster originates form a colonial legacy independent from local
demand. Tea was introduced into Kenya from India in 1903. However the first
commercial planting did not occurred until 1920. Traditional tea varieties include Assam
– C Sinensis variety Assamica (Masters) Kitamura and Darjeeling.4
The Plan also required private companies to participate in these schemes by assisting
with the production, processing and marketing of the crop. Brook Bond was a major
participant in these schemes, offered training to small farmers ensuring its production
went for export markets while small holder tea remained for domestic consumption. This
was largely accomplished by setting production quality standards and providing
agricultural extension services to small farmers who initially sold their leaf to the large
operators (Dinham et al; 1984).
Kenya tea
production was initially developed as colonial export crop by the British company
Brooke Bond which was later acquired by Unilever in 1983. Between 1920 and 1939
Brooke Bond controlled all key stages of production, marketing and distribution of
Kenyan tea. At the end of World War II, Kenyans initiated their demands by Kenyans for
independence from Britain. In 1954 the Swynnerton Plan was introduced to quell
independence demands for land redistribution through more “inclusive” participation of
African Farmers in the production of the country’s main export crop. They were
incorporated through small holder schemes or Shambas, with assistance by private
companies such as Brook Bond in production processing and marketing of tea (Dinham
et al; 1984). The plan allowed for limited participation by Kenyans in the production of
tea, coffee, pineapples and other crops.
4 Today there are some amounts organic oolong and organic teas.

19
Between 1947 and 1960 Brook Bond was able to increase quality and labor productivity
by sponsoring research for higher yielding varieties, processing techniques to improve tea
quality and introducing new plucking techniques. These advancements were realized at
the Tea Research Institute which was established by the company at Kericho. While this
was not intended to benefit smallholders directly the company had considerable influence
on how small holder production developed. The Swynnerton Plan was seen as a political
and business success as it took political pressure off the companies (allowing them to
keep their plantations) while ensuring access to high quality tea production from small
holders (Dinham et al; 1984).
In 1963 Kenya gained independence after a bloody struggle. A major feature of this
struggle centered on black Kenyans demands to retrieve land from white owned highland
estates. With independence white owned land was redistributed to African Kenyans
through loans provided by the World Bank and the Commonwealth Development
Corporation (Dinham et al; 1984). In the end however the amount of land that could be
purchased through this scheme was not significant enough to equalize distribution. This
remains a marked feature of Kenya’s economy today.
After independence the government continued to steer development of the cluster by
supporting the integration of small holders into the mainstream of tea growing. This was
accomplished through the establishment of the Kenya Tea Development Authority in
1964 to protect and support small holders and steer the development of a niche for small
holders in international tea markets. The KTDA quickly began to build state-owned tea
factories which bought green tea leaf from the farmers and controlled the processing and
marketing of this. In this way, the KTDA began to steer development towards

20
establishing a niche for small holders in international tea markets that operate through
auctions held in Mombassa and London. KTDA also provided administrative support,
agricultural extension services, and quality control support to small farmers which were
largely financed by international aid.
In 2000 with increasing pressure through World Bank Structural Adjustment program,
KTDA was privatized to improve efficiency and management of tea production and
marketing of green leaf.5
The tea industry is one of the greatest successes in Kenyan agriculture. Tea planting and
production have expanded rapidly since independence in 1963, from 18,000 tonnes and
24,448 hectares in 1963 to 370,000 tonnes and 149,000 hectares in 2007 (KNBS and
TBA). The increase in production could be explained partly by favourable weather
However, by 2006 there were calls within the Kenyan calling
for the renationalization of KTDA. Supporters for re-nationalization argue that KTDA
managers were not responsive to dynamics of the industry, and allowed benefits to
middlemen at the expense of small farmers, and that while tea earns premium in revenue
for the state, farmers get nothing in return due to unsound. Those opposed argue that the
recent wind fall earning is testimony to the effectiveness of the Agency and any move to
roll back authority to the government will spell doom for the industry. In 2008 the
Kenya Tea Industry Task Force, commissioned to look into the issue, released its report
(allafrica.com;2008).
The Kenyan Tea Cluster: Overview
Historical Cluster Performance
5 It was renamed the Kenya Tea Development Agency as opposed to the the Kenya Tea Development Authority.

21
pattern, early involvement of multinational tea companies, and the increase in the total
area of land under cultivation.
Small holders have continued to dominate production producing, on average, about 60%
of total output. (Kenya National Bureau of Statistics and Tea Board of Kenya). However,
the average yield per hectare is higher in large estates than smallholder farms largely
because of better use of technology, inputs, and economies of scale. New ways must
therefore be found to increase the volume and value of productivity in smallholder farms.
Export Performance
Tea is the leading agriculture export in Kenya. On average, it contributes 28% of the
value of total agricultural exports, followed by horticulture (20%), fish (9%) and coffee
(4.2%), and others (38.8%). (KNBS). The main buyers of Kenyan tea are Pakistan, the
United Kingdom, Egypt and Yemen, accounting more than 70% of Kenyan Tea export.
Pakistan alone imports 23% of the total tea export ((EPZA, 2005). Over-reliance on a few
key export markets has been one of the major challenges of the Kenya Tea cluster.
The risk of this overreliance was underlined by Pakistan’s recent decision to reduce its
team imports from Kenya (Business Daily Africa; 2008). Kenya exported 98 million
kilograms of tea worth Sh. 12 billion to Pakistan in 2005, but this gradually shrunk to 80
million kilograms worth Sh. 10 billion in 2007. The declining market share can be traced
to a decision by Pakistan to enter into Free Trade Agreement (FTA) with India and Sir
Lanka in the framework of the South Asian Association for Regional Cooperation
(SAARC).

22
0500,000
1,000,000
2000
2001
2002
2003
2004
2005
2006
2007
Expo
rt V
alue
('00
0)
…
Kenya's Export Performance
Figure 9: Export Performance
In part to address the market access erosion
the Kenya Tea Board (KTB) and other
players in the industry are exploring new
markets in West Africa, North Africa apart
from Egypt, Middle East and Eastern
Source: UN Comtrade database Europe (EPZA;2005 and NES;2003).
Traditionally, Kenyan black tea has been sold in bulk. However it is widely sought after
by leading tea blenders to create some of the most respected global tea brands. The role
of value addition in Kenyan tea export is very limited. UK and Germany are not among
the top tea producers in the world; yet these two countries are still key players in the
world tea export market generating up to 50% of Kenya export earning by adding value
to tea (FAOSTAT;2008). By contrast, Kenyan farmers export semi-processed, low value
produce. The limited ability to add value and high production cost makes Kenyan tea
export less competitive in global markets. In short, one of the major constraints to tea
production in Kenya is the limited processing capacity. Kenya should therefore adopt
policies that will enable it to capture a greater percentage of value added than at present.
Encouraged by the TBK, there is an emerging value-added sub-sector, led by the Tea
Packers Association, which aims to provide consumers worldwide with pure Kenyan
branded teas, blended at source (EPZA, 2005). One examples of this include an
agreement with the Tea Kenya Packers Association (KTP) and Tabai of the USA which
will secure 10% of the US market for Kenyan tea. Another is an Agreement by KTDA
and Safai Tea Canada that will market tea in Canada using Canadian technology for
production and value added (Gesimba et al: 2005).

23
Mapping the Kenyan Tea Cluster
Kenya has a relatively developed Tea Cluster. It includes a wide range of competing
small- holder and multinational producers, suppliers, value adding firms, IFCs and
regulatory agencies. The tea sub-sector is therefore well organized with different sector
players having various roles complementing and at times overlapping each other.
Figure 10: Kenya Tea Cluster Map
Institution for Collaboration
Other organizations playing important roles in Kenyan Tea Cluster include East Africa
Tea Trade Association (EATTA), the Kenyan Export Promotion Council (EPC), the
Kenya National Chamber of Commerce and Industry (KNCCI), and KTP. EATTA brings
together tea producers, brokers, buyers and packers and is the auspices under which the
Mombasa Tea Auction is conducted. The Export Promotion Council (EPC), established
in 1992, has the mandate to promote and develop Kenya's export activities.
The Kenya Tea Cluster Diamond
The success of the Kenyan tea cluster is mainly driven mainly by factor conditions and
further enhanced by the Context for Firm Strategy and Rivalry (CSR) factors. The history
24
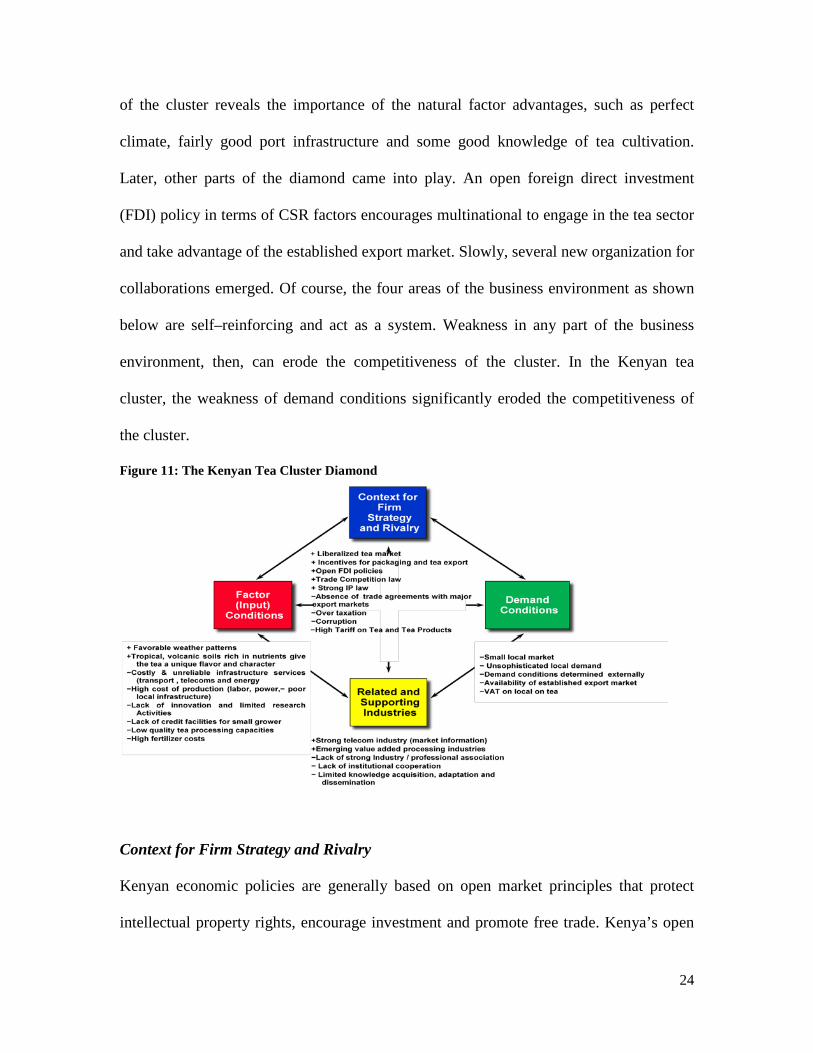
of the cluster reveals the importance of the natural factor advantages, such as perfect
climate, fairly good port infrastructure and some good knowledge of tea cultivation.
Later, other parts of the diamond came into play. An open foreign direct investment
(FDI) policy in terms of CSR factors encourages multinational to engage in the tea sector
and take advantage of the established export market. Slowly, several new organization for
collaborations emerged. Of course, the four areas of the business environment as shown
below are self–reinforcing and act as a system. Weakness in any part of the business
environment, then, can erode the competitiveness of the cluster. In the Kenyan tea
cluster, the weakness of demand conditions significantly eroded the competitiveness of
the cluster.
Figure 11: The Kenyan Tea Cluster Diamond
Context for Firm Strategy and Rivalry
Kenyan economic policies are generally based on open market principles that protect
intellectual property rights, encourage investment and promote free trade. Kenya’s open

25
FDI policy allows foreign tea companies to own businesses in Kenya. Kenya has also
signed a number of bilateral treaties for promoting and protecting FDI. This openness
permits inflow of skilled people, investments, and new technology into the economy and
tea cluster. Kenya has also put in place a new IP law with strengthened enforcement
measures. Moreover, the country is a signatory to various treaties under World
Intellectual Property Organization (WIPO) which enabled Kenya to fortify its intellectual
property right protection. Kenya’s Competition regulation encourages competition by
prohibiting restrictive trade practices. Together these factors have positive impact on
productivity and competitiveness.
Kenya maintains generous incentives for processing and packaging tea. They include
VAT exemptions, a ten year corporate, income and withholding tax holiday and high
quality infrastructure. Kenya’s Export Processing Zone (EPZ) offers additional incentives
particularly to export oriented investors. However, over taxation is a significant issue in
Kenya. The government imposes a wide range of levies, fees on inputs, production and
services used by the cluster. The import tariff on tea and tea products for example has
risen from 15% in 1999 to 25 % today (WTO; 2006).
Factor Conditions
Competitiveness depends on the presence of basic factor conditions. On the positive side,
the Great Rift Valley Region of Kenya provides an ideal climate for tea growing.
However, the production costs are very high owing to high power tariffs, high labor cost
in large scale producers (arising from negotiated wages with trade unions), expensive
inputs such as fertilizers, machineries, packaging materials, poor local infrastructure, and
inefficient market structure (particularly for small holders). In Kenyan tea estates have

26
identified the high cost of labor as their key challenges in managing production costs.
Labor cost has risen from 43 percent in 1999 to 55 percent in 2006. Comparatively, this
cost has increased out of step with the inflation rate. While wages rose 174 percent
inflation rose 70 percent between 1996 and 2007 (WTO;2006). Limited research
activities in the cluster also inhibit productivity. The little research takes place in the
agriculture sector is not effectively used due to lack of prioritization and coordination
among different research institutions. Moreover, research is mainly financed through
donor support; domestic funding represents less than .01% of government budget.6
The local market for tea is small. Only 5% of the Kenyan tea production is consumed
locally. In 2008, 17.5 million kilos of tea were consumed locally compared to the 345
million kilos of tea the country produced (Daily Nation;2009). In addition
unsophisticated local demand implies that there is no critical customer base in the country
that pressure local firms to improve the quality and variety of tea and offer new insights
into existing and future customer needs. The high tariff on tea and tea products further
inhibits competition in the home market. Inadequate national packaging standard is also
another factor that explains the lack of sophistication of the local market. Kenya
however, facilitated by large growers, enjoys an established export market in unprocessed
black tea.
Access to bank credit is still a major problem for smallholders partly due to the limited
use of land as collateral (WTO; 2006). The high cost of agricultural inputs, largely due to
lack of competition, has also led farmers to substantially reduce their use of quality
inputs, such as seed, fertilizer, and pesticides.
Demand Conditions

27
Related and Supporting Industries
The cluster has many IFCs and a full-blown cluster map has emerged. For example, the
Mombasa Tea Auction, the second largest tea auction in the world, is indicative of the
importance of Kenya as a major global tea exporter. However, there is limited
cooperation, exchange of information, inter-firms linkages among small growers and
multinationals, suppliers and supporting institutions. Lack of coordination among
industry associations, chamber of commerce and supporting institutions leaves some
issues unattended and other areas duplicated.
Strategic Issues
Strategic Challenges
An analysis of the cluster points to a wide range of challenges which we attempted to
prioritize and sequence in five strategic categories. First, the high cost of production of
tea in Kenya inhibits the productivity of the cluster. The cost of producing tea is very
high and producers barely brake even. The Standard newspaper (August 28, 2008), for
example, reported that many small-scale growers uprooted their tea plantation due to
rising cost and lack of credit facilities. Second, Kenya is highly dependent on a few
export markets and types of teas. Recently, Pakistan, the single biggest buyer of Kenya
tea, has concluded a FTA with India and Sir Lanka, eroding Kenya’s market share
considerably thereby. The third strategic challenge is lack of innovation and development
momentum in the cluster. There is a path dependency problem where the cluster is locked
into exporting only unprocessed black tea. Fourth, like most clusters, the Kenyan Tea
cluster has a number of IFCs. However, there is a weak link and co-ordination among
businesses, professional associations, and knowledge institutions. Finally, the
28
productivity and competitiveness of the Kenyan tea cluster is inhibited by weak local
marketing and limited value adding.
Current Government Strategies
The Kenya government has taken a number of steps to improve the competitiveness of
the economy and the cluster. In 2007, the President of Kenya, Mwai Kibaki, unveiled
“Kenya Vision 2030”. The goal of Kenya Vision 2030 is to transform Kenya into
industrializing middle-income nation by the year 2030. At the sector level, two policy
strategies have significant impact on the tea cluster. The first is the Strategy for
Revitalizing Agriculture (SRA) 2004-14 unveiled in 2008. Its objective is to transform
agriculture into a profitable, commercially oriented, and competitive sector. The second
is related to Kenya’s the 2003-2008 National Export Strategy (NES). The Strategy aims
to improve Kenya's export performance by deepening existing export markets, opening
new markets, diversifying the export base away from reliance on traditional exports,
enhancing market access, and strengthening institutional support networks through trade
facilitation and enhancing competitiveness. The tea and coffee clusters are among the
fourteen priority sectors identified in the NES.
POLICY RECOMMENDATION
Until recently, the story of the cluster is one of an early success, emergence of local and
foreign large-scale producers and subsequent large expansion of production and export of
unprocessed tea. The Kenyan Tea cluster is now at a critical stage where profits might
decline unless the producers focus on innovation, quality improvement and value adding.
29
Cluster Vision
In order for the cluster to grow and prosper, Kenya will require: developing demand
sophistication (for example, marketing tea as a lifestyle beverage for Kenyan youth);
improving yield and quality of tea (for example through improved seed and genetic seed
improvement and peast and disease control); product differentiation ( through blending
see honest tea, organic tea and fair trade tea), value adding ( processing, blending and
packaging); developing strategies of competition and cooperation among all the cluster
participants; and institutional conditions favouring innovation and change. Our vision for
the tea cluster is to be a high- yield, highly differentiated, value added tea cluster. It
competes globally by continuously improving quality through innovation, differentiating
tea variety, and adding value instead of merely expanding quantity and reducing price.
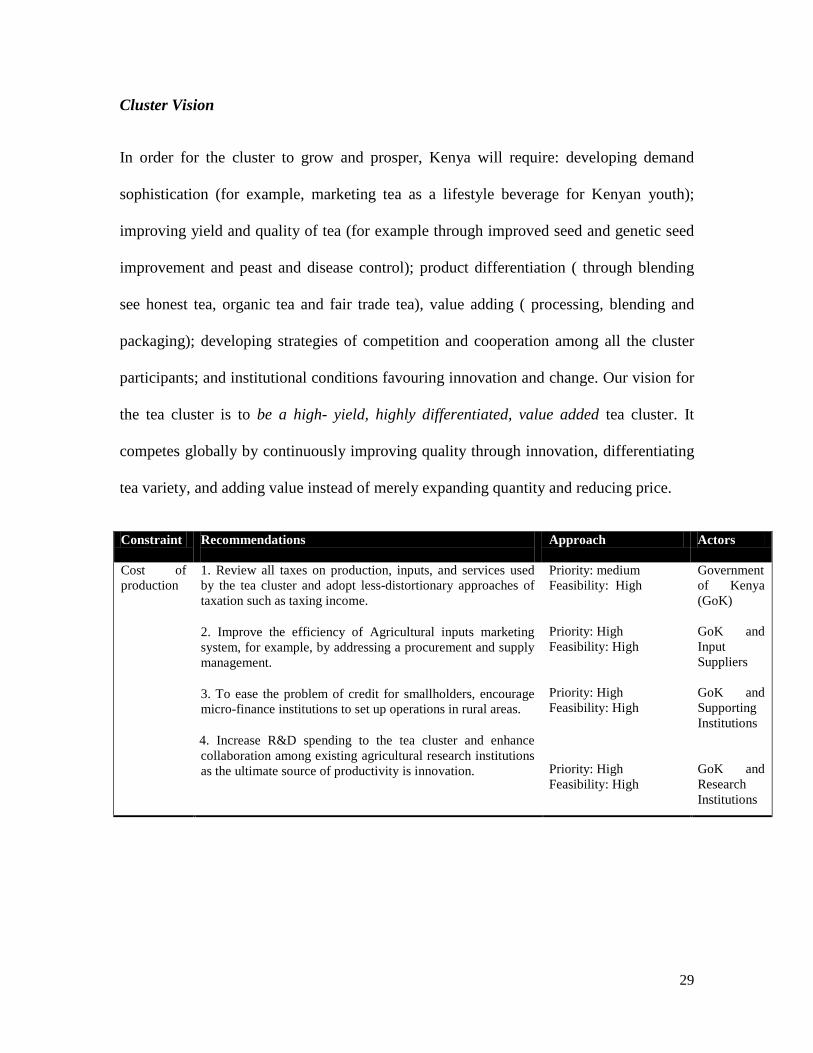
Constraint Recommendations
Approach Actors
Cost of production
1. Review all taxes on production, inputs, and services used by the tea cluster and adopt less-distortionary approaches of taxation such as taxing income.
2. Improve the efficiency of Agricultural inputs marketing system, for example, by addressing a procurement and supply management.
3. To ease the problem of credit for smallholders, encourage micro-finance institutions to set up operations in rural areas.
4. Increase R&D spending to the tea cluster and enhance collaboration among existing agricultural research institutions as the ultimate source of productivity is innovation.
Priority: medium Feasibility: High Priority: High Feasibility: High Priority: High Feasibility: High Priority: High Feasibility: High
Government of Kenya (GoK) GoK and Input Suppliers GoK and Supporting Institutions GoK and Research Institutions

30
Reliance on a few markets
1.Negotiate a South-South Preferential Trade Agreements with Pakistan and India to maintain the current generous market access in these countries.
2. Promote new non-traditional tea markets. 3. Pursue a strategy of differentiating Kenyan tea.
-Initiate a Geographical Indication (GI) and trademark protection efforts for Kenya’s unique and popular tea varieties. This could be targeted to the growing environmental conscious consumers in the North by differentiating its tea production process as younger and purer bushes that uses less pesticides that its competitors. -Brand and promote its unique tea by emulating the success of the Kenya Tourism Cluster (the success of which has been -Provide more effective incentives for value addition, blending, packaging and increasing tea varieties. Ultimately, the key for the competitiveness of the Kenya tea cluster is not simply cost but quality and uniqueness of variety.
Priority: High Feasibility: depends willingness of Kenya’s trading partners Priority: High Fasibility: High Priority: High Feasibility: High
GoK Tea Board of Kenya, IFCs, Kenya Export Promotions
Weak domestic markets
1. Eliminate the 25% tariff on tea and tea products \Provide incentives for domestic promotion efforts 2. Educate the public on health benefits and diversify tea products 3.Sponsor independent tea testing, product certification, and rating services and 4. Adopt and adapt international packaging standards.
Priority: High Feasibility: High
GoK, IFCs, Media
Lack of innovation momentum
1.Develop shared understanding and commitment about innovation.
2.In order to address the problem of fragmented R&D efforts for new tea varieties and avoid duplications of research, business and research organisations need to enhance collaboration.
3. In addition, firms should increase their R&D spending
All cluster participants
Poor coordinat’n among IFCs
1. Establish a new, overarching institutional platform of the Kenyan tea cluster participants under a strong and motivated leadership.
2. Enhance membership to cover all the players in the value chain.
3. Enhance its activities by, among other things, assisting in information gathering, developing new tea varieties, carrying out market studies and more broadly helping transform all the players into complementary and high performing entities.
Priority: High Feasibility: High
All IFCS

31
References
1. Dinham, Barbara and Collin Hines, Agribusiness in Africa, Africa World Press 1984 2. Gesimba, R. M. et al, The Tea Industry in Kenya; The Challenges and Positive
Developments, Journal of Applied Sciences 5 (2): 334-336,2005 3. Jacinta M. Kinyili , Diagnostic Study of the Tea Industry in Kenya, Export Promoitn
Council, Nairobi, Kenya, 2003. 4. Justus Ondari, Kenya Tea Board Gets Teeth, 4 October 2008,
http://allafrica.com/stories/200810060337.html
5. Porter, Michael (1998), On Competition, Harvard Business School Press, Boston, MA. 6. Prunier, Gérard. Kenya: Roots of Crisis. Open Democracy, July, 2008. Accessed April
2009. http://www.opendemocracy.net/article/democracy_power/kenya_roots_crisis 7. Nyangito, Heron O., Policy and Legal Framework for the Tea subsector and the Impact
of Liberalization in Kenya (KIPPRA, 2000) 8. Odiambo, Allan, Kenya Tea Loses its flavour in Pakistan, Business Daily Africa, 11 May
2008 9. Van der Wall, Sustainability Issues in the Tea Sector; An Analysis of the Six leading
Producing countries; June 2008, SOM 10. A Fair Cup – Towards Better Tea Buying - http://www.responsible-
purchasing.org/downloads/AFairCup.pdf 11. Agritrade, Executive Brief – Tea – May 2008
12. Daily Nation of Kenya, 6 May 2009 13. Economic Intelligence Unit, Kenya: Country Report (February, 2009) 14. Export Processing Zones Authority (EPZA), Tea and Coffee Industry in Kenya (2005) 15. FAOSTAT 2008 and 2009 16. Government of Kenya, Kenya Vision 2030- A Globally Competitive and Prosperous
Kenya, 17. Government of Kenya, National Export Strategy (2003-2007) 18. Government of Kenya, Ministry of Industrialization, Strategic Plan (2008-2012) 19. Government of Kenya, The Tea Act (CAP 343), Legal Notice No. 132 20. Africa Economic Outlook, Kenya; OECD, 2005-2006, 21. Kenya National Bureau of Statistics and Tea Board of Kenya 22. Kenya Tea Development Agency (KTDA); http://www.ktdateas.com/ 23. The Open University http://openlearn.open.ac.uk/mod/resource/view.php?id=301371 24. The Tea Board of Kenya (TBA); http://www.teaboard.or.ke/ 25. TEA EXPO MACAO 2008, 23rd - 25th MAY 2008, MACAO S.A.R, Embassy of Kenya
Presentation 26. The Tea Market – a background study, draft document,2006 27. Tourism_Satellite_Accounting/TSA_Country_Reports/Kenya/. Accessed April 2009 28. World Bank, Kenya: Investment Climate Assessment. Regional Program for Enterprise
Development; June 2008. 29. World Travel and Tourism Council (2008).
http://www.wttc.travel/eng/Tourism_Research/ 30. WTO, EAC-Kenya Trade Policy Review, 2006 31. WTO, Trade Policy Review- EAC- Kenya, 2006