Embed Size (px)
Citation preview

Microeconomic Concepts Related to Price and
Growth
Slide Show #8

Single Input-Single Input-Output Output
RelationshipsRelationships

Costs associated with levels of outputCosts associated with levels of output

Profit maximizinglevel of output,where MR=MC
Profit maximizinglevel of output,where MR=MC
P=MR=AR $45$45
11.211.2

Where is the firm’ssupply curve?
Where is the firm’ssupply curve?
P=MR=AR

P=MR=AR
Marginal cost curveabove AVC curve?
Marginal cost curveabove AVC curve?

5
B
C
D
E
FG
HI
J
Use a variable input likelabor up to the point where the value received from the market equals the cost of another unit of input, or MVP=MIC
Use a variable input likelabor up to the point where the value received from the market equals the cost of another unit of input, or MVP=MIC

5
If you stopped at point E on the MVP curve, for example, you would be foregoing all of the potential profit lying to the right of that point up to where MVP=MIC.
If you stopped at point E on the MVP curve, for example, you would be foregoing all of the potential profit lying to the right of that point up to where MVP=MIC.
B
C
D
E
FG
HI
J

5
If you went beyond the point where MVP=MIC, you begin incurring losses.
If you went beyond the point where MVP=MIC, you begin incurring losses.
B
C
D
E
FG
HI
J

Multiple Input Cost Multiple Input Cost RelationshipsRelationships

Least Cost Input Choice for 100 UnitsLeast Cost Input Choice for 100 Units
At the point of tangency, we know that:slope of isoquant = slope of iso-cost line, or…MPPLABOR ÷ MPPCAPITAL = - (wage rate ÷ rental rate)
At the point of tangency, we know that:slope of isoquant = slope of iso-cost line, or…MPPLABOR ÷ MPPCAPITAL = - (wage rate ÷ rental rate)
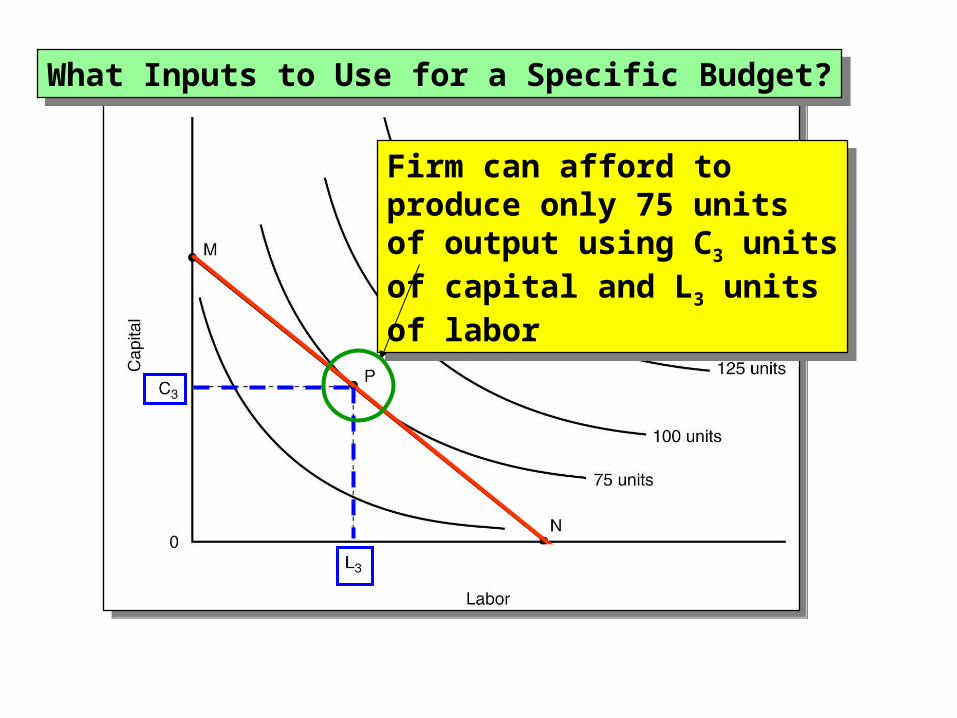
Firm can afford toproduce only 75 units of output using C3 unitsof capital and L3 unitsof labor
Firm can afford toproduce only 75 units of output using C3 unitsof capital and L3 unitsof labor
What Inputs to Use for a Specific Budget?What Inputs to Use for a Specific Budget?

Optimal inputcombinationfor output=10
Optimal inputcombinationfor output=10
How to Expand Firm’s CapacityHow to Expand Firm’s Capacity
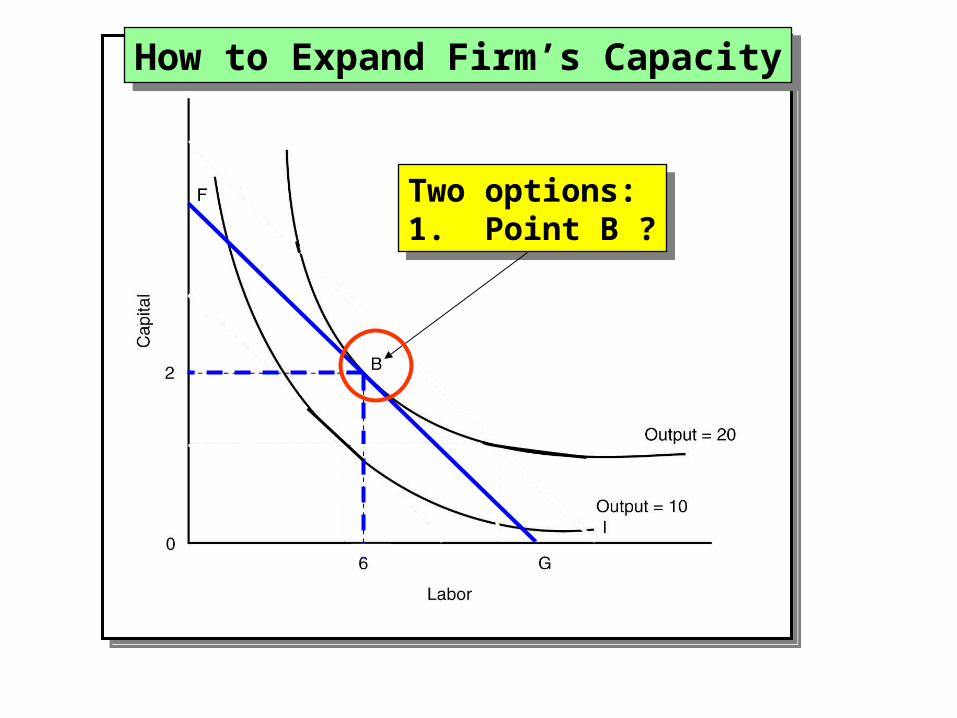
How to Expand Firm’s CapacityHow to Expand Firm’s Capacity
Two options: 1. Point B ?
Two options: 1. Point B ?

How to Expand Firm’s CapacityHow to Expand Firm’s Capacity
Two options: 1. Point B?2. Point C?
Two options: 1. Point B?2. Point C?

Optimal inputcombinationfor output=10with budget DE
Optimal inputcombinationfor output=10with budget DE
Optimal inputcombination for output=20with budget FG
Optimal inputcombination for output=20with budget FG
Expanding Firm’s CapacityExpanding Firm’s Capacity

This combinationcosts more toproduce 20 units of output sincebudget HI exceedsbudget FG
This combinationcosts more toproduce 20 units of output sincebudget HI exceedsbudget FG
Expanding Firm’s CapacityExpanding Firm’s Capacity

Expanding Firm’s CapacityExpanding Firm’s Capacity
Expansionpath
Expansionpath

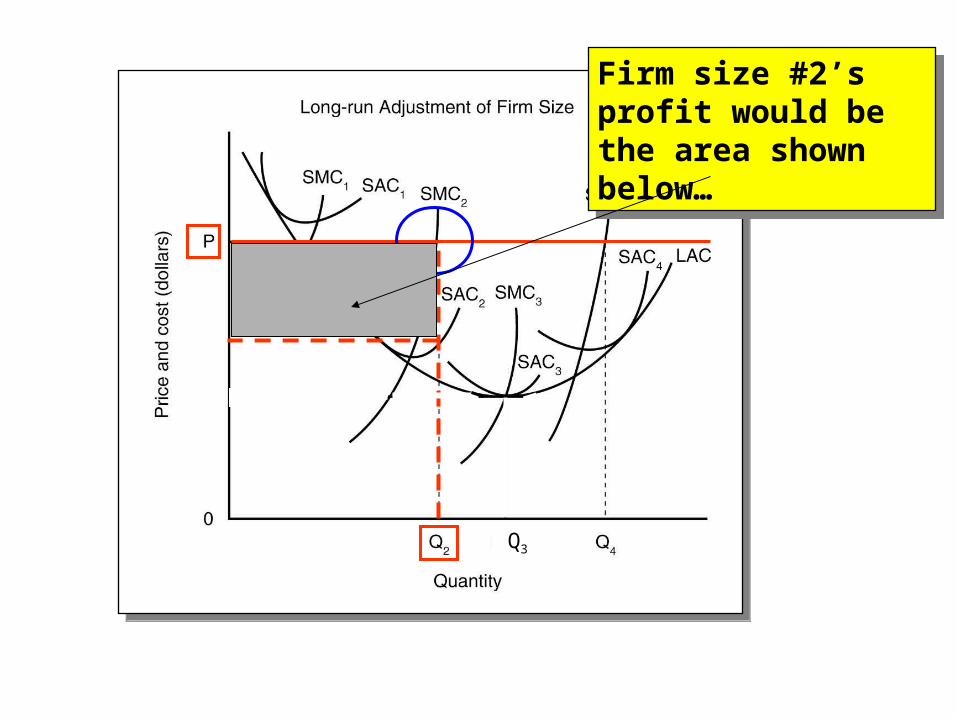
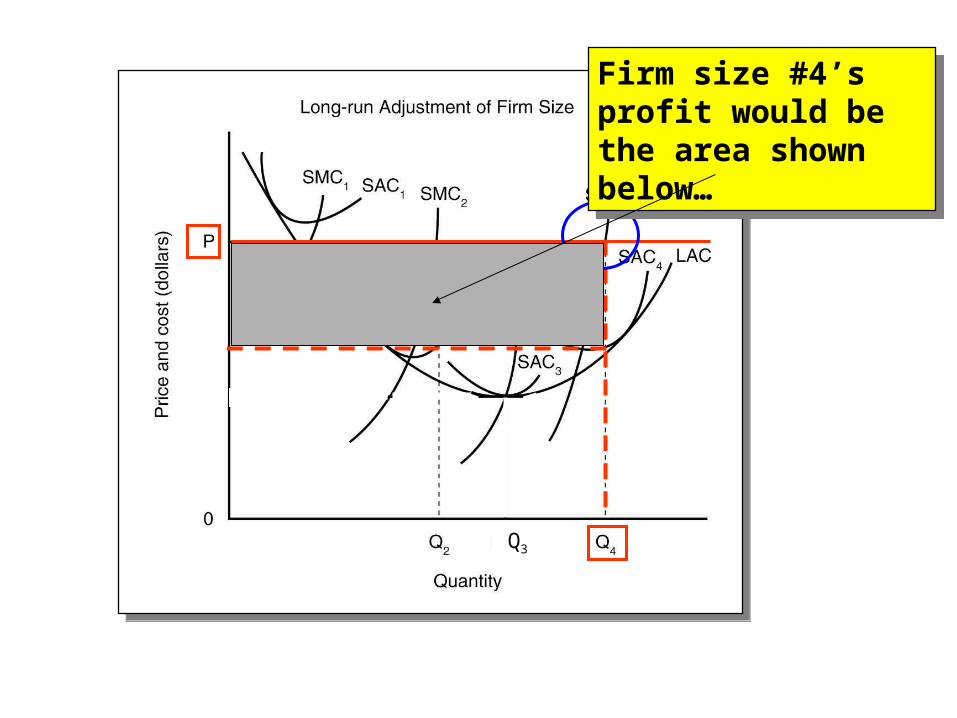
The Planning CurveThe Planning Curve
The long run average cost (LAC) curve reflects points of tangency with a series of short run average total cost (SAC) curves. The point on the LAC where the following holds is the long run equilibrium position (QLR) of the firm:
SAC = LAC = PLR
where MC represents marginal cost and PLR represents the long run price, respectively.

What can we say about the fourfirm sizes in this graph?
What can we say about the fourfirm sizes in this graph?

Size 1 would losemoney at price P
Size 1 would losemoney at price P

Q3
Firm size 2, 3 and 4would earn a profitat price P….
Firm size 2, 3 and 4would earn a profitat price P….
Q3
Firm size #2’s profit would be the area shown below…
Firm size #2’s profit would be the area shown below…

Q3
Firm size #3’s profit would be the area shown below…
Firm size #3’s profit would be the area shown below…
Q3
Firm size #4’s profit would be the area shown below…
Firm size #4’s profit would be the area shown below…

If price were to fall to PLR, only size 3 would not lose money; it would break-even. Size 4 would have to down down sizesize its operations!
If price were to fall to PLR, only size 3 would not lose money; it would break-even. Size 4 would have to down down sizesize its operations!

Market Price Discovery #1
Perfect Perfect CompetitionCompetition

Firm is a “Price Taker” Firm is a “Price Taker” Under Perfect Competition Under Perfect Competition
Price
Quantity
D S
PE
QE
Price
OMAX
AVC MC
The MarketThe Market The FirmThe Firm

If Demand Increases……If Demand Increases……
Price
Quantity
D S
PE
QE
Price
AVC MC
The MarketThe Market The FirmThe Firm
10 11
D1

If Demand Decreases……If Demand Decreases……
Price
Quantity
D S
PE
QE
Price
AVC MC
The MarketThe Market The FirmThe Firm
9 10
D2

Firm is a “Price Taker” in Firm is a “Price Taker” in the Input Market the Input Market
Price
Quantity
D S
PE
QE
Price
LMAX
MVP
MIC
Labor MarketLabor Market The FirmThe Firm
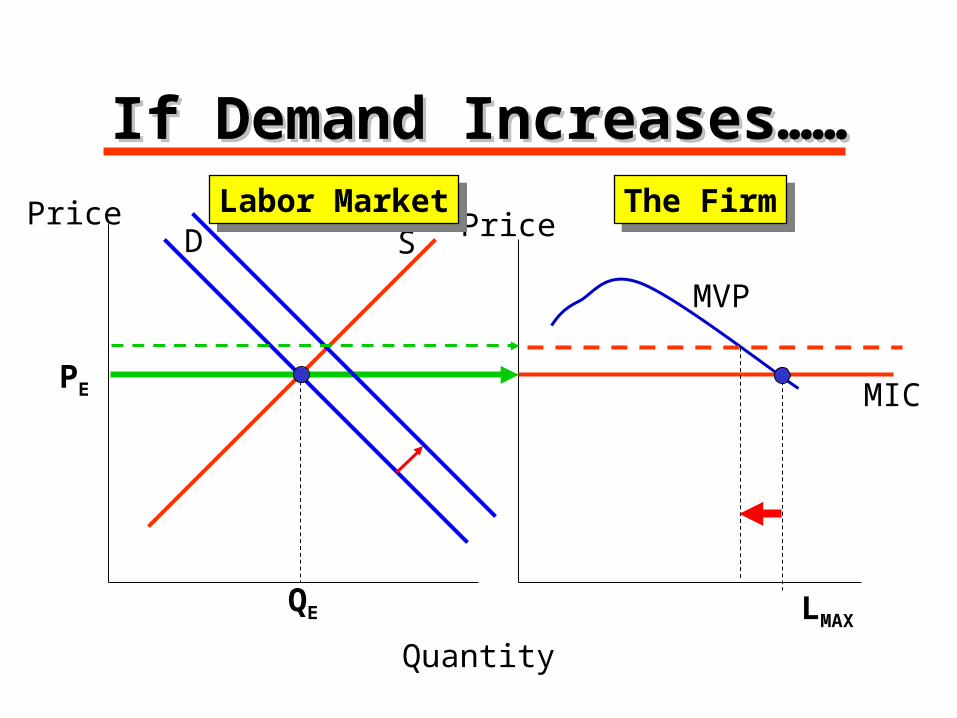
Price
Quantity
D S
PE
QE
Price
LMAX
MVP
MIC
Labor MarketLabor Market The FirmThe Firm
If Demand Increases……If Demand Increases……

MarketPrice Discovery #2
Imperfect Imperfect CompetitionCompetition

Total revenue is equalto the area 0PECQE,which forms the bluebox to the left…
Notice the monopoly,like the previous formsof imperfect competition,produces where MC=MR(point A), but then reads up to the demand curve (point C) when setting price PE.
Total revenue is equalto the area 0PECQE,which forms the bluebox to the left…
Notice the monopoly,like the previous formsof imperfect competition,produces where MC=MR(point A), but then reads up to the demand curve (point C) when setting price PE.

Total variable costs forthe monopolist is equalto area 0NAQE, or theyellow box to the left.
Total variable costs forthe monopolist is equalto area 0NAQE, or theyellow box to the left.

Total fixed costs for themonopolist is equal toarea NMBA, or the greenbox to the left…
Total fixed costs for themonopolist is equal toarea NMBA, or the greenbox to the left…

Total cost is therefore equalto area 0MBQE, or thegreen box plus the yellowbox to the left.
Total cost is therefore equalto area 0MBQE, or thegreen box plus the yellowbox to the left.

Finally, the economic profitearned by the monopolist isequal to area MPECB, ortotal revenue (blue box) minus total costs (green boxplus yellow box).
Finally, the economic profitearned by the monopolist isequal to area MPECB, ortotal revenue (blue box) minus total costs (green boxplus yellow box).