Embed Size (px)
Citation preview

by Annalisa Barrett August 2018
Microcap Board Governance

The analysis, opinions and perspectives herein are the sole responsibility of the authors. The copyright for this report is held by the IRRC Institute. The material in this report may be reproduced and distributed without advanced permission, but only if attributed. If reproduced substantially or entirely, it should include all copyright and trademark notices.
© Copyright 2018, Investor Responsibility Research Center Institute (IRRCi)
For more information, please contact:
Jon Lukomnik, Executive DirectorInvestor Responsibility Research Center Institute(+1) [email protected] www.irrcinstitute.org
About IRRCiThe Investor Responsibility Research Center Institute is a not-for-profit organization headquartered in New York, NY, that provides thought leadership at the intersection of corporate responsibility and the informational needs of investors. More information is available at www.irrcinstitute.org
About Board Governance Research LLCBoard Governance Research LLC provides independent research on corporate governance practices, board composition, and director demographics. For more information and to see the firm’s other research on various corporate governance topics, please visit our website at www.boardgovernanceresearch.com

Annalisa Barrett is the founder and CEO of Board Governance Research LLC, which provides independent research on corporate governance practices, board composition and director demographics. Ms. Barrett has nearly 20 years of experience in the field of corporate governance. She is the author of numerous reports and articles on corporate governance topics and is invited to speak on governance matters at national conferences throughout the year. She has been quoted in numerous periodicals and her research has been featured on the front page of the The Wall Street Journal.
Ms. Barrett is also a full-time Clinical Professor of Finance at the University of San Diego’s School of Business. She teaches graduate courses in Corporate Governance and undergraduate courses in Financial Statement Analysis and Personal Finance. In addition, she is a Senior Advisor for ValueEdge Advisors, which was founded by corporate governance leaders Richard Bennett, Robert AG Monks and Nell Minow to advise institutional investors regarding effective corporate governance engagement to preserve portfolio value and diminish risk. Previously, Ms. Barrett was Vice President and Senior Research Associate at The Corporate Library, where she led the firm’s research on the effectiveness of the board of directors. Before joining The Corporate Library, Ms. Barrett was a Research Consultant at Towers Perrin (now Willis Towers Watson). Prior to that, she spent several years in the Family Wealth Planning practice of Arthur Andersen.
In 2008, Ms. Barrett was named a Millstein Rising Star in Corporate Governance. She holds an MBA, with distinction, from the Ross School of Business at the University of Michigan. She, her husband and their two children live in San Diego, California.
About the Author
Microcap Board Governance 3
AcknowledgementsThis report could not have been completed without assistance and support from many people. Great appreciation goes to Jon Lukomnik, Adam Epstein, Ric Marshall, Jackie Cook, Courtney Yu, Jeff Thomas, Scott Stanton, Bob Bowen, Andrew Ly, Adhitya Sundararajan, Nory Behana, and Scott Barrett.

As investors seek returns in non-traditional asset classes, some have turned to microcap public equity (defined here as companies with less than $300 million in market capitalization). Most of these companies are not included in major indices and many do not have analysts following them. Therefore, their governance practices have not received the same level of scrutiny as larger capitalization companies.
Despite microcap public companies’ importance in our capital markets, there is a paucity of studies examining their board composition and governance practices. This study provides insights into the current governance landscape in this asset class. Where available, comparisons are made to the boards of the companies included in the Russell 3000 Index.
Additionally, as calls increase for companies to have more diverse boards, a broader pool of director candidates must be considered. Larger capitalization companies’ boards often desire director candidates to have prior public company board experience in order to be considered for an open board seat. Directors serving on microcap company boards have boardroom experience, but may not have previously come to the attention of larger companies’ nominations and governance committees via traditional board searches. This study provides an examination of the pool of these experienced directors from which larger company boards can draw.
Introduction
Microcap Board Governance 4

Microcap Board Governance 5
Microcap Companies
The 160 microcap companies in the study were randomly selected to represent approximately 10% of all companies with less than $300 million in market capitalization which are traded on a major US stock exchange.
• The length of time that a company has been in business provides context for understanding a company’s stage in its corporate life cycle. Less than one-quarter (22%) of the microcap companies studied have been public for less than five years, and only 6% were founded within the last five years. These findings contradict the common wisdom that many microcap companies are early stage growth companies that have only recently accessed public capital.
• In contrast to the notion that many small companies are founder led start-ups, only one in seven (14%) of the microcap CEOs studied are the founders of the companies they lead.
• Although the microcap companies studied are likely to have at least 10% of their stock owned by insiders, very few (4%) have a majority shareholder (who owns 50% or more). In addition, a multiple-class stock structure is not common among the microcap companies studied, with 93% having a one-share, one-vote structure.
Microcap Board Composition
• Microcap company boards tend to be smaller than boards of companies in the broader Russell 3000 Index. Most Russell 3000 boards have at least nine members, while fewer than one in five (18%) of the microcap boards are that large. Very small boards, with four or fewer directors, are much more likely to be found at microcap companies. One in ten (10%) of the microcap boards studied have such small boards.
• Men dominate the boardrooms of microcap companies even more so than those of the Russell 3000 companies. The majority (61%) of the microcap companies studied have no female directors serving on their boards, compared to less than one-quarter (21%) of the Russell 3000 boards. Furthermore, only 12% of the microcap companies have more than one female director, while nearly half (45%) of the Russell 3000 companies have more than one female director.
• Microcap directors may have less boardroom experience than their counterparts at larger companies. Only 17% of the microcap directors currently serve on the boards of other publicly-traded companies, compared to 35% of the Russell 3000 directors.
Key Findings

Microcap Board Governance 6
Microcap Board Practices
• Microcap companies tend to have less independent board leadership structures. Although microcap companies are just as likely to have separated the roles of CEO and Board Chair as companies in the Russell 3000 Index, many microcap boards do not have an independent chair or lead director serving as the leader of the board. Among those microcap companies which have combined the roles of CEO and Board Chair, most (70%) have not named a lead director. In fact, many of the microcap companies studied state explicitly that they do not have a lead director and have chosen to not do so intentionally.
• Microcap boards tend to have more variability in the number of board meetings held than do larger companies. More microcap boards (24%) held 12 or more meetings in 2016 compared to Russell 3000 companies (17%). The microcaps were also more likely (5%) than Russell 3000 boards 2%) to have held fewer than four meetings that year.
• The committee structures in place at microcap boards tend to be less complex than those of larger company boards. While the microcap boards studied are just as likely to have the three key committees (Audit, Compensation, and Nominating/Governance) as the Russell 3000 boards, they are less likely to have additional committees. Furthermore, many microcap board committees meet only once a year, and some reported holding no meetings during 2016.
• Director elections at microcap companies happen about as frequently as those at larger companies, but their election standards differ. The prevalence of classified boards is similar among microcap and Russell 3000 companies. While the majority (54%) of Russell 3000 companies have adopted a majority standard for director elections, only 11% of microcap companies have done so. However, microcap companies do not escape negative shareholders votes: three of the microcap companies studied had directors who failed to receive support from a majority of the votes cast at their 2017 annual meetings.
Microcap CEOs
• Despite less scrutiny from the investment community, microcap CEO tenure does not differ significantly from the tenure of CEOs of Russell 3000 companies. The average tenure of a Russell 3000 CEO is 10.3 years and the median tenure of these CEOs is 7.3 years, compared to 10.7 years and 7.0 years for the microcap CEOs.
• However, CEO compensation is still under scrutiny at microcap companies. Three microcap companies failed to receive support from a majority of the votes cast at their 2017 annual meetings.

Microcap Board Governance 7
Microcap Director Compensation
• Microcap companies pay their directors much less than Russell 3000 companies. At the median, the total amount spent on board compensation by Russell 3000 companies in 2016 was nearly $1.4 million, compared to about $425,000 spent by the microcap companies. Likewise, the average microcap director receives significantly less in director compensation than a Russell 3000 company director. At the median, the average individual director serving on a Russell 3000 company board received nearly $180,000 in 2016, while the average microcap director received just under $75,000.
• The nature of equity awards granted to directors vary based on company size. While nearly half (46%) of the microcap companies which grant equity-based awards to their directors awarded stock options in 2016, only 13% of the Russell 3000 companies did so. On the other hand, Russell 3000 companies are much more likely to award restricted stock or RSUs to their directors.
• While stock ownership guidelines for directors are a common practice among larger companies, fewer than one in five (16%) of the microcap companies studied reported having stock ownership guidelines in their proxy statements.
Microcap Board Governance 8
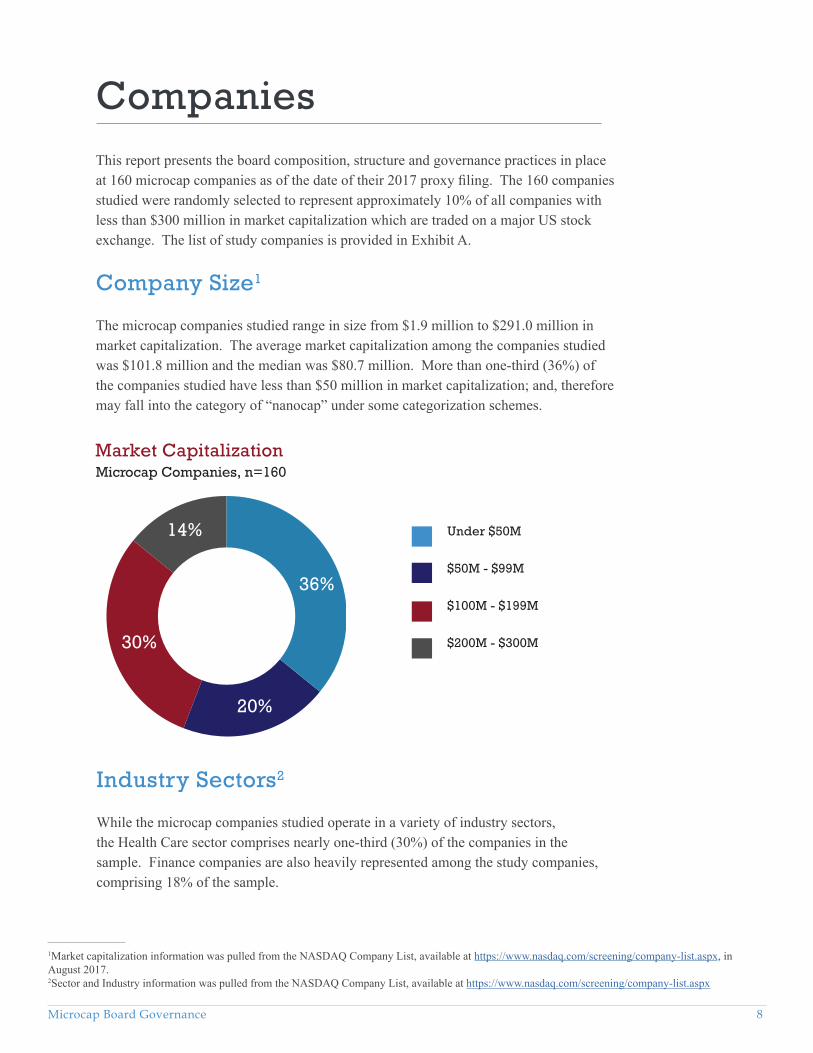
This report presents the board composition, structure and governance practices in place at 160 microcap companies as of the date of their 2017 proxy filing. The 160 companies studied were randomly selected to represent approximately 10% of all companies with less than $300 million in market capitalization which are traded on a major US stock exchange. The list of study companies is provided in Exhibit A.
Company Size1
The microcap companies studied range in size from $1.9 million to $291.0 million in market capitalization. The average market capitalization among the companies studied was $101.8 million and the median was $80.7 million. More than one-third (36%) of the companies studied have less than $50 million in market capitalization; and, therefore may fall into the category of “nanocap” under some categorization schemes.
Companies
Market CapitalizationMicrocap Companies, n=160
Industry Sectors2
While the microcap companies studied operate in a variety of industry sectors, the Health Care sector comprises nearly one-third (30%) of the companies in the sample. Finance companies are also heavily represented among the study companies, comprising 18% of the sample.
1Market capitalization information was pulled from the NASDAQ Company List, available at https://www.nasdaq.com/screening/company-list.aspx, in August 2017.2Sector and Industry information was pulled from the NASDAQ Company List, available at https://www.nasdaq.com/screening/company-list.aspx
36%
20%
14%
30%
Under $50M
$50M - $99M
$100M - $199M
$200M - $300M
Microcap Board Governance 9
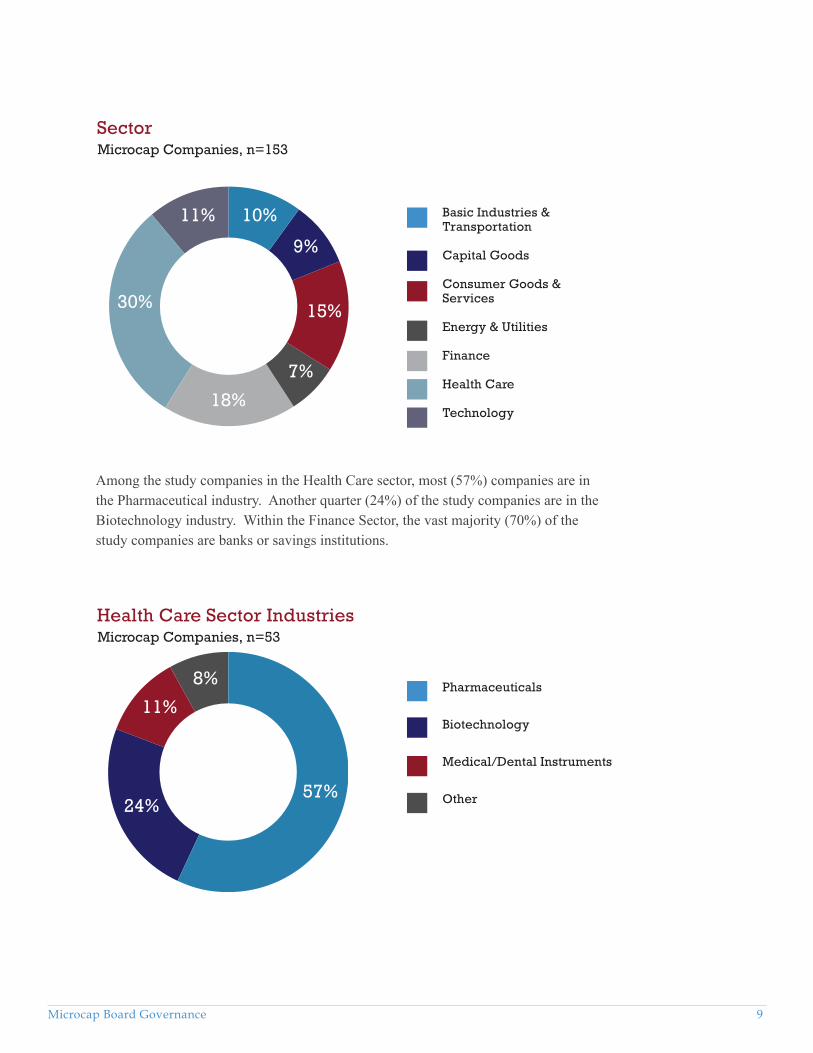
SectorMicrocap Companies, n=153
Among the study companies in the Health Care sector, most (57%) companies are in the Pharmaceutical industry. Another quarter (24%) of the study companies are in the Biotechnology industry. Within the Finance Sector, the vast majority (70%) of the study companies are banks or savings institutions.
Health Care Sector IndustriesMicrocap Companies, n=53
24%
11%
8%
57%
30% 15%
9%
10%11%
18%
7%
Basic Industries &Transportation
Capital Goods
Consumer Goods & Services
Energy & Utilities
Finance
Health Care
Technology
Pharmaceuticals
Biotechnology
Medical/Dental Instruments
Other

Microcap Board Governance 10
Number of EmployeesMicrocap Companies, n=159
Number of Full-time Employees3
In total, the microcap companies studied employ more than 61,000 full-time employees. The microcap company with the largest employee count has 4,643 employees. Nearly one in five (18%) of the microcap companies employ more than 500 people. At the other extreme, slightly over one-third (34%) have fewer than 50 employees.
Finance Sector IndustriesMicrocap Companies, n=33
3One company, Monroe Capital Corporation (MRCC), is not included in this analysis because they did not report the number of people on which they rely at the affiliate or advisor firm. Three other companies [Gladstone Capital Corporation (GLAD), Capitala Finance Corporation (CPTA) and HMG/Courtland Properties Inc. (HMG)] are included since they provided the number of employees of the affiliate or advisor firm on which they rely.
70%
6%
9%
9%
6% Banks & Savings Institutions
Property-Casualty Insurers
Business & Finance Consumer Services
Investment Bankers/Brokers/Service
Other
6%
28%
15%20%
8%
18%2%
3%
Fewer than 10 employees
10-49 employees
50-99 employees
100-199 employees
200-299 employees
300-399 employees
400-499 employees
500 or more employees
Microcap Board Governance 11
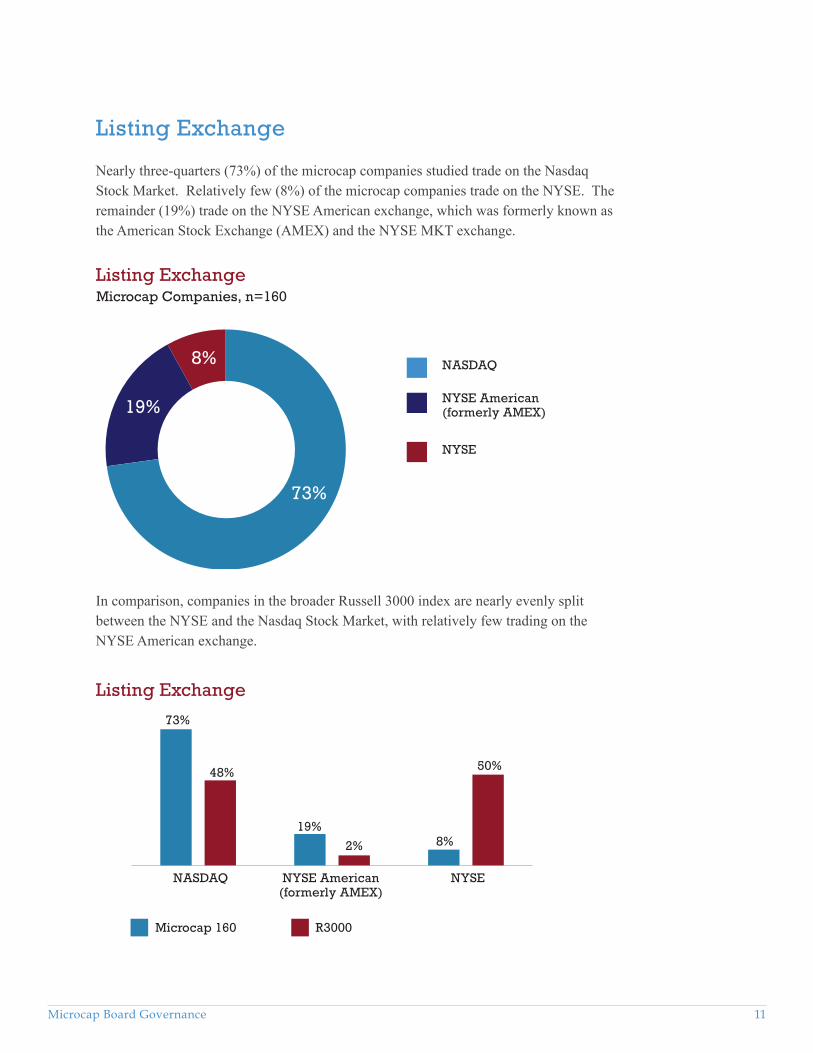
Listing Exchange
Nearly three-quarters (73%) of the microcap companies studied trade on the Nasdaq Stock Market. Relatively few (8%) of the microcap companies trade on the NYSE. The remainder (19%) trade on the NYSE American exchange, which was formerly known as the American Stock Exchange (AMEX) and the NYSE MKT exchange.
Listing ExchangeMicrocap Companies, n=160
In comparison, companies in the broader Russell 3000 index are nearly evenly split between the NYSE and the Nasdaq Stock Market, with relatively few trading on the NYSE American exchange.
Listing Exchange
73%
48%
19%
2% 8%
50%
NASDAQ NYSE American(formerly AMEX)
NYSE
Microcap 160 R3000
NASDAQ
NYSE American (formerly AMEX)
NYSE
73%
8%
19%

Microcap Board Governance 12
Within the Nasdaq Stock Market, there are three tiers: The Nasdaq Global Select Market®, The Nasdaq Global Market® and The Nasdaq Capital Market®. According to Nasdaq’s Initial Listing Guide, “the initial financial and liquidity requirements for the Nasdaq Global Select Market are more stringent than those for the Nasdaq Global Market and likewise, the initial listing requirements for the Nasdaq Global Market are more stringent than those for the Nasdaq Capital Market. Corporate governance requirements are the same across all Nasdaq market tiers.”4
Among those microcap companies studied that are listed on the Nasdaq, nearly half (47%) are in the Nasdaq Capital Market. Less than one-quarter (24%) are in the Nasdaq Global Select Market.
Nasdaq Market TiersMicrocap Companies, n=116
Reporting Category
There are four levels of filing categories available to companies when filing information with the Securities Exchange Commission (SEC):5 • Large Accelerated Filers• Accelerated Filers• Non-Accelerated Filers• Smaller Reporting Companies
4Nasdaq Initial Listing Guide, retrieved from: https://listingcenter.nasdaq.com/assets/initialguide.pdf 5Morrison & Foerster LLP, “Frequently Asked Questions about Periodic Reporting Requirements for US Issuers – Overview,” 2017. Retrieved from https://media2.mofo.com/documents/faq-periodic-reporting-requirements-for-us-issuers-overview.pdf
47%
29%
24%Nasdaq Capital Market
Nasdaq Global Market
Nasdaq Global Select

Microcap Board Governance 13
Reporting CategoryMicrocap Companies, n=159
Emerging Growth Companies
The 2012 Jumpstart our Business Startups (JOBS) Act allows newly public companies with less than $1.07 billion in revenues to qualify as an “emerging growth company” for up to five years after its IPO. These companies are allowed to provide “less extensive narrative disclosure than required of other reporting companies, particularly in the description of executive compensation,” among other lessened requirements.8 More than one in five (21%) of the microcap companies studied qualify as “emerging growth companies.”
Company History
The length of time that a company has been in business provides context for understanding a company’s stage in its corporate life cycle. This information can also be used to inform an analysis as to the reason for the size of the company (i.e., is the company in the microcap category because it is newly founded and in the growth phase, is it on the decline and near bankruptcy, or is it a company that is intentionally small or in a smaller economic niche?). Therefore, the year in which each company was founded and the year of each company’s initial public offering were identified.
In general, the category in which a company falls is based on the size of its public float or its revenues.6 More than half (53%) of the companies studied qualify as “smaller reporting companies.” Smaller reporting companies have lower disclosure requirements for certain governance issues, specifically compensation-related disclosures.7
6On June 28, 2018, the SEC voted to amend the definition of Smaller Reporting Companies in order to “expand the number of companies that qualify for certain existing scaled disclosure accommodations.” For more information, see: https://www.sec.gov/news/press-release/2018-116 Under the new definition, more of the companies studied may qualify for this category going forward. 7One company, Conifer Holdings, Inc. (CNFR), does not specify the category in which it falls in its 2017 Form 10-K.8Securities Exchange Commission, “Emerging Growth Companies.” Retrieved from https://www.sec.gov/smallbusiness/goingpublic/EGC
53%40%
7%Smaller Reporting Co
Accelerated Filer
Non-Accelerated Filer

Microcap Board Governance 14
Years Since Company’s FoundingMicrocap Companies, n=160
Most (69%) of the companies studied were founded between ten and fifty years ago. Only 6% of the microcap companies studied were founded within the last five years. The ten oldest companies in the study were founded more than 100 years ago; eight of those ten companies are banks.
Years Since Company’s IPOMicrocap Companies, n=160
Nearly one-third (32%) of the microcap companies studied have been publicly-traded between ten and twenty years. Less than one-quarter (22%) have been public for less than 5 years. These findings contradict the common wisdom that many microcap companies are early stage growth companies that have only recently accessed public capital. One study company [WSI Industries Inc. (WSCI)] has been public for more than 50 years (since 1958).
27%
9%5%
42%
17%Less than 5 years
5 to 10 years
10 to 20 years
20 to 50 years
More than 50 years
22%
22%
32%
23%
1%
Less than 5 years
5 to 10 years
10 to 20 years
20 to 50 years
More than 50 years

Microcap Board Governance 15
One reason cited for the decrease in the number of publicly-traded companies is the increased access to private capital available in recent years (e.g., private equity, sovereign wealth funds) may negate the need to access the public markets. In order to gauge this for the microcap companies studied, the number of years between founding and initial public offering were analyzed. However, most (54%) of the microcap companies studied went public within ten years of being founded.
Years Between Founding and IPOMicrocap Companies, n=160
Headquarters Location
Nearly a quarter (22%) of the microcap companies are headquartered in California. Another popular home state for microcap companies is Texas, where more than one in ten (13%) of the microcap companies studied are headquartered. Very few (3%) of the microcap companies are headquartered outside of the US (specifically Canada, China, Singapore and Taiwan).
A microcap company is much more likely to be headquartered in California than is a Russell 3000 company. The same is true for Texas. Furthermore, the microcap companies’ headquarters are concentrated in just ten states, with nearly three-quarters (74%) headquartered in California, Texas, New York, New Jersey, Pennsylvania, Virginia, Maryland, Colorado, Washington, or Connecticut. In contrast, nearly half (46%) of Russell 3000 companies are headquartered elsewhere.
27%
27%23%
11%
12% Less than 5 years
5 to 10 years
10 to 20 years
20 to 50 years
More than 50 years

Microcap Board Governance 16
Headquarter LocationMicrocap Companies, n=160
Headquarter Location
22%
16%13%
9% 9% 8%7%
3%5%5% 4% 3% 4%
2% 3% 3% 3% 2% 3% 2%
46%
23%
3%1%
Microcap 160 R3000
California
Texas
New York
New Jersey
Pennsylvania
Virginia
Maryland
Colorado
Washington
Connecticut
Other US States
Outside US
California
Texas
New York
New Jersey
Pennsylvania
Virginia
Maryland
Colorado
Washington
Connecticut
Other US States
Outside US
22%
13%
9%7%
5%5%
4%3%
3%3%
23%
3%

Microcap Board Governance 17
State of Incorporation
As one would expect, the majority (59%) of the microcap companies studied are incorporated in Delaware. Nevada and Maryland are the next most common states for microcap companies to incorporate. Very few (4%) of the microcap companies studied are incorporated in another country (specifically, Canada and Bermuda).
State of IncorporationMicrocap Companies, n=160
Microcap companies are just as likely to be incorporated in Delaware as Russell 3000 companies. Nevada is more likely to be the state of incorporation for the microcap companies studied when compared to Russell 3000 companies.
State of Incorporation
Delaware
Nevada
Maryland
Pennsylvania
New York
Virginia
Other US States
Outside US
59% 59%
8%
1%
7%7%2%2%
2%2% 2%2%
21%16%
5%4%
Microcap 160 R3000
59%
Delaware
Nevada
Maryland
Pennsylvania
New York
Virginia
Other US States
Outside US
8%
7%
16%
2%2%2%
4%

Microcap Board Governance 18
Ownership Structure
The distribution of corporate ownership can influence management’s decision making and the governance structure of the company. Executives and directors own at least 10% of the company’s stock at more than half (56%) of the microcap companies studied.
Percent Owned by Executives & DirectorsMicrocap Companies, n=159
Microcap companies are much more likely to have more than 10% of their stock owned by executives and directors compared to Russell 3000 companies. In other words, microcap companies are more likely to have a larger percent of their stock owned by insiders, with 56% of microcap companies having a 10% or more holder, compared to only 28% of Russell 3000 companies.
Percent Owned by Executives & Directors
Microcap 160 R3000
Less than 10% Between 10% and 49%
50% or More
44%
72%
47%
21%
9% 7%
Less than 10%
Between 10% and 49%
50% or more44%
47%
9%

Microcap Board Governance 19
Controlled Company Exemption
NYSE and the Nasdaq Stock Market offer a controlled company exemption to listed companies at which more than 50% of the “voting power for the election of its directors is held by a single person, entity or group.”9 Companies electing to take this election can “avoid certain corporate governance listing standards, including the requirement that the listed company’s board be composed of a majority of independent directors.”10
Although the microcap companies are more likely to have at least 10% of their stock owned by insiders, very few are majority owned. Only seven (4%) of the microcap companies reported that they are controlled companies.
Classes of Stock
Nearly all (93%) of the microcap companies studied have only one class of stock with shares that each have one vote. Among the study companies that have multiple classes of stock, the most common structure is a dual class stock structure, with one class having one vote per share and the other class having ten votes.
Microcap companies are slightly less likely to have multiple classes of stock when compared to companies in the Russell 3000 index. More than one in ten (12%) of Russell 3000 companies have multiple classes of stock, compared to only 7% of the microcap companies studied.
Number of Classes of Stock
Microcap 160 R3000
Multiple Classes One Class
7%12%
93%88%
9According to Practical Law by Thompson Reuters10Ibid

Microcap Board Governance 20
Board Size
In general, smaller companies tend to have fewer directors serving on their boards than do larger ones, and the microcap boards studied follow that trend. The average board size of the microcap companies studied is 6.9 directors, compared to 8.9 directors for Russell 3000 companies. Nearly a quarter (22%) of the microcap boards have fewer than six directors.
Board Composition
Board SizeMicrocap Companies, n=160
The comparison chart below supports the notion that smaller companies have boards with fewer directors. While fewer than one in five (18%) of the microcap companies studied have nine or more directors, the majority (53%) of the Russell 3000 boards have boards that large. At the other extreme, only 5% of the Russell 3000 boards have fewer than six directors compared to the 22% of the microcap companies studied. The very smallest boards, with four or fewer directors, are much more likely to be found at microcap companies. One in ten (10%) of the microcap boards studied have four or fewer directors and only 1% of the Russell 3000 companies have boards this small.
Fewer than 6 directors
6,7 or 8 directors
9 or more directors
60%
22%18%

Microcap Board Governance 21
Board Size
Microcap 160 R3000
Fewer than 6 directors
6, 7 or 8directors
9 or moredirectors
22%
5%
60%
41%
18%
53%
The microcap companies in the finance industry have the largest average board size. Banks tend to have larger boards than other publicly-traded companies, so this finding is not surprising given that over half of the finance sector microcap companies studied are banks. Technology companies have the smallest average board size; more than three directors fewer than the average for the finance boards.
Average Board SizeComparison by Industry Sector, Microcap Companies
6.37.0
6.57.2
9.0
6.55.9
Basic Ind &
Trans (n=16)
Capital G
oods (n=14)
Cons Goods & Svcs
Energy & Utilitie
s (n=10)
Finance (n=27)
Health C
are (n=46)
Technology (n=17)

Microcap Board Governance 22
Gender Diversity
Other studies11 have documented the fact that larger companies are more likely to have female directors when compared to smaller companies. This study confirms that this trend extends to boards of microcap companies. The prevalence of female microcap directors is much lower when compared to female directors serving on the boards of Russell 3000 companies. Only 8% of the microcap directors are women, while 16% of Russell 3000 directors are female.
Director Gender
Male
92%
Female
84%
8%16%
Microcap 160 R3000
The majority (61%) of the microcap companies studied have no female directors serving on their boards, while less than one-quarter (21%) of the Russell 3000 boards have no female directors. Furthermore, only 12% of the microcap companies have more than one female director, while nearly half (45%) of the Russell 3000 companies have more than one female director.
Number of Women on Boardn=160
No Women
1 Woman
More than 1 Woman61%
27%
12%
11For example, see “Board Refreshment Trends at S&P 1500 Firms” by Institutional Shareholders Services, published by Investor Responsibility Research Center Institute, January 2017, at page 46.

Microcap Board Governance 23
Number of Women on Board
Microcap 160 R3000
No Women 1 Woman More than 1 Woman
61%
21%27%
35%
12%
45%
The microcap companies in the Energy and Utilities sector and the Basic Industries and Transportation sectors are the most likely to have all male boards. Finance microcap companies are the most likely to have at least one female director.
Percent of Boards in Industry Sector with No Female DirectorsMicrocap Companies
65%
61%
44%
90%
57%
57%
75%
Technology (n=17)
Health Care (n=46)
Finance (n=27)
Energy & Utilities (n=10)
Cons Goods & Svcs (n=23)
Capital Goods (n=14)
Basic Ind & Trans (n=16)

Microcap Board Governance 24
Director Age
The ages of the directors serving on microcap and Russell 3000 boards do not differ greatly. The average director age for the microcap directors is 61.9 years, which is very close to the average age of 61.7 years for Russell 3000 directors. Similarly, both the microcap and Russell 3000 directors have a median age of 62.0 years. The ages of the microcap directors studied range from 31 years to 93 years, while the ages for Russell 3000 directors range from 23 to 95 years.
Directors of the microcap companies studied are more likely to be at the younger and older ends of the age spectrum. Just under one in eight (12%) microcap directors are under the age of 50, compared to 9% of Russell 3000 directors. At the other end of the age spectrum, a total of 25% of the microcap directors are 70 years or older, compared to 20% of Russell 3000 directors.
Director AgesMicrocap Directors, n=1,103
Director Ages
Under 50 years
Between 50 and 59
Between 60 and 69
Between 70 and 79
80 years and older
Microcap 160 R3000
12%9%
28%30%
35%40%
21%18%
4% 2%
Under 50 years
Between 50 and 59
Between 60 and 69
Between 70 and 79
80 years and older
12%
28%
35%
21%
4%

Microcap Board Governance 25
Director Tenure
Director tenure does not differ dramatically based on company size. The average director at microcap companies has served for 8.6 years, compared to 8.5 years for the average Russell 3000 director. Similarly, the median director serving on the microcap boards has served for 6.0 years, and the median Russell 3000 director has served for 6.2 years.
Board refreshment is a topic of discussion in many boardrooms these days. One-quarter (25%) of the microcap directors joined their boards within the last three years. This is not much different than the 28% of Russell 3000 directors who have done so; however, the refreshment rate dropped dramatically last year; 19% of the Russell 3000 directors joined their boards within the year prior to the filing of 2017 proxies while only 5% of the microcap directors had done so.
Nearly one-third (32%) of the microcap directors have served for more than ten years, which is similar to the one-third (33%) of Russell 3000 directors who have served for more than ten years.
Director TenureMicrocap Directors, n=1,088
25%
43%
32%Less than 3 years
Between 3 and 10 years
More than 10 years

Microcap Board Governance 26
More than one-quarter (27%) of the microcap companies studied have boards which are comprised of a majority of directors who served on the board prior to the company’s IPO. Furthermore, at 7% of the microcap companies studied, more than half of the directors have served on the board since the year the company was founded.
A director who has served since the early days of the company can bring valuable historical perspective and institutional knowledge. However, a board that is dominated by directors with this type of tenure may not benefit from new ideas and fresh perspectives, or from new skills necessitated by changes in corporate strategy or the competitive landscape.
Director Independence
Nearly three-quarters (74%) of the microcap company directors studied were determined to be independent directors by their companies. These determinations likely are based on independence standards which follow regulatory standards and listing exchange requirements.
As shown in the chart below, most (73%) of the non-independent directors are current employees of the company, often referred to as “inside directors”.12 Slightly more than one in ten (11%) of the non-independent directors recently worked for the company and are, therefore, not considered independent directors. Another 11% of the non-independent directors lack independence due to payments they received from the company other than director fees, or due to financial transactions they (or companies
Director Tenure
Microcap 160 R3000
Less than 3 years
Between 3 and 10 years
More than 10 years
25%28%
43%
39%
32%33%
12 See the section titled “Inside Directors” for further information about these directors

Microcap Board Governance 27
with which they are affiliated) had with the company during the last year. Four percent of the non-independent directors are family members of employees of the company.
Reason for Directors’ Lack of IndependenceMicrocap Directors, n=284
All but one of the companies studied have boards comprised of a majority of independent directors. Only three of the eight directors on the Unico American Corporation (UNAM) board are considered independent by the company. Since it is a controlled company, Unico American is exempt from the Nasdaq listing rules which require listed companies to have a majority of independent directors on their boards.
Percent of Board that is IndependentMicrocap Companies, n=160
Current Employee
Former Employee
Transaction with or Payment from Company or Affiliated Entity
Relative of Employee
Not Described73%
11%
11%
4% 1%
73%
11%
20%
29%
36%
3% 1%Less than 50%
50% - 59%
60% - 69%
70% - 79%
80% - 89%
90% - 100%

Microcap Board Governance 28
Companies in the Russell 3000 index are more likely to have boards which are at least 90% independent when compared to the microcap companies studied. Only 3% of the microcap companies studied have boards that are at least 90% independent, while 13% of the Russell 3000 boards have that level of independence.
Percent of Board that is Independent
Microcap 160 R3000
Less than 50%
1%
50% to59%
60% to69%
70% to 79%
80% to 89%
90% to100%
3%
11% 10%
20%
13%
29%25%
36% 36%
3%
13%
Inside Directors
Given the scrutiny of board independence in today’s governance environment, the CEO is typically the only employee, or insider, serving on the board of directors at many larger capitalization companies. Most of the microcap companies studied follow this trend, with more than two-thirds (71%) having only one employee (likely the CEO) serving on the board. However, a few (2%) of the microcap companies studied have three or more insiders serving as directors. One company [Zion Oil & Gas Inc. (ZN)] has five insiders on the board.
Number of Insiders on the BoardMicrocap Companies, n=160
No Insiders
1 Insider
2 Insiders
3 or More Insiders
71%
26%
2% 1%

Microcap Board Governance 29
Number of Insiders on the Board
While both the microcap and Russell 3000 companies are equally as likely to have one insider (likely the CEO) on their boards, the microcap companies are slightly more likely to have two inside directors. More than one-quarter (26%) of the microcap companies have two insiders, compared to 22% of the Russell 3000 companies.
No Insiders 1 Insider 2 Insiders 3 or more Insiders
1%
Microcap 160 R3000
2%
71%70%
26%22%
2%6%
Service on Other Boards
More than three-quarters (83%) of the directors serving on microcap boards do not currently serve on the boards of other publicly-traded companies. In contrast, more than one-third (35%) of the directors serving on Russell 3000 boards serve on at least one other public company board.
Number of Other Public Company Boards on which Directors ServeMicrocap Directors, n=1,091
No other boards
1 other board
More than 1 other board
83%
11%6%

Microcap Board Governance 30
Number of Other Public Company Boards on which Directors Serve
Microcap 160 R3000
No otherboards
1 otherboard
2 otherboards
3 otherboards
More than 3 other boards
83%
65%
11%22%
4%9%
2% 3% 1%0%

Microcap Board Governance 31
Board Meetings
Microcap boards tend to have more variability in the number of board meetings held than do larger companies. Many microcap boards held 12 or more meetings in 2016. The microcaps were also more likely than Russell 3000 boards to have held fewer than four meetings that year.
The median microcap board met eight times during 2016. Nearly half of the microcap boards studied met between four and seven times during 2016. One in twenty (5%) of the microcap boards met less frequently than quarterly, which is generally considered the minimum that a board needs to fulfill its fiduciary duties. Three of the microcap boards studied [Biomerica Inc. (BMRA), Flexible Solutions International Inc. (FSI), and Zion Oil & Gas Inc. (ZN)] met only twice during 2016. At the other extreme, nearly one-quarter (24%) of the microcap boards studied met at least 12 times.
Board Practices
Number of Board MeetingsMicrocap Companies, n=160
Microcap companies in the Finance sector held the most board meetings, on average, during 2016. Microcap companies in the Energy and Utilities sector held the fewest meetings, on average.
Less than 4 meetings
4 to 7 meetings
8 to 11 meetings
12 or more meetings44%
27%
24%5%

Microcap Board Governance 32
Number of Board Meetings
Microcap 160 R3000
Less than 4 meetings
4 to 7 meetings
8 to 11meetings
12 or more meetings
5%2%
44%52%
27%29%
24%17%
Average Number of Board MeetingsComparison by Industry Sector, Microcap Companies
11.6
9.3
7.6
Basic Ind &
Trans (n=16)
8.0
6.5
8.27.4
Capital G
oods (n=14)
Cons Goods &
Svcs (n=23)
Energy & Utilitie
s
(n=10)
Finance (n=27)
Health C
are (n=46)
Technology (n=17)

Microcap Board Governance 33
Board Leadership
Many governance experts prefer that an independent director chair the board. Nearly two-thirds (62%) of the microcap company boards studied have separated the roles of CEO and Board Chair. This is the exact same ratio as at companies in the Russell 3000.
Role of CEO and Board Chair
Microcap 160 R3000
Combined Separate
More than half (61%) of the microcap companies in the Consumer Goods and Services sectors have combined the roles of CEO and Board Chair. Technology companies are also likely to have one person serving in both roles. In contrast, only one in seven (14%) of the microcap companies in the Capital Goods sector have this board leadership structure.
Percent of Boards in Industry Sector with Combined CEO and Board Chair RolesMicrocap Companies
47%Technology (n=17)
Health Care (n=46)
Finance (n=27)
Energy & Utilities (n=10)
Cons Goods & Svcs (n=23)
Capital Goods (n=14)
Basic Ind & Trans(n=16)
31%
37%
30%
61%
14%
31%
38% 38%
62% 62%

Microcap Board Governance 34
Prevalence of Lead Director when CEO and Board Chair Roles are CombinedMicrocap Companies, n=60
Contrary to best practice, among those microcap companies which have combined the roles of CEO and Board Chair, most (70%) have not named an independent lead director. In fact, many of the microcap companies studied state explicitly that they do not have a lead director and have chosen to not do so intentionally.
Independence of Board Chair when CEO and Board Chair are SeperateMicrocap Companies, n=100
Non-Independent Chair
Independent Chair
No Chair
70%
30%
29%
63%
8%
Combined with Lead Director
Combined with No Lead Director

Microcap Board Governance 35
Among those microcap companies which have separated the roles of CEO and Board Chair, the majority (63%) had an independent director leading the board. On the other hand, this means that more than one-third (37%) of these companies are not led by an independent chair.
It is notable that eight (8%) of these companies did not have a Board Chair. In fact, six of these companies reported in their proxy statements that their board leadership structures do not include the role of Board Chair.
Board Committees
More than two-thirds (71%) of the microcap boards have three committees, typically the Audit, Compensation, and Nominating/Governance Committees. Companies traded on the Nasdaq Stock Market are not required to have a standing nominating committee, although many chose to do so. Microcap companies are slightly more likely than the Russell 3000 companies to take advantage of this alternative.
Beyond the three standard board committees, other committees commonly reported by the microcap companies were Executive Committees, Finance Committees, Strategy Committees and Technology Committees. However, as might be expected, larger companies have more complex committee structures, and so the prevalence of these committees was slightly higher among the Russell 3000 boards.
Board Committees
Audit
Compensation
Nominating/
GovernanceExecutiv
e
Finance
Strategy
Technology
Microcap 160 R3000
100% 100%98% 99%
94% 95%
10%23%
6%18% 16%
2% 3% 6%

Microcap Board Governance 36
Number of Committee MembersAudit Committee Compensation
CommitteeNominating/ Governance Committee
n 160 157 150Minimum 2 2 1
Median 3 3 3Average 3.4 3.2 3.3
Maximum 13 7 10Mode (most
common observation) 3 3 3
Percent with Mode 66% 57% 54%
Committee Size
Most board committees have three members. As indicated in the table below, Audit Committees are slightly larger, on average, than the other committees of microcap boards. It is notable that three of the microcap companies ([AquaBounty Technologies, Inc. (AQB), Genius Brands International, Inc. (GNUS), and SemiLEDS Corporation (LEDS)]13 have Nominating/Governance Committees which had only one member as of the time of the company’s 2017 proxy filing.
Committee Meetings
Microcap board Audit Committees meet more frequently than the other committees. The median Audit Committee met five times in 2016, while the Compensation Committee met four times and the Nominating/Governance Committee met only twice. Surprisingly, the most commonly reported number of meetings for both the Compensation Committees and Nominating/Governance Committees was only one meeting. Further, nearly one in ten (9%) of the microcap Nominating/Governance Committees reported holding no meetings in 2016.
13 All three of these companies are listed on the Nasdaq Stock Market, which does not require listed companies to have a Nominating/Governance Committee. Via email, a representative from AquaBounty indicated that “other directors are included on a case-by-case basis depending upon the issue involved.”

Microcap Board Governance 37
Number of Committee Meetings
Audit Committee Compensation Committee
Nominating/ Governance Committee
n 160 157 150Minimum 1 0 0
Median 5 4 2Average 5.4 4.3 2.3
Maximum 13 23 10Mode 4 1 1
Percent with Mode 35% 19% 29%
Director Elections
Microcap 160 R3000
46%42%
54%58%
Classified Board Annual Elections
Director Elections
The prevalence of classified boards is similar among microcap and Russell 3000 companies. Over half (54%) of the microcap boards allow shareholders elect their directors annually; compared to the 58% of Russell 3000 boards which have annual elections.
More than two-thirds (69%) of the microcap companies in the finance sector have classified boards, which is the highest among the industry sectors analyzed. Microcap companies in the Basic Industries and Transportation sectors are the least likely to have a classified board.

Microcap Board Governance 38
Only 11% of the microcap companies studied have adopted a true majority standard for uncontested director elections. The vast majority (89%) of microcap directors are elected using a plurality standard, meaning that an uncontested director can be elected even if a majority of shares are voted against that director candidate. None of the microcap companies studied in the Health Care or Finance industries have adopted a true majority voting standard.
Director Election Standard
Microcap 160 R3000
89%
Plurality Majority
46%
11%
54%
Percent of Boards in Industry Sector which are Classified
Technology (n=17)
Health Care (n=46)
Finance (n=27)
Energy & Utilities (n=10)
Cons Goods & Svcs (n=23)
Capital Goods (n=14)
Basic Ind & Trans(n=16)
42%
47%
69%
33%
36%
47%
28%
By contrast, the majority (54%) of companies in the Russell 3000 have adopted a majority standard, compared to only 11% of microcap companies which have done so.

Microcap Board Governance 39
Director Election Results14
Election results were available for 666 directors of the microcap companies. For about three-quarters (76%) of these directors, at least 90% of the votes cast were in support of their candidacy. However, it is notable that more than one in 20 (6%) of the directors failed to receive support from 25% or more of the votes cast.
14 The following formula was used to calculate vote results: Votes FOR / (Votes FOR + Votes Withheld or Against). Abstentions or broker non-votes were not taken into consideration.
Percent of Votes Withheld or Voted Against Directorsn=666
50% or more
25% - 49.9%
10% - 24.9%
Less than 10%
76%
18%
5%
1%
The following three companies had directors which failed to receive support from the majority of the votes cast.
• DMC Global Inc. (BOOM) One director, Yvon Pierre Cariou, failed to receive support from a majority of the votes cast. Mr. Cariou served as the CEO of DMC Global until 2013 and received consulting fees from the company during 2016. Despite that, the board determined that he was an independent director, and he served on the Corporate Governance and Nominating Committee during 2016.
• CYTRX Corporation (CYTR) Steven A. Kriegsman, Chairman and CEO of CYTRX, also failed to receive support from a majority of the votes cast. CYTRX Corporation’s board is elected in classes and Mr. Kriegsman was the only member of the class of directors which was up for election at the company’s 2017 annual shareholder meeting. However, he still serves as the Chairman and CEO of the company.

Microcap Board Governance 40
• CorMedix Inc. (CRMD) All five of the continuing directors on the CorMedix board failed to receive support from a majority of the votes cast; however, three of these directors still serve on the CorMedix board. A sixth director, the Chair of the Board, Cora Tellez, resigned from the board “immediately prior to the Company’s 2017 annual meeting.”15
Shareholder Proposals
Only one of the microcap companies studied included a shareholder proposal in their 2017 proxy statement. Reed’s Inc. (REED) shareholders voted on a so-called Proxy Access proposal, submitted by shareholder James McRitchie, which called on the company’s board “to amend its bylaws or other documents, as necessary, to provide proxy access for shareholders.”16 Nearly one-third (29%)17 of the votes cast were voted in favor of this proposal.18
Board Refreshment Policies
The corporate governance guidelines and proxy statements of the microcap companies studied were reviewed to determine the prevalence of board refreshment policies. Just over one in ten (11%) microcaps disclosed age limits for their directors. The most common age cited as the director age limit was 75 years.
Director Age LimitsMicrocap Companies, n=18
Age 70
Age 72
Age 74
Age 75
Age 76
Age not reported39%
11%
11% 17%
17%
5%
15 CorMedix, Inc. Form 8-K filed June 13, 2017.16 Reeds, Inc. DEF 14A filed September 1, 2017.17 The following formula was used to calculate vote results: Votes FOR / (Votes FOR + Votes Withheld or Against). Abstentions or broker non-votes were not taken into consideration.18 Reeds, Inc. Form 8-K filed October 5, 2017.
Microcap Board Governance 41
Term limits are a much less commonly-used board refreshment tool among microcap companies. Only one microcap company disclosed a term limit for directors; DMC Global, Inc. (BOOM) states that “directors should serve no longer than a total of 15 years.”19
In addition to board refreshment policies, board evaluations can be an effective tool for ensuring board effectiveness. More than half (53%) of the microcap companies reported the fact that they conduct board evaluations.
19 DMC Global, Inc. Proxy Statement dated April 5, 2017.

Chief Executive Officers
CEO Ages
Microcap 160 R3000
12%
Under 50 years
Between 50 and 59 years
Between 60 and 69 years
Between 70 and 79 years
80 yearsand older
14%
46%51%
34%29%
6% 6%1% 1%
CEO AgesMircocap Companies, n=155
Under 50 years
Between 50 and 59
Between 60 and 69
Between 70 and 79
80 years and older
12%
47%
34%
6%
1%
Microcap Board Governance 42
CEO Age
The chief executive officers (CEOs) of the microcap companies studied range in age from 41 to 82 years old. The average CEO is 58.3 years old. Nearly half (47%) of the microcap company CEOs are in their 50s.
The average age of the microcap CEOs is slightly higher than the average age of Russell 3000 CEOs, which is 57 years. As shown in the chart below, the ages of the microcap CEOs and CEOs of Russell 3000 companies do not differ dramatically. However, the microcap CEOs are slightly more likely to be in their sixties when compared to Russell 3000 companies.

Microcap Board Governance 43
CEO Gender
Men dominate the CEO offices of publicly-traded companies in the US. This pattern is present among the microcap companies studied, where only 4% of the CEOs are women. This is only slightly lower than the 5% of the Russell 3000 companies which are led by female CEOs.
CEO GenderMircocap Companies, n=156
Male
Female
96%
4%
Microcap 160 R3000
CEO Gender
96%
Male Female
95%
4% 5%

Microcap Board Governance 44
CEO Tenure
The tenure20 of the microcap CEOs studied ranged from zero to 49 years. The average tenure of these CEOs was 10.7 years, while the median tenure was 7 years.
CEO Tenure
Microcap 160 R3000
Less than 3 years
24%
Between 3 and 10 years
More than 10 years
22%
39% 40%37% 38%
20 For the purposes of this analysis, CEO tenure is measured as of the date the CEO joined the board of directors.
CEO TenureMircocap Companies, n=155
24%
39%
37%
Less than 3 years
Between 3 and 10 years
More than 10 years
Microcap CEO tenure does not differ significantly from the tenure of CEOs of Russell 3000 companies. The average tenure of a Russell 3000 CEO is 10.3 years and the median tenure of these CEOs is 7.3 years (compared to 10.7 years and 7.0 years for the microcap CEOs, as noted above).
Microcap Board Governance 45
Founder Status
One in seven (14%) of the microcap CEOs studied were the founders of the companies they lead. The average age of these CEO-founders is 60 years, 1.7 years more than the average age of 58.3 years for all microcap CEOs studied. Three of these CEO-founders are female [Pamela G. Marrone, PhD founded Marrone Bio Innovations, Inc. (MBII), Dr. Linda Marban co-founded Capricor Therapeutics, Inc. (CAPR), and Thanh H. (Tawny) Lam co-founded the predecessor entity of Nova Lifestyle, Inc. (NVFY)].
Say on Pay
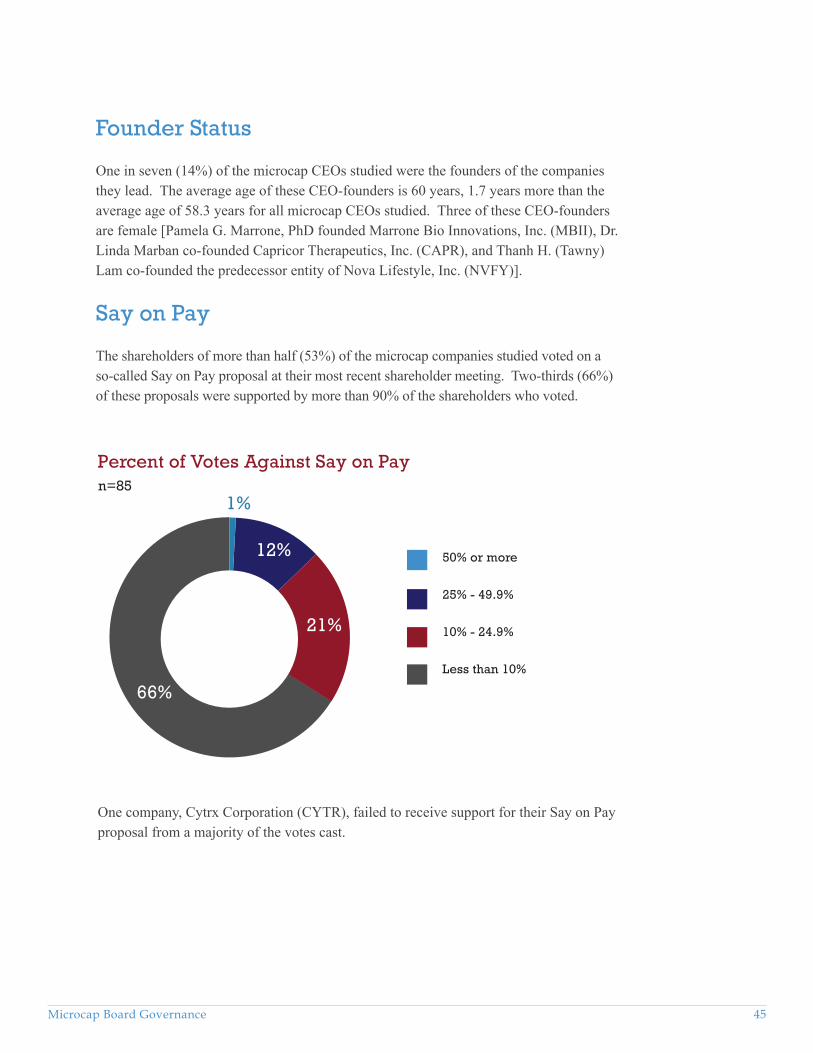
The shareholders of more than half (53%) of the microcap companies studied voted on a so-called Say on Pay proposal at their most recent shareholder meeting. Two-thirds (66%) of these proposals were supported by more than 90% of the shareholders who voted.
Percent of Votes Against Say on Payn=85
66%
50% or more
25% - 49.9%
10% - 24.9%
Less than 10%
21%
12%
1%
One company, Cytrx Corporation (CYTR), failed to receive support for their Say on Pay proposal from a majority of the votes cast.

Microcap Board Governance 46
Director Compensation21
Total Board Compensation
On average, microcap companies spent just over $500,000 (including cash and equity-based awards) compensating their non-employee directors in 2016. The highest amount of total board compensation was more than $2.3 million. The lowest amount was approximately $6,000.
Total Board CompensationMicrocap Companies
n=158Minimum $6,263
25th Percentile $231,061Median $423,879Average $509,446
75th Percentile $683,550 Maximum $2,311,879
Microcap companies, on average, spend significantly less on board compensation compared to companies in the Russell 3000. At the median, the total amount spent on board compensation by Russell 3000 companies in 2016 was nearly $1.4 million, compared to almost $425,000 spent by the microcap companies.
Total Board Compensation
Microcap 160 R3000
25th Percentile
$231,061
Median 75th Percentile
$785,116
$423,879
$1,379,440
$683,550
$2,119,404
21 Two of the Microcap 160 companies are not included in the analysis; Pangaea Logistics Solutions Ltd. (PANL) did not provide information regarding director compensation in their 2017 proxy statement, and the director compensation reported in the 2017 proxy statement for Apollo Endosurgery, Inc. (APEN) relates to pre-merger payments made to directors when the company was privately-held.

Microcap Board Governance 47
Individual Director Compensation On an individual basis, the average microcap director received just over $90,000 (including cash and equity-based awards) for his or her board service in 2016. The average amount paid to each director ranged from about $3,000 to nearly $485,000.
Average Individual Director CompensationMicrocap Companies
n=158Minimum $3,132
25th Percentile $37,192Median $74,331Average $90,599
75th Percentile $117,331Maximum $484,755
The average microcap director receives significantly less in director compensation than the average Russell 3000 company director. At the median, the average individual director serving on a Russell 3000 company board received nearly $180,000 in 2016, while the average microcap director received almost $75,000.
Average Individual Director Compensation
Microcap 160 R3000
25th Percentile
$37,192
Median 75th Percentile
$116,585$74,331
$179,195
$117,331
$242,830

Microcap Board Governance 48
Annual Retainers for Directors
Nearly all (88%) of the microcap companies pay their directors an annual retainer. On average, the retainer is about $36,000. However, there is a wide range in these annual retainers, from $5,000 per director per year to $240,000. Just under one in ten (9%) of the microcap companies studied paid its directors a $40,000 retainer.
Average Director RetainerMicrocap Companies
n=139Minimum $5,000
25th Percentile $24,000Median $35,000Average $36,305
75th Percentile $45,000Maximum $240,000
Russell 3000 companies pay their directors much higher annual retainers when compared to the microcap companies studied. At the median, Russell 3000 companies pay their directors annual retainers of $60,000 compared to a median of $35,000 paid by the microcaps.
Average Retainer for Directors
Microcap 160 R3000
25th Percentile Median 75th Percentile
$24,000
$40,000 $35,000
$60,000$45,000
$80,000

Microcap Board Governance 49
Annual Retainers for Board Leaders
Nearly three-quarters of (73%) of microcap companies which have a separate board chair pay him or her an additional annual retainer. Among those companies that have a lead director, more than half (56%) pay him or her an additional annual retainer.
On average, board chairs receive a higher additional annual retainer than lead directors. The average board chair’s additional annual retainer is just over $41,000, compared to less than $15,000 additional annual paid to a lead director.22
Additional Annual Retainer for Board LeaderMicrocap Companies
Board Chair Lead Directorn=75 n=21
Minimum $4,500 $1,00025th Percentile $19,750 $10,000
Median $25,000 $12,500Average $41,699 $14,857
75th Percentile $47,500 $20,000Maximum $300,000 $40,000
The most common additional retainer paid to microcap board chairs is $20,000, which is paid by 13% of the companies that pay an additional board chair retainer. The most common additional retainer paid to a lead director of a microcap board is $10,000, which is paid by 19% of those companies that pay their lead directors an additional annual retainer.
The additional annual retainers paid to board chairs of microcap companies are about half of those paid to board chairs of Russell 3000 companies. Similarly, the additional annual retainers paid to the lead directors of microcap boards are less than those paid to Russell 3000 lead directors.
22 Eight companies which did not have a separate board chair in 2016 still reported the additional annual retainer that a board chair would receive under their director compensation plan, and eleven companies reported the amount a lead director would receive despite not having a lead director in 2016. These retainers are included in the summary statistics discussed here and presented in the tables below.

Microcap Board Governance 50
Microcap 160 R3000
25th Percentile Median 75th Percentile
$19,750$30,000 $25,000
$50,000 $47,500
$100,000
Annual Retainer for Board Chairs
Annual Retainer for Lead Directors
Microcap 160 R3000
25th Percentile Median 75th Percentile
$10,000
$15,000$12,500
$25,000$20,000
$30,000
Committee Member Retainers
Directors often receive additional annual retainers for serving on board committees. About one-third of microcap companies pay their directors an annual cash retainer for serving as a member of a committee.
Most commonly, the members of the Audit Committee receive the highest annual retainer, with the members of the Nominating/Governance Committee receiving the lowest additional annual retainer. The chart below shows that the microcap boards studied follow this common practice.

Microcap Board Governance 51
The most common retainer paid to audit committee members is $7,500. For both compensation committees and nominating/governance committees, the most common committee member retainer is $5000.
Members of microcap board committees receive much smaller committee retainers than committee members at Russell 3000 companies.
Prevalence of Committee Member RetainerMicrocap Companies
Audit Committee(n=160)
34%
Compensation Committee
(n=157)
Nominating/Governance
Committee (n=150)
32%
31%
Annual Retainer for Committee MembersMicrocap Companies
Audit Committee
Compensation Committee
Nominating/Governance Committee
n=54 n=51 n=47Minimum $1,000 $1,000 $1,000
25th Percentile $5,125 $5,000 $3,250Median $7,500 $5,000 $4,000
Average $7,572 $5,292 $4,45075th Percentile $10,000 $6,250 $5,000
Maximum $25,000 $10,000 $10,000

Microcap Board Governance 52
Median Committee Member Retainers
Microcap 160 R3000
Audit Compensation Nominating/Governance
$7,500
$10,000
$5,000
$7,500
$4,000$5,000
Committee Chair Retainers
Boards often recognize the additional work required to serve as the chair of a board committee by awarding committee chairs a higher committee retainer than those paid to committee members. In some cases, committee chair retainers are often paid even when the other members of the committee do not receive a committee retainer.
Prevalence of Additional Committee Chair RetainersMicrocap Companies
Audit Committee(n=160)
Compensation Committee
(n=157)
Nominating/Governance
Committee (n=150)
66%
58%
51%

Microcap Board Governance 53
The table below presents the additional annual retainers paid to committee chairs. The amounts reported below are the additional amount that the committee chair receives, above and beyond the committee member retainers (i.e., the committee chairs receive the committee member retainer plus the additional committee chair retainer).
Similar to the audit committee members, audit committee chairs receive the highest additional committee chair retainers. The maximum, or highest, additional committee chair payments are notable because they are drastically higher than the median levels, which indicates that there are outliers on the high end of committee chair payments among the microcap companies studied.
Annual Retainer for Committee ChairsMicrocap Companies
Audit Committee
Compensation Committee
Nominating/Governance Committee
n=106 n=91 n=76Minimum $500 $1,000 $1,000
25th Percentile $6,000 $5,000 $3,750Median $9,000 $5,000 $5,000
Average $10,648 $7,156 $5,71075th Percentile $12,500 $8,000 $6,000
Maximum $90,000 $60,000 $30,000
When it comes to retainers paid to committee chairs, the Russell 3000 pay significantly higher amounts in comparison to the amounts paid by microcap companies.
Median Committee Chair Retainer
Microcap 160 R3000
Audit Compensation Nominating/Governance
$9,000
$20,000
$5,000
$15,000
$5,000
$10,000

Microcap Board Governance 54
Meeting Fees
Some boards pay directors fees for attending board and committee meetings. Nearly one-third (32%) of the microcap companies studied pay meeting fees to all directors for board meetings. It is less common for microcap directors to receive fees for attending committee meetings. Only 22% of the companies studied pay directors committee meeting fees.
Fees for Meeting AttendanceMicrocap Companies
Board Meetings Committee Meetingsn=50 n=35
Minimum $100 $20025th Percentile $1,000 $500
Median $1,000 $1,000Average $1,515 $997
75th Percentile $1,663 $1,250Maximum $5,000 $3,400
Microcap directors are more likely to receive attendance fees for board meetings than the directors of the Russell 3000 companies. However, committee meeting fees are less common among the microcap companies when compared to the Russell 3000 companies.
Prevalance of Fees for Meeting Attendance
Microcap 160 R3000
Board Meeting Fees Committee Meeting Fees
32%
22% 22%24%
Russell 3000 directors are more likely to receive higher meeting attendance fees. The most common meeting fee is $1,000 for both board and committee meetings at microcap companies, while it is $1,500 at the Russell 3000 companies.

Microcap Board Governance 55
Equity-based Awards
More than three-quarters (77%) of the microcap companies studied make annual equity-based awards to their directors. The most common type of equity-based awards are stock options, which are granted by nearly half (46%) of those companies which grant some type of equity-based awards to directors. Restricted stock or restricted stock units (RSUs) are also commonly-used annual equity awards for microcap directors.
Type of Equity Awarded to DirectorsMicrocap Companies, n=122
While, as noted above, nearly half (46%) of the microcap companies which grant equity-based awards to their directors awarded stock options in 2016, only 13% of the Russell 3000 companies did so. On the other hand, Russell 3000 companies are much more likely to award restricted stock or RSUs to their directors.
46%
Stock Options
RSUs
Restricted Stock
Stock Awards
Combination of Equity Awards
15%
17%
10%
12%

Microcap Board Governance 56
Prevalance of Equity-based Awards
Microcap 160 R3000
Stock Options
46%
RSUs Restricted Stock
Stock Awards
Combination of Equity Awards
13%15%
37%
17%
30%
10% 11% 12%9%
Stock Ownership Guidelines
Companies often require their directors to own a certain amount of company stock in the belief that it aligns interests with shareowners. While this is a common practice among larger companies, fewer than one in five (16%) of the microcap companies studied reported having stock ownership guidelines in their proxy statements.
Among those microcap companies which have director stock ownership guidelines, most (54%) allow directors five years to achieve the required level of stock ownership. The level of stock ownership is most often calculated as a multiple of the annual retainer for directors. The multiples for the microcap company stock ownership guidelines range from 1.5 times to five times. More than one-third (35%) of the microcap companies require that directors hold stock worth three times the annual director retainer.

Microcap Board Governance 57
Methodology Company Selection
The list of publicly-traded companies with market capitalization less than $300 million which are listed on the NYSE, NYSE American, or Nasdaq exchanges was obtained from the Nasdaq Company List.23 Once non-corporate entities (e.g., ETFs, ETNs, portfolios, funds, and indices) were removed, this list included 1,552 publicly-traded companies. The random-number-generator function in Excel was used to select companies to consider for inclusion in the study. Companies were excluded from the study and replaced with the next company in the randomly-generated list if they were not operating companies, had only filed proxies for special meetings or merger proxies, or otherwise did not provide the relevant information in their 2017 filing. This process was conducted until 160 microcap companies were selected for study.
Data Sources
Data for the microcap companies, CEOs, boards, and directors was hand-collected from proxy statements and Forms 10-K filed during 2017, as well as corporate governance guidelines and company websites, by Board Governance Research LLC, unless otherwise noted below:
• The Russell 3000 data is from proxy statements filed during 2017 and was provided by Equilar, Inc., an executive and board data company, and MSCI ESG Research.
• Data regarding director election results, Say on Pay and shareholder proposals was provided by Fund Votes Research Ltd.
• The market capitalization, sector and industry data was pulled from Nasdaq’s Company List in August 2017.
• The Nasdaq Stock Market tiers were provided by Nasdaq, Inc.24 • The founding and IPO years were found in the company’s Form 10-K, on the
company’s website, or via an internet search of websites such as Crunchbase.com and wallmine.com.
23Available at https://www.nasdaq.com/screening/company-list.aspx24The views expressed herein are strictly those of the authors. The views herein are not intended to represent the views of Nasdaq, Inc., its employees, or directors. Any errors or omissions are the responsibility of the authors alone.
Microcap Board Governance 58
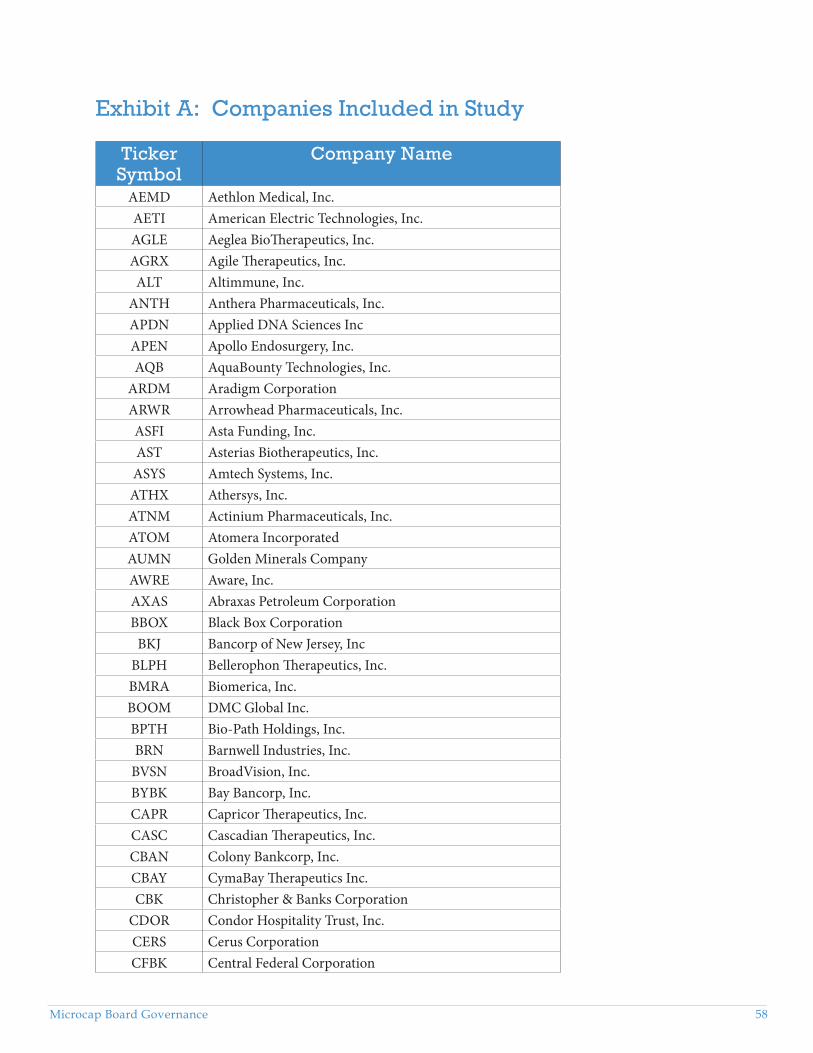
Exhibit A: Companies Included in Study
Ticker Symbol
Company Name
AEMD Aethlon Medical, Inc.AETI American Electric Technologies, Inc.AGLE Aeglea BioTherapeutics, Inc.AGRX Agile Therapeutics, Inc.ALT Altimmune, Inc.
ANTH Anthera Pharmaceuticals, Inc.APDN Applied DNA Sciences IncAPEN Apollo Endosurgery, Inc.AQB AquaBounty Technologies, Inc.
ARDM Aradigm CorporationARWR Arrowhead Pharmaceuticals, Inc.ASFI Asta Funding, Inc.AST Asterias Biotherapeutics, Inc.
ASYS Amtech Systems, Inc.ATHX Athersys, Inc.ATNM Actinium Pharmaceuticals, Inc.ATOM Atomera IncorporatedAUMN Golden Minerals CompanyAWRE Aware, Inc.AXAS Abraxas Petroleum CorporationBBOX Black Box Corporation
BKJ Bancorp of New Jersey, IncBLPH Bellerophon Therapeutics, Inc.BMRA Biomerica, Inc.BOOM DMC Global Inc.BPTH Bio-Path Holdings, Inc.BRN Barnwell Industries, Inc.
BVSN BroadVision, Inc.BYBK Bay Bancorp, Inc.CAPR Capricor Therapeutics, Inc.CASC Cascadian Therapeutics, Inc.CBAN Colony Bankcorp, Inc.CBAY CymaBay Therapeutics Inc.CBK Christopher & Banks Corporation
CDOR Condor Hospitality Trust, Inc.CERS Cerus CorporationCFBK Central Federal Corporation

Microcap Board Governance 59
CFFI C&F Financial CorporationCHCI Comstock Holding Companies, Inc.CIX CompX International Inc.
CLSN Celsion CorporationCLUB Town Sports International Holdings, Inc.CNFR Conifer Holdings, Inc.CPIX Cumberland Pharmaceuticals Inc.CPTA Capitala Finance Corp.CRMD CorMedix IncCRVS Corvus Pharmaceuticals, Inc.CTRV ContraVir Pharmaceuticals IncCUI CUI Global, Inc.
CVEO Civeo CorporationCVR Chicago Rivet & Machine Co.
CYTR CytRx CorporationDNBF DNB Financial CorpEARN Ellington Residential Mortgage REITEBMT Eagle Bancorp Montana, Inc.EMMS Emmis Communications CorporationENG ENGlobal Corporation
ENPH Enphase Energy, Inc.ESIO Electro Scientific Industries, Inc.ESP Espey Mfg. & Electronics Corp.
ESSA ESSA Bancorp, Inc.FBSS Fauquier Bankshares, Inc.
FLDM Fluidigm CorporationFSI Flexible Solutions International Inc.
GEOS Geospace Technologies CorporationGEVO Gevo, Inc.GFN General Finance Corporation
GLAD Gladstone Capital CorporationGNUS Genius Brands International, Inc.GORO Gold Resource Corporation
GSB GlobalSCAPE, Inc.GURE Gulf Resources, Inc.
GV Goldfield Corporation (The)HDNG Hardinge Inc.HMG HMG/Courtland Properties, Inc.
HMTA HomeTown Bankshares CorporationIBIO iBio, Inc.ICD Independence Contract Drilling, Inc.

Microcap Board Governance 60
IMMY Imprimis Pharmaceuticals, Inc.IMUC ImmunoCellular Therapeutics, Ltd.IROQ IF Bancorp, Inc.JAKK JAKKS Pacific, Inc.KFS Kingsway Financial Services, Inc.
LEDS SemiLEDS CorporationLODE Comstock Mining, Inc.LTRX Lantronix, Inc.LUNA Luna Innovations IncorporatedMBII Marrone Bio Innovations, Inc.
MBRX Moleculin Biotech, Inc.MFIN Medallion Financial Corp.MFNC Mackinac Financial CorporationMICR Micron Solutions, Inc.MLVF Malvern Bancorp, Inc.MLSS Milestone Scientific, Inc.
MNKD MannKind CorporationMNOV MediciNova, Inc.MRCC Monroe Capital CorporationMTRX Matrix Service CompanyNCIT NCI, Inc.NEOT Neothetics, Inc.NTIP Network-1 Technologies, Inc.NVFY Nova Lifestyle, IncNVTR Nuvectra CorporationOCX OncoCyte CorporationONVI Onvia, Inc.OPY Oppenheimer Holdings, Inc.
OTEL Otelco Inc.PANL Pangaea Logistics Solutions Ltd.PBBI PB Bancorp, Inc.PEIX Pacific Ethanol, Inc.PES Pioneer Energy Services Corp.PFBI Premier Financial Bancorp, Inc.PIRS Pieris Pharmaceuticals, Inc.PLPC Preformed Line Products CompanyPNRG PrimeEnergy CorporationPPHM Peregrine Pharmaceuticals Inc.
PQ Petroquest Energy IncPRPH ProPhase Labs, Inc.PSDV pSivida Corp.

Microcap Board Governance 61
PTSI P.A.M. Transportation Services, Inc.PW Power REIT
PWOD Penns Woods Bancorp, Inc.PZRX PhaseRx, Inc.REED Reeds, Inc.REXX Rex Energy CorporationRLGT Radiant Logistics, Inc.ROKA Roka Bioscience, Inc.RPRX Repros Therapeutics Inc.RST Rosetta StoneSAL Salisbury Bancorp, Inc.
SENEA Seneca Foods Corp.SBOT Stellar Biotechnologies, Inc.SIEN Sientra, Inc.SKY Skyline CorporationSTRS Stratus Properties Inc.SVBI Severn Bancorp IncTACT TransAct Technologies IncorporatedTCI Transcontinental Realty Investors, Inc.
TCON TRACON Pharmaceuticals, Inc.THST Truett-Hurst, Inc.TIK Tel-Instrument Electronics Corp.
TRCB Two River BancorpTRMR Tremor Video, Inc.TRNS Transcat, Inc.TRXC TransEnterix, Inc.TSQ Townsquare Media, Inc.
TUES Tuesday Morning Corp.UNAM Unico American CorporationUUUU Energy Fuels IncVLRX Valeritas Holdings, Inc.VNRX VolitionRX LimitedWBB Westbury Bancorp, Inc.
WEBK Wellesley Bancorp, Inc.WKHS Workhorse Group, Inc.WLFC Willis Lease Finance CorporationWSCI WSI Industries Inc.XELB Xcel Brands, IncXONE The ExOne Company
ZN Zion Oil & Gas IncZOES Zoe’s Kitchen, Inc.