Embed Size (px)
Citation preview
Microbial Source Tracking Techniques:Lake Michigan Beaches Case Studies
Erika Jensen, M.S. Great Lakes WATER Institute
April 14, 2005
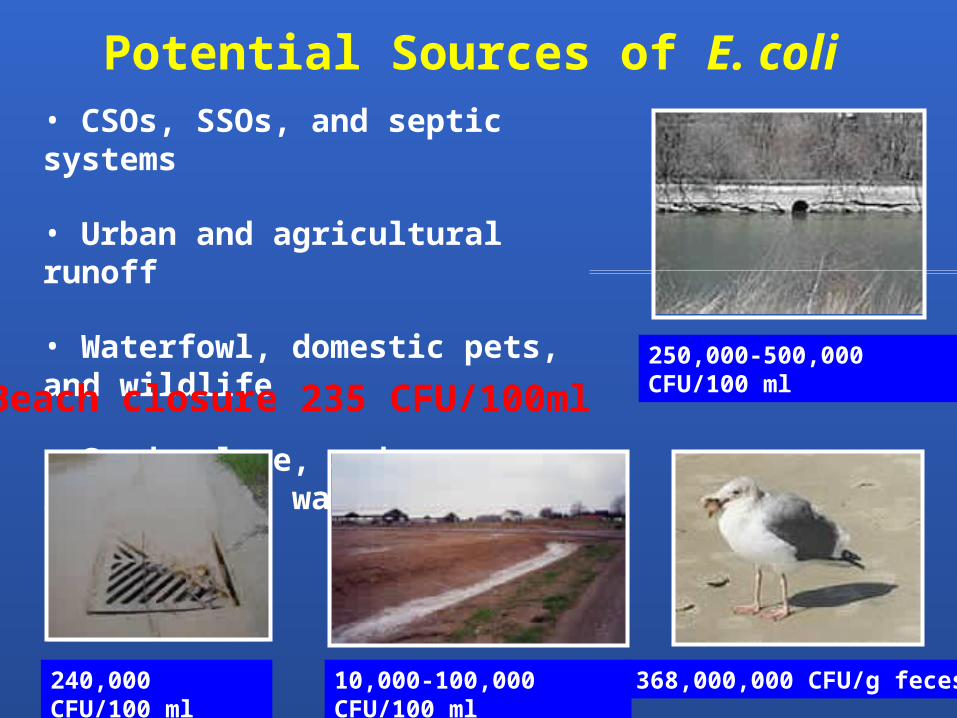
Potential Sources of E. coli • CSOs, SSOs, and septic systems
• Urban and agricultural runoff
• Waterfowl, domestic pets, and wildlife
• Sand, algae, and interstitial waters
240,000 CFU/100 ml 368,000,000 CFU/g feces
250,000-500,000 CFU/100 ml
10,000-100,000 CFU/100 ml
Beach closure 235 CFU/100ml

GLWI Research Areas
Fate and transport of bacteriaMilwaukee Harbor, stormwater, Lake Michigan
Sources of pollution Milwaukee Harbor, stormwater, Lake MichiganDoor, Manitowoc, Milwaukee, & Racine County Beaches
Pathogen occurrence Bradford Beach, Racine, Milwaukee Harbor
Evaluation of BMPsSouth Shore beach, green roofs and rain gardens

Approach to Microbial Source Tracking
1. Gather the experts and share knowledge
2. In depth spatial surveys
3. Targeted sampling to observe dynamics; modeling
4. Apply source tracking approaches: • Human vs. non-human?• Are specific groups of animals contributing?• Does sand or Cladophora act as a reservoir?
5. Manage and evaluate the problem
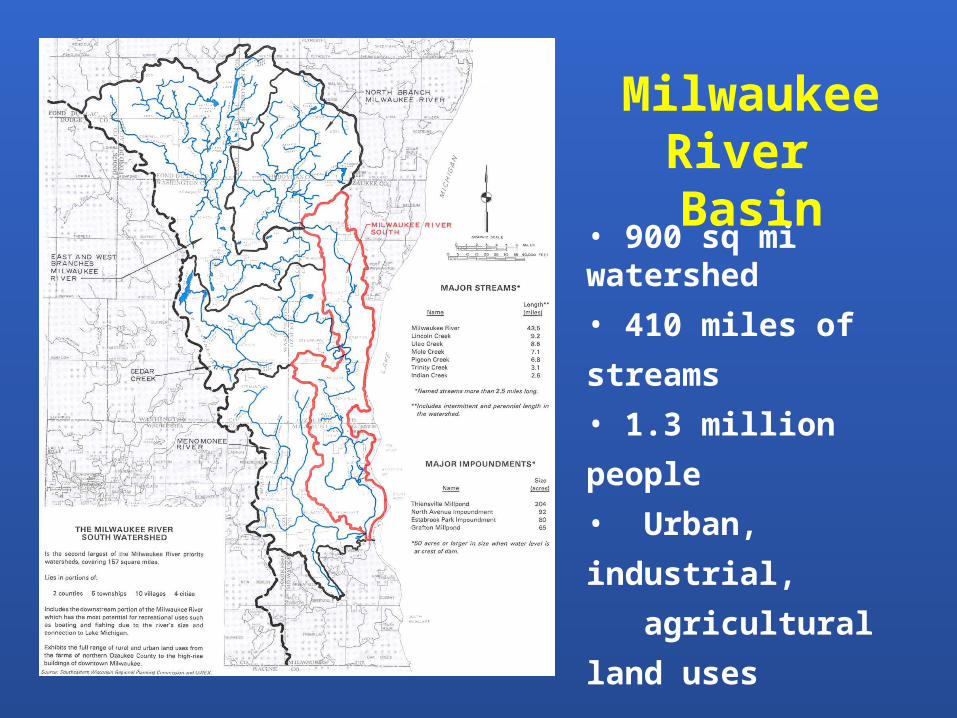
• 900 sq mi watershed
• 410 miles of streams
• 1.3 million people
• Urban, industrial,
agricultural land uses
Milwaukee River Basin

Bacterial SurveysSpatial & Temporal
South Shore Beach Study: 2001 to present
Menomonee River Study: 2002
Fate and Transport Study: 2002 to present
Manitowoc & Door County Beach Surveys: 2002 - 2003
Bradford Beach Study: 2004 to present
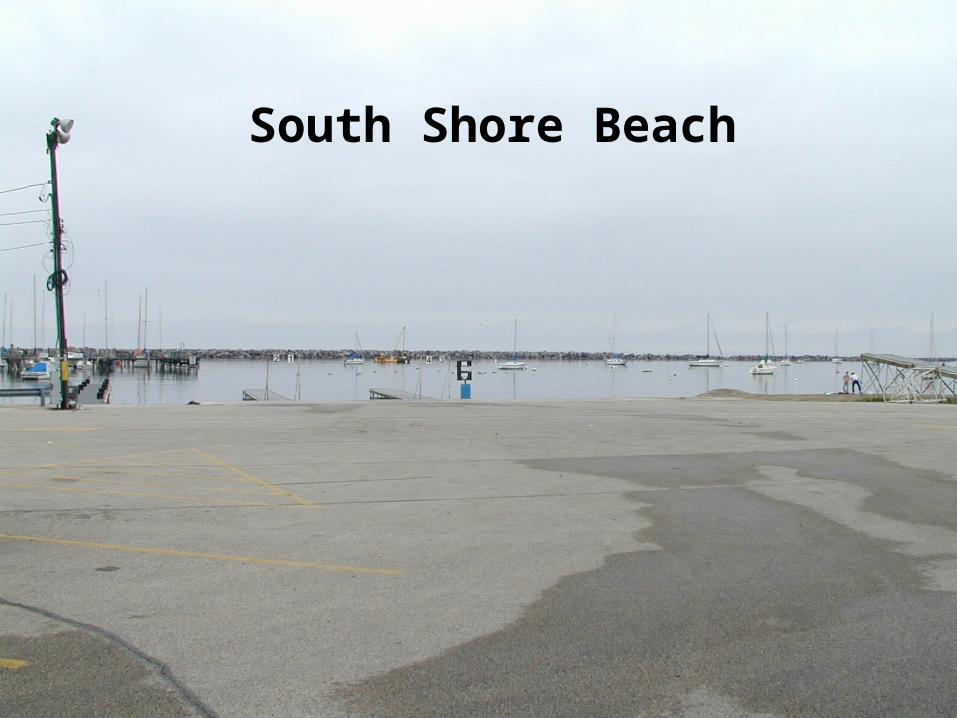
South Shore Beach
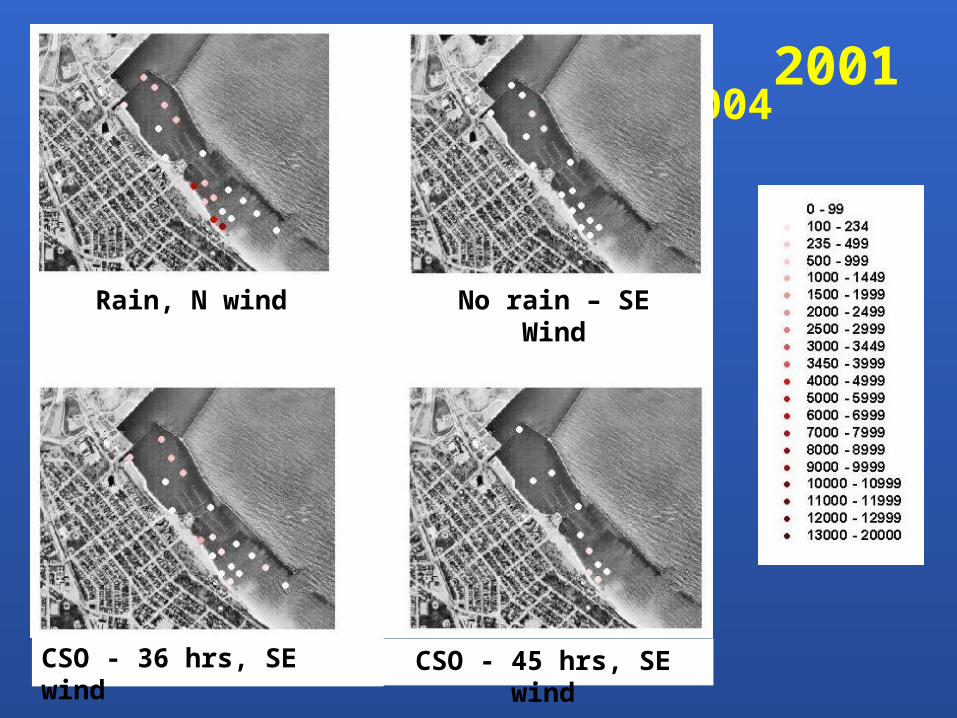
Spatial surveys 2001-2004
CSO - 36 hrs, SE wind
Rain, N wind No rain – SE Wind
CSO - 45 hrs, SE wind
2001
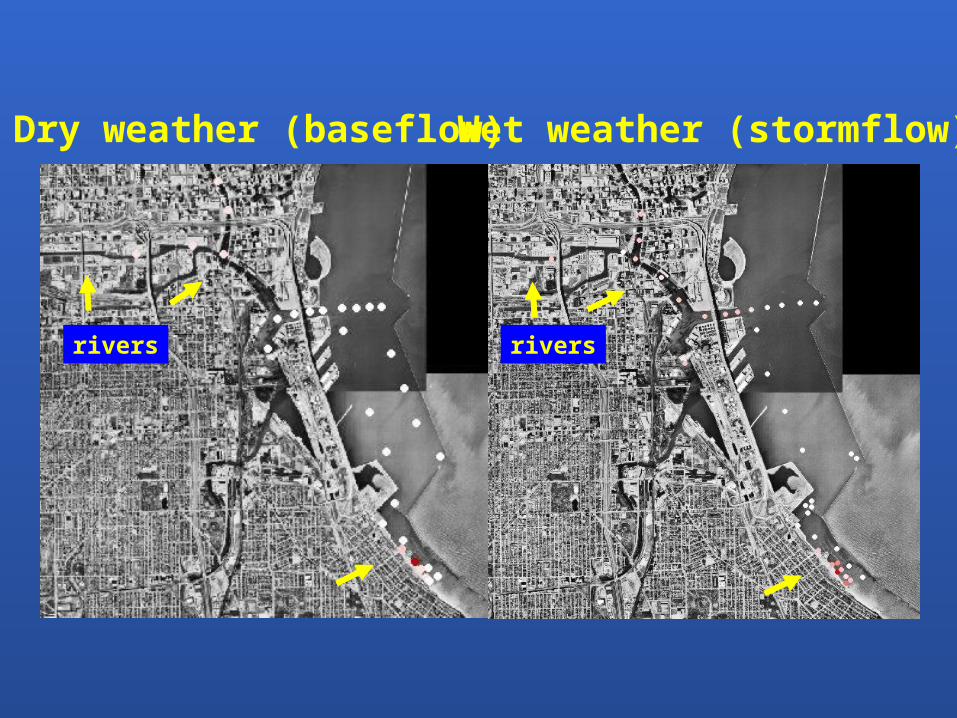
riversrivers
Dry weather (baseflow) Wet weather (stormflow)
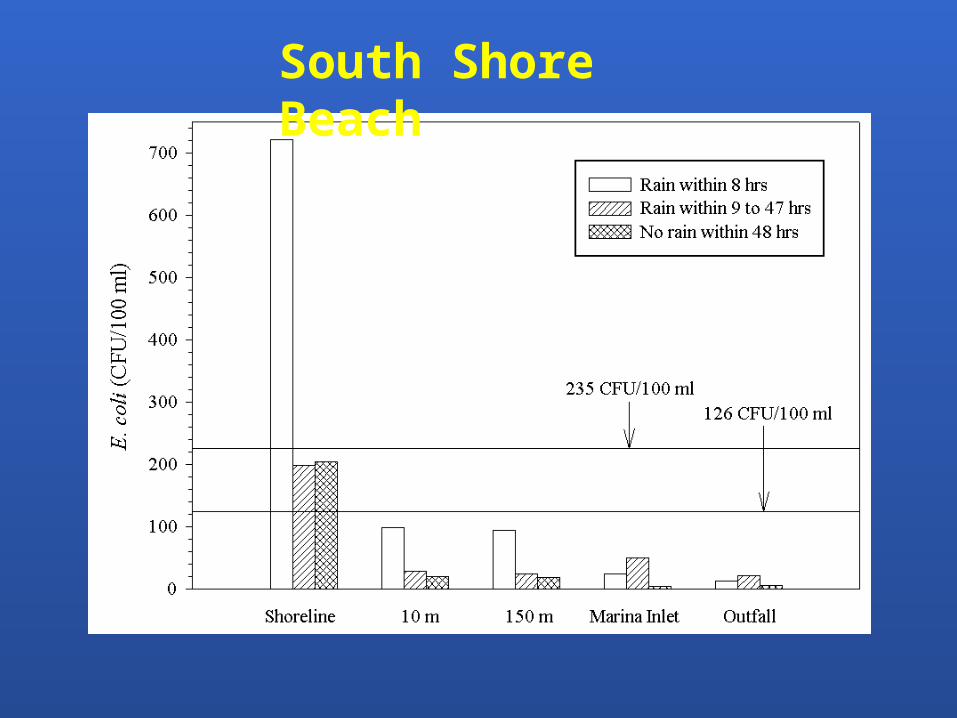
South Shore Beach
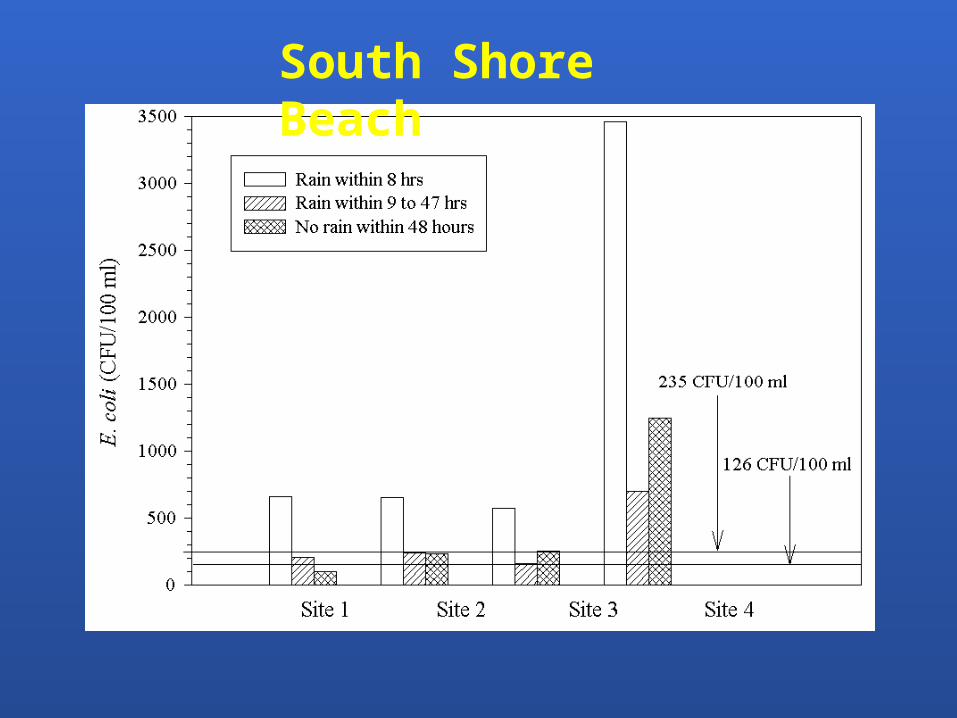
South Shore Beach
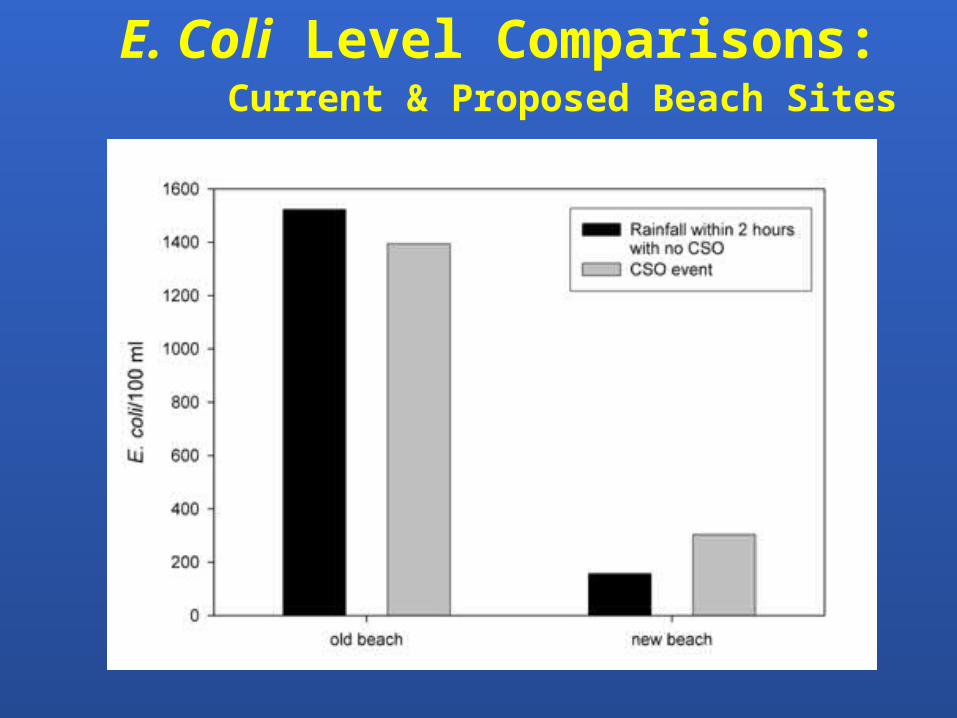
E. Coli Level Comparisons: Current & Proposed Beach Sites
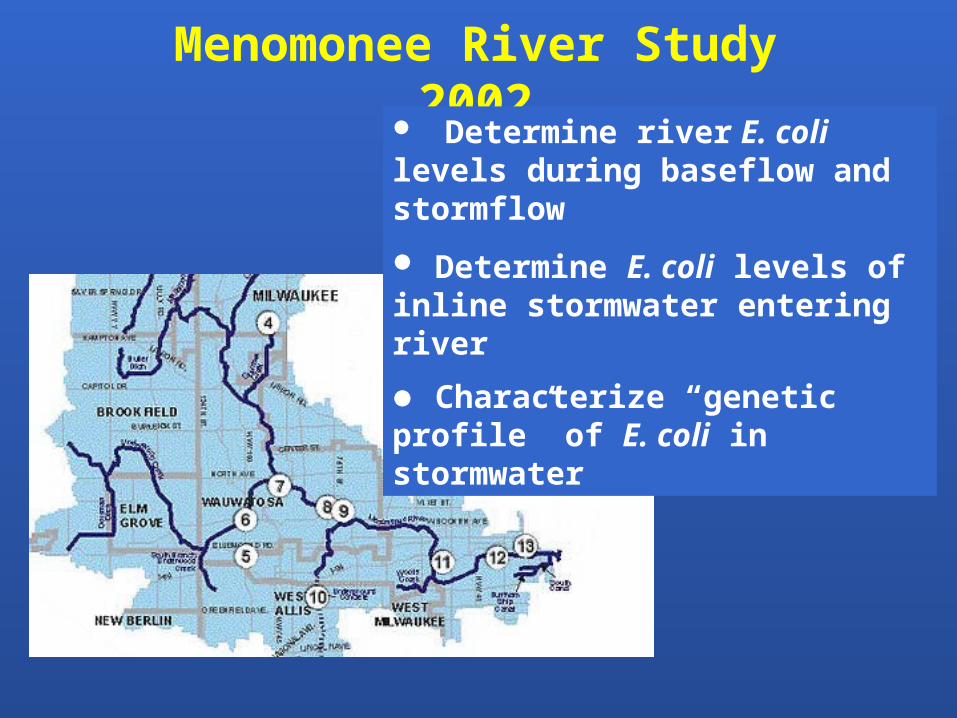
Menomonee River Study 2002
Determine river E. coli levels during baseflow and stormflow
Determine E. coli levels of inline stormwater entering river
Characterize “genetic profile” of E. coli in stormwater

Menomonee River Survey
Suburban, suburban industrialNatural bed
Urban, Concrete bed
Urban,Rehabilitated bed
Urban, industrialNatural bed
1 2 3 4 5 6 7 8 9 10
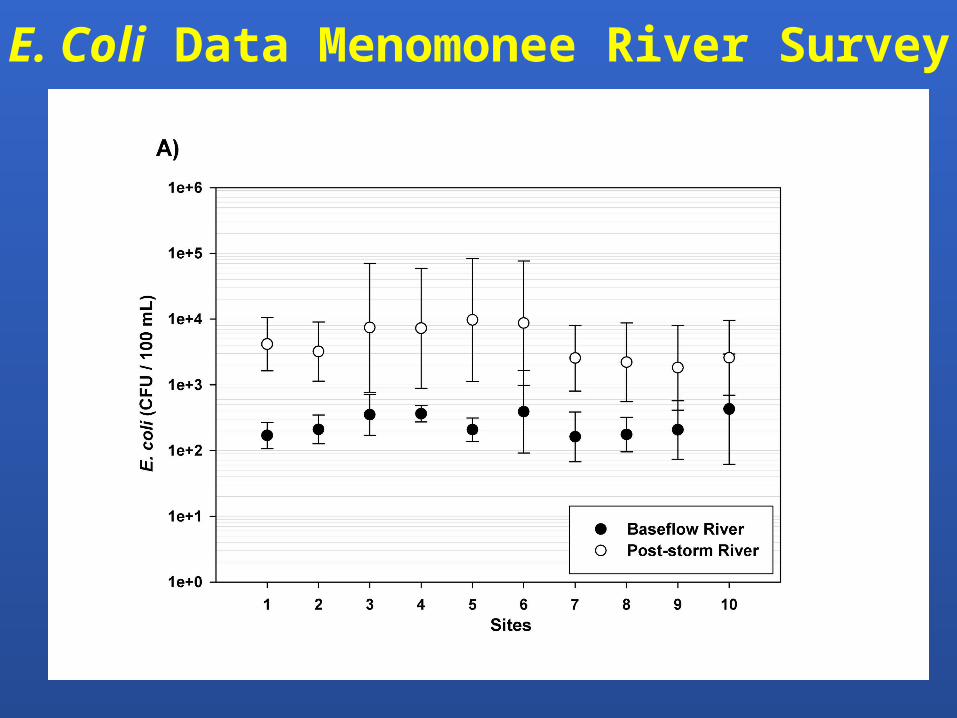
E. Coli Data Menomonee River Survey

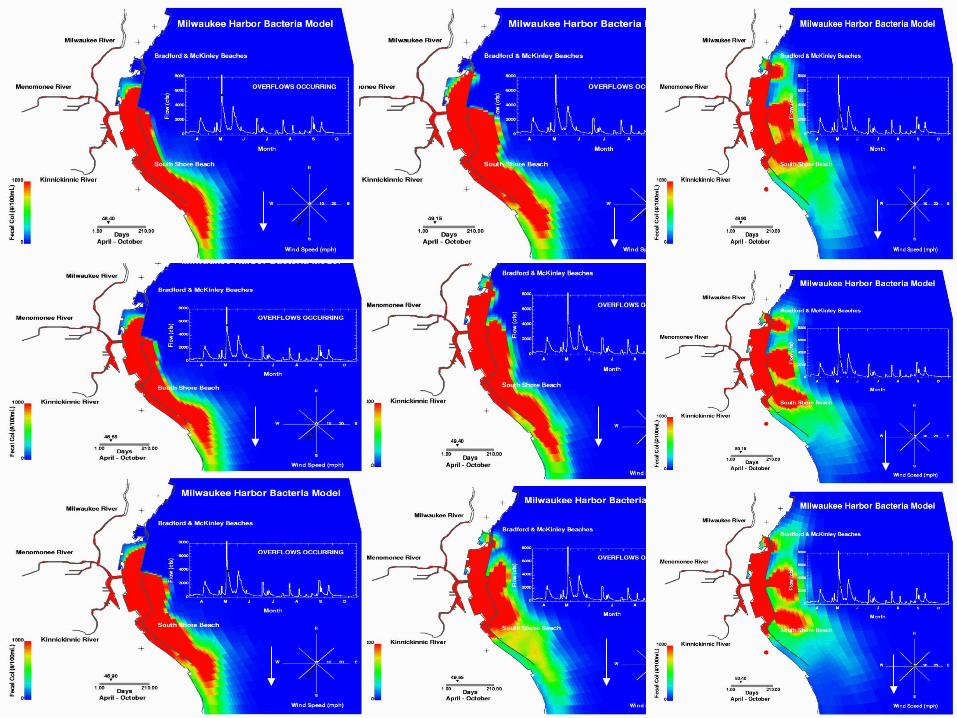
Fate & Transport 2003 Spatial Survey
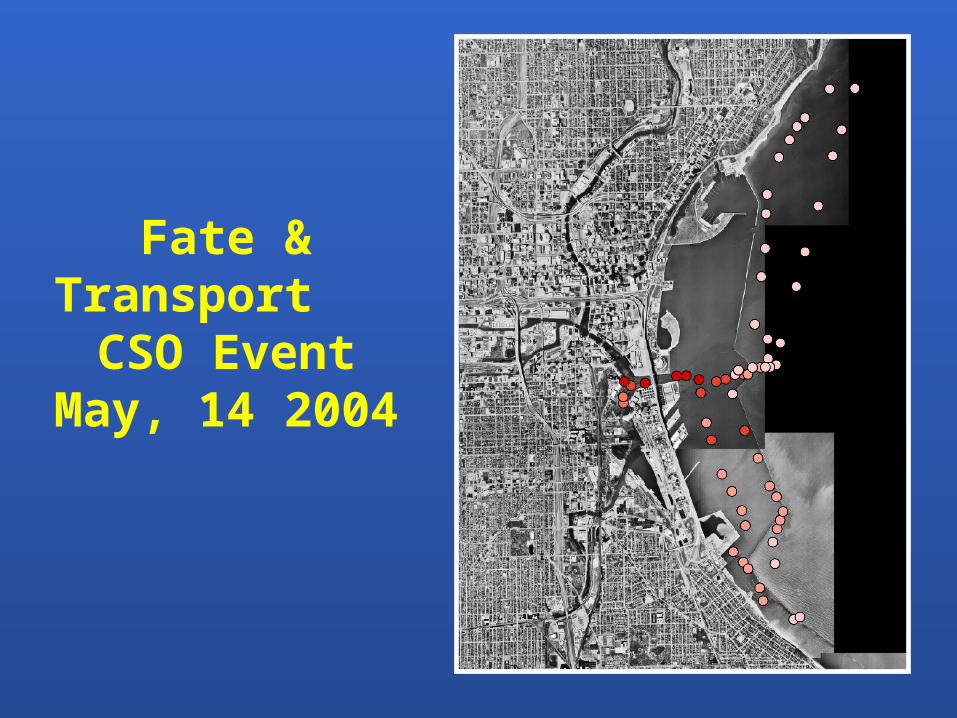
Fate & Transport
CSO EventMay, 14 2004
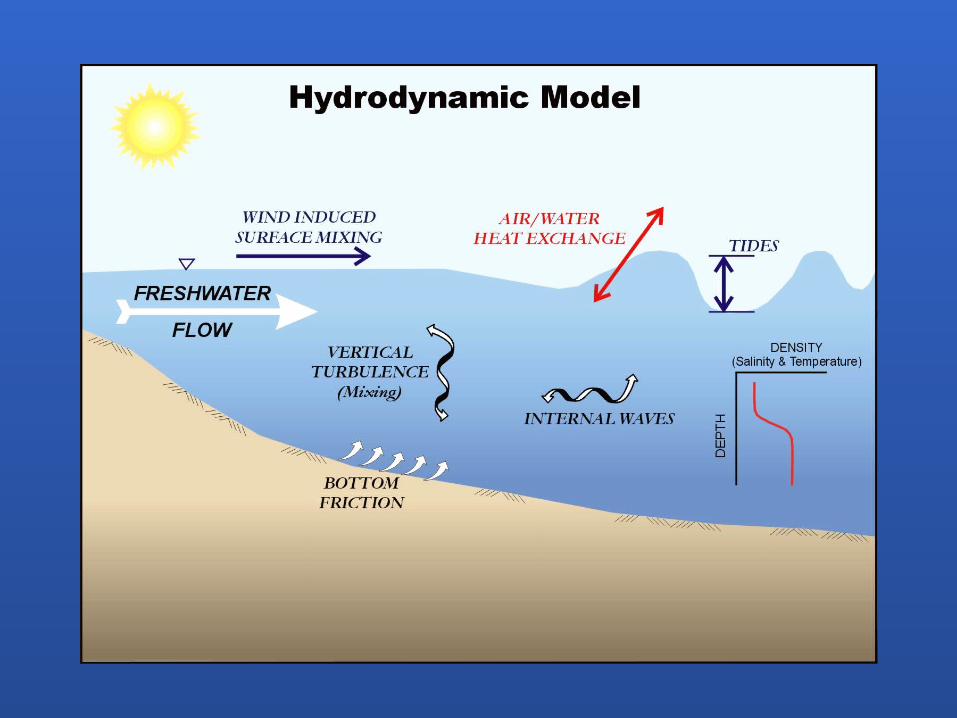
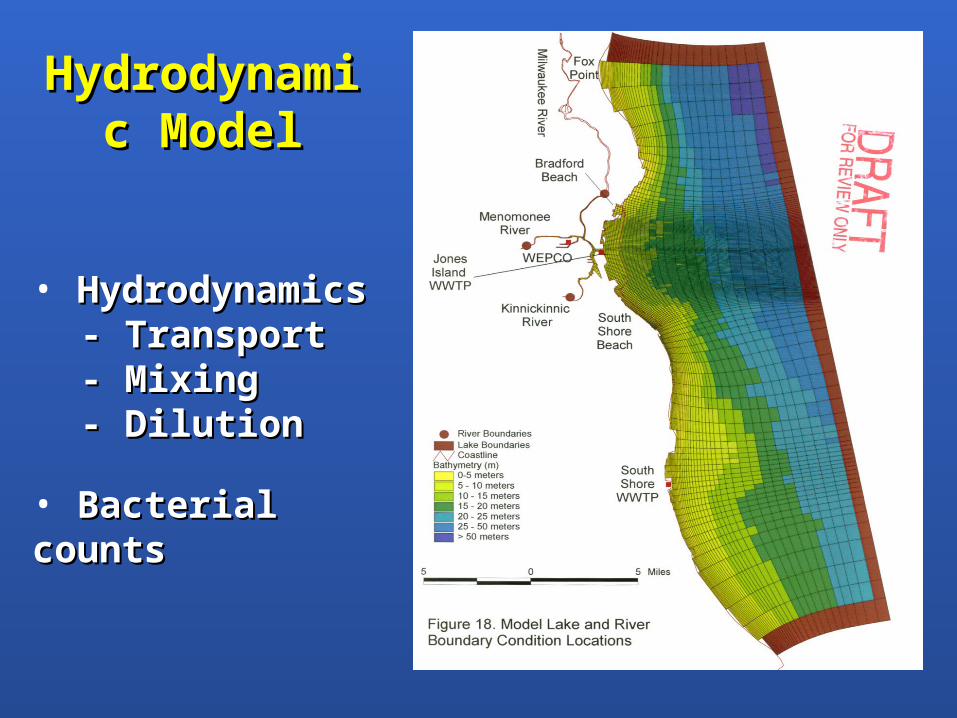
Hydrodynamic Hydrodynamic ModelModel
• HydrodynamicsHydrodynamics- Transport- Transport- Mixing- Mixing- Dilution- Dilution
• Bacterial counts Bacterial counts
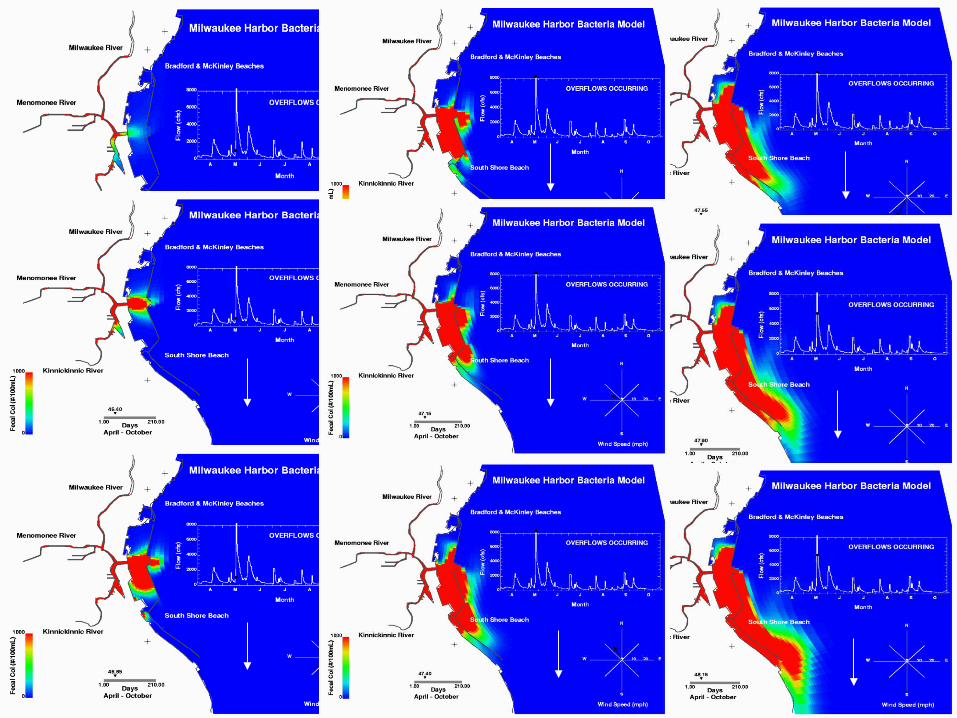
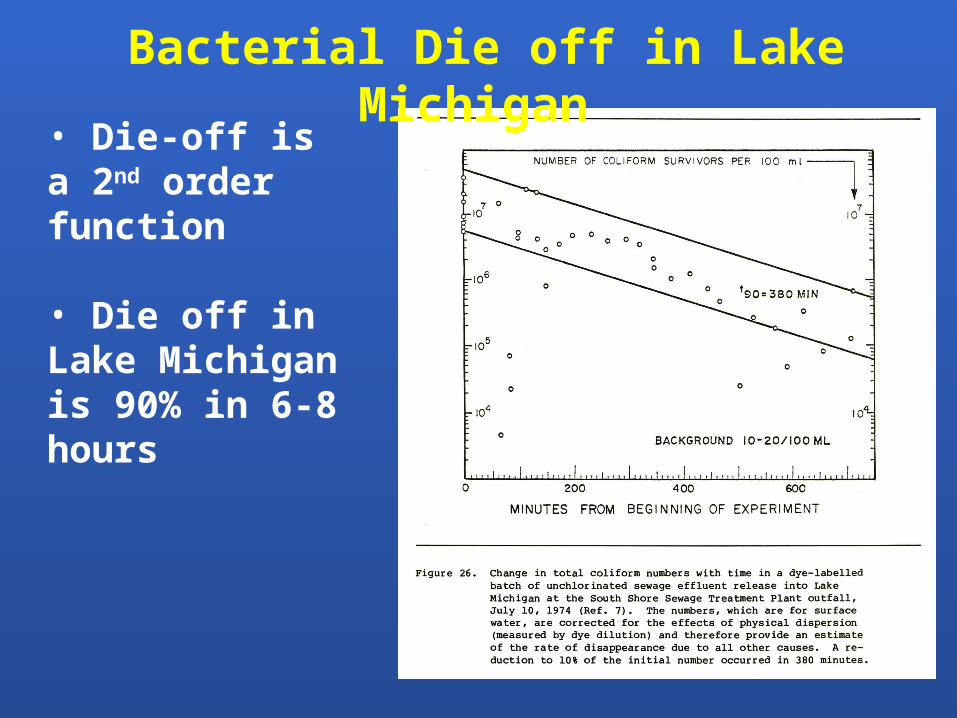
• Die-off is a 2nd order function
• Die off in Lake Michigan is 90% in 6-8 hours
Bacterial Die off in Lake Michigan

Bradford Beach in Milwaukee

Pre-rain 6-14-04 09:44 Post-rain 6-14-04 10:20
E. coli Survival & Persistence in the Environment
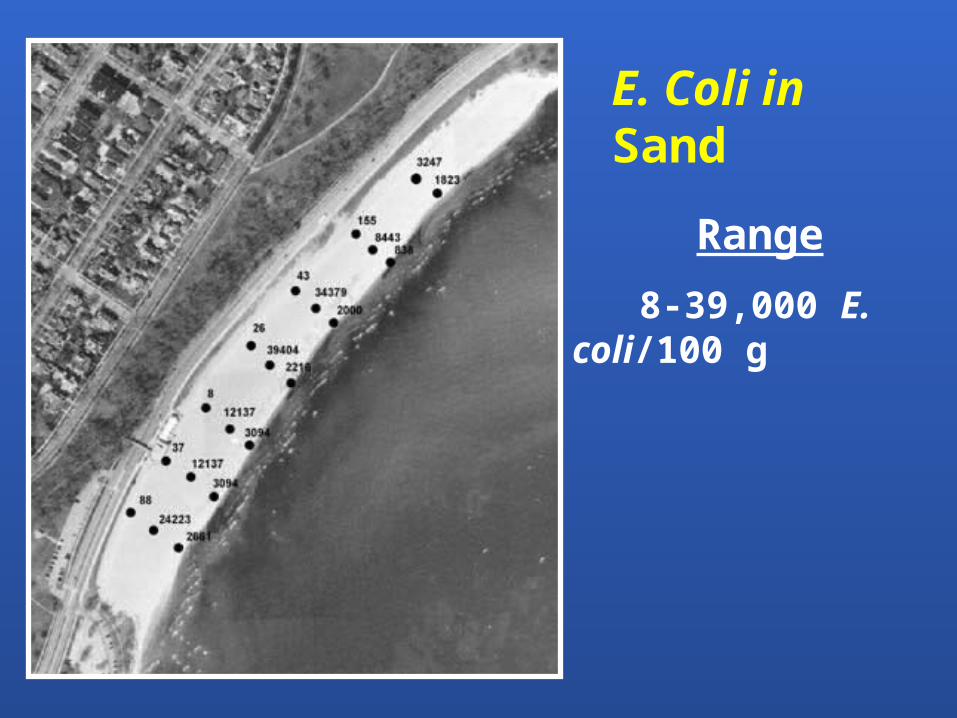
E. Coli in Sand
Range
8-39,000 E. coli/100 g
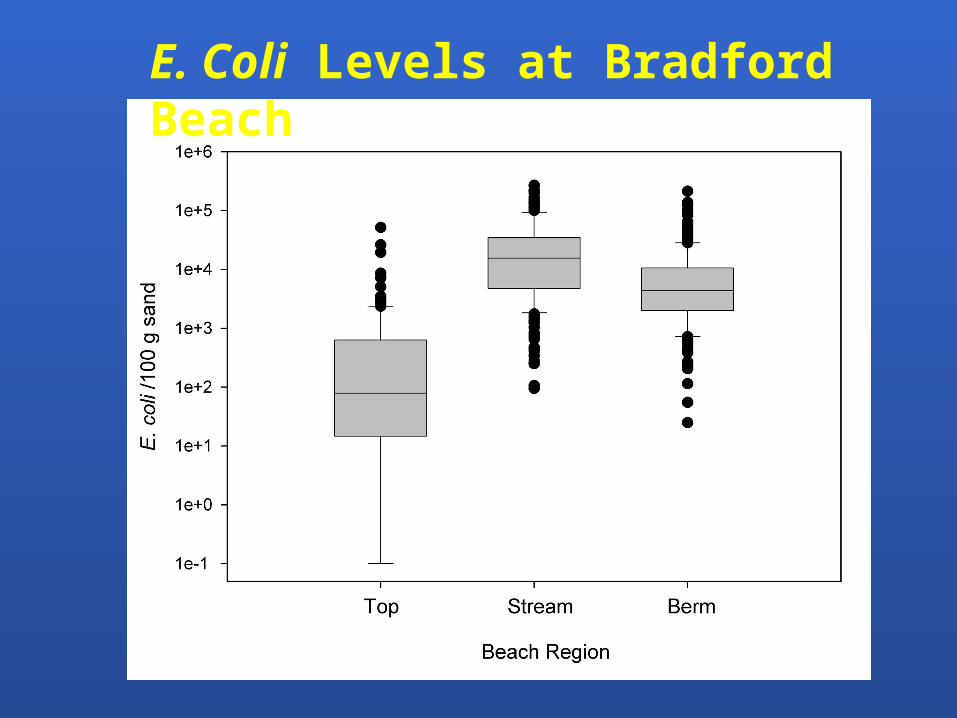
E. Coli Levels at Bradford Beach
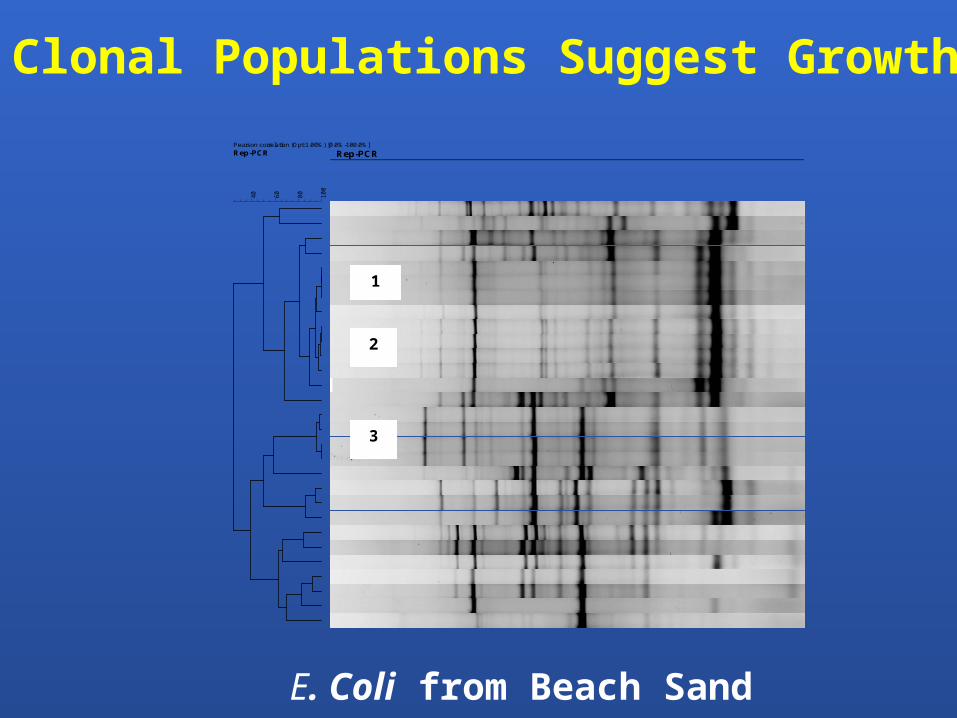
Pearson correlation (Opt:1.00%) [0.0%-100.0%]
Rep-PCR
100
80
60
40
Rep-PCR
1
2
3
Clonal Populations Suggest Growth
E. Coli from Beach Sand
Bacteroides spp.
Case Studies
• Stormwater
• Beach water
• Agricultural Runoff
• Combined Sewer Overflows
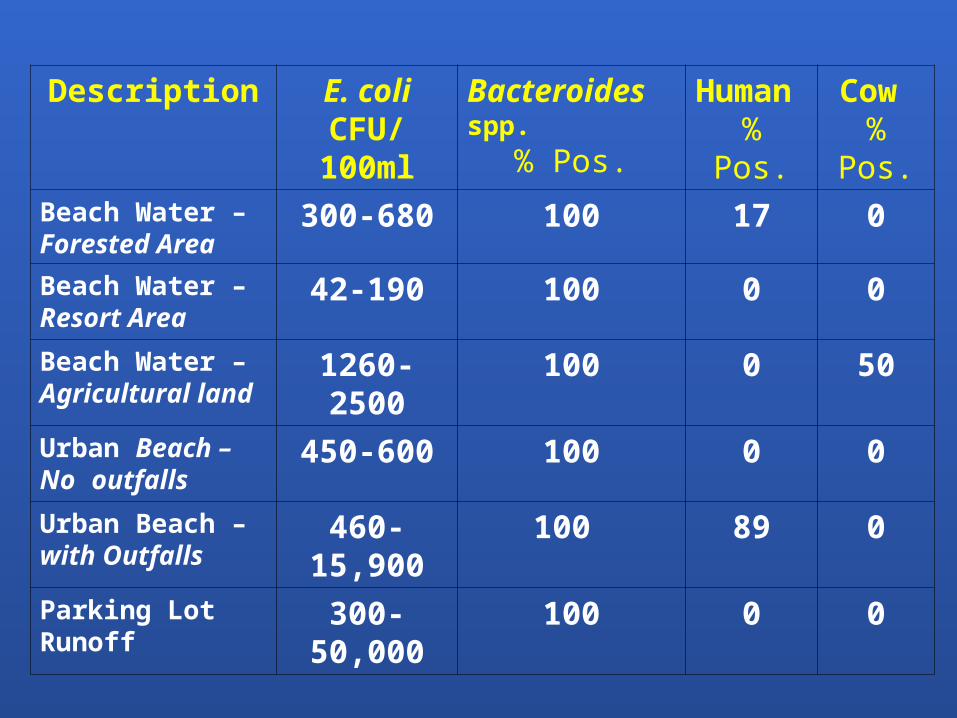
Description E. coliCFU/100ml
Bacteroides spp.
% Pos.
Human
% Pos.Cow
% Pos.
Beach Water – Forested Area
300-680 100 17 0
Beach Water – Resort Area
42-190 100 0 0
Beach Water –Agricultural land
1260-2500 100 0 50
Urban Beach –No outfalls
450-600 100 0 0
Urban Beach –with Outfalls
460-15,900 100 89 0
Parking Lot Runoff 300-50,000 100 0 0
• Spatial surveys provide the most useful data Identify hot spots or areas of concern
• Implement targeted sampling surveys to observe site specific dynamics
• Apply source tracking approaches: Human vs. non-human?Are specific hosts contributing?Are there environmental reservoirs?
• Manage and evaluate the problem
Summary
ResearchersAnnette DanielsAlissa SalmoreCaitlin ScopelMichelle LuebkePat BowerOla Olapade
StudentsMagnolia TulodJosh HarrisElissa LewisEmerson LeeJennifer LeeAndrew HollandBecky KirbyHilary StreetBen WestonMorgan DepasMeredith Van Dyke
Graduate StudentsMarcia SilvaSachie OwagaHeidi PirkovLiang PengSukpreet Kaur
Great Lakes WATER InstituteP.I., Dr. Sandra McLellan
Funding kindly provided byMilwaukee Metropolitan Sewage DistrictWisconsin DNRNational Institute of HealthNOAA Sea GrantSC JohnsonWisconsin Coastal Management Program