Embed Size (px)
Citation preview

University of Arkansas, FayettevilleScholarWorks@UARK
Theses and Dissertations
8-2016
Microbes in Rough Rice – Prevalence, GrowthKinetics and Links to Dry Matter LossSupriya ThoteUniversity of Arkansas, Fayetteville
Follow this and additional works at: http://scholarworks.uark.edu/etd
Part of the Food Biotechnology Commons, and the Food Microbiology Commons
This Thesis is brought to you for free and open access by ScholarWorks@UARK. It has been accepted for inclusion in Theses and Dissertations by anauthorized administrator of ScholarWorks@UARK. For more information, please contact [email protected], [email protected].
Recommended CitationThote, Supriya, "Microbes in Rough Rice – Prevalence, Growth Kinetics and Links to Dry Matter Loss" (2016). Theses andDissertations. 1753.http://scholarworks.uark.edu/etd/1753

Microbes in Rough Rice – Prevalence, Growth Kinetics and Links to Dry Matter Loss
A thesis submitted in partial fulfillment
of the requirements for the degree of
Master of Science in Food Science
by
Supriya Thote
University of Arkansas
Bachelor of Science in Chemical Engineering, 2014
August 2016
University of Arkansas
This thesis is approved for recommendation to the Graduate Council.
Dr. Griffiths G. Atungulu
Thesis Director
Dr. Terry J. Siebenmorgen Dr. Burton H. Bluhm
Committee Member Committee Member
Dr. Andronikos Mauromoustakos
Committee Member

Abstract
The prevalence of microorganisms on freshly-harvested long-grain hybrid, long-grain pureline, and
medium-grain rice has not been elucidated. The first objective of this two-part study was to determine the
relative prevalence of microbes on freshly-harvested, high moisture content rice of different types and
cultivars. The total and surface aerobic plate counts (APC) and mold counts were determined in terms of
log10 colony forming units per gram of rice (log10 CFU/g) for six rice cultivars over two years. In 2013,
among harvested samples of all the studied rice cultivars, the long-grain hybrid cultivars had the lowest
APC levels (M = 8.10, SD = 0.09) (M and SD symbolize mean and standard deviation, respectively).
Similarly, for the 2014 harvested samples the long-grain hybrid cultivars had the lowest mold count levels
(M = 5.97, SD =0.27). After harvest, depending on storage conditions, some molds growing on stored rice
may produce aflatoxins. For the second part of the study, mold and APC counts were enumerated for
three long-grain hybrid rice cultivars, XL753 (2014) and CL XL745 (2014, 2015) and XL760 (2015) stored
in rough rice form in sealed glass jars at moisture contents (MC) of 21%, 19%, 16%, and 12.5% (wet -
basis) at temperatures of 10°C, 15°C, 20°C, 27°C, and 40°C for a total of 16 weeks, with samples taken
every two weeks. For all cultivars, a direct relationship between mold counts and MC was observed –
whereas more complex trends were observed for the effect of temperature and the duration of storage on
mold growth. Kinetic models Baranyi, Weibull, Gompertz, Richard and Buchanan were successfully
modified and fitted using non-linear regression and were used to predict the mold counts (log10 CFU/g) for
varying conditions (correlations=0.65-0.76). Additionally, dry matter loss (DML) constants for hermetic
storage conditions were found to be significantly different than the typical constants for the DML equation
provided for long-grain rice in the literature.

©2016 by Supriya Thote
All Rights Reserved
Acknowledgments
My journey through graduate school and my arrival to the completion of this work was made possible
and incredibly memorable by numerous extraordinary people. My advisor, Dr. Griffiths Atungulu stood
steadfast by me, providing support and encouragement throughout the challenges and joys of pursuing
this research work. The research group - Arnelia Couch, HouMin Zhong, Shantae Wilson, Anne Okeyo,
Zachary Young, Deandrae Smith, Ben Gainer and Gbenga Olatunde - were always willing to listen and
help me streamline my presentations no matter how many times they had heard me recite the work
before. I must thank Kathryn Haydon, my fellow graduate student, for all her help – I cannot imagine
tackling the autoclaving and filling of those 600 jars without you and Katherine Wilkes making the process
fun. My committee - Dr. Terry Siebenmorgen, Dr. Burt Bluhm and Dr. Andy Mauromoustakos, have been
a constant source of guidance, providing me direction and inspiration to do my best and to never stop
learning.
I would like to thank the Rice Processing Program, the Rice Research and Promotion Board and
Michael G. Johnson for providing the funding and support to make this thesis possible and the members
of the Department of Food Science at UofA for accepting me and making every day of graduate school an
unforgettable one. Greg Baltz, thank you for providing us the samples for performing this research.
Finally, I would like to thank my family and friends for always being there and for listening to me complain
and vent my frustrations and for celebrating my victories. My person, Kevin Roberts, thanks for always
cheering me on and for bringing me food when I powered through work at the Union; Omkar Bhave, for
reminding me to have fun once in a while and for always being willing to make chicken curry; my sister,
Tanushree Thote, who was central in my decision to pursue graduate school, thank you for believing in
me; and finally my parents, who are just awesome people.
Table of Contents
I. Introduction ............................................................................................................................... 1
II. Chapter 1: Microbial Prevalence on Freshly-Harvested Long-Grain Pureline, Hybrid, and
Medium-Grain Rice Cultivars.......................................................................................................... 3
A. Abstract..................................................................................................................................... 3
B. Introduction .............................................................................................................................. 3
C. Materials and Methods .............................................................................................................. 6
1. Samples .............................................................................................................................. 6
2. Microbial analysis ................................................................................................................ 7
D. Results ...................................................................................................................................... 8
1. Statistical analyses .............................................................................................................. 8
2. Freshly-Harvested Rice Moisture Content and Water Activity.................................................. 9
3. Microbial Distribution on Rice as Affected by Harvest Year ..................................................... 12
4. Microbial Distribution on Different Rice Cultivars..................................................................... 14
5. Microbial Load on Rice Grown at Different Locations .............................................................. 17
E. Conclusion ................................................................................................................................ 19
F. References ................................................................................................................................ 20
III. Chapter 2: Microbial Growth Kinetics and Prediction Models on Hybrid Rough Rice Cultivars
....................................................................................................................................................... 23
A. Abstract..................................................................................................................................... 23
B. Introduction .............................................................................................................................. 23
C. Materials and Methods .............................................................................................................. 26
1. Samples .............................................................................................................................. 26
2. Microbial Analysis ................................................................................................................ 29
3. Data Fitting for Kinetic Growth Models................................................................................... 30
D. Results ...................................................................................................................................... 31
1. Statistical analyses .............................................................................................................. 31
2. Factors Affecting Microbial Kinetics....................................................................................... 34
Mold Counts ........................................................................................................................ 34
Aerobic Plate Counts............................................................................................................ 38
3. Kinetic Models for Mold Counts ............................................................................................. 40
4. Model Comparison ............................................................................................................... 41
E. Conclusion ................................................................................................................................ 43
F. References ................................................................................................................................ 44
IV. Chapter 3: Dry Matter Loss for Hybrid Rough Rice Stored under Reduced Oxygen Conditions
....................................................................................................................................................... 47
A. Abstract..................................................................................................................................... 47

B. Introduction .............................................................................................................................. 47
C. Materials and Methods .............................................................................................................. 49
1. Samples .............................................................................................................................. 49
2. Dry Matter Loss Calculation .................................................................................................. 54
D. Results ...................................................................................................................................... 55
E. Conclusion ................................................................................................................................ 58
F. References ................................................................................................................................ 58
V. Conclusion ................................................................................................................................. 60
VI. References ................................................................................................................................ 62
List of Published Papers
Chapter 1: Atungulu, G. G., Zhong, H., Thote, S., Okeyo, A., & Couch, A. (2015). Microbial prevalence on
freshly-harvested long-grain pureline, hybrid, and Medium-grain rice cultivars. Applied Engineering in
Agriculture, 31(6), 949-956.

1
I. Introduction
With Food and Agriculture Organization (FAO, 2004) estimating that food production will need to
increase by 70% by 2050, researchers are taking a multi-pronged approach to the problem. Some of the
solutions scientists are working on include developing drought and disease resistant varieties of crops,
improving distribution systems and reducing post-harvest losses. According to FAO (2004), rice is the
predominant staple food for nearly half of the world’s population, providing 20% of world’s dietary energy
supply. Reports from FAO and International Rice Research Institute (IRRI, 2014) indicate up to 30% of
losses for rice in developing countries can be attributed to post-harvest storage and processing.
The USDA 2014 crop production summary reported that 10,024,391 metric ton of rice was produced
in the US. Arkansas has led the U.S. in rice acreage and production for years and the 2014 growing
season marked the first instance when the state accounted for greater than 50% of the U.S. rice acreage
and production (Hardke, 2015). Rice producers harvested 1,480,000 acres of rice in Arkansas in 2014.
Rice is not only a major crop commodity for the state of Arkansas and accounting for 40.2% of cash
receipts for Arkansas farmers but also ranks first among the commodities Arkansas exports, contributing
809.3 million dollars in revenue (State Fact Sheets, 2015).
In the last decade, US rice growers have doubled the acreage of farmland planted with long-grain
hybrid rice cultivars due to their potential for high grain yields and short growing season (Branscum et al.,
2014). However, there has not been a similar increase in research studies focusing on issues related to
storage and handling of hybrid rough rice. Moreover, hybrid rice has a pubescent characteristic that may
predispose it to behave differently, in terms of harboring and supporting mold growth, as compared to
non-pubescent rice.
Microorganisms known to indigenously reside on freshly-harvested rice include yeast, molds, and
bacteria (Atungulu et al., 2014). Of these, mold contamination typically poses the greatest problem to rice
producers, processors and consumers because, depending on stress conditions, which may include rice
kernel physical characteristics, moisture content (MC), storage temperature and relative humidity, mold
harbored on rice may produce mycotoxins (Skyrme et al., 1998; Ranalli and Howell 2002; Atungulu et al.,
2014). Some mycotoxins, such as aflatoxin, are known carcinogens that pose health hazards to
consumers of rice and rice co-products.

2
Moreover, mold contamination also poses a risk to the quality of harvested rice that can result in
significant economic losses. Not only does mold growth cause objectionable odors, but may also result in
discoloration of kernels partly due to the heat produced during the respiration process (Di llahunty et al.,
2000). During the respiration process, the viable grain kernels, insects, molds and mites consume
oxygen, and in turn, produce carbon dioxide, water and heat (Bern et al., 2013; Suleiman et al., 2013).
According to Hayma (2003), the respiration rate is directly correlated to the MC of the grain; therefore, as
the MC of grain increases, the respiration rate also increases. Hence, for safe storage of grain, MC of the
grain and of the surrounding air should be properly controlled (Hayma, 2003). This process of respiration
causes an increase in the grain temperature and can result in dry matter loss (DML) of the stored grain
(Lee, 1999). Researchers have previously used DML as an index for corn quality deterioration.
Elucidating similar guidelines correlating DML to mold damage of rough rice can provide a simple and
cost effective way of monitoring quality characteristics of rough rice.
According to Christensen et al (1965), grain MC, temperature and storage duration are all intimately
related to the growth of molds. This two-part study first determines the relative prevalence of microbes on
freshly-harvested, high moisture content rice of different types and cultivars . For the second part of the
study a lab-scale experimental set up was used to monitor the effect of molds growing on hybrid, long-
grain (HLG), rough rice that is conditioned to four initial MC levels (12.5, 16, 19 and 21% wet basis (w.b.))
stored in sealed glass quart jars at temperatures ranging from 10°C to 40°C for a duration of sixteen
weeks. Thus, this study endeavored to provide useful information regarding kinetics of mold growth and
DML during different storage conditions that can help determine the optimum timeframe and conditions
for storage of hybrid rice to not only reduce the economic impact of spoilage and quality deterioration due
to mold contamination, but also to mitigate the health risks posed by toxigenic molds.

3
Chapter 1
II. Microbial Prevalence on Freshly-Harvested Long-Grain Pureline, Hybrid, and Medium-Grain
Rice Cultivars*
*Published in Applied Engineering and Agriculture, ASABE (2015)
A. Abstract
The prevalence of microorganisms on freshly-harvested long-grain hybrid, long-grain pureline, and
medium-grain rice has not been elucidated. The objective of this study was to determine the relative
prevalence of microbes on freshly-harvested, high moisture content rice of different types and cultivars.
Long-grain hybrid (XL723 and XL753), long-grain pureline (CL152 and RoyJ), and medium-grain (Caffey
and Jupiter) rice were grown at four different Arkansas locations (Stuttgart, Rohwer, Colt, and Keiser) for
the study. The total and surface aerobic plate counts (APC) and mold counts in terms of log10 colony
forming units per gram (log10 CFU/g) of rice were determined. The study was conducted in the 2013 and
2014 harvest seasons. In 2013, harvested samples of all the studied rice cultivars, the long-grain hybrid
cultivars had the lowest APC levels (M = 8.10, SD = 0.09) (M and SD symbolize mean and standard
deviation, respectively). Similarly, in 2014 harvested samples, of all the studied rice cultivars, the long-
grain hybrid cultivars had the lowest mold count levels (M = 5.97, SD =0.27). For the 2013 samples,
within medium-grain and long-grain hybrid and long-grain pureline rice types, the studied cultivars had no
significant difference in APCs or mold counts (p>0.05). The geographic location where rice was grown
also influenced the level of microbial contamination of the rice at harvest and the observed trends varied
from year to year. Understanding the relative prevalence of mold on different rice cultivars at harvest may
help producers prioritize drying schedules to minimize rice deterioration caused by discoloration and
mycotoxin development.
B. Introduction
Microbes in rough rice have been implicated with rice quality deterioration such as discoloration and
mycotoxin contamination (Atungulu et al., 2014). The main factor contributing to spoilage of high moisture
content (MC) rice is fungi developing from spores inherent in the rice production and harvesting systems
(Skyrme et al., 1998). Previous research work focuses on characterizing mold and aerobic bacteria
4
counts for various storage and drying systems (Ranalli and Howell, 2002). This study hypothesized that
because of the morphological differences among long-grain hybrid, long-grain pureline, and medium-grain
rice cultivars, the rice types may experience different microbial growth responses dependent on the
environmental and weather conditions. A survey of the microbial prevalence on these rice types at
harvest for various locations may help support decisions about drying schedules and conditions for
facilities that process non-commingled rice.
Freshly harvested rough rice is usually dried below the MC required for microbes to grow (i .e., ~13%
wet basis) to preserve the microbial quality of rice effectively (Skyrme et al., 1998). About 80% of rough
rice in the United States is dried at commercial facilities using high-temperature, cross-flow drying
systems (Schluterman and Siebenmorgen, 2004). Typically, rough rice is cut at the field, loaded onto
trailers, and transported to the commercial drying facilities for drying. As annual harvest yields of rice
continue to grow, there has been a disproportionate increment of drying infrastructure. The tendency has
been that at peak harvest time, commercial drying facilities get overloaded, and it is not uncommon to
have long queues of trucks loaded with rough rice to be dried. Prolonged waiting durations before
commencing drying predisposes rice to excessive respiration which may potentially cause rice quality
deterioration (Skyrme et al., 1998). The additional 20% of rough rice in the United States is dried on-farm
using in-bin drying systems. While producers using on-farm systems may transport and start the drying
process rather faster than those using commercial facilities, it is generally known that with on-farm in-bin
drying systems rough rice is slowly dried from the bottom of the bin to the top, and sometimes prevailing
weather conditions and/or the grain system operation may not allow the drying front to move quickly
enough through the grain mass. Thus delayed drying may happen, often for grain in the top layers. Such
conditions favor microbial multiplication.
Delayed drying causes rice kernel discoloration which leads to adverse changes in quality,
appearance, flavor, and other problems including weakened kernels, resulting in breakage and economic
loss (Singaravadivel and Raj, 1983; Sahay and Gangopadhyay, 1985; Phillips et al., 1988; Misra and Vir,
1991). There are many theories as to what causes rice discoloration, but some of these include the
effects of microbes (Schroeder, 1963), high respiration rates (Schroeder, 1963), and elevated water
activity, temperature, and carbon dioxide content (Bason et al., 1990). These factors may interactively

5
deteriorate rice, however, with other factors constant, the magnitude of deterioration depends on the
prevalence of microbes since microbial growth and heating occur simultaneously in rice at higher MCs
(Gilman and Barron, 1930; Milner, 1951; Phillips et al., 1988; Bason et al., 1990).
Growth of toxigenic mold on rough rice is precursory to mycotoxin contamination (Frazier, 1967;
Atungulu et al., 2014). Molds which invade rice while it is on the mother plant may build up to appreciable
levels after harvest if the conditions support proliferation (Anderson et al., 1975; Tripathi, 1975; Lillehoj et
al., 1976; Dickens, 1977; Wilson et al., 1979; Zuber and Lillehoj, 1979; King and Scott, 1982; Atungulu,
2014). It is not uncommon that when rice drying is delayed, the high moisture grain may encounter
elevated temperatures and relative humidity (RH) ranges above 75% which promote molds growth and
the potential of mycotoxin development (Frazier, 1967; Lacey and Magan, 1991; Richard et al., 2003;
Atungulu et al., 2014).
Most of the previous research directed at rice microbiology has focused primarily on control of
microflora, mainly fungi, during storage (Magan and Lacy, 1988; Cahagnier et al., 1993; Ranalli and
Howell, 2002) for the obvious reasons discussed above. Problems resulting from delayed drying such as
increased rice respiration rates and heating may relate to aerobic plate counts as well. But a more
pressing concern for increased Aerobic Plate Counts (APCs) is with regard to bacterial food poisoning
which has been associated with high levels of Bacillus cereus in rice (Ueda and Kuwabara, 1988). Thus,
there is an increasing demand that rice processors meet microbial specifications for APCs (e.g. 10,000
CFU/g) as well, especially for milled rice (Ueda and Kuwabara, 1988).
The long-grain hybrid rice cultivars considered in this study have a pubescent characteristic that
neither the long-grain pureline nor the medium-grain cultivars have. In addition, within the different rice
types, different cultivars also vary in their morphological features which include physical size and shape
geometry. The morphological differences that exist among long-grain hybrid, long-grain pureline and
medium-grain rice provide for justification to investigate dependency of microbial prevalence on rice types
and cultivars. Such information will be vital to processors to establish links of contamination to rice quality
deterioration.
The objectives of this study were to determine (1) the prevalence of aerobic bacteria and molds on
the surface (surface counts) and throughout (total counts) freshly-harvested rough rice; and (2) the effect

6
of rice growing location, cultivar, and harvest time on prevalence of the aerobic bacteria and molds.
C. Materials and Methods
1. Samples
Medium-grain (Jupiter and Caffey), long-grain pureline (RoyJ and CL152), and long-grain hybrid
(XL753 and XL723) rice cultivars were grown at four Arkansas locations, Rohwer, Stuttgart, Colt, and
Keiser. These locations were experimental plots owned by the University Of Arkansas Division Of
Agriculture. Each rice cultivar was grown at each of the locations in three randomly -spaced plots. At
harvest time, rough rice panicles were hand-harvested, to avoid cross contamination that could result
from equipment use, and placed in sterile and separate bags. Then, samples were immediately delivered
to University of Arkansas Grain Processing Lab (Fayetteville, AR) for immediate threshing and microbial
analyses. The threshing was done manually in a sterile environment (clean bench) to avoid
contamination. Threshed samples were sealed in individual sterile bags and stored at 4°C in a cooler until
usage for MC and microbial analyses. Samples of rice were collected for two harvest seasons, 2013 and
2014, between September and October. The hybrid rice used in this study had pubescent characteristics
while the pureline were non-pubescent (Fig. 1.1).
Figure 1.1. (a) Rough rice with pubescent characteristic (hairy surface); (b) non-pubescent rough rice
with relatively smooth non-hairy surface.
To determine the rice sample MC, the threshed samples in sealed sterile bags were removed from
the cooler and placed at room conditions where they were allowed to equilibrate with room conditions
(a) (b)

7
before removing samples for MC determination. The MC of each sample was measured by placing a 15 g
sample into a 130°C convective oven (Shellblue, Sheldon Mfg., Inc., Cornelius, OR) for 24 hours followed
by cooling in a desiccator for at least half an hour (Jindal and Siebenmorgen, 1987). Water activity was
measured using a water activity meter (AquaLab CX-2, Decagon Devices, Pullman, WA). At least three
replicates were used to determine the MCs and water activities.
2. Microbial analysis
Phosphate-buffered dilution water was prepared by dissolving 34 g of KH2PO4 in 500 mL water in a 1
L volumetric flask. The pH of the solution was adjusted to 7.2 using 1M NaOH solution. Then, stock
solution was made by adding distilled water to bring volume to 1 L in the volumetric flask. Stock solution
was autoclaved at 121°C for 20 minutes. Phosphate-buffered dilution water was prepared by taking 1.25
mL of stock solution and bringing it to 1 L with distilled cold water. Dilution water was dispensed into
smaller bottles and autoclaved at 121°C (AOAC methods 990.12 and 997.02). Seven dilution tubes with
caps were prepared for serial dilution.
Rough rice total (ground sample) and surface microbial counts were determined. The Rice samples
were masticated at two different settings using a lab masticator (Silver Panoramic, iUL, S.A., Barcelona,
Spain). A 10 g sample of rice was mixed with 90 mL phosphate-buffered dilution water in a sterile
stomacher bag and masticated in the lab masticator. The masticator was set at 240 s and 0.5 stroke/s.
This setting allowed the rice samples to be completely pulverized allowing for total microbial load
analyses. For surface microbial count determination, the masticator was set at 15 s and 0.5 stroke/s. The
process was confirmed to dislodge surface microbes without breaking the rice husk. Successive dilutions
were made by mixing 1 mL of the original mixture with 9 mL of phosphate-buffered dilution water in a test
tube and repeating the dilution until 10-8
dilution was made.
The 3M Petrifilm Aerobic Count Plates and 3M Petrifilm Mold Count Plates (3M Microbiology Product,
Minneapolis, MN) were used to enumerate aerobic bacterial and mold counts as follows: The count plates
were placed on a flat surface and the top film carefully lifted. A P1000 micropipette (Finnpipette F2,
Thermo Fisher Scientific, Inc., Vantaa, Finland) was used to pipette 1 mL of sample solution onto the
center of the plate. Then, the top film was placed down onto the inoculum. After the center of spreader
was aligned with center of the plate, the center of spreader was gently pressed to distribute the inoculum

8
evenly and then the gel was allowed one minute to solidify. For both total mold counts and APC c ounts,
10-4
to 10-7
times dilutions were plated. For surface mold counts and surface APC counts, 10-3
to 10-6
and
10-5
to 10-8
times dilutions were plated respectively. Preliminary tests had been done to determine the
appropriate dilution number for each kind of microbial population analyses. The inoculated plates were
stacked up to a maximum of 20 units and incubated.
Aerobic Count Plates were incubated (VWR General Purpose Incubator 1536, Sheldon
Manufacturing Inc., Cornelius, OR) at 37°C for 48 hours before counting. Mold Count Plates were
incubated (Thelco Model 4, Precision Scientific Instruments, Inc., Chicago, IL) at 25°C for 120 hours
before counting. After incubation, the Colony Forming Units (CFU) on each plate were counted. Aerobic
bacteria colony appeared red in color on Aerobic Count Plate. Yeast colony appeared blue-green or off-
white in color and had non-diffusive edges. Mold colony colors were blue, black, yellow, or green. Mold
colonies tended to be larger and more diffusive than yeast colonies. The appropriate dilution factor,
volume, and sample weight were taken into account to obtain the total CFU/g of each sample:
where, Tcfu is total colony forming units per gram of rough rice (CFU/g), PCFU is colony forming units
counted on plate per gram of rice (CFU/g), and Dr is dilution factor (10-3
to 10-8
times). For the studied rice
samples, preliminary results showed that yeast counts were very low with nearly none detected even with
10 times dilution. Therefore, yeast count was not reported in this research.
D. Results and Discussion
1. Statistical Analyses
Linear regression, analysis of variance, Student’s t test (least significant difference test), and the
Tukey HSD tests were performed with statistical software (JMP version 12.0.0, SAS Institute Inc., Cary,
N.C.) to determine significant differences within and among the sample means. Level of significance (α)
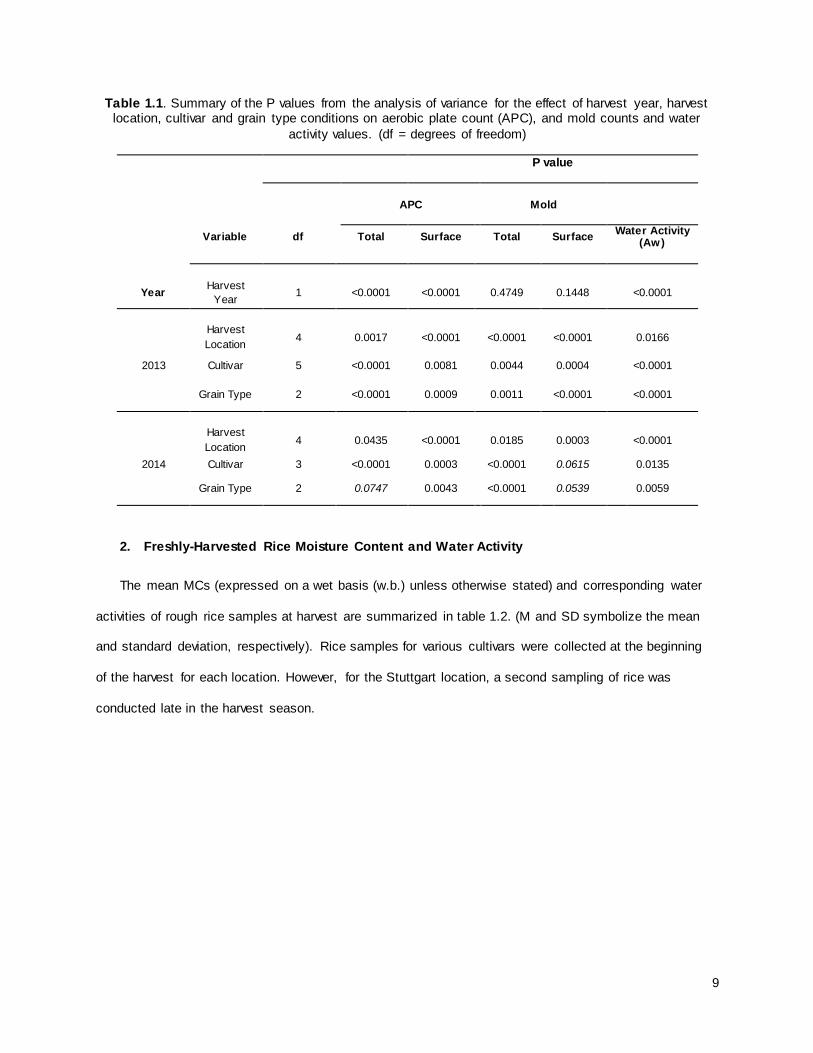
was set at 5% for comparing means of total and surface APCs and mold counts. Table 1.1. gives the P
values and degrees of freedom associated with the three factors studied. As seen in table 1.1. the P
value for comparing water activities (assuming unequal variances) is significant . Since microbial growth is
highly dependent on the water activity of a foodstuff, further analyses were separated by harvest year.
9
Table 1.1. Summary of the P values from the analysis of variance for the effect of harvest year, harvest location, cultivar and grain type conditions on aerobic plate count (APC), and mold counts and water
activity values. (df = degrees of freedom)
P value
APC Mold
Variable df Total Surface Total Surface Water Activity
(Aw)
Year Harvest
Year 1 <0.0001 <0.0001 0.4749 0.1448 <0.0001
Harvest
Location 4 0.0017 <0.0001 <0.0001 <0.0001 0.0166
2013 Cultivar 5 <0.0001 0.0081 0.0044 0.0004 <0.0001
Grain Type 2 <0.0001 0.0009 0.0011 <0.0001 <0.0001
Harvest
Location 4 0.0435 <0.0001 0.0185 0.0003 <0.0001
2014 Cultivar 3 <0.0001 0.0003 <0.0001 0.0615 0.0135
Grain Type 2 0.0747 0.0043 <0.0001 0.0539 0.0059
2. Freshly-Harvested Rice Moisture Content and Water Activity
The mean MCs (expressed on a wet basis (w.b.) unless otherwise stated) and corresponding water
activities of rough rice samples at harvest are summarized in table 1.2. (M and SD symbolize the mean
and standard deviation, respectively). Rice samples for various cultivars were collected at the beginning
of the harvest for each location. However, for the Stuttgart location, a second sampling of rice was
conducted late in the harvest season.

10
Table 1.2. Moisture content (%, w.b.) and water activity (inside parentheses) of six rice cultivars harvested from four Arkansas locations in 2013 and 2014; rice cultivars CL152 and XL 723 were not
available in 2014. The data represents means (M) and standard deviations (SD) from at least three replicates.
Moisture Content
(Water Activity) Moisture Content
(Water Activity)
Moisture Content (Water Activity)
Moisture Content (Water Activity)
Harvest Location
2013 2014
Cultivar 2013 2014
Colt
M = 23.8, SD = 3.2
(M = 0.90, SD = 0.04)
M = 26.5, SD = 3
(M = 0.86, SD = 0.02)
LG-Hyb (XL723)
M = 19.9, SD = 1.4
(M = 0.88, SD = 0.03)
-
Keiser
M = 21.4, SD = 1.8
(M = 0.92, SD = 0.02)
M = 24.4, SD = 3.4
(M = 0.85, SD =
0.03)
LG-Hyb (XL753)
M = 21.4, SD = 1.3
(M = 0.90, SD =
0.02)
M = 20.3, SD = 2.8
(M = 0.81, SD =
0.05)
Rohw er
M = 22.9, SD = 4.3
(M = 0.90, SD = 0.05)
M = 27.2, SD = 2.9
(M = 0.87, SD = 0.03)
LG-Pure
(CL152)
M = 21.5, SD = 1.3
(M = 0.91, SD = 0.03)
-
Stuttgart (Early)
M = 22.9, SD = 3.5
(M = 0.92, SD = 0.03)
M = 23, SD = 2.6
(M = 0.85, SD = 0.02)
LG-Pure (RoyJ)
M = 21.5, SD = 1
(M = 0.91, SD = 0.02)
M = 23, SD = 4.1
(M = 0.82, SD = 0.04)
Stuttgart (Late)
M = 22.6, SD = 0.8
(M = 0.93, SD = 0.01)
M = 17.3, SD = 1.4
(M = 0.75, SD = 0.03)
MG (Caffey)
M = 26, SD = 3.1
(M = 0.94, SD = 0.02)
M = 25, SD = 4.3
(M = 0.85, SD = 0.04)
Total
(by year)
M = 22.7, SD = 3
(M = 0.91, SD = 0.03)
M = 23.7, SD = 4.4
(M = 0.84, SD = 0.05)
MG (Jupiter)
M = 26, SD = 2.4
(M = 0.94, SD = 0.02)
M = 26.4, SD = 4.1
(M = 0.86, SD = 0.06)
In 2013, rough rice MC and water activity ranged from 17.8% (minimum) to 29.7% (maximum) and
from 0.83 (minimum) to 0.97 (maximum), respectively. In 2014, rough rice MC and water activity ranged
from 14.9% (minimum) to 30.7% (maximum) and from 0.68 (minimum) to 0.92 (maximum), respectively.
Rainfall in the later part of the 2013 harvest season resulted in elevated MCs for some rough rice cultivars
(Jupiter, RoyJ, CL152, XL753, and XL723) at the Stuttgart location. A similar trend was observed for
water activity values of the rice samples (Jupiter, RoyJ, CL152, XL753, and XL723). However, as
expected, in the 2014 harvest season all the late-harvest rice samples had lower MC than early-harvest
samples in Stuttgart station.
Figure 1.2. shows a linear regression illustrating the relationship between rough rice water activity
and MC. As expected, a general linear relationship was observed between the water activity and MC

11
data. The R-squared value for the 2013 data was 0.57, whereas, the R-squared value for 2014 was 0.79.
Overall, the average water activity for the samples collected for the 2013 harvest year (M = 0.91, SD =
0.03) was significantly higher (p<0.0001) than the average water activity for year 2014 (M = 0.84, SD =
0.05). For the 2013 data, the mean value for water activity for Stuttgart (Late) was statistically higher than
Rohwer. The other three stations had mean water activities between the mean values for Stuttgart (Late)
and Rohwer. For the 2014 studies, the water activity of rice samples from Stuttgart (Late) was significantly
lower than the other four locations. The medium-grain rice varieties sampled in 2013 had significantly
higher water activity values than the long-grain rice varieties. For the 2014 samples, the medium grain
rice, the water activity values were significantly higher than the hybrid variety.
Water activity is one of the most important factors that affect growth of microorganisms in rough rice
(Gibson, et al., 1994). In case of molds, the genera Aspergillus, Penicillium, and Sporendonema have
been isolated from rough rice (Brooker et al., 1974, Delucca et al., 1978, Surekha et al., 2011). The
Aspergillus flavus which is typically associated with aflatoxin, grows better with water activity between
0.86 and 0.96 (Vujanovic et al., 2001) and at optimum temperature of 37C; the general temperature
range for most fungal growth is from 12C to 48C (Vujanovic et al., 2001). Consequently, in event that
toxigenic mold spores of A. flavus were present on the samples, delayed drying would predispose them to
aflatoxin production if other stress conditions are met. The largest water activity measurements were
associated with medium-grain rice which is normally harvested at higher harvest MC compared to the
long-grain rice.

12
Figure 1.2. Relationship between water activity and moisture content for rice samples collected for
harvest years 2013 and 2014
3. Microbial Distribution as Affected by Harvest Year
For the 2013 experimental trial, a total number of 90 samples were plated to obtain the aerobic
bacteria counts and mold counts (Fig. 3). For 2014, 60 samples were plated to obtain the same
information. For the 2013 samples, the average total APCs and total mold counts were M = 8.19, SD =
0.13 and M = 6.36, SD = 0.35 log10 CFU/g, respectively. For the 2014 samples, the average total APCs
and total mold counts were M = 7.75, SD = 0.33 and M = 6.41, SD = 0.49 log10 CFU/g, respectively. The
surface APC counts for 2013 and 2014 were M = 7.21, SD = 0.25 and M = 6.87, SD = 0.35 log10 CFU/g
respectively. Whereas, the surface mold counts for 2013 and 2014 were M = 5.58, SD = 0.58 and M =
5.72, SD = 0.54 log10 CFU/g respectively.
The means were compared using the student’s t-test, assuming unequal variances. The average total
APCs of 2013 samples were significantly higher than the average total APCs of 2014 samples (p
Wat
er a
ctiv
ity
Moisture content (% w.b.)
13
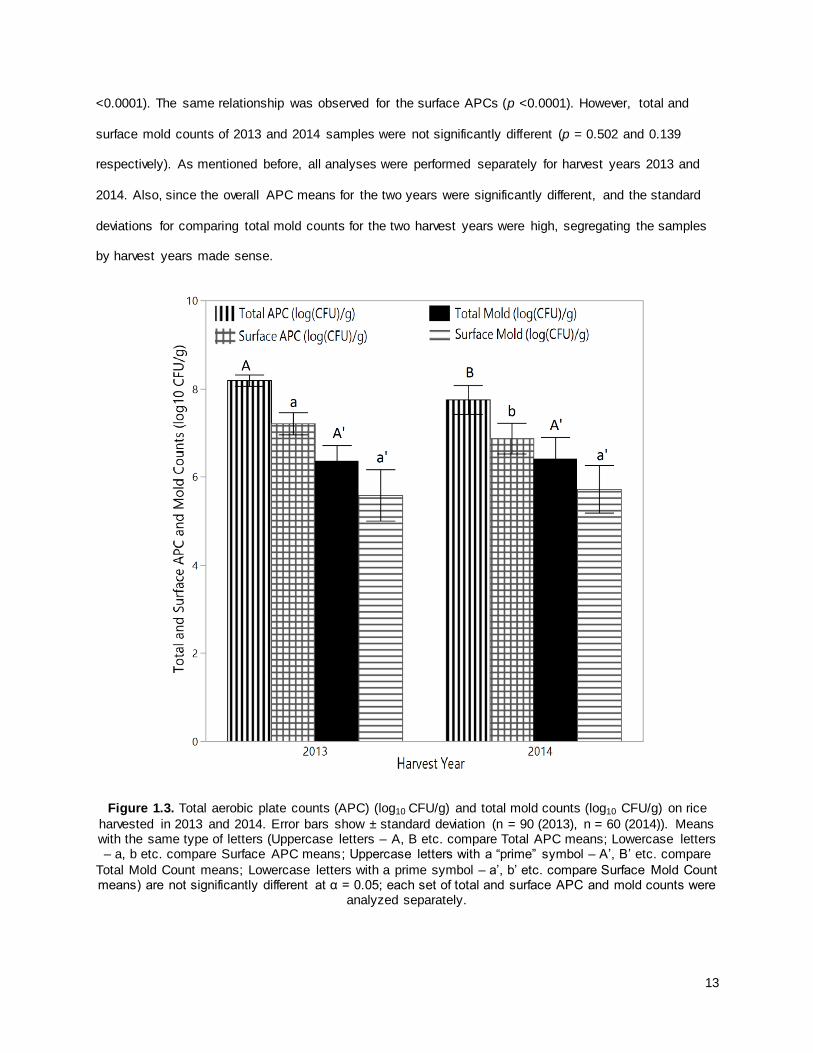
<0.0001). The same relationship was observed for the surface APCs (p <0.0001). However, total and
surface mold counts of 2013 and 2014 samples were not significantly different (p = 0.502 and 0.139
respectively). As mentioned before, all analyses were performed separately for harvest years 2013 and
2014. Also, since the overall APC means for the two years were significantly different, and the standard
deviations for comparing total mold counts for the two harvest years were high, segregating the samples
by harvest years made sense.
Figure 1.3. Total aerobic plate counts (APC) (log10 CFU/g) and total mold counts (log10 CFU/g) on rice
harvested in 2013 and 2014. Error bars show ± standard deviation (n = 90 (2013), n = 60 (2014)). Means with the same type of letters (Uppercase letters – A, B etc. compare Total APC means; Lowercase letters – a, b etc. compare Surface APC means; Uppercase letters with a “prime” symbol – A’, B’ etc. compare
Total Mold Count means; Lowercase letters with a prime symbol – a’, b’ etc. compare Surface Mold Count means) are not significantly different at α = 0.05; each set of total and surface APC and mold counts were
analyzed separately.

14
4. Microbial Distribution on Different Rice Cultivars
In this study, the level of microbial contamination on different cultivars separated by medium-grain,
long-grain pureline, and long-grain hybrid rice types was investigated. For the 2013 trial, two cultivars for
each grain type were studied. For the experiment run in 2014, one cultivar each of long-grain pureline and
long-grain hybrid were collected along with two cultivars for medium-grain. Table 1.3. shows Tukey HSD
test for sample means combined by grain type. The analysis of 2013 samples combines the means for
XL723 and XL753 under LG-Hyb (long-grain hybrid), CL152 and RoyJ under LG-Pure (long-grain
pureline), and Caffey and Jupiter under MG (medium-grain). For the analysis of the 2014 samples, the
LG-Hyb cultivar is XL753, the LG-Pure is RoyJ, whereas the MG category combines Caffey and Jupiter.
Table 1.3. Tukey HSD test for sample means combined by grain type (LG-Hyb, LG-Pure, and MG represent long-grain hybrid, long-grain pureline, and medium-grain rice respectively).
2013 2014
Grain type Total APC Total Mold Total APC Total Mold
LG-Hyb B B A B
LG-Pure A AB A A
MG A A A A
p-value <0.0001 0.0011 0.0747 <0.0001
As seen in figure 1.4.(a), for the 2013 samples, the mean APCs for both long-grain hybrid rice
cultivars, XL723 and XL753 (M = 8.10, SD = 0.10, M = 8.09, SD = 0.09 respectively), are significantly
lower (p<0.0001) than the other cultivars. Figure 1.4.(a) shows that the surface APC bars for XL753 (LG-
Hyb) and Caffey (MG) are separated by a letter. The surface mean APC for XL753 (M = 7.05, SD = 0.11)
is significantly lower (p=0.0081) than the mean APC for Caffey (M = 7.31, SD = 0.28). For the 2014
samples (figure 1.4.(b)), the total APC count for medium grain rice, Jupiter (M = 7.55, SD = 0.36) is
significantly lower (p<0.0001) than Caffey (MG) (M = 8.03, SD = 0.2) and RoyJ (LG-Hyb) (M = 7.84, SD =
0.22). The surface APC for the 2014 samples follow a similar trend – the mean for Caffey (MG) (M = 7.15,
SD = 0.36) is significantly higher (p=0.0003) than XL753 (M = 7.59, SD = 0.26) and Jupiter (M = 7.55, SD
= 0.36).
Figure 1.4.(a) indicates that the total mold count means for the 2013 samples follow a similar trend to
the total APC mean trend. Both long-grain hybrid rice cultivars, XL723 and XL753 (M = 6.16, SD = 0.23,

15
M = 6.26, SD = 0.15 respectively), are significantly lower (p=0.0044) than the Caffey (MG) (M = 6.62, SD
= 0.41). The Tukey HSD test for the surface mold counts for the 2013 samples indicates that at least one
of the means is significantly different (p=0.0004) from the others. The letters on top of the bar graph
indicate that the means for the medium grain cultivars are significantly greater than the means for the
long-grain hybrid cultivars, and the long-grain pureline cultivars lie in the middle. The analysis of total
mold counts for the 2014 samples (figure 1.4.(b)) reveals that the long-grain hybrid cultivar (XL753) (M =
5.97, SD = 0.27) has significantly lower counts (p<0.0001) than the other three cultivars. The overall
Tukey HSD test indicated no significant differences (p=0.0539) between the surface mold counts for the
2014 samples.
The Tukey HSD test indicated that for the 2013 samples, within medium-grain and long-grain hybrid
and long-grain pureline rice groups, the studied cultivars had no significant difference in APCs or mold
counts (P>0.05) (Fig. 1.4.(a)). However, for the 2014 samples for the medium grain variety, the APC in
the cultivar Caffey was statistically greater than in the counterpart cultivar Jupiter (Fig. 1.4.(b)). In
summary, for 2013 harvested samples, of all the studied rice cultivars, the long-grain hybrid cultivars had
significantly lower APC levels (M =8.1, SD = 0.09). In 2014 harvested samples, of all the studied rice
cultivars, the long-grain hybrid cultivars had significantly lower mold count levels (M 5.97, SD =0.27).

16
(a)
(b)

17
Figure 1.4. Total aerobic plate count (APC) (log10 CFU/g) and total mold count (log10 CFU/g) on different types of rice - medium-grain (MG), long-grain pureline (LG-Pure), and long-grain hybrid (LG-Hyb) rice
cultivars. (a) represents data of 2013 harvested samples, and (b) represents data of 2014 harvested samples. Error bars show ± standard deviation (n = 90 (2013), n = 60 (2014)). Means with the same type of letters (Uppercase letters – A, B etc. compare Total APC means; Lowercase letters – a, b etc. compare
Surface APC means; Uppercase letters with a “prime” symbol – A’, B’ etc. compare Total Mold Count means; Lowercase letters with a prime symbol – a’, b’ etc. compare Surface Mold Count means) are not
significantly different at α = 0.05; each set of total and surface APC and mold counts were analyzed
separately.
5. Microbial Load on Rice Grown at Different Locations
Rice samples used in this experiment were grown at Keiser, Colt, Rohwer, and Stuttgart. These rice
growing locations all lie along the Mississippi river and stretch from north to south. The locations have
different weather conditions and soil types. For the Stuttgart location, two sets of samples were collected
– one set was harvested early in the season and the second was harvested late in the season.
Figure 1.5. shows the trends observed for the different locations for years 2013 and 2014. The Tukey
HSD test indicated that at least one of the sample means for both total and surface APC counts of the
year 2013 obtained from the five sample sets was significantly different from the others (p = 0.0017 and
<0.0001 respectively). Figure 1.5.(a) indicated the total APC mean for Keiser (M = 8.08, SD = 0.08) was
significantly lower than that of Colt, Rohwer, and Stuttgart (Late); similarly, the surface 1.5(b), there was
no statistically significant difference observed in total APC in rice samples obtained in 2014 (p = 0.0435).
However, the same trend was not observed for the surface APC for 2014 (p <0.0001) – the surface APC
for Keiser (M = 6.52, SD = 0.26) was significantly lower than all other locations, except Colt (M = 6.75, SD
= 0.3).
For the 2013 samples (figure 1.5.(a)), the total mold count means for stations Rohwer and Stuttgart
(Early) (M = 6.56, SD = 0.39, M = 6.57, SD = 0.31, respectively) were significantly higher than Colt and
Keiser (M = 5.59, SD = 0.54, M = 4.93, SD = 0.14 respectively) (p<0.0001); however, the total mold count
mean for Stuttgart (Late) was not significantly lower than both Stuttgart (Early ) and Rohwer. The 2013
surface mold count means followed the same trend as the surface APC means – the mean for Keiser
(p<0.0001) was significantly lower than all the other location means. At least one of the sample means
was significantly different from the others for the 2014 total mold count means (p= 0.0185). figure 1.5.(b)
shows that Rohwer and Stuttgart (Early) are separated by a letter; therefore, the total mold count for
Rohwer (M = 6.79, SD = 0.59) is significantly higher than for Stuttgart (Early) (M = 6.18, SD = 0.14). The

18
trend for the surface mold counts for 2014 is similar – mean value for Rohwer is significantly higher (p =
0.0003) than all other locations except Colt (M = 5.96, SD = 0.56). For both years, there was no
significant difference observed for either the total APC counts or the total mold counts for t he rice
samples harvested early and late in the season for Stuttgart location.
Geographically, both Keiser and Rohwer stations lie on the Delta ecological zone, but are located in
Northeast Arkansas and Southeast Arkansas, respectively. Both stations have similar production issues
related to irrigation, soil fertility, sustainability of topsoil, and pest management. But, the major difference
between the farming practices in Keiser and Rohwer are rice planting dates. In Rohwer, rice is planted
earlier in April, whereas in Keiser planting is done in May. Variation in planting date also shifts the harvest
dates to late September and late October for Rohwer and Keiser, respectively. It is likely that the
significant difference in microbial counts between the two stations was caused by differences in weather
conditions such as prevailing temperature, rainfall and RH during the rice growing and harvest season.
(a)

19
(b)
Figure 1.5. Total aerobic plate count (APC) (log10 CFU/g) and total mold counts (log10 CFU/g) on rice
grown at four Arkansas locations (Stuttgart (Early and Late), Rohwer, Colt and Keiser). (a) represents data for 2013 harvested samples, and (b) represents data for 2014 harvested samples. Error bars show ± standard deviation (n = 90 (2013), n = 60 (2014)). Means with the same type of letters (Uppercase letters
– A, B etc. compare Total APC means; Lowercase letters – a, b etc. compare Surface APC means; Uppercase letters with a “prime” symbol – A’, B’ etc. compare Total Mold Count means; Lowercase letters with a prime symbol – a’, b’ etc. compare Surface Mold Count means) are not significantly different at α =
0.05; each set of total and surface APC and mold counts were analyzed separately.
E. Conclusion
The research determined the relative prevalence of microorganisms on freshly-harvested long-grain
hybrid, long-grain pureline, and medium-grain rice types. Also, factors that influence the prevalence of
these microbes on the rice were investigated. Specifically, the total aerobic plate count (APC) and mold
count on freshly-harvested, long-grain hybrid (XL723 and XL753), long-grain pureline (CL152 and RoyJ)
and medium-grain (Caffey and Jupiter) rice cultivars grown at four Arkansas locations (Stuttgart, Rohwer,
Colt, and Keiser) were determined in a study conducted over two rice harvest seasons – 2013 and 2014.
The following conclusions were drawn:

20
Overall, the average water activity for the samples collected for the 2013 harvest year (M = 0.91,
SD = 0.03) was significantly higher (p<0.0001) than the average water activity for year 2014 (M =
0.84, SD = 0.05), where M and SD symbolize mean and standard deviation, respectively .
For the 2013 samples, the average total APCs and total mold counts were M = 8.19, SD = 0.13
and M = 6.36, SD = 0.35 log10 CFU/g, respectively. For the 2014 samples, the average total
APCs and total mold counts were M = 7.75, SD = 0.33 and M = 6.41, SD = 0.49 log10 CFU/g,
respectively.
In summary, for 2013 harvested samples, of all the studied rice cultivars, the long-grain hybrid
cultivars had significantly lower APC levels (M =8.1, SD = 0.09). In 2014 harvested samples, of all
the studied rice cultivars, the long-grain hybrid cultivars had significantly lower mold count levels
(M 5.97, SD =0.27).
The microbial counts were also significantly dependent on the location of harvest and varied from
the year 2013 to 2014.
The findings from this study provide baseline information on the relative microbial load on freshly -
harvested rice, especially for the studied Arkansas locations. The information may be useful to guide
decisions on scheduling of rice drying to retard microbial growth and potential quality deterioration of rice
during storage.
F. References
Anderson, H. W., Nehring, E. W., & Wichser, W. R. (1975). Aflatoxin contamination of corn in the field. J. of Agric. and Food Chem. 23(4):775-782.
Atungulu, G. G., Zhong, H., Thote, S., Okeyo, A., & Couch, A. (2015). Microbial prevalence on freshly -harvested long-grain pureline, hybrid, and Medium-grain rice cultivars. Applied Engineering in Agriculture, 31(6), 949-956.
Atungulu, G. G., Zhong, H., & Siebenmorgen, T. J. (2014). Microbial population on freshly -harvested rice and factors affecting prevalence. ASABE Paper No. 141914312. St. Joseph, Mich.:ASABE.
Bason, M. L., Gras, P. W., Banks, H. J., & Esteves, L. A. (1990). A quantitative study of the influence of temperature, water activity and storage atmosphere on the yellowing of paddy endosperm. J. Cereal
Sci. 12(2):193-201.
Brooker, D. B., Bakker-Arkema, F. W. & Hall, C. W. (1974). Drying cereal grains. AVI Publishing Company.
21
Cahagnier, B., Lesage, L., & Richard-Molard, D. (1993). Mould growth and conidiation in cereal grains as affected by water activity and temperature. Letters in Appl. Microbiol, 17(1), 7-13. doi:10.1111/j.1472-765X.1993.tb01423.x
Delucca, I. I., Anthony, J., Plating, S. J., & Ory, R. L. (1978). Isolation and identification of lipolytic microorganisms found on rough rice from two growing areas. J. of Food Protection, 41(1), 28-30
Dickens, J. W. (1977). Aflatoxin occurrence and control during growth, harvest and storage of peanuts. Mycotoxins in Human and Animal Health. 99-105.
Frazier, W. C., & Westhoff, D. C. (1967). Food Microbiology. Mc Graw-Hill Book Company. Nova York, NY, 252-282.
Gibson, A. M., Baranyi, J., Pitt, J. I., Eyles, M. J., & Roberts, T. A. (1994). Predicting fungal growth: the
effect of water activity on Aspergillus flavus and related species. Intl. J. of Food Microbiology. 23(3), 419-431.
Gilman, J. C., & Barron, D. H. (1930). Effects of molds on temperature of stored grain. Plant Physiology. 5(4), 565.
Jindal, V. K., & Siebenmorgen, T. J. (1987). Effects of oven drying temperature and drying time on rough rice moisture content determination. Trans. ASAE, 30(4), 1185-1192.
King, S. B., Scott, & G. E. (1982). Field inoculation techniques to evaluate maize for reaction to kernel infection by Aspergillus flavus. Phytopathology. 72(7): 782-785.
Lacey, J., & Magan, N. (1991). Fungi in cereal grains: their occurrence and water and temperature relationships. Developments in Food Sci. (Netherlands).
Magan, M. & Lacey, J. (1988). Ecological determinants of mould growth in stored grain. Intl. J. Food
Microbiol. 7(3), 245-256.
Misra, A. K., & Vir, D. (1991). Assessment of losses due to discoloration of paddy grains. Indian J.
Mycology Plant Pathology (India).
Official Methods of Analysis of AOAC INTERNATIONAL (2005) 18th Ed., AOAC INTERNATIONAL, Gaithersburg, MD, USA, Official Method 997.02. Yeast and Mold Counts in Foods.
Official Methods of Analysis of AOAC INTERNATIONAL (2005) 18th Ed., AOAC INTERNATIONAL, Gaithersburg, MD, USA, Official Method 990.02, Aerobic Plate Count in Foods.
Phillips, S., Widjaja, S., Wallbridge, A., & Cooke, R. (1988). Rice yellowing during post -harvest drying by aeration and during storage. J. Stored Prod. Res. 24(3), 173-181.
Ranalli, R. P., & Howell, T. A. (2002). Effects of Storage Conditions on the Total Aerobic and Yeast/Mold Bacterial Counts of Rough Rice During On‐farm Storage. J. of food sci, 67(2), 807-810.
Richard, J. L., Payne, G. E., Desjardins, A. E., Maragos, C., Norred, W. P., & Pestka, J. J. (2003). Mycotoxins: risks in plant, animal and human systems. CAST Task Force Report, 139, 101-103.
Sahay, M. N., & Gangopadhyay, S. (1985). Effect of wet harvesting on biodeterioration of rice. Cereal Chem. 62(2), 80-83.
Singaravadivel, K., & Raj, S. A. (1983). Changes in parboiled rough rice caused by improper drying and microbial infection. J. Food Biochem. 7(1), 15-21.
Skyrme, D. S., Marks, B. P., Johnson, M. G., & Siebenmorgen, T. J. (1998). Distribution of total aerobic and coliform bacterial counts among rice kernel components. J. of food sci, 63(1), 154-156.

22
Surekha, M., Saini, K., Reddy, V. K., Reddy, A. R., & Reddy, S. M. (2011). Fungal succession in stored rice (Oryza sativa Linn.) fodder and mycotoxin production. Afr. J. Biotechnol, 10(4), 550-555.
Tripathi, R. K. (1975). Head fungi of sorghum, phytotoxins and their effects on seed germination. Indian Phytopathology (India).
Ueda, S., & Kuwabara, Y. (1988). The ecological study of Bacillus cereus in rice crop processing (2): On the contamination of B. cereus in unhulled, unpolished and polished rice during the process of rice
(English summary). J. Antifung. Agents, 16, 115-120.
Vujanovic, V., Smoragiewicz, W., & Krzysztyniak, K. (2001). Airborne fungal ecological niche
determination as one of the possibilities for indirect mycotoxin risk assessment in indoor air. Environ. Toxicology, 16(1), 1–8.
Wilson, D. M., McMillian, W. W., & Widstrom, N. W. (1979). Field aflatoxin contamination of corn in South Georgia. J. of American Oil Chem. Soc. 56(9), 798-99.
Zuber, M. S. & Lillehoj, E. B. (1979). Status of the aflatoxin problem in corn. J. of Environ. Quality, 8(1): 1- 5.

23
Chapter 2
III. Microbial Growth Kinetics and Prediction Models on Hybrid Rough Rice Cultivars
A. Abstract
There is a need to determine kinetics of mold growth on rough rice (RR) during storage at various
temperatures and moisture contents (MC) and to delineate conditions that effectively mitigate mycotoxin
contamination of the grain. The objective for this study was to simulate conditions of delayed drying and
prolonged storage of RR and to characterize kinetics of mold growth for hybrid rice at different
temperatures and MCs. Long-grain hybrid rice cultivars (XL753 and CL XL745) conditioned to four
different MCs (12.5%, 16.0%, 19.0%, and 21.0% wet basis) were stored in sealed containers at
temperatures ranging from 10°C (45°F) to 40°C (104°F) for a period of 16 weeks. For all cultivars, a direct
relationship between mold counts and MC was observed – whereas more complex trends were observed
for the effect of temperature and the duration of storage on mold growth. Kinetic models including
Baranyi, Weibull, Gompertz, Richard and Buchanan were successfully modified and fitted using non-
linear regression and used to predict the mold counts (log10 CFU/g) for varying conditions
(correlations=0.65-0.76). The study concludes that long-grain hybrid RR could be stored at low MC levels
(≤17%) and moderate temperatures (≤27°C) for up to 6 weeks without any change in the mold growth
profile. However, storing the rice at high MC (>17%) for more than 8 weeks, especially at higher (>27°C)
temperatures should be avoided due to the potential for mold growth.
B. Introduction
Stored grain ecosystems include contaminants, micro-organisms and even pests colonizing the grain
(Jayas et al., 1994; Wawrzyniak et al., 2013). A Significant amount of research effort has been dedicated
to studying insect infestations and control of rice storage; however, only a minority of studies have
focused on identifying and enumerating mold and aerobic plate counts (APC) for stored rough rice (RR).
According to Bullerman and Bianchini (2009) cereals harbor a variety of microorganisms such as molds,
yeasts and bacteria. Christensen and Meronuck (1986) classified fungi that damage and invade seeds
into two groups – field and storage fungi. Field fungi invade grain when the moisture content (MC) of the
grain is high (22-24%) and include genera Cephalosporium, Fursarium, Gibberella, Nigrospora,

24
Helminthosporium and occasionally Alternaria and Cladosporium; whereas, the major storage fungi for
cereal grains are Aspergillus and Penicillium (Christensen and Meronuck, 1986; Lee, 1999; Bullerman
and Bianchini, 2009). The main bacterial pathogens that affect grains and grain products include Bacillus
cereus, Clostridium botulinum, Clostridium perfringens, Escherichia coli, Salmonella , and Staphylococcus
aureus (Bullerman and Bianchini, 2009).
APC is commonly used as an indicator of the population of aerobic bacteria in a food product and can
be used to evaluate the sanitary condition of a food product or equipment. Though APC does not indicate
the presence of human pathogens, high APC values point to poor sanitation or problems with process
control and indicate a higher likelihood for the presence of pathogenic bacteria (FDA, 2001; Fact Sheet
for Food Processors, 2002). Though bacterial growth is not a concern if grain is dried before storage, RR
stored at high MC can result in high bacterial counts (Skyrme et al. , 1998; Lee, 1999; Ranalli and Howell,
2002; Atungulu et al., 2015). A recent study by Wang et al (2016) investigated microbial contamination of
raw materials used for Korean rice cake and reported detection of APC, coliforms and Bacillus cereus for
rice purchased from factories. Elevated levels of APCs in stored RR have been associated with bacterial
food poisoning, especially in cases with high levels of Bacillus cereus (Ueda and Kuwabara, 1988; Lake,
Hudson and Cressey, 2004). Bacterial pathogens and spoilage bacteria present on RR can endure
through the processing steps and cause problems downstream (Bullerman and Bianchini, 2009; Wang et
al., 2016). Thus, there is an increasing demand that rice processors meet microbial specifications for
APCs (e.g. 10,000 CFU/g) as well (Ueda and Kuwabara, 1988; Skyrme et al., 1998; Ranalli and Howell,
2002; Atungulu et al., 2015).
Molds are one of the main causes of concern for rice producers, processors and consumers because
molds are not only responsible for spoilage and quality losses but also pose a significant public health
risk. Depending on stress conditions, which may be affected by rice kernel physical characteristics, MC,
storage temperature, and relative humidity (RH), mold harbored on rice may produce certain carcinogenic
mycotoxins. Over 100 mold species have been isolated from RR with the major storage molds belonging
to the genera Aspergillus, Penicillium, and Sporendonema (Brooker et al., 1974). The production of
mycotoxins associated with the storage molds is dependent on physical factors including rice
temperature, water activity and light conditions, chemical factors such as pH, oxygen, and preservative

25
use, and biological factors such as competitive microbiota (Lacey and Magan, 1991). According to Frazier
(1967), the spores of storage molds have optimum temperature and RH ranges for development. At
suitable growth conditions, toxigenic molds such as Aspergillus flavus may produce aflatoxin, a
carcinogen that poses health risks to grain consumers (Frazier, 1967; Lacey and Magan, 1991; Richard
et al., 2003; Atungulu et al., 2014).
Though food safety is a major concern related to microbial contamination, when rice is severely
infested by fungi, the resulting quality losses are also a pressing concern for the rice industry. Microbial
contamination of rice may lead to weakened kernels resulting in breakage and dry matter loss, kernel
discoloration, flavor changes, and other problems related to loss in functional quality characteristics thus
pose significant economic loss (Singaravadivel and Raj 1983; Sahay and Gangopadhyay 1985; Phillips
et al., 1988; Misra and Vir 1991; Harein and Meronuck 1995). Therefore, there is an acute need to identify
and understand the impact of key factors contributing to mold and microbial loads and growth kinetics in
order to better control the safety and quality of stored RR.
Previous research work focused on characterizing mold and APC on rice largely of the long- and
medium-grain variety for various aerated storage and drying systems (Skyrme et al., 1998; Ranalli and
Howell, 2002). With the development and promotion of hermetic storage bags, bunker-type storage, in-bin
drying systems, and grain refrigeration systems in the rice industry, data and predictions for microbial
kinetics under the “worse-case scenario” can provide guidelines for developing safe post -harvest
processing and storage practices for RR. Mutters and Thompson (2009), in their book, The Rice Quality
Handbook , mention that the quality of rice once it is harvested is dependent on three factors – water
activity, storage temperature, and storage duration.
A number of studies have focused on modeling bacterial growth for various stored foods and feeds.
However, similar models for predicting mold growth in terms of number of colonies detected on a
particular media (CFU/g) are few because molds are not unicellular and in contrast to bacteria, the growth
of molds is usually reported as radial growth measured by gauging visible growth (diameter ≥ 3 mm) of a
fungal isolate on solid media (McKellar and Lu, 2003). Nevertheless, mold counts in CFU/g are commonly
used by industry and scientists alike to determine food quality and safety. Another disadvantage of the
approach of measuring radial growth to predict mold growth on a food product is that the method does not

26
clearly explain the scenario and effect of having multiple species of fungi present on the food sample, as
is often the case for many food products. Five growth models recommended by a study performed for
simulating mold growth curves by Lopez et al (2004) were selected for this study – Buchanan three-phase
linear, Gompertz, Richards, Weibull and Baranyi.
This study thus endeavors to provide useful information regarding the prevalence of mold during
different storage conditions that can help determine the optimum timeframe and conditions for storage of
hybrid rice to not only reduce the economic impact of spoilage due to mold contamination, but also to
mitigate the health risks posed by toxigenic molds. In the last decade, hybrid, long-grain (HLG) rice has
become popular among US rice growers primarily due to the potential for high rice yields and short
growing seasons (Branscum et al., 2014; Nalley et al., 2014). HLG rice has a pubescent characteristic
that may predispose it to harbor and support mold growth in a different manner when compared to non-
pubescent rice (Atungulu et al., 2015). The morphological distinctiveness of the HLG rice kernels
compared to the traditional long-grain rice kernel begets a need for a better understanding of the effect of
mold growth on HLG rice cultivars during storage. The specific objectives for this study were to (1)
determine the kinetics of mold growth on HLG rice at different MCs and storage temperatures (2) modify
current growth models to predict mold growth in terms of CFU/g and provide comparison of model fit , and
(3) determine the optimum conditions for mold growth. Results from this study could be useful for the
development of specific postharvest management practices that target the increasingly popular HLG rice
cultivars.
C. Materials and Methods
1. Samples
Freshly-harvested rice was procured from rice fields located in Arkansas. Two HLG rice cultivars, CL
XL745 from Running Lake Farms near Pocahontas, AR and XL753 from Keiser, AR (University of
Arkansas, Research Station) were harvested in 2014 (Year 1, table 2.1.) at approximately 22% MC wet
basis (w.b.). All MCs for this study are expressed on a w.b. unless otherwise stated. For the year 2015
(Year 2, table 2.1.), HLG cultivars, CL XL745 and XL760 were harvested from Running Lake Farms near
Pocahontas, AR at approximately 22% MC w.b. The rice samples were then cleaned to remove chaff and
foreign matter using a dockage tester (Model XT4, Carter-Day, Minneapolis, MN) and then conditioned to

27
four initial MC levels (12.5%, 16%, 19% and 21%) by placing the rice on a tarp at room temperature. The
MC was monitored periodically during this drying step by a moisture tester (AM 5200, Perten Instruments,
Hägersten, Sweden). After conditioning the rice to the set MC levels, the rice samples were immediately
stored in individual quart-sized, glass containers (mason jars) to prevent significant alterations of their
initial MCs and then transported to five separate temperature environments 10°C, 15°C, 20°C, 27°C and
40°C. The chosen environments consisted of a combination of three Parameter Generation and Control
(PG&C, Black Mountain, NC)) units, including one PG&C unit maintaining the environment of a walk-in
equilibrium moisture content (EMC) chamber, one walk-in refrigerator and, one incubator (BINDER Inc.,
Bohemia, NY). The jars were stored for a period of 16 weeks and sampled every two weeks except after
week 12, when the rice samples were stored for a continuous period of four weeks. The same sampling
protocol was followed during 2015. A total of 56 jars (4 MC × 2 cultivars × 7 storage durations) were
placed in each of the environmental units, resulting in a total of 280 experimental units for each of the two
years. The experimental design is illustrated by table 2.1.
Table 2.1. Conceptual illustration of the experimental design for enumerating mold counts on HLG rice cultivars. The experiment was set up as a full-factorial design with Week 0 and MC = 12.5% serving as
the controls.
Year Cultivar Moisture Content
(% wet basis)
Temperature
(°C)
Storage
Duration
1 CL XL745 12.5 10 Week 0
XL753 16 15 Week 2
2 CL XL745 19 20 Week 4
XL760 21 27 Week 6
40 Week 8
Week 10
Week 12
Week 16
Temperature Monitoring
The temperature of the chosen storage environments was monitored by placing two temperature
sensors (HOBOTM
Pro v2, Onset Computer Corp., Bourne, MA) in each of the five environmental units.
These sensors recorded the temperature every 5 minutes throughout the storage period.
Moisture Content Measurement
To determine the rice sample MC, the HLG RR stored in jars was removed from the storage
environments and placed at room temperature conditions where they were allowed to equilibrate for at
least 24 hours before removing samples for MC determination. The MC of each sample was measured in

28
duplicate by placing a 15 g sample into a 130°C convective oven (Shellblue, Sheldon Mfg., Inc.,
Cornelius, OR) for 24 hours followed by cooling in a desiccator for at least half an hour (Jindal and
Siebenmorgen, 1987). The measured MC values were within 1.5 percentage point of the set value. Table
2.2. provides the MC values obtained using the oven method.
Table 2.2. Difference between moisture content values set during the design stage and the actual, experimentally-measured oven moisture content (OMC) values wet basis (w.b.)
Year Cultivar Oven Moisture Content (% OMC w.b.)
Set value for
Moisture Content
(% MC w.b.)
12.5 16 19 21
2014 CL XL 745 12.7 16.3 19.1 21.3
XL753 12.4 16.7 20.6 21.6
2015 CL XL 745 12.4 16.3 19.6 21.1
XL 760 12.2 16.4 20.2 21.7
Water Activity Measurement
The water activity for the 2015 cultivars (CL XL745 and XL760) was measured using a water activity
meter (AquaLab Pre, Decagon Devices, Pullman, WA). The measurements were performed in duplicate.
Figure 2.1. provides the linear regression for the measured water activity and MC (R2
= 0.965). Since the
correlation between water activity and MC is strong, trends and analysis are presented using MC.
29
Figure 2.1. Relationship between water activity (aw) and measured moisture content for rough rice
samples conditioned to set moisture contents = 12.5%, 16%, 19% and 21% and stored over a period of
16 weeks at temperatures = 10°C, 15°C, 20°C, 27°C and 40°C for cultivars (a) CL XL745 and (b) XL760
for the year 2015.
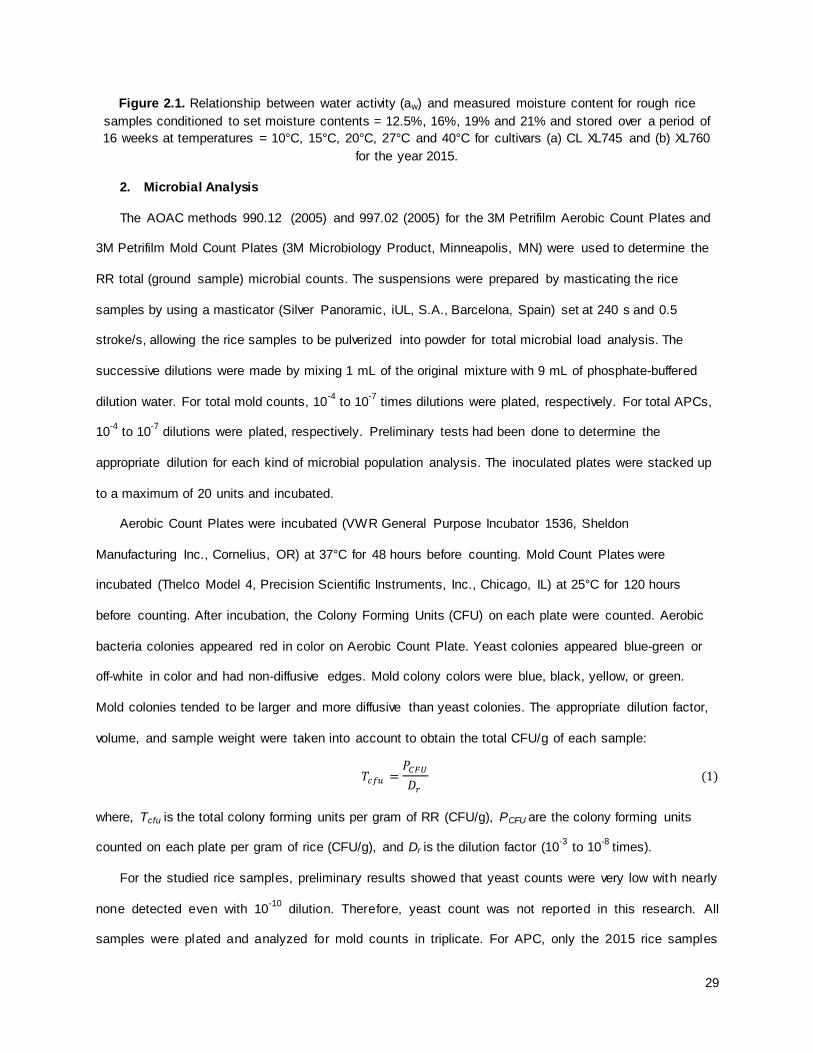
2. Microbial Analysis
The AOAC methods 990.12 (2005) and 997.02 (2005) for the 3M Petrifilm Aerobic Count Plates and
3M Petrifilm Mold Count Plates (3M Microbiology Product, Minneapolis, MN) were used to determine the
RR total (ground sample) microbial counts. The suspensions were prepared by masticating the rice
samples by using a masticator (Silver Panoramic, iUL, S.A., Barcelona, Spain) set at 240 s and 0.5
stroke/s, allowing the rice samples to be pulverized into powder for total microbial load analysis. The
successive dilutions were made by mixing 1 mL of the original mixture with 9 mL of phosphate-buffered
dilution water. For total mold counts, 10-4
to 10-7
times dilutions were plated, respectively. For total APCs,
10-4
to 10-7
dilutions were plated, respectively. Preliminary tests had been done to determine the
appropriate dilution for each kind of microbial population analysis. The inoculated plates were stacked up
to a maximum of 20 units and incubated.
Aerobic Count Plates were incubated (VWR General Purpose Incubator 1536, Sheldon
Manufacturing Inc., Cornelius, OR) at 37°C for 48 hours before counting. Mold Count Plates were
incubated (Thelco Model 4, Precision Scientific Instruments, Inc., Chicago, IL) at 25°C for 120 hours
before counting. After incubation, the Colony Forming Units (CFU) on each plate were counted. Aerobic
bacteria colonies appeared red in color on Aerobic Count Plate. Yeast colonies appeared blue-green or
off-white in color and had non-diffusive edges. Mold colony colors were blue, black, yellow, or green.
Mold colonies tended to be larger and more diffusive than yeast colonies. The appropriate dilution factor,
volume, and sample weight were taken into account to obtain the total CFU/g of each sample:
where, Tcfu is the total colony forming units per gram of RR (CFU/g), PCFU are the colony forming units
counted on each plate per gram of rice (CFU/g), and Dr is the dilution factor (10-3
to 10-8
times).
For the studied rice samples, preliminary results showed that yeast counts were very low with nearly
none detected even with 10-10
dilution. Therefore, yeast count was not reported in this research. All
samples were plated and analyzed for mold counts in triplicate. For APC, only the 2015 rice samples

30
were plated, for up to 8 weeks; after 8 weeks, the counts were too low to detect using the previously
described dilutions.
3. Data Fitting for Kinetic Growth Models
Five microbial growth models - Buchanan three-phase linear, Gompertz, Richards, Weibull and
Baranyi – were identified from literature and modified to predict mold counts. The models were fit to the
natural log of experimental mold counts using the non-linear platform on JMP Pro 12 (SAS Institute Inc.,
Cary, N.C.).
Table 2.3. Modified Buchanan Three-Phase Linear, Modified Gompertz, Modified Richards, Modified Weibull and Modified Baranyi Equations used to fit experimental mold counts (natural log, CFU/g)
Mathematical Model Equation
Buchanan Three-Phase Linear
Gompertz
Richards
{ }
Weibull
Baranyi
⌊ ( ) ⌋
( ( )
)
Where,

31
D. Results and Discussion
1. Statistical Analysis
Linear and non-linear regression, analysis of variance, Student’s t test (least significant difference
test), and the Tukey HSD tests were performed with statistical software (JMP version 12.0.0, SAS
Institute Inc., Cary, N.C.) to determine significant differences within and among sample means. Level of
significance (α) was set at 5% for comparing means of APC and mold counts. Table 2.4. gives the P
values and degrees of freedom (df) associated with the three factors involved in the study tracking mold
counts and APC found on the stored RR samples.
Table 2.4. Summary of the P values from analysis of variance for the effect of storage duration, temperature and moisture content by cultivar mold counts (2014, 2015) and aerobic plate counts (2015).
Prob > F Prob > F
MOLD COUNTS APC COUNTS
Factor 2014 2015 2015
df CL XL 745 XL753 CL XL 745 XL 760 df CL XL 745 XL 760
Moisture Content (MC% w .b.)
3 <.0001 <.0001 <.0001 <.0001 3 0.0920 <0.2187
Storage duration (number of w eeks)
7 <.0001 <.0001 <.0001 <.0001 4 <.0001 <.0001
Temperature 4 0.0036 0.2822 <.0001 <.0001 4 <.0001 <.0001
Frequency Distribution of Microbial Loads by Cultivar and Year
Mold Counts
For Year 1, the overall mean value of mold counts for the CL XL745 (2014) samples was M = 6.01,
SD = 0.82 and for XL753 (2014) was M = 6.16, SD = 0.76 log10 CFU/g. Whereas, for Year 2, overall mean
of the mold counts (log10 CFU/g) for the CL XL745 (2015) samples was M = 5.72, SD = 0.77 and for
XL760 (2015) was M = 5.94, SD = 0.78. The mean values for the two years were significantly different (p

32
< 0.001, for two-tailed t-test, assuming unequal variances). Within each year, the mold counts for the two
cultivars - CL XL745 and XL753 for 2014 - and - CL XL745 and XL760 for 2015 - were also significantly
different from each other (p=0.0034(2014) and p < 0.001(2015) for two-tailed t-test, assuming unequal
variances). Therefore, further analyses are separated by cultivar type and year.
The medians of the samples for year 1 were slightly lower than the corresponding means, 5.87 and
5.95 log10 CFU/g for CL XL745 (2014) and XL753 2014), respectively. The same trend was observed for
the median values for year 2 cultivars. The median for CL XL745 (2015) was 5.60 log10 CFU/g and for
XL760 (2015) the median value was 5.70 log10 CFU/g. Figure 2.2.(a), (b), (c) and (d) provide histograms
displaying the frequency distribution of mold counts (log10 CFU/g) for CL XL745 (2014), XL753 (2014), CL
XL745 (2015) and XL760 (2015) respectively.
From figure 2.2.(a) and (b), it was noted that nearly 80% of the CL XL745 and XL753 samples were
between 5 and 7 log10 CFU/g for year 1 (2014) with the mold counts ranging from 4.0 to 8.5 log10 CFU/g.
The range for sets of samples for 2014 was over 4 log10 CFU/g, which means that there were 104
times
more colony forming units in the sample with the most mold growth as compared to the sample with the
least mold growth. Figure 2.2.(c) and (d) plots the range of mold counts for year 2015 (year 2). The range
for year 2 samples was lower than the range for the year 1 samples - from 4.0 to 7.5 log10 CFU/g, with
about half of the samples having mold counts between 5.0 and 6.0 log10 CFU/g.
(a) CL XL745 (2014)

33
(b) XL753 (2014)
(c) CL XL 745 (2015)
(d) XL760 (2015)
Figure 2.2. Frequency distribution for mold counts (log10 CFU/g) detected over a storage period of 16
weeks for rough rice moisture contents = 12.5%, 16%, 19% and 21% and temperatures = 10°C, 15°C, 20°C, 27°C and 40°C for cultivars (a) CL XL745, (b) XL753, (c) CL XL745 and (d) XL760 during the years
2014 and 2015.
Aerobic Plate Counts
The APC analysis was performed solely for the year 2 (2015) samples. The log10 of the overall mean
APC for cultivar CL XL745 (2015) was M = 7.27, SD = 0.76 CFU/g; for cultivar XL760 (2015) the log10 of
the overall mean was M = 7.47, SD = 0.63. The overall mean APC for XL760 was found to be significantly

34
higher (p<0.0001, for two-tailed t-test, assuming unequal variances) than the overall mean APC for CL
XL745. The median values of APC for both cultivars were slightly higher than the corresponding means,
7.54 and 7.61 log10 CFU/g for CL XL745 (2015) and XL760 (2015), respectively. Figure 2.3.(a) and (b)
depict the frequency distribution of APC (log10 CFU/g) for cultivars CL XL745 (2015) and XL760 (2015)
respectively. From figure 2.3.(a) and (b), it was noted that APC distribution even with the log10 transform,
is negatively skewed for both cultivars. Nearly 80% of the CL XL745 and 85% XL760 samples have APC
values over 7 log10 CFU/g. These APC values provide a measure for the prevalence and trends of
bacteria on stored RR.
(a) CL XL745 (2015)
(b) XL760 (2015)
Figure 2.3. Frequency distribution for aerobic plate counts (log10 CFU/g) detected over a storage period
of 8 weeks for rough rice stored at moisture contents = 12.5%, 16%, 19% and 21% and temperatures = 10°C, 15°C, 20°C, 27°C and 40°C for cultivars (a) CL XL745 and (b) XL760 in the year 2015.
2. Factors Affecting Microbial Growth Kinetics
Mold Counts
Initial Mold Counts

35
The mean of initial mold counts for CL XL745 (2014) was M = 5.97, SD = 0.13 log10 CFU/g, whereas
the mean of initial mold counts for the same cultivar, CL XL745 (2015), for the second year was M = 5.68,
SD = 0.07 log10 CFU/g. Cultivar XL753 (2015) had the highest mean of initial mold load - M = 6.0, SD =
0.25 log10 CFU/g; the XL760 (2015) cultivar had the lowest mean for initial mold counts, M = 5.61, SD =
0.11 log10 CFU/g. The initial mold counts on HLG rice for Year 1 (2014) were significantly higher
(p<0.001) than the counts obtained for Year 2 (2015). These initial microbial loads affected the mold
growth profiles and trends.
Moisture Content
The difference between the mold counts detected for the different MC levels for each of the two rice
cultivars studied over the two years was significant (table 2.5.). The standard deviations for these means
were relatively high because the data encompasses the range of storage durations and temperature
conditions for the entire experiment. For the two cultivars studied in each of the two years, the mold
counts for the two lower MC levels are significantly lower than the two higher MC levels (p<0.0001 for
both). Additionally, for cultivar CL XL745 (2014), the mold counts for MC = 21.3% is significantly higher
than MC = 19.1%. Also, the mold counts for MC = 21.6% were significantly higher than MC = 20.6% for
cultivar XL753 (2014). Conversely, for cultivar CL XL745 (2015), no difference was detected between the
mold counts for MC = 19.7% and MC = 21.1%, and between the mold counts for MC = 21.7% and MC =
20.2% for cultivar XL760 (2015). For all cultivars, a direct relationship between mold counts and MC was
observed – as the MC level increased, the mold counts increased.
Table 2.5. Mean values of mold counts for rough rice stored at different moisture content levels for the cultivars studied for each year. Mean values differing by a lower case letter are significantly different at α = 0.05 using the Tukey HSD test for means at differing moisture content levels (% wet basis, w.b.); Mean
values differing by an upper case letter, across a row are significantly different at α = 0.05 using the Tukey HSD test for means at different cultivar-year combinations.
Set value for Moisture Content
(% MC w.b.)
2014 2015
CL XL 745 XL753 CL XL 745 XL 760
21 6.78a, A
6.68a, A
6.19a, B
6.72a, A
19 6.08b, B
6.44b, A
6.04a, B
6.31b, A
16 5.62c, B
5.82c, A
5.30b, C
5.36c, C
12.5 5.55d, A
5.68d, A
5.34b, B
5.37c, B

36
Storage Duration
The effect of storage duration on mold counts was studied after separating the MC levels into two
levels – LOW for MC≤17% and HIGH for MC>17%. Figure 2.4. gives twenty separate line graphs for each
cultivar studied, separated by year, showing the distribut ion of mold counts (log10 CFU/g) (y-axis) over the
storage duration of 16 weeks (x-axis). For the LOW MC level, the mold counts did not fluctuate
significantly – staying either close to the initial mold counts or decreasing slightly as storage duration
increased. For the HIGH MC level, as seen from figure 2.4., the growth curves depicting the effect of
storage duration on mold counts (log10 CFU/g) follow a similar pattern observed for microbial growth
curves. The curves can be divided into three major categories – the lag phase, the exponential growth
phase and the decay phase (figure 2.5.). During the lag phase, the mold counts remain almost the same
as the initial mold counts. The exponential growth phase is characterized by a near linear increase in
mold counts (log10 CFU/g). Finally, the decay phase is the stage when the mold counts begin to decline.
The start and end-points of each of these three phases varied depending on cultivar-year combination,
MC level and temperature.

37
Figure 2.4. Mold counts (log10 CFU/g) detected over a storage period of 16 weeks for rough rice moisture
contents = LOW (≤17%) and HIGH (>17%) and temperatures = 10°C, 15°C, 20°C, 27°C and 40°C for cultivars CL XL745 (2014), CL XL745 (2015), XL753 and XL760 (2014).
Figure 2.5. Typical microbial growth curve (McKellar and Lu, 2003).
Log
10
cell
num
bers
Time

38
Temperature
The effect of temperature on mold counts was highly dependent on the storage MC and the initial
mold loads on the HLG RR. As listed in table 2.5, the low MC samples (MC≤17%), no significant
differences were observed between the mold counts for T = 10°C, 15°C and 20°C for all four cultivar-year
combinations; on the contrary, for all four cultivar-year combinations, the mold counts for the 40°C were
significantly lower than the other four temperatures. For the high MC samples (MC>17%), cultivar CL
XL745, both years, no significant differences were observed for mold counts at different temperatures –
except for the CL XL745 (2015) 40°C samples, where the mold counts were significantly lower than the
mold counts for the other temperatures. For the remaining two lots, XL753 (2014) and XL760 (2015), the
trends observed were more complex; the average mold counts for the two cultivars are provided in table
2.6.
Table 2.6. Mean values of log10CFU/g mold counts on rough rice stored at different temperatures for the
rice cultivars studied in 2014 and 2015..Mean values differing by a lower case letter are significantly
different at α = 0.05 using the Tukey HSD test for means at differing temperature levels; Mean values
differing by an upper case letter, across a row are significantly different at α = 0.05 using the Tukey HSD test for means at different cultivar-year combinations.
Moisture Content
Level
Temperature
(°C)
CL XL 745
(2014)
CL XL 745
(2015)
XL753
(2014)
XL 760
(2015)
Low 10 5.68a, A 5.51a, B 5.93a, A 5.56a, B
15 5.78a, A 5.50a, B 5.88a, A 5.57a, B
20 5.73a, B 5.52a, BC 5.82a, A 5.51a, C
27 5.43b, A 5.23b, B 5.67ab, A 5.20b, B
40 5.29b, A 4.84c, B 5.51b, A 4.87c, B
High 10 6.13a, A 6.29a, A 6.09b, A 6.36bc, A
15 6.52a, A 6.20a, A 6.37ab, A 6.57ab, A
20 6.49a, AB 6.22a, A 6.41ab, AB 6.67ab, B
27 6.44a, AB 6.21a, A 6.70a, A 6.77a, A
40 6.43a, A 5.65b, B 6.64a, A 6.19c, A
Aerobic Plate Counts
Initial APC
The initial aerobic bacteria load in terms of APC for the two rice cultivars studied were significantly
different (p < 0.001, for two-tailed t-test, assuming unequal variances). The mean of initial APC for CL

39
XL745 (2015) (M = 7.82, SD = 0.07 log10 CFU/g) was significantly higher than the mean of initial XL760
(2015) (7.62, SD = 0.14 log10 CFU/g). The initial APC values did not affect overall trends for the range of
storage durations, temperatures and MC levels studied.
Temperature and Moisture Content
The effect of temperature on APC was highly dependent on the storage MC and storage duration of
the HLG RR, however, overall as storage temperature increased APC decreased. As listed in table 2.7.,
for the 12.5% MC samples for both cultivars, no significant differences were observed between the APC
values for T = 10°C, 15°C, 20°C and 27°C but the APC values for the 40°C were significantly lower than
the other four temperatures. For the high MC samples (19 and 21%), the APC generally decreased as the
temperature increased. Overall, no significant differences were detected between APC for the four
different MC levels for both cultivars.
Table 2.7. Mean values of log10CFU/g aerobic plate counts (APC) on rough rice at for different storage
temperatures for the cultivars studied in 2015. Mean values differing by a lower case letter are
significantly different at α = 0.05 using the Tukey HSD test for means at differing temperature levels;
Mean values differing by an upper case letter, across a row are significantly different at α = 0.05 using the Tukey HSD test for at differing moisture content levels (% wet basis, w.b.).
CL XL745 (2015)
Temperature (°C)
12.5 16 19 21
10 7.62a, B
7.73ab, B
7.74a, A
7.69a, A
15 7.57a, B
7.38ab,B
7.55a, A
7.48ab, A
20 7.66a, B
7.93a, B
7.25ab, A
7.29ab, A
27 7.62a, B
7.23b, B
6.80b, A
6.92bc, A
40 6.46b, C
6.21c, BC
6.62b, AB
6.65c, A
XL760 (2015)
10 7.68a, C
7.83a, C
7.85a, B
7.80a, A
15 7.81a, C
7.78a, C
7.67a, B
7.68a, A
20 7.76a, B
7.72a, B
7.56ab, A
7.04b, A
27 7.61a, C
7.54a, C
7.26bc, B
6.99b, A
40 6.81b, C
6.50b, C
7.10c, B
7.30ab, A
Storage Duration
Ten distinct line graphs in figure 2.6. depict the relationship between APC (y-axis) and storage
duration (x-axis) for each cultivar studied. As seen in figure 2.6., APC was highly dependent on
temperature, storage duration and MC and the three-way interaction between these three terms was

40
significant (p<0.001). For the lower two temperatures (10°C and 15°C), the APC did not fluctuate
significantly – generally staying either close to the initial APC for the eight-week storage duration. For the
two high storage temperatures (27°C and 40°C), overall, APC decreased as the storage duration
decreased; the trend varied considerably depending on MC. For the storage temperature 20°C, the trend
observed over storage varied depending on MC level.
Figure 2.6. Aerobic Plate Counts (log10 CFU/g) detected for rough rice during a storage over a period of 8 weeks for moisture contents = 12,5, 16, 19 and 21% and temperatures = 10°C, 15°C, 20°C, 27°C and
40°C for cultivars XL753 (2015) and XL760 (2015).
3. Kinetic Models for Mold Counts
A paper written by Lopez et al (2004) compared the statistical robustness of several previously
published mathematical functions describing microbial growth. The paper included 21 growth curves for
different fungal and bacterial species but expressed the growth in terms of optical density units. The study
recommended five models that were chosen for this study – Buchanan three-phase linear, Gompertz,
Richards, Weibull and Baranyi. The models were modified to include a dimensionless parameter
accounting for the change in growth kinetics depending on storage temperature. For the purpose of this
study, the models were adopted to predict mold counts (table 2.3.).
41
The first model, Buchanan three-phase linear model was developed by Buchanan et al (1997) and
describes three growth phases: the lag phase, exponential growth phase and stat ionary phase as
illustrated in figure 2.5. (McKellar and Lu, 2003). The Gompertz equation is the most frequently used
sigmoidal function to describe microbial growth (McKellar and Lu, 2003). The other three models –
Richards, Weibull and Baranyi – are also commonly used to describe microbial kinetics in literature
(Lopez et al., 2004).
4. Model Comparison
Figure 2.6. shows a plot comparing the fit of all five models for cultivar CL XL745 (2015) at MC =
21% for 20°C and 27°C to illustrate the relative abilities of the models to predict experimentally measured
mold counts. For this particular combination of MC, temperature and cultivar, the three phases – the lag
phase, the exponential growth phase and the decay or death phase can be observed clearly. A similar
trend was observed for the other three cultivar-year combinations (CL XL745 (2014), CL XL753 and
XL760) for the two high MC set points – 19% and 21%, although some combinations lacked the lag
phase or the death or decay phase (Figure 2.4.). The mold counts for the lower MC levels, 12.5% and
16%, either remained relatively constant or declined over the storage duration; the prediction models
simulated this trend well.
First, the fitted Baranyi, fitted Weibull, fitted Gompertz, fitted Richards and fitted Buchanan models
were estimated for each storage temperature, hence generating 5 sets of parameters (a, rmax, tlag for each
storage temperature). The parameter a was included in every model as a dimensionless parameter to
account for the change in trend behavior due to each temperature. The effect of MC and cultivar-year
combination is accounted for in the initial and maximum mold count parameters L0 and Lmax used in the
modified equations because both MC and mold counts are directly correlated. The parameter rmax
represents the maximum rate of mold growth in terms of CFU/g per week and lastly, t lag is the parameter
that defines the time, in weeks, the mold counts stay constant and do not fluctuate.
Next, the Weibull, Gompertz, Baranyi, Richards and Buchanan were fitted over the entire
temperature range and therefore, only generated one set parameters (a, rmax, tlag over the entire
temperature range). Therefore, for the second simulation, the parameter a did not change in value for the
different temperatures. Except for Buchanan and Richards, all equations had R2
higher than 0.6 for

42
temperatures 15°C, 20°C and 27°C. Most models performed worse for the two extreme temperatures
10°C and 40°C. From the R2
values in table 2.8., the fitted Gompertz model performed best at 20°C and
27°C. However, over the entire temperature range, the Baranyi model gives the best overall predictions
followed by the fitted Weibull model (table 2.9.). Table 2.9. gives the parameter estimates for the Modified
Baranyi and Weibull equations.
Figure 2.6. Comparison of the model fit for the modified kinetic models - fitted Richard, Weibull, Baranyi,
Gompertz and Buchanan – with the experimental mold counts (natural log, CFU/g) for rough rice (cultivar CL XL745 (2015)) at moisture content = 21% for temperatures = 20°C and 27°C stored for 16 weeks.
Table 2.8. R2
values for Modified Buchanan Three-Phase Linear, Modified Gompertz, Modified Richards,
Modified Weibull and Modified Baranyi Equations used to fit experimental mold counts (natural log, CFU/g)
R2
values
Temperature (°C)
Predictor 10 15 20 27 40
Fitted Baranyi 0.71 0.69 0.71 0.74 0.68
Fitted Weibull 0.69 0.71 0.72 0.73 0.64
Fitted Gompertz 0.48 0.65 0.73 0.76 0.68
Weibull 0.57 0.65 0.7 0.7 0.57
Gompertz 0.49 0.62 0.7 0.76 0.63
Baranyi 0.53 0.65 0.69 0.7 0.62
Fitted Buchanan 0.54 0.83 0.71 0.76 0.35
Fitted Richards RCH 0.44 0.62 0.71 0.74 0.64
Richards RCH 0.44 0.6 0.69 0.74 0.6
Buchanan 0.44 0.36 0.41 0.28 0.29

43
Table 2.9. Parameter estimates for Modified Baranyi and Modified Weibull Equations used to fit experimental mold counts (natural log, CFU/g)
Temperature (°C) a rmax tlag
Baranyi
10 0.91 0.42 3.45 15 0.89 0.58 2.29 20 0.89 0.66 1.8 27 0.94 1.73 1.2 40 0.84 1.07 2.33
Temperature (°C) a r k
Weibull
10 0.97 0.1 1.13 15 0.97 0.22 0.27 20 0.96 0.68 0.33 27 0.93 0.62 3.06 40 0.9 0.42 1.46
E. Conclusions
The goal of this study was to simulate conditions of delayed drying and prolonged storage of RR and
to characterize mold growth on HLG RR. The study characterized the growth of mold on HLG rice
cultivars CL XL745, XL753 and XL760 over a storage period of 16 weeks for RR at four MC levels
(12.5%, 16%, 19% and 21%) and five temperatures (10°C, 15°C, 20°C, 27°C and 40°C). The findings
from the study provide baseline information which is very helpful in modeling kinetics of microbial growth
during rice storage.
The initial mold counts for Year 1 (2014) HLG rice cultivars were significantly higher than the
initial mold counts for HLG rice cultivars obtained for Year 2 (2015).
The initial microbial load detected on the HLG RR affected the mold growth profiles and trends
significantly.
The overall mean value of the log10 CFU/g for the CL XL745 (2014) samples was M = 6.0, SD =
0.87 and for XL753 (2014) was M = 6.15, SD = 0.78. Whereas, overall mean of mold counts
(log10 CFU/g) for the CL XL745 (2015) samples was M = 5.7, SD = 0.77 and for XL760 (2015)
was M = 5.9, SD = 0.80.
For all cultivars, a direct relationship between mold counts and MC was observed – as the MC
level increased, the mold counts increased.
More complex trends were observed for the effect of temperature and the duration of storage on

44
mold growth.
Microbial growth equations: the Fitted Baranyi, fitted Weibull, fitted Gompertz, fitted Richards and
Fitted Buchanan models were successfully modified to estimate kinetics of mold growth.
The Baranyi and Weibull equations performed the best (R2>0.64) over the temperature range of
10°C to 40°C.
The information may be useful to guide decisions on drying and storage conditions, especially of
HLG rice cultivars, to avoid mold growth leading to mycotoxin contamination.
In summary, this study finds that long-grain, hybrid RR may be stored at low MC levels (<17% w.b.)
and moderate temperatures (30<C) for up to six weeks without any change in the mold growth profile.
However, storing RR at high MC (>17% w.b.) for more than eight weeks, especially at higher
temperatures (30>C) should be avoided. Microbial growth equations could be modified and used to
predict mold growth kinetics.
F. References
Atungulu, G. G., Zhong, H., & Siebenmorgen, T. J. (2014). Microbial population on freshly -harvested rice
and factors affecting prevalence. ASABE Paper No. 141914312. St. Joseph, Mich.:ASABE.
Atungulu, G. G., Zhong, H., Thote, S., Okeyo, A., & Couch, A. (2015). Microbial prevalence on freshly -
harvested long-grain pureline, hybrid, and Medium-grain rice cultivars. Applied Engineering in Agriculture, 31(6), 949-956.
Buchanan, R., Whiting, R., & Damert, W. (1997). When is simple good enough: A comparison of the gompertz, baranyi, and three-phase linear models for fitting bacterial growth curves. Food Microbiology, 14(4), 313-326.
Bullerman, L. B., & Bianchini, A. (2009). Food safety issues and the microbiology of cereal and cereal products. In N. Heredia, I. Wesley & S. Garcia (Eds.), Microbiologically safe foods (pp. 315--336).
Hoboken, New Jersey: John Wiley & Sons.
Christensen, C. M., & Meronuck, R. A. (1986). Quality maintenance in stored grains and seeds U of
Minnesota Press.
Fact Sheet for Food Processors: Aerobic plate count (2002). State of Wisconsin Department of
Agriculture, Trade and Consumer Protection Division of Food Safety.
FDA. (2001). Bacteriological analytical manual chapter 3 aerobic plate count . Retrieved from
http://www.fda.gov/Food/FoodScienceResearch/LaboratoryMethods/ucm063346.htm.
Frazier, W., & Westhoff, D. (1967). Food microbiology mc graw-hill book company. Nova York , NY, 252-
282.
Gompertz, B. (1825). On the nature of the function expressive of the law of human mortality, and on a
new mode of determining the value of life contingencies. Philosophical Transactions of the Royal Society of London, 115, 513-583.

45
Harein, P., & Meronuck, R. (1995). Stored grain losses due to insects and molds and the importance of proper grain management. Stored Product Management, 29-31.
Jayas, D. S., White, N. D., & Muir, W. E. (1994). Stored-grain ecosystems CRC Press.
Jindal, V., & Siebenmorgen, T. (1987). Effects of oven drying temperature and drying time on rough rice moisture content determination. Trans.ASAE, 30(4), 1185-1192.
Lacey, J., & Magan, N. (1991). Fungi in cereal grains: Their occurrence and water and temperature relationships. Developments in Food Science (Netherlands),
Lake, R., Hudson, A., & Cressy, P. (2004). Risk profile: Bacillus spp. in rice. (No. Client Report FW0319). Christchurch, New Zealand: Institute of Environmental Science & Research.
Lee, S. (1999). Low-temperature damp corn storage with and without chemical preservatives (Masters).
McKellar, R. C., & Lu, X. (2003). Modeling microbial responses in food CRC Press.
Misra, A. K., & Vir, D. (1991). Assessment of losses due to discoloration of paddy grains. Indian J. Mycology Plant Pathology (India).
Mutters, R. G., & Thompson, J. F. (2009). Rice quality handbook UCANR Publications.
Nalley, L. L., Dixon, B. L., Brye, K., Rogers, C. W., Myrteza, H., & Norman, R. J. (2014). Estimating cultivar effects on water usage and greenhouse gas emissions in rice production. Agronomy J., 106(6), 1981-1992.
Official Methods of Analysis of AOAC INTERNATIONAL (2005) 18th Ed., AOAC INTERNATIONAL, Gaithersburg, MD, USA, Official Method 997.02. Yeast and Mold Counts in Foods.
Official Methods of Analysis of AOAC INTERNATIONAL (2005) 18th Ed., AOAC INTERNATIONAL, Gaithersburg, MD, USA, Official Method 990.02, Aerobic Plate Count in Foods.
Phillips, S., Widjaja, S., Wallbridge, A., & Cooke, R. (1988). Rice yellowing during post-harvest drying by aeration and during storage. J. Stored Prod. Res. 24(3), 173-181.
Ranalli, R., & Howell, T. (2002). Effects of storage conditions on the total aerobic and Yeast/Mold bacterial counts of rough rice during On‐farm storage. Journal of Food Science, 67(2), 807-810.
Reed, C., Doyungan, S., Ioerger, B., & Getchell, A. (2007). Response of storage molds to different initial moisture contents of maize (corn) stored at 25 C, and effect on respiration rate and nutrient composition. Journal of Stored Products Research, 43(4), 443-458.
Richard, J., Payne, G., eds, Desjardins, A., Maragos, C., Norred, W., & Pestka, J. (2003). Mycotoxins: Risks in plant, animal and human systems. CAST Task Force Report, 139, 101-103.
Sahay, M., & Gangopadhyay, S. (1985). Effect of wet harvesting on biodeterioration of rice. Cereal Chemistry, 62(2), 80-83.
Singaravadivel, K., & Raj, S. A. (1983). Changes in parboiled rough rice caused by improper drying and microbial infection. J. Food Biochem. 7(1), 15-21.
Skyrme, D. S., Marks, B. P., Johnson, M. G., & Siebenmorgen, T. J. (1998). Distribution of total aerobic and coliform bacterial counts among rice kernel components. J. of food sci, 63(1), 154-15.
Ueda, S., & Kuwabara, Y. (1988). The ecological study of Bacillus cereus in rice crop processing (2): On the contamination of B. cereus in unhulled, unpolished and polished rice during the process of rice
(English summary). J. Antifung. Agents, 16, 115-120.

46
USDA. (2006) Grain fungal diseases and mycotoxin reference. (Reference). Washington, D.C. 20250-3630: United States Department of Agriculture Grain Inspection, Packers and Stockyards
Administration Federal Grain Inspection Service.
Wang, J., Park, J. H., Choi, N. J., Ha, S. D., & Oh, D. H. (2016). Microbiological Analysis of Rice Cake
Processing in Korea. Journal of Food Protection,79(1), 157-162.
Wawrzyniak, J., Ryniecki, A., & Gawrysiak‐Witulska, M. (2013). Kinetics of mould growth in the stored
barley ecosystem contaminated with aspergillus westerdijkiae, penicillium viridicatum and fusarium poae at 23–30° C. Journal of the Science of Food and Agriculture, 93(4), 895-901.

47
Chapter 3
IV. Dry Matter Loss for Hybrid Rough Rice Stored under Reduced Oxygen Conditions
A. Abstract
Two long-grain hybrid rice cultivars, CL XL745 and XL760 harvested in the year 2015 were stored in
rough rice (RR) form in sealed glass jars at moisture contents (MC) of 21%, 19%, 16%, and 12.5% (wet -
basis) at temperatures of 10°C, 15°C, 20°C, 27°C, and 40°C for a total of 16 weeks, with samples taken
at 2, 4, 6, 8, 10, 12, and 16 weeks of storage. To determine dry matter loss (DML), the two cultivars were
stored in sealed glass jars and DML was monitored by noting the difference in mass of RR before and
after storage. Statistical analysis on experimentally-collected DML data revealed no differences due to the
RR MC levels and temperature during the storage duration. The DML was only statistically different
based on RR cultivar. The experimental data was fitted to the DML equation developed by Seib et al
(1980). Dry matter loss (DML) constants for reduced oxygen storage conditions were found to be
significantly lower than the typical constants used in the literature for the equation by Seib et al (1980) to
estimate DML during storage of long-grain rice. The study findings are useful in guiding the rice industry
on making decisions regarding storage conditions for hybrid rice to prevent DML during storage.
B. Introduction
Mold contamination poses a risk to the quality of harvested rice that can result in significant economic
losses. Not only does mold growth cause objectionable odors, but may also result in discoloration of
kernels partly due to the heat produced during the respiration process (Dillahunty et al., 2000). During the
respiration process, the viable grain kernels, insects, molds and mites consume oxygen, and in turn,
produce carbon dioxide, water and heat (Bern et al., 2013; Suleiman et al., 2013). According to Hayma
(2003), the respiration rate is directly correlated to the MC of the grain; therefore, as the MC of grain
increases, the respiration rate also increases. Hence, for safe storage of grain, MC of the grain and of the
surrounding air temperature should be properly controlled (Hayma, 2003).
The process of respiration causes an increase in the grain temperature and can result in dry matter
loss (DML) of the stored grain (Lee, 1999). Dry matter refers to material remaining after removal of water,
and DML has been proposed as an indicator of the extent of grain deterioration in rough rice (RR)

48
(Chikubu, 1970; Sukabdi, 1979; Tangonan and Jindal, 1982). Researchers have previously used DML as
an index for corn quality deterioration; specifically, Saul and Steele (1966) and Steele et al (1969)
concluded that corn quality, when calculated as a percentage of mold-damaged kernels, could drop below
grade 2 if the DML exceeded 0.5% during storage and drying (Seitz et al., 1982). Elucidating similar
guidelines correlating DML to mold damage of RR can provide a simple and cost effective way of
monitoring quality characteristics of RR.
Based on their work studying the relationship between DML and the United States standard grade of
maize, Saul and Steele (1966) recommended that no more than 0.5% DML be allowed in order to
maintain the maize above U.S. No. 2 grade. Relating DML to the U.S grade for rice, Sukabdi (1979)
reported that the DML at which rice remained in good condition varied with grain MC (Naewbanij, 1985).
Sukabdi (1979) reported that medium grain RR (Brazos) at 22% MC lost up to 0.25% DML at 29.4°C
before falling below U.S. No. 2 grade, whereas long-grain rice (Lebonet) at 18% MC lost up to 0.5% DML
at 29.4°C before falling below U.S. No. 2 grade.
Grain deterioration is associated with respiration of both the grain and the accompanying
microorganisms (Naewbanij, 1985). Since it is generally assumed that carbohydrates are the main
substrates used by both molds and grain during the respiration process, grain deterioration can be
represented by the process of glucose oxidation as shown below (Seib, 1980):
C6H1206 + 6 02(g) → 6 C02(g) + 6 H20(l) + 2,833.4 Joules/g (1)
According to the equation given above and using a mass balance and molar masses, the breakdown
of 1 g of dry matter (C6H1206) by aerobic respiration uses 1.07 g of oxygen and releases 1.47 g of carbon
dioxide, 0.6 g of water, and 2833.4 J of heat energy; therefore, respiration rate is closely related to grain
DML and, consequently, global grain quality loss (Kaleta and Górnicki, 2013).
Mutters and Thompson (2009), in their book, The Rice Quality Handbook , mention that the quality of
rice once it is harvested is dependent on three factors – water activity, storage temperature and storage
duration. Water activity, also known as equilibrium relative humidity (ERH), is a measure of the unbound
water available in the grain that can precipitate microbial growth and spoilage (Mutters and Thompson,
2009). Though the concept of water activity and MC are similar, water activity in particular is dependent
on the temperature of the storage environment and only accounts for the water not bound to a component
49
of rice, and thus is a better indicator for correlating microbial growth. However, water activity of a
substance is a difficult parameter to control and many studies therefore use the MC as a set point to
monitor microbial activity.
According to Christensen and Lopez (1965), grain MC, temperature and storage duration are all
intimately related to the growth of molds in stored grain. This study utilized a lab-scale experimental set
up to monitor the effect of molds growing on hybrid, long-grain (HLG), RR that was conditioned to four
initial MC levels (12.5, 16, 19 and 21% wet basis (w.b.)) and stored in sealed glass quart jars at
temperatures ranging from 10°C to 40°C for a duration of sixteen weeks. The study endeavors to provide
useful information regarding kinetics of RR DML during different storage conditions. The results may help
determine the optimum timeframe and conditions for storage of hybrid rice to reduce the economic impact
caused by DML.
C. Materials and Methods
1. Samples
Freshly-harvested rice was procured from commercial rice fields. For the year 2015, HLG cultivars,
CL XL745 and XL760 were harvested from Running Lake Farms near Pocahontas, AR at approximately
22% MC w.b. in 2015. All MCs for this study are expressed on a wet basis (w.b.) unless otherwise stated.
The rice samples were then cleaned to remove chaff and foreign matter using a dockage tester (Model
XT4, Carter-Day, Minneapolis, MN) and then conditioned to four initial MC levels (12.5%, 16%, 19% and
21%) by placing the rice on a tarp at room temperature. The MC was monitored periodically during this
drying step by a moisture tester (AM 5200, Perten Instruments, Hägersten, Sweden). After conditioning
the rice to the set MC levels, the rice samples were immediately stored in individual quart-sized, glass
containers to prevent significant alterations of their initial MCs and then transported to five separate
temperature environments 10°C, 15°C, 20°C, 27°C and 40°C. The chosen environments consisted of a
combination of three Parameter Generation and Control (PG&C, Black Mountain, NC)) units, including
one PG&C unit maintaining the environment of a walk-in equilibrium moisture content (EMC) chamber,
one walk-in refrigerator and one incubator (BINDER Inc., Bohemia, NY). The samples were stored for a
period of 16 weeks and collected every two weeks except after week 12, when the rice samples were
stored for a continuous period of four weeks. A total of 56 jars (4 MC × 2 cultivars × 7 storage duration)

50
were placed in each of the environmental units, resulting in a total of 280 experimental units. The
experimental design is illustrated by table 3.1.
Table 3.1. Conceptual illustration of the experimental design for determining dry matter loss for hybrid,
long-grain rough rice. The experiment was set up as a full-factorial design with Week 0 and MC = 12.5% (wet basis) serving as the controls.
Cultivar Moisture Content
(% wet basis)
Temperature (°C) Storage
Duration
CL XL745 12.5 10 Week 0
XL760 16 15 Week 2
19 20 Week 4
21 27 Week 6
40 Week 8
Week 10
Week 12
Week 16
Temperature Monitoring
The temperature was monitored by placing two temperature sensors (HOBOTM
Pro v2, Onset
Computer Corp., Bourne, MA) in each of the five environmental units. These sensors recorded the
temperature every 5 minutes throughout the storage period. HOBOTM
sensors were placed inside mason
jars along with the RR (XL760 cultivar only) and data was collected for approximately 10 weeks. The
sensors provided temperature and relative humidity (RH%) readings every 5 minutes continuously over
the entire time period. The experimental design was as follows:
Table 3.2. Conceptual illustration of the experimental design for monitoring temperature and relative humidity (RH %) changes in rough rice cultivar XL760 by placing HOBO
TM sensors inside storage jars.
Moisture content (% wet basis)
Temperature (°C) 21.0 19.0 16.0 12.5
10 X
15 X
20 X X
27 X X
40 X X X X
Dry matter loss can be estimated by using the temperature and RH% from the HOBOTM
sensors as inputs
and the equations listed below. The equations were programmed into JMP Pro 12.
C6H1206 + 6 02(g) → 6 C02(g) + 6 H20(l) + 15.74 Joules/g of glucose (2)

51
(3)
[
]
(4)
where,
Rearranging (3)
(5)
Using the ideal gas law,
(6)
Multiplying both sides by molar mass of water, M, (18.01528 g/mol) and rearranging,
(7)
where,
(
)
(
)
(8)
Substituting (4) in (5),
(9)
Substituting (9) in (8),

52
[
]
(10)
Multiplying both sides by the volume of the storage container and accounting for porosity,
[
]
(11)
(12)
( )
Assuming the change in RH is caused due to water released by respiration:
(13)
[
]
(14)
where,
Using equation (2) as a mass balance and the input from equation 11 we can estimate grams of glucose
consumed,
(15)
where,
(
)

53
(
)
The grams of glucose consumed can provide an estimate of dry matter loss (DML).
Similarly, the grams of oxygen consumed and carbon dioxide released can also be estimated from the
mass balance.
Moisture Content Measurement
To determine the rice sample MC, the samples were removed from the storage environments and
placed at room conditions where they were allowed to equilibrate with room conditions before removing
samples for MC determination. The MC of each sample was measured by placing a 15 g s ample into a
130°C convective oven (Shellblue, Sheldon Mfg., Inc., Cornelius, OR) for 24 hours followed by cooling in
a desiccator for at least half an hour (Jindal and Siebenmorgen, 1987). The measured MC values were
within 1.5 percentage point of the set value. Table 3.3. provides the MC values obtained using the oven
method.
Table 3.3. Difference between moisture content values set during the experiment design stage and the actual, experimentally measured oven moisture content (OMC) values
Year Cultivar Oven Moisture Content (% OMC w et basis)
Set value for
Moisture Content
(% MC w.b.)
12.5 16 19 21
2015 CL XL 745 12.45 16.32 19.65 21.11
XL 760 12.24 16.45 20.18 21.68
Water Activity Measurement
The water activity for the 2015 cultivars (CL XL745 and XL760) was measured using a water activity
meter (AquaLab Pre, Decagon Devices, Pullman, WA). The measurements were performed in duplicate.
Figure 3.1. provided the linear regression for the measured water activity and MC (R2
= 0.965). Since the
correlation between water activity and MC is strong, trends and analysis are presented using MC.

54
Figure 3.1. Relationship between water activity (aw) and measured moisture content for rough rice
samples stored over a 16 week period conditioned to set moisture contents = 12.5%, 16%, 19% and 21%
and stored at temperatures = 10°C, 15°C, 20°C, 27°C and 40°C, for cultivars (a) CL XL745 and (b) XL760
for the year 2015.
2. Dry Matter Loss Calculation
For the 2015 HLG RR lots, CL XL745 and XL760, the mass of each jar was measured before and
after storage. The dry matter loss (DML) was assumed to be the difference in the mass measured before
and after storage. The constants (A, B, C and D) for the equation by Seib et al (1980) for long-grain RR
(table 3.4.) were compared to those generated by performing non-linear regression analyses on
experimental data. The DML equation used was:
where,
DML = dry matter loss, decimal
t = storage duration, h/1000
T = temperature, °C
M = moisture content, wet basis, decimal
A, B, C, and D are constants of the equation

55
Table 3.4. Constants adopted from Seib et al (1980) for the dry matter loss equation (Eq. 16) for rice.
Rice kernel type A B C D
Long-grain 0.00189 0.654 0.068 33.61
D. Results and Discussion
Seib et al (1980) used the evolution of carbon dioxide as an indicator to determine DML based on a
non-linear equation. The study found that RR stored at 18% MC dropped from U.S. Grade 1 to U.S.
Grade 2, a drop in one entire market grade, if DML exceeded 0.5% with the rice stored for 80 days under
aerated conditions (Seib et al., 1980). The DML predicted by Seib et al (1980) varied from approximately
0.25% to 2%. A study modeling the effect of MC and temperature on bunker-stored rice hypothesized that
rice stored in airtight or reduced oxygen conditions would result in lowering the respiration rate and
thereby decrease DML (Freer et al., 1989). The paper simulated bunker type storage conditions and
reported the DML by normalizing the data that is, by dividing by the highest DML value given by the
simulation - 2.5%. The estimation by Freer et al (1989) utilized the equation developed by Seib et al.
(1980).
For these experiments, two cultivars were stored in sealed glass jars and DML was monitored by
noting the difference in mass of RR before and after storage. Statistical analysis on experimentally
collected DML data revealed no differences between MC levels, temperature or storage duration. The
DML was only statically different based on cultivar. Therefore further analysis was only separated by
cultivar (figure 3.2.). The experimental data was fitted to the DML equation developed by Seib et al
(1980). Table 3.5. provided the DML constants obtained by performing non-linear regression for the
equation developed by Seib et al (1980) for the two cultivars studied in 2015. The constants developed
for this study provide DML estimates that are significantly lower than that predicted by the Seib et al
(1980) equation. This supports the hypothesis that DML would be significantly reduced due to the
suppression of respiration. Figure 3.2. provides a comparison of the estimates calculated by using the
equation developed by Seib et al (1980), experimentally measured DML (Measured DML) and the DML
estimate obtained by performing a non-linear regression on the experimental data.

56
Table 3.5. Dry matter loss (DML) equation constants developed for cultivar CL XL745 and XL760 using
non-linear regression for the DML equation developed by Seib et al in 1980. No significant differences
were noted between DML for differing temperature and moisture content levels at α = 0.05 using the
Tukey HSD test.
*Constants published in Seib et al (1980).
Figure 3.2. Comparison of Dry Matter Loss (DML) calculated by using the equation developed by Seib et
al (1980) for long-grain rice with non-linear regression and experimental data for rough rice samples over
a period of 16 weeks conditioned to moisture contents = 12.5%, 16%, 19% and 21% and stored at
temperatures = 10°C, 15°C, 20°C, 27°C and 40°C for cultivars CL XL745 and XL760 for the year 2015.
The incremental change in mass of carbon dioxide over time was calculated from the RH% and
temperature measurements obtained from HOBOTM
sensors placed inside jars as described in equation
(1) to (14). The rate of change in carbon dioxide mass for 12.5% MC RR was significantly different than
Cultivar Type
Parameters Long-grain
rice* CL XL745 XL760
A 0.0019 0.0010 0.0031
B 0.6540 0.3064 0.0842
C 0.0689 0.0201 - 0.0049
D 33.6100 9.7413 5.0168
SSE
0.0003 0.0015
RMSE
0.0016 0.0038

57
that for the other three MC levels, but there were no significant differences over the storage duration
(number of weeks). The change in carbon dioxide for the highest temperature (40°C) was significantly
higher than the change in carbon dioxide for 27°C, 20°C, 15°C and 10°C for RR at 21% MC. A study
examining the effect of MC on production of carbon dioxide for hermetically stored corn found a strong
positive relationship between MC and duration required for depletion of oxygen and reported DML of
0.59% for 20% MC and 0.74% for 22% MC after 75 days of storage at room temperature (Weinberg et al.,
2008). The highest DML estimated from the experimental measurements was 0.67%. DML is not used as
a sole metric for quality determination of rice, but clarifying the relationship between storage duration,
temperature and MC for bunker-like conditions could be a fast and effective way to screen rice quality.
Figure 3.3. Simulation of carbon dioxide (CO2) evolved due to rough rice respiration via non-linear
regression performed on experimental data for temperature and relative humidity (RH%). The rough rice
samples stored over a period of 10 weeks after being conditioned to set moisture contents = 12.5%, 16%,
19% and 21% (each panel) and stored at temperatures = 10°C, 15°C, 20°C, 27°C and 40°C (different
bars) for cultivar XL760 for the year 2015.

58
Dillahunty et al (2000) performed a study to characterize the effect of temperature and RR MC on the
respiration of RR and developed a model by combining the respiration of rice seeds and microbes to
predict changes in respiration in order to realistically simulate industry environments where microbes and
RR co-exist simultaneously. The study experimentally determined that the rate of respiration was
dependent on RR MC; for the highest MC% in the study, respiration reached its peak for temperatures
between 50°C to 70°C; the study also determined that the respiration rate increased exponentially for
MC≥15% (Dillahunty et al., 2000). The findings from this study were consistent with the observations
made by Dillahunty et al (2000). This consistency suggests that monitoring RH in closed systems, such
as hermetic storage, might be sufficient to provide information about respiration and DML.
E. Conclusion
This study developed parameters to characterize DML during storage of hybrid RR under reduced
oxygen conditions. The study utilized RH% and temperature data to model change in carbon dioxide
concentration. The DML was successfully modeled for two hybrid rice cultivars and the appropriate
constants to be used in an empirical model for DML estimation were generated. Also, a model relating RH
and temperature to change in the amount of carbon dioxide in a closed system was developed. DML is an
important quality parameter that could be useful for a quick and simple way to screen RR quality during
storage to reduce potential economic loss or health hazards related to microbial contamination.
F. References
Bern, C., Hurburgh, C., & Brumm, T. (2011). Managing grain after harvest. Agricultural and Biosystems Engineering Department, Iowa State University.
Chikubu, S. (1970). Storage condition and storage method. Training manual for training in storage and
preservation of food grains (pp. 109-136). Tokyo, Japan: Asian Productivity Organization.
Christensen. C. M., & Lopez, L. (1965). Relation of moisture content and length of storage to changes in
microflora and germination percentage of rough rice. Phytopathology, 55(9), 953.
Christensen, C. M., & Kaufmann, H. (1965). Deterioration of stored grains by fungi . Annual Review of
Phytopathology, 3(1), 69-84.
Dillahunty, A., Siebenmorgen, T., Buescher, R., Smith, D., & Mauromoustakos, A. (2000). Effect of
moisture content and temperature on respiration rate of rice. Cereal Chemistry, 77(5), 541-543.
Freer, M., Siebenmorgen, T., Couvillion, R., & Loewer, O. (1990). Modeling temperature and moisture
content changes in bunker-stored rice. Transactions of the ASAE, 33(1), 211-0220.

59
Hayma, J., 2003. The storage of tropical agricultural products. Agrodok No. 31. Agromisa Foundation,
Wageningen, Netherlands.
Jindal, V., & Siebenmorgen, T. (1987). Effects of oven drying temperature and drying time on rough rice
moisture content determination. Trans.ASAE, 30(4), 1185-1192.
Kaleta, A., & Górnicki, K. (2013). Criteria of determination of safe grain storage time-A review. Advances
in agrophysical research (pp. 295-318) InTech Publisher.
Mutters, R. G., & Thompson, J. F. (2009). Rice quality handbook UCANR Publications .
Naewbanij, M. (1985). Quality indicators for rough rice during aerated storage. (Doctoral Dissertation).
Retrieved from http://hdl.handle.net/10625/7821.
Saul, R. A., & Steele, J. L. (1966). Why damaged shelled corn costs more to dry. Agricultural
Engineering, 47(6), 326-329.
Seib, P., Pfost, H., Sukabdi, A., Rao, V., & Burroughs, R. (1980). Spoilage of rough rice measured by
evolution of carbon dioxide. Proc. 3rd Annual Workshop on Grains Post-Harvest Technology, 75-94.
Seitz, L., Sauer, D., & Mohr, H. (1982). Storage of high-moisture corn: Fungal growth and dry matter loss.
Cereal Chemistry (USA).
Steele, J., Saul, R., & Hukill, W. (1969). Deterioration of shelled corn as measured by carbon dioxide
production. Amer Soc Agr Eng Trans Asae,
Sukabdi, A. (1979). Deterioration of rough rice as measured by carbon dioxide production. (Masters).
Retrieved from http://krex.k-state.edu/dspace/bitstream/handle/2097/27191/LD2668T41979S94.pdf?sequence=1
Suleiman, R. A., Rosentrater, K. A., & Bern, C. J. (2013). Effects of deterioration parameters on storage
of maize: A review. Journal of Natural Sciences Research, 3(9), 147.
Tangonan, R. G., & Jindal, V. K. (1980). The rate of respiration of rough rice. Grain Postharvest
Workshop, Southeast Asian Center for Graduate Study and Research in Agriculture, College, Laguna, Philippines. , Paper No. 8112.
Vladilo, G., Murante, G., Silva, L., Provenzale, A., Ferri, G., & Ragazzini, G. (2013). The habitable zone of
earth-like planets with different levels of atmospheric pressure. The Astrophysical Journal, 767(1), 65.
Weinberg, Z., Yan, Y., Chen, Y., Finkelman, S., Ashbell, G., & Navarro, S. (2008). The effect of moisture
level on high-moisture maize (zea mays L.) under hermetic storage conditions—in vitro studies.
Journal of Stored Products Research, 44(2), 136-144.
White, N., Sinha, R., & Muir, W. (1982). Intergranular carbon dioxide as an indicator of biological activity
associated with the spoilage of stored. Canadian Agricultural Engineering, 24(1)

60
V. Conclusion
For the first part of this study, the total aerobic plate count (APC) and mold count on freshly-
harvested, long-grain hybrid (XL723 and XL753), long-grain pureline (CL152 and RoyJ) and medium-
grain (Caffey and Jupiter) rice cultivars grown at four Arkansas locations (Stuttgart, Rohwer, Colt, and
Keiser) were determined in a study conducted over two rice harvest seasons – 2013 and 2014. For both
years (2013 and 2014) harvested samples, of all the studied rice cultivars, the long-grain hybrid cultivars
had significantly lower APC and mold count levels. The findings from this study provide baseline
information on the relative microbial load on freshly-harvested rice, especially for the studied Arkansas
locations and led to the second part of this study. The second part of this study aimed to characterize the
growth of mold on hybrid rice cultivars CL XL745, XL753 and XL760 over a storage period of 16 weeks
for rough rice at four MC levels and five storage temperatures. The study simulated conditions of delayed
drying and prolonged storage of rough rice and characterized mold growth on HLG rough rice. The major
conclusions of the study were that initial microbial load detected on the HLG rough rice affected the mold
growth kinetics and trends significantly. For all cultivars, a direct relationship between mold counts and
MC was observed – as the MC level increased, the mold counts increased; whereas, more complex
trends were observed for the effect of temperature and the duration of storage on mold growth.
The data collected from the second study was used to perform a non-linear regression fit using the
following microbial growth equations: The Fitted Baranyi, fitted Weibull, fitted Gompertz, fitted Richards
and Fitted Buchanan models. The equations were successfully modified to estimate kinetics of mold
growth. The Baranyi and Weibull equations performed the best over the temperature range of 10°C to
40°C. In summary, this study finds that long-grain hybrid rough rice may be stored at low MC levels
(<17%) and moderate temperatures (30<C) for up to six weeks without any change in the mold growth
profile. However, storing rough rice at high MC (>17%) for more than eight weeks, especially at higher
temperatures (30>C) should be avoided. Also, microbial growth equations provided good estimates to
predict microbial kinetics for mold measured by enumerating colony forming units.
This study developed DML parameters for characterizing DML during storage of hybrid rough rice
under reduced oxygen conditions. The study utilized relative humidity and temperature data to model
change in carbon dioxide concentration. The DML was successfully modeled for the two hybrid rice

61
cultivars and the appropriate parameters were generated for DML prediction. Also, a model relating RH
and temperature to change in the amount of carbon dioxide in a closed system was developed.

62
VI. References
Atungulu, G. G., Zhong, H., & Siebenmorgen, T. J. (2014). Microbial population on freshly-harvested rice
and factors affecting prevalence. ASABE Paper No. 141914312. St. Joseph, Mich.:ASABE.
Bern, C., Hurburgh, C., & Brumm, T. (2011). Managing grain after harvest. Agricultural and Biosystems
Engineering Department, Iowa State University.
Branscum, D. E., Nalley, L. L., Dixon, B. L., Siebenmorgen, T. J., Tack, J., & Danforth, D. M. (2014).
Implications of rice variety selection to optimize returns from crop insurance. 2014 AAEA: Crop
Insurance and the 2014 Farm Bill Symposium: Implementing Change in US Agricultural Policy,
October 8-9, Louisville, KY, (184247)
Christensen, C. M., & Kaufmann, H. (1965). Deterioration of stored grains by fungi . Annual Review of
Phytopathology, 3(1), 69-84.
Dillahunty, A., Siebenmorgen, T., Buescher, R., Smith, D., & Mauromoustakos, A. (2000). Effect of
moisture content and temperature on respiration rate of rice. Cereal Chemistry, 77(5), 541-543.
FAO. (2009). Rice and human nutrition. fact sheet. Retrieved from http://www.fao.org/rice2004/en/f-
sheet/factsheet3.pdf
Hardke, J. (2015). Rice production in Arkansas. Retrieved from http://www.uaex.edu/farm-ranch/crops-
commercial-horticulture/rice/
Hayma, J., 2003. The storage of tropical agricultural products. Agrodok No. 31. Agromisa Foundation,
Wageningen, Netherlands.
IRRI. (2014). Post-harvest. Retrieved from http://irri.org/our-work/research/value-added-rice/postharvest
Lee, S. (1999). Low-temperature damp corn storage with and without chemical preservatives (Masters).
Nalley, L. L., Dixon, B. L., Brye, K., Rogers, C. W., Myrteza, H., & Norman, R. J. (2014). Estimating cultivar effects on water usage and greenhouse gas emissions in rice production. Agronomy J., 106(6), 1981-1992.
Ranalli, R., & Howell, T. (2002). Effects of storage conditions on the total aerobic and Yeast/Mold
bacterial counts of rough rice during On‐farm storage. Journal of Food Science, 67(2), 807-810.
Skyrme, D. S., Marks, B. P., Johnson, M. G., & Siebenmorgen, T. J. (1998). Distribution of total aerobic and coliform bacterial counts among rice kernel components. Journal of Food Science, 63(1), 154-
15.
State fact sheets. (2015). Retrieved from http://www.ers.usda.gov/data-products/state-fact-sheets/state-
data.aspx?StateFIPS=05&StateName=Arkansas
Suleiman, R. A., Rosentrater, K. A., & Bern, C. J. (2013). Effects of deterioration parameters on storage
of maize: A review. Journal of Natural Sciences Research, 3(9), 147
USDA. (2015) Crop production 2014 summary. Washington, D.C.: United States Department of
Agriculture National Agricultural Statistics Service


![Bioactive Powerpoint Microbes fighting microbes [Read-Only]](https://img.dokumen.tips/doc/110x75/625e85126147534db333a997/bioactive-powerpoint-microbes-fighting-microbes-read-only.jpg)