Embed Size (px)
Citation preview
Abstract
Aims/hypothesis. We carried out global transcriptprofiling to identify differentially expressed skeletalmuscle genes in insulin resistance, a major risk fac-tor for Type II (non-insulin-dependent) diabetesmellitus. This approach also complemented the on-going genomic linkage analyses to identify geneslinked to insulin resistance and diabetes in Pima In-dians.Methods. We compared gene expression profiles ofskeletal muscle tissues from 18 insulin-sensitive ver-sus 17 insulin-resistant equally obese, non-diabetic Pima Indians using oligonucleotide arrays consistingof about 40,600 transcripts of known genes and ex-pressed sequence tags, and analysed the results withthe Wilcoxon rank sum test. We verified the mRNAexpression of ten differentially (best-ranked) and ten
similarly (worst-ranked) genes using quantitative RealTime PCR.Results. There were 185 differentially expressed tran-scripts by the rank sum test. The differential expres-sions of two out of the ten best-ranked genes wereconfirmed and the similar expressions of all ten worst-ranked genes were reproduced.Conclusion/interpretation. Of the 185 differentiallyexpressed transcripts, 20 per cent were true positivesand some could generate new hypotheses about theaetiology or pathophysiology of insulin resistance.Furthermore, differentially expressed genes in chro-mosomal regions with linkage to diabetes and insulinresistance serve as new diabetes susceptibility genes.[Diabetologia (2002) 45:1584–1593]
Keywords Genes, oligonucleotide array, RT-PCR, in-sulin resistance, diabetes.
Received: 12 November 2001 / Revised: 26 April 2002Published online: 23 August 2002© Springer-Verlag 2002
Corresponding author: Dr. P. A. Permana, National Institute ofDiabetes and Digestive and Kidney Diseases, National Insti-tutes of Health, 4212 N. 16th Street, Phoenix, AZ 85016, USA. E-mail: [email protected]: EST, Expressed sequence tag; IS, insulin sensi-tive; IR, insulin resistant; cRNA, complementary ribonucleicacid; Q-RT-PCR, Taqman Real Time PCR; SNP, single nucleo-tide polymorphism.
Diabetologia (2002) 45:1584–1593DOI 10.1007/s00125-002-0905-7
Microarray profiling of skeletal muscle tissues from equally obese, non-diabetic insulin-sensitive and insulin-resistant Pima IndiansX. Yang2, R. E. Pratley3, S. Tokraks1, C. Bogardus1, P. A. Permana1
1 Clinical Diabetes and Nutrition Section, Phoenix Epidemiology and Clinical Research Branch, National Institute of Diabetes andDigestive and Kidney Diseases, National Institutes of Health, Phoenix, Arizona, USA
2 Lundberg Laboratory for Diabetes Research, Sahlgrenska University Hospital, Göteborg, Sweden3 Department of Cardiovascular, Metabolic and Endocrine Clinical Research, Novartis Pharmaceutical Corp., East Hanover, New
Jersey, USA
olism by insulin [1]. Insulin resistance, characterizedas decreased insulin action on glucose uptake and me-tabolism, is a major predictor of Type II diabetes inde-pendent of obesity in Pima Indians of Arizona [2] whohave a high prevalence of the disease [3]. Under phys-iological conditions, insulin-stimulated glucose me-tabolism occurs mainly in skeletal muscle (>80%) andadipose (~5–10%) tissues [4]. Similar to Type II dia-betes, insulin resistance clusters in families [5], and isinherited as a non-Mendelian trait [6]. Since insulinresistance is a pre-diabetic phenotype, it is thoughtthat genes influencing this metabolic abnormalitycould be fewer than those contributing to the complexdiabetic syndrome. Chromosomal regions harbouringsusceptibility genes for pre-diabetic phenotypes [7]
Type II (non-insulin-dependent) diabetes mellitus isan increasingly common metabolic disease involvingabnormal regulation of carbohydrate and lipid metab-
X. Yang et al.: Microarray profiling of skeletal muscle tissues from equally obese 1585
and diabetes [8] have been identified using linkage an-alyses in the Pima population.
The recent advances in genomic research includethe utilization of microarrays to monitor the expres-sion of thousands of genes in parallel. Global gene ex-pression or transcriptional profiling has been used toidentify molecular markers for various pathologicalstates [9, 10, 11]. In this study we used global geneexpression using oligonucleotide microarrays that in-cluded transcripts of known genes and Expressed Se-quence Tags (ESTs) to identify potentially novel genesin pathways that are dysregulated at the transcript level in the skeletal muscle tissue of insulin-resistantnon-diabetic Pima Indians. This approach providesdata that can generate new hypotheses on the metab-olic impairment that characterizes insulin resistance.Furthermore, this transcriptional profiling approachshould complement the genomic linkage and position-al cloning of diabetes susceptibility genes in the PimaIndian population by potentially identifying differen-tially expressed genes located on the chromosomal re-gions with suggestive linkage to diabetes and insulinresistance.
Subjects and methods
Subjects and clinical procedures. This study was approved bythe Tribal Council of the Gila River Indian Community and theInstitutional Review Board of the National Institutes of Diabe-tes and Digestive and Kidney Diseases (NIDDK). All subjectsprovided written informed consent prior to participation. Thesubjects in this study were non-diabetic Pima Indians or Tohono O’Odham Indians who were classified as insulin-sen-sitive (IS, n=18) or insulin-resistant (IR, n=17) based on a two-step hyperinsulinaemic-euglycaemic clamp and were matchedfor per cent body fat to minimize the differences due to obesi-ty. The anthropometric and metabolic characteristics of the twogroups at the time of the muscle biopsy are summarised in Table 1. All subjects were in good health as assessed by medi-
cal history, physical examination and routine blood and urinetests, and none were taking medication at the time of the study.
Volunteers were admitted to the Clinical Research Unit for8 to 10 days. They were fed a weight maintaining diet (con-taining 50% of calories as carbohydrates, 30% as fat, and 20%as protein) for 2 to 3 days before metabolic testing. Body com-position was measured by dual energy X-ray absorptiometry(DXA) using a total body scanner (DPX-L, Lunar Radiation,Madison, Wis., USA) [12]. Oral glucose tolerance tests using75 g glucose were carried out after a 12-h overnight fast, anddiabetes was defined according to the World Health Organiza-tion criteria [13]. Plasma glucose and insulin concentrationswere measured in blood samples drawn before glucose inges-tion and at 30, 60, 120 and 180 min thereafter. Insulin actionwas measured at physiologic and supraphysiologic insulin con-centrations during a two-step hyperinsulinaemic-euglycaemicglucose clamp [2]. After an overnight fast, a primed continu-ous intravenous insulin infusion was administered for 100 minat a constant rate of 40 mU·m–2 body surface area·minute–1
(low dose), followed by a second insulin infusion for 100 minat 400 mU·m–2·minute–1 (high dose). These infusions achievedsteady-state plasma insulin concentrations of 840±250 pmol/land 13320±3480 pmol/l (Means ± SD), respectively. Plasmaglucose concentrations were maintained at about 5.6 mmol/lwith a variable infusion of a 20% glucose solution. Rates of in-sulin-stimulated glucose disposal at physiologic and maximal-ly stimulating insulin concentrations were calculated for thelast 40 min of each phase, and corrected for endogenous glu-cose output (EGO) [14]. During the low dose and baseline,EGO was calculated using a primed (1.11×10⁶ Bq), continuous(1.11×10⁴ Bq·min–1) 3-3H-glucose infusion [2, 15]; during thehigh insulin dose, EGO was assumed to be 0. The glucose dis-posal rates during the clamp served as the selection criteria forthe insulin-sensitive or resistant group. Subjects of a similarpercentage of body fat with the highest or lowest glucose dis-posal rates were classified into the insulin-sensitive (IS) or in-sulin-resistant (IR) group, respectively. Indirect calorimetry us-ing a ventilated hood system was used to calculate the rates ofinsulin-stimulated oxidative and non-oxidative glucose dispos-al [16]. All measurements derived from the glucose clampwere normalized to estimated metabolic body size (EMBS,which equals fat-free mass +17.7 kg) [17].
Percutaneous skeletal muscle biopsies of the vastus lateralismuscle were carried out in the morning after a 12-h overnight
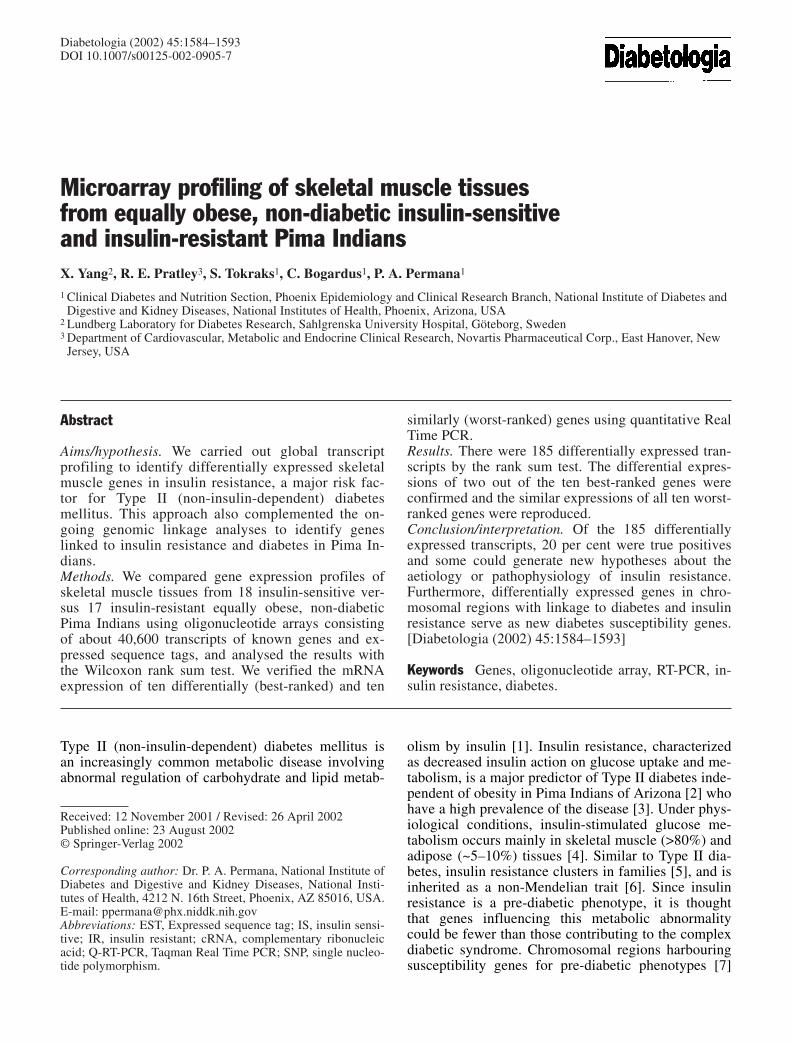
Table 1. Anthropometric and metabolic characteristics of the non-diabetic insulin-resistant (IR) and insulin-sensitive (IS) PimaIndian subjects
Characteristics IS group IR group p value
Number of subjects (men/women) 11/7 12/5Age (year) 31±8 30±7 0.7Height (cm) 167±7 170±10 0.4Weight (kg) 108±25 106±23 0.9Body fat (%) 36±6 33±6 0.2Fasting glucose (mmol/l) 4.9±0.5 4.9±0.6 0.52-h glucose (mmol/l) 6.6±1.6 7.9±1.4 0.01Fasting insulin (pmol/l) 230±50 310±120 0.012-h insulin (pmol/l) 745±305 1655±735 <0.0001M-low (mg·min–1·kg–1 EMBS) 3.11±1.60 1.96±0.29 0.01M-high (mg·min–1·kg–1 EMBS) 10.64±1.39 6.13±1.24 <0.0001
Data are expressed as means ± SD. M-low glucose disposalrate at physiological insulin concentration during a two-stephyperinsulinaemic-euglycaemic clamp, EMBS estimated meta-
bolic body size, M-high glucose disposal rate at supra-physio-logical insulin concentration during a two-step hyper-insulinaemic-euglycaemic clamp

fast using Bergstrom needles (Depuy) (Raynham, Mass., USA)under local anaesthesia with 1% lidocaine. The biopsy wascleaned of any visible fat, rinsed in sterile 0.9% NaCl solution,and immediately frozen in liquid nitrogen and stored at –70°C.
RNA preparation. Total RNA was isolated from the frozen tissues homogenized in Trizol Reagent (Life Technologies,Gaithersburg, Md., USA) and mRNA was subsequently isolat-ed using oligo-dT latex beads (Qiagen, Santa Clarita, Calif.,USA). The oligonucleotide microarray approach was chosen toallow comparison of multiple samples in IS and IR groups. Arrays that included about 40,600 transcripts of known genesand ESTs provided a comprehensive method to interrogate asmany muscle transcripts as possible. Due to the high cost ofthe Affymetrix GeneChips, we pooled equal amounts mRNAof two to four subjects from either IS or IR group to make 1 ug mRNA for each GeneChip. This pooling strategy shouldalso minimize individual variations. From the 17 IR and 18 ISsubjects, we made 5 IS (IS1–5) and 5 IR (IR1–5) sample pools,respectively. Hybridization samples for subsequent GeneChipanalysis were prepared as recommended by the manufacturer(Affymetrix, Santa Clara, Calif., USA). Briefly, double-strand-ed cDNA was synthesized from the mRNA samples using Superscript Choice system (Life Technologies, Gaithersburg,Md., USA). The cDNA served as a template for in vitro tran-scription reaction (Megascript kit from Ambion, Austin, Tex.,USA) to generate biotinylated cRNA that included biotin-11-CTP and biotin-16-UTP (Enzo Biochemicals, Farmingdale,N.Y., USA). The cRNA was purified using RNeasy Mini kit(Qiagen, Santa Clarita, Calif., USA) and randomly fragmentedby heat and alkaline treatment prior to hybridization to Affymetrix GeneChips.
For verification using TaqMan Real Time PCR (Q-RT-PCR), single-stranded oligo-dT primed cDNA were synthe-sized from either the available total RNA (pre-treated withDNA-free reagent from Ambion, Austin, Tex., USA) ormRNA of the majority of subjects using the Advantage RT-for-PCR kit (Clontech, Palo Alto, Calif., USA).
Hybridization, staining, scanning and analysis of image. Thehybridization solution consisted of the 0.05 µg/µl fragmentedcRNA sample, 50 pmol/l of a control biotinylated oligonucle-otide for image alignment, biotin-labelled bacterial and phagecRNAs for hybridization control (1.5 pmol/l bioB, 5 pmol/lbioC, 25 pmol/l bioD, 100 pmol/l Cre), and 0.1 mg/ml degrad-ed herring sperm DNA in hybridization buffer. The hybridiza-tion mixture was heated to 99°C for 5 min and equilibrated at45°C for 5 min before hybridization in the oligonucleotide ar-ray chamber at 45°C for 16 to 17 h. Each hybridization samplewas hybridized to the Affymetrix GeneChip Hu6800 Array(Santa Clara, Calif., USA) and Human 35 K set consisting ofabout 5600 unambiguous full-length cDNAs (after masking forthe ambiguous probe set designs using the class AB mask asper the manufacturer’s instruction that filtered out probe setscontaining less than 10 unambiguous probe pairs in theHu6800 array) and about 35,000 clustered human EST tran-scripts, respectively. After hybridization, the solution was re-moved and the probe arrays were washed and stained using theGeneChip Fluidics station protocol EukGE-WS2, as describedpreviously [18]. The protocol consisted of non-stringent andstringent washes after hybridization, followed by a stainingprocedure using streptavidin-phycoerythrin solution (SAPE),and a post-stain wash. Signal amplification was achieved usingantibody against streptavidin, after a final wash. The probe ar-rays were then scanned twice using a scanning confocal micro-scope (GeneChip scanner, Molecular Dynamics and Affyme-trix, Santa Clara, Calif., USA). The stored images were aligned
and analysed using the GeneChip software MAS 4.0 (Affyme-trix) as per manufacturer’s instruction. Signal intensity foreach cDNA or EST entry (represented as “value” in Table 4)was calculated as the difference of filtered Perfect Match (PM)probes minus Mismatch (MM) probes. The signal intensitieswere normalized to the mean intensity of all the genes repre-sented on the array, and then scaled to the image intensity of arandomly chosen sample pool (IS1) for that particular array.The comprehensive list on signal intensity and present/absentcalling for each cDNA/EST in every sample pool can be found on http://www.ncbi.nlm.nih.gov/geo/; accession num-bers GSE64–73.
GeneChip data analysis. We only considered cDNA or ESTentries that were called “present” by the GeneChip software inat least three sample pools of one group (either IS or IR) ver-sus none in the other group. For example, we would exclude anentry that was present in only two IS sample pools and two IRpools, but we would include an entry that was present in threeIS pools versus no IR pool. Excluded entries were designated“below detection threshold.” From the 40600 cDNAs/ESTsrepresented on the arrays, there were only 10831 cDNAs/ESTsthat met the inclusion criteria. We then applied the non-para-metric statistical analysis, Wilcoxon Rank Sum test to the aver-age difference values of the cDNAs and ESTs in all samplepools, and listed those with a p value of less than or equal to0.05 (hereafter called the best-ranked list).
Quantitative Q-RT-PCR. Verification of transcript quantity inseveral selected cDNAs/ESTs was carried out using TaqManReal Time PCR (Q-RT-PCR) on cDNA from individual sam-ples that had enough remaining total RNA or mRNA. Theprimer pairs and probe for each cDNA/EST were designed using Primer Express software (Applied Biosystems, FosterCity, Calif., USA), and are available upon request. The quanti-fication was carried out using the standard protocol of ABIPRISM 7700 (Applied Biosystems). For each primer and probeset, a standard curve was generated by a serial dilution of acDNA sample synthesized from muscle RNA of a healthy sub-ject that was done in triplicate. Each sample was run in dupli-cate and the mean value of the duplicate was used to calculatethe mRNA expression. The transcript quantity of a particularcDNA/EST in each cDNA sample was normalized to that ofcyclophilin using the TaqMan Pre-Developed Assay Reagentfor human endogenous controls (Applied Biosystems).
Q-RT-PCR data analysis. Differential gene expression betweenthe IR and the IS groups as measured using Q-RT-PCR wasanalysed using one-tailed Student’s t test, since we hypothe-sized that the relative abundance of each transcript in the ISand the IR groups measured by the Q-RT-PCR method wouldbe the same as that measured by the oligonucleotide arrayanalysis.
Results
Oligonucleotide microarray analysis. There were 195differentially expressed transcripts in IS versus IRgroups as assessed by the rank sum test. These tran-scripts included nine ESTs that contained repetitive el-ements and one EST that was no longer documentedin the GenBank database (http://www.ncbi.nih.gov/Genbank/). The remaining 185 transcripts were cate-gorized based on their (putative) functions as well astheir known chromosomal locations to complement
1586 X. Yang et al.: Microarray profiling of skeletal muscle tissues from equally obese

X. Yang et al.: Microarray profiling of skeletal muscle tissues from equally obese 1587
Table 2. The best-ranked functionally-known genes with higher expression in the insulin sensitive (IS) group
Gene name (Gene Symbola) Chromosomal location
Insulin signallingInsulin receptor substrate 1 (IRS1) 2q36Protein phosphatase 1, regulatory (inhibitor) subunit 11 (PPP1R11) 6p21.3Protein phosphatase 1, regulatory (inhibitor) subunit 2 (PPP1R2) 3q29
Signal transductionFK506-binding protein 5 (FKBP5) 6Disabled (Drosophila) homolog 1 (DAB1) 1p32-p31Nuclear autoantigen (GS2NA) 14q13-q21Tumour rejection antigen (gp96) 1 (TRA1) 12q24.2-q24.3KIAA0382 protein; leukaemia-associated rho guanine nucleotide exchange factor (ARHGEF12) 11q23.3
Cell growthInsulin-like growth factor binding protein 5 (IGFBP5) 2q33–36LIM domain only 4 (LMO4) 1p22
Ion transportATP-binding cassette, sub-family B, member 10 (ABCB10) 1q42ATPase, Ca++ transporting, type 2C, member 1 (ATP2C1) 3q21-q24Potassium inwardly-rectifying channel, subfamily J, member 2 (KCNJ2) 17q23.1-q24.2
Energy metabolismNADH dehydrogenase (ubiquinone) 1; subcomplex unknown 1 (NDUFC1) 4q28-q31ATP synthase, H+ transporting, mitochondrial F1 complex, gamma polypeptide 1 (ATP5C1) 10q22-q23
Lipid metabolismGlyceronephos-phate O-acyl-transferase (GNPAT) 1q42.11–42.3Vacuolar sorting protein 4 (VPS4) 16
Transcription regulationGeneral transcription factor IIIA (GTF3A) 13q12.3-q13.1TATA box binding protein (TBP)-associated factor (TAF2D) 10q24-q25.2Nuclear transcription factor Y, beta (NFYB) 12q22-q23Zinc finger protein 161 (ZNF161) 3q26.2FOXJ2 forkhead factor (LOC55810) 12pter-p13.31Neural polypyrimidine tract binding protein (PTB) 1Heat shock transcription factor 4 (HSF4) 16q21MAX-interacting protein 1 (MXI1) 10q24-q25Hairy/enhancer-of-split related with YRPW motif 1 (HEY1) 8q21Cold shock domain protein A (CSDA) 12p13.1
Protein synthesisSignal recognition particle 9kD (SRP9) 1q41Ribosomal protein L7 (RPL7) 8qNucleolin (NCL) 2q12-qter
Protein degradationCathepsin F (CTSF) 11q13Protective protein for beta-galactosidase (PPGB) 20q13.1Proteasome activator subunit 3; PA28 gamma; Ki (PSME3) 17q12-q21Ubiquitin specific protease 14 (tRNA-guanine transglycosylase) (USP14) 18Ubiquitin C-terminal hydrolase (UCH37) 1q32Homo sapiens ubiquitin protein ligase (UBE3B) mRNA, partial cds 12Ariadne (Drosophila) homolog, ubiquitin-conjugating enzyme E2-binding protein, 1 (ARIH1) 15q24Huntingtin interacting protein 2 (HIP2) 4p14
Cell adhesionIntegrin α chain, alpha 6 (ITGA6) 2Pinin, desmosome associated protein (PNN) 14DNA replicationTopoisomerase II binding protein 1 (TOPBP1) 3p13-q26.1
a Whenever possible, the HUGO (Human Genome Organization) nomenclature for each gene product is provided (62)

1588 X. Yang et al.: Microarray profiling of skeletal muscle tissues from equally obese
the positional cloning strategy for diabetes susceptibil-ity gene(s). Subsets of functionally known genes withhigher expression in either the IS or the IR group arelisted (Table 2, 3).
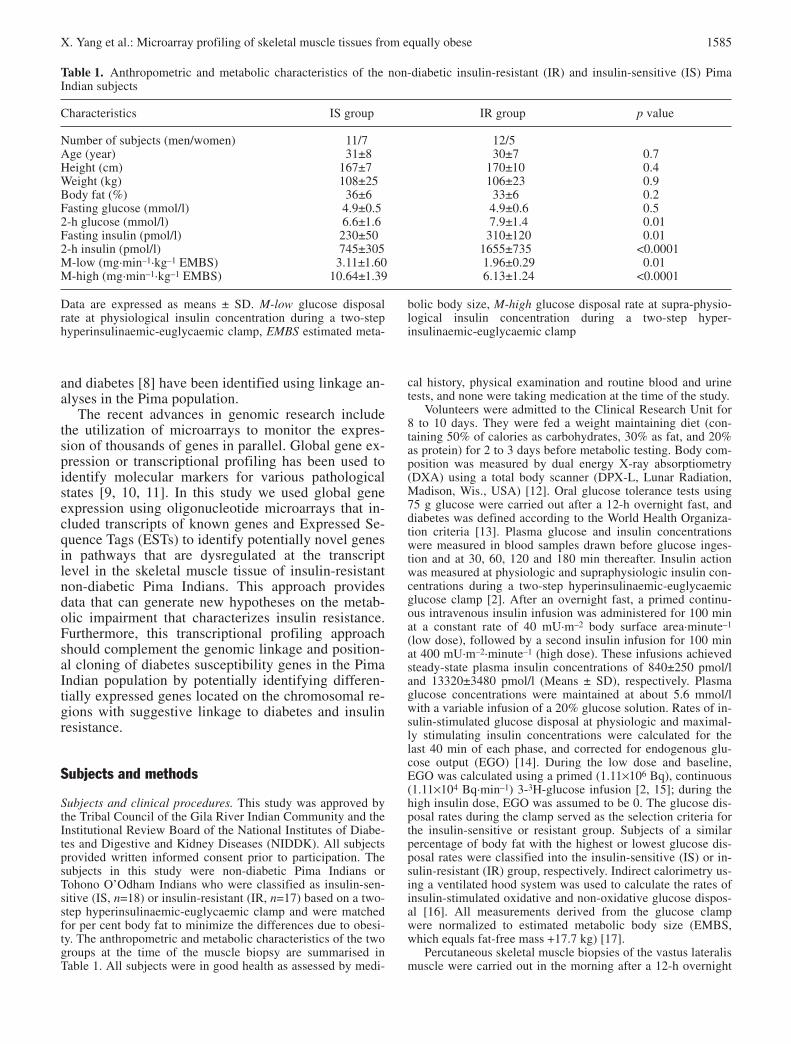
The expression of some candidate genes previouslysuggested to be transcriptionally dysregulated in diabe-tic and/or insulin resistant people are shown in Table 4.
Q-RT-PCR verification. For verification of differentialmRNA expression using a different method (Q-RT-
PCR), we selected ten out of the best-ranked 185 dif-ferentially expressed transcripts (Table 5). The tentranscripts were called “present” in all ten samplepools, and contained sequence regions that allowedthe design of specific primer-probe sets for this assay.Nine of the ten transcripts were derived from knowncDNAs and the remaining transcript was an EST rep-resenting a gene with an unknown function. As a com-parison, we also quantified ten transcripts that weresimilarly called “present” in all ten sample pools, but
Table 3. The best-ranked functionally-known genes with higher mRNA expression in the insulin resistant (IR) group
Gene name (Gene Symbol) Chromosomal location
Signal transductionA kinase (PRKA) anchor protein 11 (AKAP11) 13q12.2–13q14.3A kinase (PRKA) anchor protein 2 (AKAP2) 9q31-q33Platelet-derived growth factor receptor, beta polypeptide (PDGFRB) 5q31-q32Endothelin receptor type B (EDNRB) 13q22
Carbohydrate metabolismMalic enzyme 1, NADP(+)-dependent, cytosolic (ME1) 6q12
Lipid metabolismPeroxisomal biogenesis factor 11B (PEX11B) 1p36.13-q24.1
Amino acid metabolism3-hydroxymethyl-3-methylglutaryl-Coenzyme A lyase (HMGCL) 1p36.1-p35
Iron metabolismFerritin, light polypeptide (FTL) 19q13.3-q13.4
Transcription regulationPAI-1 mRNA-binding protein (PAI-RBP1) 1p31-p22Transcription factor AP-2 alpha; activating enhancer-binding protein 2 alpha (TFAP2A) 6p24Signal transducer and activator of transcription 5B (STAT5B) 17q11.2Survival of motor neuron protein interacting protein 1 (SIP1) 14q13
Protein synthesisMitochondrial ribosome recycling factor (MRRF) 9q32-q34.1Diptheria toxin resistance protein (Saccharomyces)-like 2 (DPH2L2) 1p34
Protein degradationUbiquitin-conjugating enzyme E2E3 (UBE2E3) 2q32.1Prenylcysteine lyase (PCL1) 9q34.3Palmitoyl-protein thioesterase 1 (PPT1) 1p32
Cytoskeletal functionMyosin phosphatase, target subunit 1 (MYPT1) 12q15-q21Fer-1 (C. elegans)-like 3 (FER1L3) 10q24Epithelial protein lost in neoplasm beta (EPLIN) 12q13Actin related protein 2/3 complex, subunit 5 (16 kD) (ARPC5) 1
Cell adhesionIntegrin Beta-3; platelet glyco-protein IIIa, antigen CD61 (ITGB3) 17q21.32
Cell growthOrnithine decarboxylase antizyme 2 (OAZ2) 15q11.2
ApoptosisDeath associated protein 3 (DAP3) 1q21
X. Yang et al.: Microarray profiling of skeletal muscle tissues from equally obese 1589
were not differentially expressed as assessed by the rank sum test (i.e. worst-ranked) in the same indi-vidual cDNA samples (Table 5). The ten worst-rankedtranscripts were chosen to be in a similar range of ex-pression in the GeneChip analysis as the ten best-ranked ones. We measured the expression of thesetranscripts in individual samples (13 IS and 10–12 IR)that had enough remaining RNA available. The aver-age values of each transcript in the IS and the IRgroups obtained by the GeneChip analysis and the Q-RT-PCR method were compared.
Out of the ten best-ranked transcripts that were dif-ferentially expressed in the IS and IR groups by Gene-Chip analysis, two transcripts, Insulin Receptor Sub-strate 1 (IRS1) and Insulin-like Growth Factor Bind-ing Protein 5 (IGFBP5), were confirmed to be differ-entially expressed by Q-RT-PCR (Table 5). None ofthe ten worst-ranked transcripts showed a differencebetween the IS and IR groups by Q-RT-PCR (Table 5).
Discussion
We have used global microarray analysis to identifypotential candidate genes for insulin resistance in
skeletal muscle tissues of Pima Indians. We analysedthe data above detection threshold using the RankSum Test to select the transcripts that were differen-tially expressed (the best-ranked transcripts). The re-sulting number of 195 transcripts was fewer than theexpected 541 transcripts (out of 10,831) that shouldhave achieved a p value of less than or equal to 0.05.This could be due, at least partly, to redundancies inthe cDNA/EST representation on the probe arrays re-sulting in less than 10,831 unique transcripts. Knowl-edge of new genes that are differentially regulated ininsulin resistance can generate new hypotheses onmolecular mechanisms of the syndrome. Furthermore,differentially expressed genes in chromosomal regionswith suggestive linkage to diabetes and insulin actionin Pima and other populations would serve as candi-date susceptibility genes for insulin resistance and dia-betes.
We also checked the expression of some genes pre-viously suggested to be transcriptionally dysregulatedin diabetic and insulin-resistant people, which couldbe either primary causes or secondary effects of theinsulin resistance state, e.g. modulated by chronicallyhigher plasma insulin or glucose concentrations.
Table 4. Comparison of several previously suggested differentially expressed human muscle genes at basal level with the micro-array data
Gene (Gene Symbol) Expression data in the literature Signal intensity (value) in the microarray data
In diabetic subjects In IR subjects Means ± SD Means ± SD Rank sumin IS group in IR group p value
Phosphoprotein enriched in Increased (45) 335±59 487±146 0.1diabetes or phosphoprotein enriched in astrocytes 15 (PED/PEA15)Glucose transporter 1 (GLUT1) No difference (47) Increased (48) 202±76 352±162 0.1Hexokinase II (HK2) Decreased (49) 258±143 110±201 0.3Glycogen synthase (GYS1) Decreased (50) No difference (51) 1311±336 1934±812 0.3Ras associated with diabetes Increased (52) No difference (53) 508 ± 444 338 ± 529 0.7(RRAD)Uncoupling protein 3 (UCP3) Increased (54) No difference (54) 541±259 483±159 0.7calpain10 (CAPN10) Decreased (55) Below detection thresholdGlucose transporter 3 (GLUT3) Decreased (48;53) Below detection thresholdUncoupling protein 2 (UCP2) Increased (53;54) No difference Below detection threshold
(53;54)Tumour necrosis factor (TNF) Increased (56) Increased (56) Below detection thresholdPeroxisome proliferator Increased (57) Below detection thresholdactivated receptor γ (PPARγ)Insulin receptor (INSR) Increased Masked probe setsa
isoform B (58)Glycogen-associated regulatory No difference (59) Decreased (60) Masked probe setsa
subunit of protein phosphatase 1(PPP1R3)Glycoprotein plasma cell 1 or Increased (61) Not representedPC-1 (ENPP1)
a Ambiguous probe set design; taken out from analysis according to manufacturer’s instructions

1590 X. Yang et al.: Microarray profiling of skeletal muscle tissues from equally obese
There were no statistically significant differences inthe expression of these genes in the microarray data,which could be due to the small number of samples ineach group and lower sensitivity of microarray tech-nology compared to RT-PCR [19]. The expression ofsome genes are below detection threshold, and deter-mination of differential expression for such probe setsis deemed unreliable [20].
The expensive cost of the GeneChips did not allowexperimental replication that would be necessary toassess the signal intensity variance for each probe setand the traditional confidence level. As there werethousands of genes represented on the GeneChips, thestatistical analysis involved multiple testing issues. Atraditional way to test for statistical significance in theface of such multiple testing is to apply the Bonferronicorrection or a related step-up or step-down procedure[21], which would result in very small alpha levels.For example, an experiment-wise alpha level of 0.05with 10,000 genes would require a p-value of 5×10⁻⁶;this might result in absurdly low power for realisticsample sizes and would disregard many biologicallysignificant changes [22]. Thus, we estimated the num-ber of genes with true expression differences betweenthe IS and IR groups by empirical testing using a dif-ferent method (Q-RT-PCR).
We carried out Q-RT-PCR on the ten best-rankedand ten worst-ranked transcripts in the majority ofsubjects individually. This empirical testing confirmedabout 20% of the differentially expressed genes and100% of the similarly expressed genes. Despite the
confirmation of true negative results in the data setabove detection threshold, the 20% enrichment in truepositive result was low and indicated that the differen-tial expression of the other best-ranked genes has tobe confirmed with a different method or a larger num-ber of samples. The high false positive rate could bedue to either type I error in the microarray analysis ortype II error in the RT-PCR analysis. Nevertheless, the185 potentially differentially expressed genes can beused to generate new hypotheses on molecular fea-tures of insulin resistance and to complement the posi-tional cloning effort on diabetes susceptibility genes.
Insulin receptor substrate 1 (IRS1) was one of thebest-ranked transcripts confirmed to be differentiallyexpressed between the IR and the IS groups. Consid-ering that IRS1 mRNA was reduced by a higher plas-ma insulin concentration during a euglycaemic-hyper-insulinaemic clamp in healthy subjects [23], our resultcan be explained by normal insulin regulation of IRS1expression in the IR subjects, i.e. the decreased mus-cle IRS1 expression is secondary to hyperinsulinaemiainduced by insulin resistance. This explanation wouldsupport the hypothesis that muscle IRS1 regulation isnot affected by insulin resistance in diabetic patients[24]. Alternatively, the reduced IRS1 expression in theIR subjects could play a role in the development of in-sulin resistance in non-diabetic subjects and could bedue to genetically determined abnormal regulation ofthe IRS1 gene or altered function of transcription fac-tors regulating IRS1 transcription. This explanation,together with the gene location on 2q36 in the vicinity
Table 5. Expression of selected ten best-ranked and ten worst-ranked genes as assessed by the oligonucleotide array and Q-RT-PCR
Probe set Gene description Rank sum t testp value p value
S62539 Insulin receptor substrate 1 (IRS1) 0.02 0.04L27559 Insulin-like growth factor binding protein 5 (IGFBP5) 0.01 0.06AA460511 Ubiquitin-conjugating enzyme E2E3 (UBE2E3) 0.03 0.1M60858 Nucleolin (NCL) 0.01 0.3L07648 MAX-interacting protein 1 (MXI1) 0.01 0.3X57959 Ribosomal protein L7 (RPL7) 0.03 0.3AA435791 Speckle-type POZ protein (SPOP) 0.02 0.4D57916 Clone 24775 mRNA 0.01 0.5U20998 Signal recognition particle 9kD (SRP9) 0.03 0.5L07033 3-hydroxymethyl-3-methylglutaryl-Coenzyme A lyase (HMGCL) 0.01 0.5D21235 RAD23 (S. cerevisiae) homolog A (RAD23A) 1.0 0.2U36764 Eukaryotic translation initiation factor 3, subunit 2 (beta, 36kD) (EIF3S2) 1.0 0.3L49054 Myeloid leukaemia factor 1 (MLF1) 1.0 0.3U58089 Cullin 3 (CUL3) 1.0 0.3V00599 Tubulin, beta 5 (Tubb5) 1.0 0.4AA417126 Translocase of inner mitochondrial membrane 10 (yeast) homolog (TIMM10) 1.0 0.4D13900 Enoyl Coenzyme A hydratase, short chain, 1, mitochondrial (ECHS1) 1.0 0.4AA448347 Prefoldin 2 (PFDN2) 1.0 0.5D21853 KIAA0111 gene product (KIAA0111) 1.0 0.5U28963 G protein pathway suppressor 2 (GPS2) 1.0 0.5
The first ten probe sets or gene entries (in bold font) are in the best-ranked list; the last ten entries are in the worst-ranked list. ForGeneChip analysis, n=17 IR and 18 IS. For Q-RT-PCR analysis, n=10–12 IR and 13 IS

of a suggestive linkage to insulin action in Pima Indi-ans [7], lead to the possibility of a polymorphism(s) inthe IRS1 gene that regulates its expression. The fre-quency of the Gly972Arg polymorphism in the IRS1gene is higher in Type II diabetic patients of some, butnot all, studied ethnic groups [25, 26, 27, 28]. Thispolymorphism is absent, or at least very rare, in PimaIndians [29]; thus, the differentially regulated IRS1expression in the subjects of our study was not associ-ated with Gly972Arg polymorphism. The IRS1 genehas been screened for single nucleotide polymor-phisms (SNPs), and preliminary data indicate thatSNPs in the gene are associated with diabetes in PimaIndians [30].
IRS1 was one of the transcripts in insulin signalingpathway with higher expression in the IS group. Theother transcripts encode PPP1R11 and PPP1R2, regu-latory subunits of protein phosphatase-1 (PP1), a keyenzyme that regulates the activity of glycogen syn-thase. PPP1R2 has been proposed to act as a molecu-lar “chaperone” that aids the folding of newly synthe-sized PP1 into a biologically active conformation [31,32] and it has been shown to translocate to the nucleusduring the S-phase of cell cycle [33]. There were nopolymorphisms in the exons and exon-intron splicejunctions of the PPP1R2 gene in selected Pima Indiansubjects [34] but potential polymorphisms in the regu-latory region of the gene might account for the differ-ential gene expression. PPP1R11 is a heat-stable in-hibitor of PP1 encoded by a gene on chromosome6p21 that was previously known as the Hemochroma-tosis Candidate Gene V [35]. Of interest, an apparentpseudogene of PPP1R2 is also located on chromo-some 6p21 [36, 37]. Both PPP1R11 and PPP1R2 serveas candidate genes for insulin resistance.
Apart from IRS1, the other gene in the ten selectedbest-ranked list with confirmed lower mRNA expres-sions in the IR subjects was IGFBP5 (on chromosome2q33–36), a modulator of insulin growth factor 1 ininducing muscle differentiation [38, 39, 40]. The se-rum protein concentration of IGFBP5 was lower in di-abetic patients compared to the control subjects [41],and diabetic rat kidney contains reduced IGFBP5mRNA concentrations [42]. Nevertheless, the expres-sion of IGFBP5 in skeletal muscle is not altered acute-ly by nutrients and insulin [43]. Note that a transcrip-tional regulator of myogenesis, LIM domain Only 4(LMO4), was assessed to be lower in the IR group bythe GeneChip analysis. These findings lead to a hy-pothesis that insulin resistance is associated with dys-regulation of myogenic development.
One of the objectives of this study is to comple-ment the positional cloning effort currently ongoing inthe Pima population. The genes encoding many ofthese transcripts had been localized to particular chro-mosomal regions, and a few are in regions with sug-gestive linkage to diabetes and insulin action in Pima Indians. One such gene on chromosome 11q23
encodes a rho guanine nucleotide exchange factor(ARHGEF12). Preliminary findings indicate an asso-ciation between several SNPs in the gene with insulinsensitivity in Pima Indians [44]. This result providesevidence for the utility of transcriptional profiling toidentify new candidate genes as a complementary ap-proach to positional cloning.
Another chromosomal region with suggestive link-age to diabetes in the Pima population is 1q21 thatharbours many genes, including phosphoprotein en-riched in diabetes or phosphoprotein enriched in astro-cytes 15 (PED/PEA15). The mRNA concentration ofPED/PEA15 is increased in fibroblasts, skeletal mus-cle and adipose tissue of Type II diabetic subjects[45]. In line with this finding, our GeneChip analysisindicated that the PED/PEA15 was expressed margin-ally higher in the IR versus IS groups. Despite the re-cent finding that several SNPs in the non-coding re-gion of the PEA15 gene were not associated with dia-betes in 50 affected and 50 control Pimas [46], thiscould still be a good candidate gene for insulin resis-tance.
In summary, we have carried out a global transcrip-tional profiling of insulin-resistant and insulin-sensi-tive skeletal muscle tissue. This approach, coupledwith the current metabolic knowledge and the posi-tional cloning efforts, provides several novel candi-date genes that can generate new hypotheses on thepathophysiology of insulin resistance and the develop-ment of Type II diabetes.
Acknowledgements. We would like to thank the members andleaders of the Gila River Indian Community, without whosecooperation these studies would have been impossible. Wegratefully acknowledge M. Milner, PA, C. Massengill, RN, thenurses of the Clinical Research Ward, and Dr. A. Salbe and themetabolic kitchen staff for the care of the research volunteers,and Drs. R. Hanson and D. Allison for helpful discussions.
References
1. Saltiel AR (2001) New perspectives into the molecularpathogenesis and treatment of type 2 diabetes. Cell 104:517–529
2. Lillioja S, Mott DM, Spraul M et al. (1993) Insulin resis-tance and insulin secretory dysfunction as precursors ofnon-insulin-dependent diabetes mellitus. Prospective studies of Pima Indians. N Engl J Med 329:1988–1992
3. Knowler WC, Bennett PH, Hamman RF, Miller M (1978)Diabetes incidence and prevalence in Pima Indians: a 19-foldgreater incidence than in Rochester, Minnesota. Am JEpidemiol 108:497–505
4. Reaven GM (1988) Banting lecture 1988. Role of insulinresistance in human disease. Diabetes 37:1595–1607
5. Lillioja S, Bogardus C (1988) Obesity and insulin resis-tance: lessons learned from the Pima Indians. Diabetes Metab Rev 4:517–540
6. Kahn CR, Vicent D, Doria A (1996) Genetics of non-insu-lin-dependent (type-II) diabetes mellitus. Annu Rev Med47:509–531
X. Yang et al.: Microarray profiling of skeletal muscle tissues from equally obese 1591

7. Pratley RE, Thompson DB, Prochazka M et al. (1998) Anautosomal genomic scan for loci linked to prediabetic phe-notypes in Pima Indians. J Clin Invest 101:1757–1764
8. Hanson RL, Ehm MG, Pettitt DJ et al. (1998) An autoso-mal genomic scan for loci linked to type II diabetes melli-tus and body-mass index in Pima Indians. Am J Hum Genet 63:1130–1138
9. Alon U, Barkai N, Notterman DA et al. (1999) Broad pat-terns of gene expression revealed by clustering analysis oftumor and normal colon tissues probed by oligonucleotidearrays. Proc Natl Acad Sci USA 96:6745–6750
10. Thykjaer T, Workman C, Kruhoffer M et al. (2001) Identi-fication of gene expression patterns in superficial and inva-sive human bladder cancer. Cancer Res 61:2492–2499
11. Wilson SB, Kent SC, Horton HF et al. (2000) Multiple dif-ferences in gene expression in regulatory Valpha 24JalphaQ T cells from identical twins discordant for type I diabe-tes. Proc Natl Acad Sci USA 97:7411–7416
12. Tataranni PA, Ravussin E (1995) Use of dual-energy X-rayabsorptiometry in obese individuals. Am J Clin Nutr62:730–734
13. Alberti KG, Zimmet PZ (1998) Definition, diagnosis andclassification of diabetes mellitus and its complications.Part 1: diagnosis and classification of diabetes mellitusprovisional report of a WHO consultation. Diabet Med15:539–553
14. Weyer C, Bogardus C, Mott DM, Pratley RE (1999) Thenatural history of insulin secretory dysfunction and insulinresistance in the pathogenesis of type 2 diabetes mellitus.J Clin Invest 104:787–794
15. Bogardus C, Lillioja S, Howard BV, Reaven G, Mott D(1984) Relationships between insulin secretion, insulin ac-tion, and fasting plasma glucose concentration in nondia-betic and noninsulin-dependent diabetic subjects. J Clin Invest 74:1238–1246
16. Bogardus C, Lillioja S, Ravussin E et al. (1986) Familialdependence of the resting metabolic rate. N Engl J Med315:96–100
17. Gerich JE (1998) The genetic basis of type 2 diabetesmellitus: impaired insulin secretion versus impaired insulinsensitivity. Endocr Rev 19:491–503
18. Warrington JA, Nair A, Mahadevappa M, Tsyganskaya M(2000) Comparison of human adult and fetal expressionand identification of 535 housekeeping/maintenance genes.Physiol Genomics 2:143–147
19. Valerius MT, Patterson LT, Witte DP, Potter SS (2002) Microarray analysis of novel cell lines representing twostages of metanephric mesenchyme differentiation. MechDev 112:219–232
20. Schadt EE, Li C, Su C, Wong WH (2000) Analyzing high-density oligonucleotide gene expression array data. J CellBiochem 80:192–202
21. Hochberg Y, Tamhane AC (1987) Multiple comparisonprocedures. John Wiley & Sons, New York
22. Claverie JM (1999) Computational methods for the identi-fication of differential and coordinated gene expression.Hum Mol Genet 8:1821–1832
23. Ducluzeau PH, Perretti N, Laville M et al. (2001) Regula-tion by insulin of gene expression in human skeletal mus-cle and adipose tissue. Evidence for specific defects in type2 diabetes. Diabetes 50:1134–1142
24. Huang X, Vaag A, Hansson M, Groop L (2002) Down-reg-ulation of insulin receptor substrates (IRS)-1 and IRS-2and Src homologous and collagen-like protein Shc gene ex-pression by insulin in skeletal muscle is not associated withinsulin resistance or type 2 diabetes. J Clin Endocrinol Metab 87:255–259
25. Almind K, Bjorbaek C, Vestergaard H, Hansen T, EchwaldS, Pedersen O (1993) Aminoacid polymorphisms of in-sulin receptor substrate-1 in non-insulin-dependent diabe-tes mellitus. Lancet 342:828–832
26. Hitman GA, Hawrami K, McCarthy MI et al. (1995) Insu-lin receptor substrate-1 gene mutations in NIDDM; impli-cations for the study of polygenic disease. Diabetologia38:481–486
27. Shimokawa K, Kadowaki H, Sakura H et al. (1994) Molec-ular scanning of the glycogen synthase and insulin receptorsubstrate-1 genes in Japanese subjects with non-insulin-dependent diabetes mellitus. Biochem Biophys Res Commun202:463–469
28. Ito K, Katsuki A, Furuta M et al. (1999) Insulin sensitivityis not affected by mutation of codon 972 of the humanIRS-1 gene. Horm Res 52:230–234
29. Celi FS, Silver K, Walston J, Knowler WC, Bogardus C,Shuldiner AR (1995) Lack of IRS-1 codon 513 and 972polymorphism in Pima Indians. J Clin Endocrinol Metab80:2827–2829
30. Kovacs P, Yang X, Permana PA, Kobes S, Bogardus C, Baier LJ (2002) Variants in the insulin receptor substrate-1gene are associated with type 2 diabetes in Pima Indians(abstract). Diabetes 51 (Suppl 2):A266
31. Alessi DR, Street AJ, Cohen P, Cohen PT (1993) Inhibitor-2functions like a chaperone to fold three expressed isoformsof mammalian protein phosphatase-1 into a conformationwith the specificity and regulatory properties of the nativeenzyme. Eur J Biochem 213:1055–1066
32. MacKintosh C, Garton AJ, McDonnell A et al. (1996) Fur-ther evidence that inhibitor-2 acts like a chaperone to foldPP1 into its native conformation. FEBS Lett 397:235–238
33. Kakinoki Y, Somers J, Brautigan DL (1997) Multisitephosphorylation and the nuclear localization of phospha-tase inhibitor 2-green fluorescent protein fusion proteinduring S phase of the cell growth cycle. J Biol Chem272:32308–32314
34. Permana PA, Mott DM (1997) Genetic analysis of humantype 1 protein phosphatase inhibitor 2 in insulin-resistantPima Indians. Genomics 41:110–114
35. Zhang J, Zhang L, Zhao S, Lee EY (1998) Identificationand characterization of the human HCG V gene product asa novel inhibitor of protein phosphatase-1. Biochemistry37:16728–16734
36. Helps NR, Street AJ, Elledge SJ, Cohen PT (1994) Cloningof the complete coding region for human protein phospha-tase inhibitor 2 using the two hybrid system and expressionof inhibitor 2 in E. coli. FEBS Lett 340:93–98
37. Sanseau P, Jackson A, Alderton RP et al. (1994) Cloningand characterization of human phosphatase inhibitor-2(IPP-2) sequences. Mamm Genome 5:490–496
38. James PL, Stewart CE, Rotwein P (1996) Insulin-likegrowth factor binding protein-5 modulates muscle differen-tiation through an insulin-like growth factor-dependentmechanism. J Cell Biol 133:683–693
39. Rotwein P, James PL, Kou K (1995) Rapid activation of in-sulin-like growth factor binding protein-5 gene transcriptionduring myoblast differentiation. Mol Endocrinol 9:913–923
40. Imai Y, Moralez A, Andag U, Clarke JB, Busby WH Jr,Clemmons DR (2000) Substitutions for hydrophobic aminoacids in the N-terminal domains of IGFBP-3 and -5 mark-edly reduce IGF-I binding and alter their biologic actions.J Biol Chem 275:18188–18194
41. Jehle PM, Jehle DR, Mohan S, Bohm BO (1998) Serumlevels of insulin-like growth factor system components andrelationship to bone metabolism in Type 1 and Type 2 dia-betes mellitus patients. J Endocrinol 159:297–306
1592 X. Yang et al.: Microarray profiling of skeletal muscle tissues from equally obese
52. Reynet C, Kahn CR (1993) Rad: a member of the Ras family overexpressed in muscle of type II diabetic humans.Science 262:1441–1444
53. Paulik MA, Hamacher LL, Yarnall DP et al. (1997) Identi-fication of Rad’s effector-binding domain, intracellular lo-calization, and analysis of expression in Pima Indians.J Cell Biochem 65:527–541
54. Bao S, Kennedy A, Wojciechowski B, Wallace P, GanawayE, Garvey WT (1998) Expression of mRNAs encoding un-coupling proteins in human skeletal muscle: effects of obe-sity and diabetes. Diabetes 47:1935–1940
55. Baier LJ, Permana PA, Yang X et al. (2000) A calpain-10gene polymorphism is associated with reduced musclemRNA levels and insulin resistance. J Clin Invest106:R69–R73
56. Saghizadeh M, Ong JM, Garvey WT, Henry RR, Kern PA(1996) The expression of TNF alpha by human muscle. Re-lationship to insulin resistance. J Clin Invest 97:1111–1116
57. Park KS, Ciaraldi TP, Abrams-Carter L, Mudaliar S, Nikoulina SE, Henry RR (1997) PPAR-gamma gene ex-pression is elevated in skeletal muscle of obese and type IIdiabetic subjects. Diabetes 46:1230–1234
58. Kellerer M, Sesti G, Seffer E et al. (1993) Altered patternof insulin receptor isotypes in skeletal muscle membranesof Type II (non-insulin-dependent) diabetic subjects. Dia-betologia 36:628–632
59. Chen YH, Hansen L, Chen MX et al. (1994) Sequence ofthe human glycogen-associated regulatory subunit of type1 protein phosphatase and analysis of its coding region and mRNA level in muscle from patients with NIDDM.Diabetes 43:1234–1241
60. Xia J, Scherer SW, Cohen PT et al. (1998) A common vari-ant in PPP1R3 associated with insulin resistance and type 2diabetes. Diabetes 47:1519–1524
61. Frittitta L, Sbraccia P, Costanzo BV et al. (2000) High in-sulin levels do not influence PC-1 gene expression and pro-tein content in human muscle tissue and hepatoma cells.Diabetes Metab Res Rev 16:26–32
62. White JA, McAlpine PJ, Antonarakis S et al. (1997) Guide-lines for human gene nomenclature (1997). HUGO No-menclature Committee. Genomics 45:468–471
X. Yang et al.: Microarray profiling of skeletal muscle tissues from equally obese 1593
42. Bach LA, Dean R, Youssef S, Cooper ME (2000) Amino-guanidine ameliorates changes in the IGF system in experi-mental diabetic nephropathy. Nephrol Dial Transplant15:347–354
43. Coenen Schimke JM, Ljungqvist OH, Sarkar G, ConoverCA, Sreekumaran NK (1999) A quantitative PCR measure-ment of messenger RNA expression of IGF-I, IGF-II andIGFBP-5 in human skeletal muscle. Growth Horm IGF Res9:179–186
44. Kovaks P, Yang X, Permana PA, Bogardus C, Baier LJ(2001) A Rho-associated guanine exchange factor is asso-ciated with insulin resistance in non-diabetic Pima Indians.Diabetes 50:A245
45. Condorelli G, Vigliotta G, Iavarone C et al. (1998)PED/PEA-15 gene controls glucose transport and is over-expressed in type 2 diabetes mellitus. EMBO J 17:3858–3866
46. Wolford JK, Bogardus C, Ossowski V, Prochazka M (2000)Molecular characterization of the human PEA15 gene on1q21-q22 and association with type 2 diabetes mellitus inPima Indians. Gene 241:143–148
47. Pedersen O, Bak JF, Andersen PH et al. (1990) Evidenceagainst altered expression of GLUT1 or GLUT4 in skeletalmuscle of patients with obesity or NIDDM. Diabetes 39:865–870
48. Stuart CA, Wen G, Williamson ME et al. (2001) AlteredGLUT1 and GLUT3 gene expression and subcellular redis-tribution of GLUT4: protein in muscle from patients withacanthosis nigricans and severe insulin resistance. Metabo-lism 50:771–777
49. Vestergaard H, Bjorbaek C, Hansen T, Larsen FS,Granner DK, Pedersen O (1995) Impaired activity andgene expression of hexokinase II in muscle from non-insu-lin-dependent diabetes mellitus patients. J Clin Invest96:2639–2645
50. Vestergaard H, Bjorbaek C, Andersen PH, Bak JF, PedersenO (1991) Impaired expression of glycogen synthase mRNAin skeletal muscle of NIDDM patients. Diabetes 40:1740–1745
51. Majer M, Mott DM, Mochizuki H et al. (1996) Associationof the glycogen synthase locus on 19q13 with NIDDM inPima Indians. Diabetologia 39:314–321


![Basic Study Obese diet-induced mouse models of ... › 5e0d02... · correction of underlying risk factors (e.g., obesity, insulin resistance and dyslipidemia)[1,6]. A likely contri-butor](https://img.dokumen.tips/doc/110x75/5f1732f98374c80d3f75ab89/basic-study-obese-diet-induced-mouse-models-of-a-5e0d02-correction-of.jpg)