Embed Size (px)
Citation preview

FY2017 RESULTS PRESENTATION
Perfect Parts and Tools, On Time, Every Time
29 AUGUST 2017

Micro-Mechanics FY2017 Results Presentation
BUSINESS & INDUSTRY
CHRIS BORCH, CEOLOW MING WAH, COO

Micro-Mechanics FY2017 Results Presentation
Corporate Overview
• Founded in 1983 in Singapore• Design and manufacture high precision tools and parts
used in process-critical applications for the wafer-fabrication and assembly processes of the semiconductor industry
• Serve a worldwide base of customers from five facilities in Asia (Singapore, Malaysia, China, Philippines) and the USA
• More than 600 active customers• Listed on the Singapore Exchange (Main Board) since 2003• Committed to generating shareholder returns
Our Mission is…
Based on Scalable, Repeatable and Cost-Effective Processes
Perfect Parts and Tools On Time, Every Time
Micro-Mechanics FY2017 Results Presentation
Market demands flow down through our Semiconductor Customers to Us!
Focusing on Key Customer Outcomes
Micro-MechanicsMarketConsumer
Need
Mobility + Performance“On-demand!
Low Cost!”
Requires Nano Precision!Human Hair = 100,000 nanometers
Trend: Devices < 10 nanometers
Semiconductor CustomersWafer Fab & Chip Assembly
Parts and Tools for Process-Critical Applications based on…
Key Customer Outcomes
Miniaturization + Reliability + Precision +
Flawless Quality + Scalability
SupplyDESIGNAlign to Customer (and Market) Needs
RELIABILITYFlawless Quality, 0 PPM
DELIVERYOn Time, Every Time in Less Time
COSTGlobally Competitive; Price < Value
PRECISIONFiner features, smaller tolerances
How?How?
Micro-Mechanics FY2017 Results Presentation
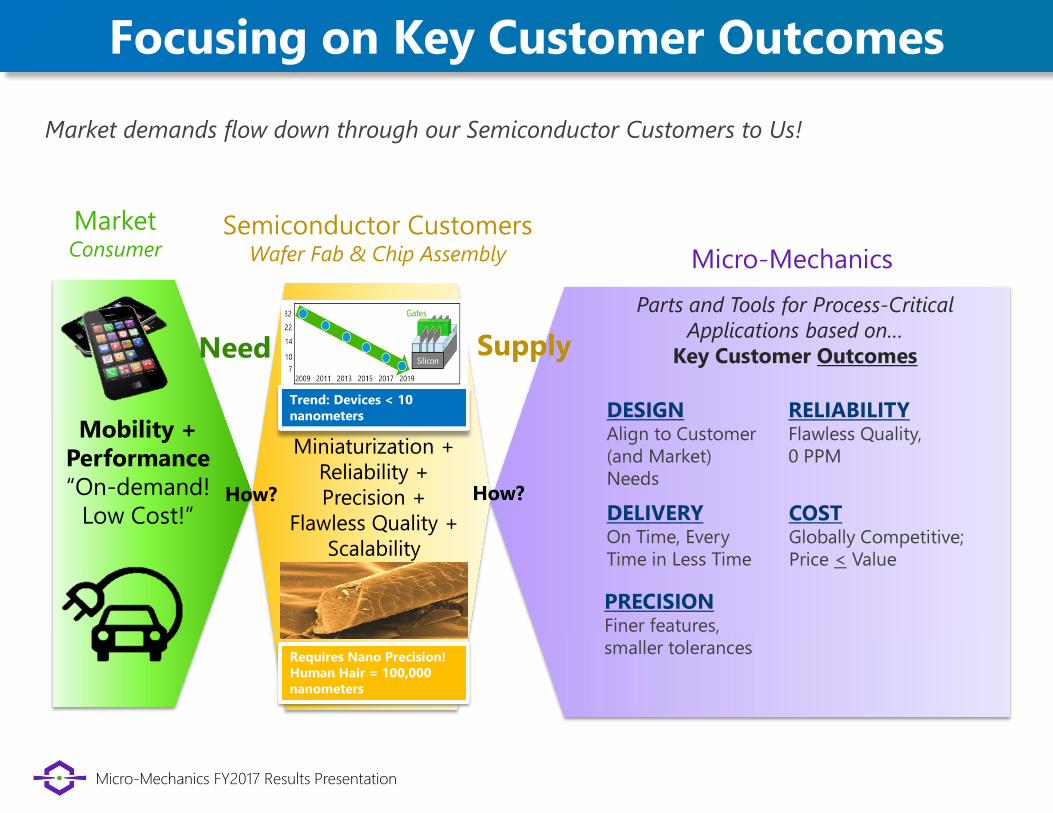
Focusing on Key Customer Outcomes
The “NANO” world of semiconductor manufacturing
Trend: Devices < 10 nanometers
The “Nano” world of semiconductor manufacturing
Micro-Mechanics : Prepared for “Nano” world
with Capital and Engineering ResourcesMore complex design and
manufacturing
Continuously develop advanced machining
processes
Supporting processes –new materials, testing, cleaning & packaging
Smaller features with tighter tolerances
Customers’ Requirements for
Tools & Parts
Greater precision (Higher repeatability)
Towards zero defect
Micro-cleanliness

Micro-Mechanics FY2017 Results Presentation
0%
10%
20%
30%
40%
50%
60%
70%
80%
0.0
0.5
1.0
1.5
2.0
2.5
Jan-17 Feb-17 Mar-17 Apr-17 May-17 Jun-17
YOY Growth
Industry Review
Three-month average of worldwide billings of North American equipment manufacturers (US$ B)
Source: SEMI
• Growth rate is up from the previous quarter's forecast of 1.4%, due to continued aggressive investment in memory and leading-edge logic which is driving spending in wafer-level equipment
Gartner Says Worldwide Semiconductor Capital Spending Is Forecast to Grow 10.2 Percent in 2017
Source: Gartner, 2 August 2017
2016 2017 2018 2019 2020Semiconductor Capital Spending
70,568.9 77,794.5 77,443.5 71,814.8 73,239.5
Growth 9.1% 10.2% -0.5% -7.3% 2.0%
($ Millions)

Micro-Mechanics FY2017 Results Presentation
Industry Review
Global Monthly Chip Sales (US$ B)
-10%
-5%
0%
5%
10%
15%
20%
25%
30%
0.0
5.0
10.0
15.0
20.0
25.0
30.0
35.0YOY Growth
Source: Semiconductor Industry Association
• Global semiconductor industry experienced robust growth during the first six months of 2017
• Semiconductor sales of US$190.5 billion during the first half of 2017 were 20.8% higher than the same period in 2016.
• World Semiconductor Trade Statistics (WSTS) raised its 2017 sales growth forecast to 11.5% from 6.5% previously – this reflects expected growth in all major categories, led by memory products.

Micro-Mechanics FY2017 Results Presentation
Corporate Milestones
• Record revenue and profit in FY2017• USA operations achieved turnaround in 4Q17 • Received two Gold Awards for Best Managed
Board and Best Investor Relations at the Singapore Corporate Awards 2017
• Received a Special Commendation Award at the Singapore Governance and Transparency Forum 2017
• Higher Singapore Governance and Transparency Index (SGTI) score of 92 points to rank 19th out of 606 companies listed on the SGX
“Transparency and good governance are more than just ticking boxes. Indeed, accurate, complete and timely
information is the foundation for sound decision making – not just for investors – but for everyone at Micro-Mechanics from
the board room to the shop floor.”

Micro-Mechanics FY2017 Results Presentation
0.81.2
2.4
3.5
5.0 5.0
2.0
3.0 3.0 3.0 3.0 3.0
5.0
6.0
8.0
Special dividendFinal dividendInterim dividend
Dividend per share (cents)
HIGHER DIVIDENDS OF 8 CENTS FOR FY2017
Dividend Policy of Not Less Than 40% of Earnings*Brings total dividend payout since our listing to 53.9 CENTS per share
*subject to Board approval and expected capital requirements
Dividend Performance
75% of Net Profit

Micro-Mechanics FY2017 Results Presentation
FINANCIAL REVIEW
CHOW KAM WING, CFO

Micro-Mechanics FY2017 Results Presentation
57.2
32.9
0
18.514.8
24.40.7
15.1
3.7
FY2017 P&L Overview (S$ million)KEY RATIOS & STATISTICSREVENUE GROWTH 11.7%GROSS PROFIT GROWTH 12.8%PBT GROWTH 17.9%NET PROFIT GROWTH 24.2%GROSS PROFIT MARGIN 57.4%NET PROFIT MARGIN 25.8%EARNINGS PER SHARE 10.62 centsRETURN ON EQUITY 27.0%CASH S$23.4MDEBT Zero
FY2017 in Review
N.B. Due to rounding, some totals may not correspond with the sum/subtraction of separate figures.
FY: Financial year ending 30 June

Micro-Mechanics FY2017 Results Presentation
10.4 9.9 11.1 13.0 13.6 13.4
8.7 9.3 10.512.9 12.2 14.29.4 9.2
10.613.4 12.5 14.210.3 10.8
11.7
12.9 13.015.4
80
130
180
230
280
330
380
0
10
20
30
40
50
60
70
FY2012 FY2013 FY2014 FY2015 FY2016 FY2017
4Q3Q2Q1Q
38.8 39.2
Group Revenue (S$ mil)
Global Chip Sales Trend (US$B)
Global Chip Sales Trend according to FY. Data from Semiconductor Industry Association (SIA)
43.9
52.2 51.3
Group Revenue
57.2
• Revenue increased 11.7% in FY2017• Quarterly revenue hit a record S$15.4
million in 4Q17 – reflecting strong growth of the global semiconductor industry since the start of 2017
HIGHEST EVER REVENUE IN FY2017
N.B. Due to rounding, some totals may not correspond with the sum of separate figures.

Micro-Mechanics FY2017 Results Presentation
Singapore, 8%
Malaysia, 21%
China, 26%
Thailand, 3%
Philippines, 9%
USA, 16%
Europe, 4% Japan, 2% Taiwan, 9%
Rest of world, 2%
Sales Breakdown for FY2017
DIVERSIFIED REVENUE STREAMS
Higher sales to all markets except Europe.Sales to China would have been higher if not for the translational impact of 5% depreciation of the RMB against the SGD.
Group Revenue
Country FY2017 FY2016 % changeS$ mil S$ milSingapore 4.7 3.0 58%Malaysia 11.9 10.6 12%Philippines 5.1 4.6 10%Thailand 1.6 1.1 45%China 14.8 14.3 4%USA 9.1 7.9 16%Europe 2.2 2.4 (8%)Japan 1.1 1.0 17%Taiwan 5.0 5.0 1%Rest of world 1.7 1.4 19%
Total 57.2 51.3 12%

Micro-Mechanics FY2017 Results Presentation
46.3% 49.1% 50.7%55.0% 56.9% 57.4%
FY2012 FY2013 FY2014 FY2015 FY2016 FY2017
• Higher gross profit margin in FY2017 attributed to higher capacity utilisation, as well as cost, productivity and cycle time improvements
Gross MarginGross Profit MarginSTEADY GROSS PROFIT MARGIN
Gross profit margin is one of the results that matters most – It reflects the value we help to create for our
customers, and our ability to develop and deliver a cost-effective outcome

Micro-Mechanics FY2017 Results Presentation
1.2 1.2 2.1 2.8 3.6 3.40.7 1.01.4
2.72.7 3.4
0.9 1.41.8
3.7 2.73.5
1.41.5
2.4
2.8 2.9
4.6
0.0
2.0
4.0
6.0
8.0
10.0
12.0
14.0
16.0
FY2012 FY2013 FY2014 FY2015 FY2016 FY2017
4Q
3Q
2Q
1Q
4.25.1
(S$ mil) Net Profit After Tax
31.4%
31.4%
28.5%
25.5%
26.2%
25.1%
0% 5% 10% 15% 20% 25% 30% 35%
FY2012
FY2013
FY2014
FY2015
FY2016
FY2017
Operating Expenses - Administrative, distribution and other operating expenses (inclusive of other income)
Operating Expenses / Revenue
7.7
12.0 11.9
FY2017 PROFIT UP 24.2% TO RECORD LEVEL
Profitability
14.8
N.B. Due to rounding, some totals may not correspond with the sum of separate figures.

Micro-Mechanics FY2017 Results Presentation
BUILDING A LEAN MANPOWER STRUCTURE
Personnel
508
471461
447
431
465
11,400 14,700
21,100
34,400 36,400
39,800
-
5,000
10,000
15,000
20,000
25,000
30,000
35,000
40,000
45,000
380
400
420
440
460
480
500
520
FY2012 FY2013 FY2014 FY2015 FY2016 FY2017
Headcount at end of FY PBT per head
Profit Before Tax per head (S$)Headcount
• Lean manpower structure as a by-product of our improvement initiatives
• Added 34 people during FY17 – mainly non-supervisory and production roles to strengthen manufacturing and delivery responsiveness
• Intend to continue automating operations and building improved processes
Micro-Mechanics FY2017 Results Presentation
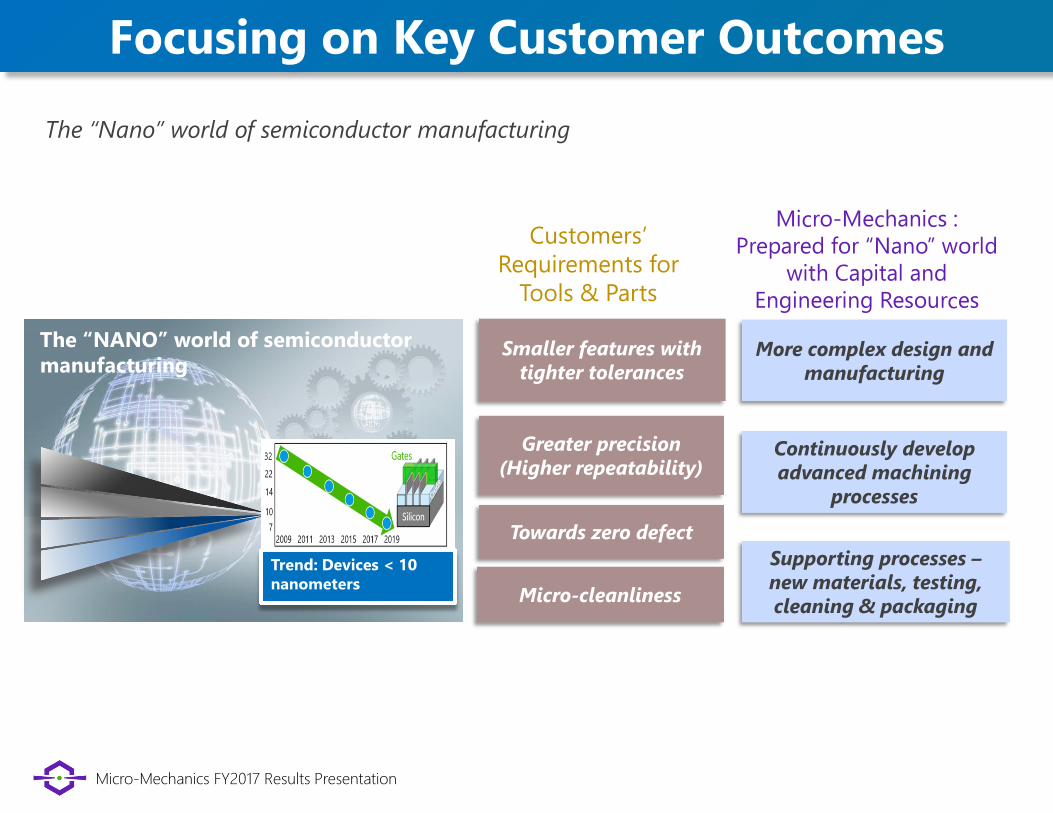
CASH-FLOW GENERATIVE OPERATIONS
8.9 8.810.8
14.116.3
18.1
0
2
4
6
8
10
12
14
16
18
20
FY2012 FY2013 FY2014 FY2015 FY2016 FY2017
(S$ mil)
6.5
2.6
6.64.9 4.1
5.1
0
2
4
6
8
10
12
14
16
18
20
FY2012 FY2013 FY2014 FY2015 FY2016 FY2017
(S$ mil)Track record of healthy net cash
from operating activities CAPEX
Cash Flow

Micro-Mechanics FY2017 Results Presentation
30 June 2017 30 June 2016Cash Cash and cash equivalents S$23.4M# S$20.1MGearing Total borrowings Nil NilTrade Receivables Trade Receivables
(Outstanding > 90days) / (Total trade receivables)Bad debt expense
S$11.0M0.1%
Nil (FY17)
S$9.4M0.1%
S$11.2k (FY16)Inventory Inventory
Inventory / Sales Inventory write-off
S$3.7M6.4%
S$102k (FY17)S$3.3M
6.4%S$76k (FY16)
Equity Shareholders’ equityNAV per share
S$54.8M#39.39 cents
S$50.2M36.14 cents
# Paid final dividends of S$5.6M for FY2016 and interim dividends of S$4.2M for 1H17
Balance Sheet

Micro-Mechanics FY2017 Results Presentation
Safe Harbour for Forward-Looking StatementsThis presentation contains certain statements that are not statements of historical fact, i.e. forward-looking statements.Investors can identify some of these statements by forward-looking items such as ‘expect’, ‘believe’, ‘plan’, ‘intend’,‘estimate’, ‘anticipate’, ‘may’, ‘will’, ‘would’, and ‘could’ or similar words. However, you should note that these words arenot the exclusive means of identifying forward-looking statements. These forward-looking statements are based oncurrent expectations, projections and assumptions about future events. Although Micro-Mechanics (Holdings) Ltd.believes that these expectations, projections, and assumptions are reasonable, these forward-looking statements aresubject to the risks (whether known or unknown), uncertainties and assumptions about Micro-Mechanics (Holdings) Ltd.and its business operations.Some of the key factors that could cause such differences are, among others, the following:• changes in the political, social and economic conditions and regulatory environment in the jurisdictions where weconduct business or expect to conduct business;• the risk that we may be unable to realise our anticipated growth strategies and expected internal growth;• changes in and new developments in technologies and trends;• changes in currency exchange rates;• changes in customer preferences and needs;• changes in competitive conditions in the semiconductor industry and our ability to compete under these conditions;• changes in pricing for our products; and• changes in our future capital needs and the availability of financing and capital to fund these needs.Given these risks, uncertainties and assumptions, the forward-looking events referred to in this presentation may notoccur and actual results may differ materially from those expressly or impliedly anticipated in these forward-lookingstatements. Investors are advised not to place undue reliance on these forward-looking statements.Investors should assume that the information in this presentation is accurate only as of the date it is issued. Micro-Mechanics (Holdings) Ltd.’s business, financial conditions, results of operations and prospects may have changed sincethat day. Micro-Mechanics (Holdings) Ltd. has no obligation to update or revise any forward-looking statement, whetheras a result of new information, future events or otherwise, except as required by law.

31 Kaki Bukit PlaceEunos TechparkSingapore 416209www.micro-mechanics.com
Octant ConsultingTel (65) 6296 [email protected] / [email protected]
INVESTOR RELATIONS CONTACT