Embed Size (px)
Citation preview

Micro Application Example
PI Controller for Simple Applications – Perfectly Regulating the Speed of Motors (with LOGO! and SINAMICS G110) Micro Automation Set 23

Table of Contents
Micro Automation Set 23 Entry ID 23753479
V1.1 01.08.2006 2/38
Cop
yrig
ht ©
Sie
men
s A
G 2
006
All
right
s re
serv
ed
Set
23_D
ocTe
ch_v
2d0_
en.d
oc
Note The Micro Automation Sets are not binding and do not claim to be complete regarding the circuits shown, equipping and any eventuality. The Micro Automation Sets do not represent customer-specific solutions. They are only intended to provide support for typical applications. You are responsible for ensuring that the described products are correctly used. These Micro Automation Sets do not relieve you of the responsibility of safely and professionally using, installing, operating and servicing equipment. When using these Micro Automation Sets, you recognize that Siemens cannot be made liable for any damage/claims beyond the liability clause described. We reserve the right to make changes to these Micro Automation Sets at any time without prior notice. If there are any deviations between the recommendations provided in these Micro Automation Sets and other Siemens publications – e.g. Catalogs – the contents of the other documents have priority.
Warranty, liability and support We accept no liability for information contained in this document.
Any claims against us – based on whatever legal reason – resulting from the use of the examples, information, programs, engineering and performance data etc., described in this Micro Automation Set shall be excluded. Such an exclusion shall not apply in the case of mandatory liability, e.g. under the German Product Liability Act (“Produkthaftungsgesetz”), in case of intent, gross negligence, or injury of life, body or health, guarantee for the quality of a product, fraudulent concealment of a deficiency or breach of a condition which goes to the root of the contract (“wesentliche Vertragspflichten”). However, claims arising from a breach of a condition which goes to the root of the contract shall be limited to the foreseeable damage which is intrinsic to the contract, unless caused by intent or gross negligence or based on mandatory liability for injury of life, body or health. The above provisions does not imply a change in the burden of proof to your detriment.
Copyright© 2006 Siemens A&D. It is not permissible to transfer or copy these Micro Automation Sets or excerpts of them without first having prior authorization from Siemens A&D in writing.

Table of Contents
Micro Automation Set 23 Entry ID 23753479
V1.1 01.08.2006 3/38
Cop
yrig
ht ©
Sie
men
s A
G 2
006
All
right
s re
serv
ed
Set
23_D
ocTe
ch_v
2d0_
en.d
oc
Foreword Micro Automation Sets are fully functional and tested automation configurations based on A&D standard products for easy, fast and inexpensive implementation of automation tasks in small-scale automation. Each of these Micro Automatic Sets covers a frequently used subtask of a typical customer problem in the low-end range.
The sets help the customer to obtain answers with regard to required products and the question how they function when combined.
However, depending on the system requirements, a variety of other components (e.g. other CPUs, power supplies, etc.) can be used to implement the functionality on which this set is based. Please refer to the respective SIEMENS A&D catalogs for these components. The Micro Automation Sets are also available by clicking the following link:
http://www.siemens.de/microset

Table of Contents
Micro Automation Set 23 Entry ID 23753479
V1.1 01.08.2006 4/38
Cop
yrig
ht ©
Sie
men
s A
G 2
006
All
right
s re
serv
ed
Set
23_D
ocTe
ch_v
2d0_
en.d
oc
Table of Contents Table of Contents ......................................................................................................... 4
1 Application Area and Benefits ............................................................................ 5
2 Setup ..................................................................................................................... 8 2.1 Setup plan .............................................................................................................. 8 2.2 Setup plan – Simulating the controlled system ...................................................... 9
3 Hardware and Software Components .............................................................. 10 3.1 Hardware and software components ................................................................... 10 3.2 Additional hardware and software components – Simulating the controlled syst. 12
4 Function Principle.............................................................................................. 13 4.1 Entering the pressure as measured variable and providing it as analog m. value13 4.2 Adjusting the system pressure on a constant level .............................................. 14 4.3 Controlling the asynchronous motor via the analog interface of LOGO! .............. 15 4.4 Monitoring storage tanks and reacting on dry running ......................................... 15 4.5 Simulating the controlled system ......................................................................... 17 4.6 Visualizing the simulated controlled system......................................................... 18
5 Configuring the Startup Software..................................................................... 20 5.1 Preliminary remarks ............................................................................................. 20 5.2 Downloading the startup code.............................................................................. 20 5.3 Configuring Components ..................................................................................... 20
6 Live-Demo........................................................................................................... 26 6.1 Overview of the Live-Demo.................................................................................. 26 6.2 Parameterizing the simulation of the controlled system....................................... 27 6.3 Operating the simulation of the controlled system ............................................... 28 6.4 Recording the simulation of the controlled system............................................... 29 6.5 Simulating the filling level in the storage tank ...................................................... 30 6.6 Editing the setpoint value by using the LOGO! operator panel ............................ 31 6.7 Displaying values by using the LOGO! display .................................................... 32 6.8 Scenario 1: Simulating the disturbance variable and recording the control proc. 32 6.9 Scenario 2: Changing the control parameters...................................................... 34 6.10 Scenario 3: Simulating the dry run of the storage tank ........................................ 35
7 Technical Data.................................................................................................... 36

Application Area and Benefits
Micro Automation Set 23 Entry ID 23753479
1 Application Area and Benefits
Automation task To provide good comprehensibility, the features of the Micro Automation Set are explained using the example of an automation task.
In an injection mold facility, the produced castings are cooled down to a certain end temperature by water cooling. Several consumers are simultaneously connected for cooling down the maximum of three castings.
For optimizing the cooling capacity and for reducing failures, it should be ensured that a constant pressure is always available for the central supply, independent of the number of active consumers. The adjustment of the pump conveying current, and thus the pressure is to be adjusted continuously.
It is to be ensured that the pump is only operated with sufficient supply of cooling water.
V1.1 01.08.2006 5/38
Cop
yrig
ht ©
Sie
men
s A
G 2
006
All
right
s re
serv
ed
Set
23_D
ocTe
ch_v
2d0_
en.d
oc
The current pressure (actual value) as well as the pump operating hours are to be shown in a display. The required pressure of the consumers (setpoint value) must be editable. Figure 1-1
1 2 3
Storage tank(cooling water)
Pressure compensation
vessel Pressure measuring transducer
Pump
Consumer
Filling level monitoring

Application Area and Benefits
Micro Automation Set 23 Entry ID 23753479
Automation solution – Set 23 The Automation solution uses a LOGO! logic module with a connected SITRANS P pressure measuring transducer for recording the current pressure in cooling water circulation.
A PI controller in the LOGO! logic module regulates the pressure by varying the motor speed depending on the currently measured pressure. As a consequence, the pressure of the cooling water facility is maintained at a consistent level, independent of the number of consumers. The cooling capacity is optimized, and failures are prevented by the too low pressure.
The asynchronous motor is connected to a SINAMICS G110 frequency converter getting the setpoint speed as frequency setpoint value via the analog output of the LOGO! expansion module. The speed of the asynchronous motor is adjusted continuously via the SINAMICS G110.
A SIRIUS wire electrode for monitoring the level is connected to a SIRIUS monitoring relay. This monitors whether the pump is supplied with liquid during its operation. The monitoring status of the SIRIUS monitoring module is passed on at a digital input of the LOGO! logic module.
V1.1 01.08.2006 6/38
Cop
yrig
ht ©
Sie
men
s A
G 2
006
All
right
s re
serv
ed
Set
23_D
ocTe
ch_v
2d0_
en.d
oc
The current pressure of the cooling water facility, the setpoint pressure and operating hours of the pump can be directly displayed on the integrated display of the LOGO! logic module. The setpoint pressure of the cooling water facility can be additionally edited.
Figure 1-2 L1
N
LOGO! Power LOGO! Logic module LOGO! AM2 AQ SIRIUS Monitoring relais G110 Asynchronous motor
1 2
4
7
63
5
8
1 2 3 4 5 6
SITRANS P Pressure sensor SIRIUS Probe for level monitoring7 8

Application Area and Benefits
Micro Automation Set 23 Entry ID 23753479
V1.1 01.08.2006 7/38
Cop
yrig
ht ©
Sie
men
s A
G 2
006
All
right
s re
serv
ed
Set
23_D
ocTe
ch_v
2d0_
en.d
oc
Application Areas The Micro Automation Set is particularly suitable for reasonable and comfortable speed control of motors. The speed of the asynchronous motor is changed continuously to react on disturbance variables in the system.
The Micro Automation Set is particularly suitable for the following sectors and application cases:
• Water / waste water supply
• Oil and gas industry
• Bottling plants
• Building technologies Pump control
• Machine control: Air extraction systems, mixing machines
Benefits • Favorable and continuous speed control
• Drive tasks of the SINAMICS G110 can be easily and directly connected to the sensor and control functions of the LOGO!
• Protection and monitoring functions via SINAMICS G110
• Excellent energy efficiency due to a motor power adjusted to consumption
• Direct display of messages and device conditions with the integrated display of the LOGO!
• Simple parameter change of the control functions of LOGO! via the integrated operator functions of LOGO!

Setup
Micro Automation Set 23 Entry ID 23753479
2 Setup
2.1 Setup plan
Figure 2-1
V1.1 01.08.2006 8/38
Cop
yrig
ht ©
Sie
men
s A
G 2
006
All
right
s re
serv
ed
Set
23_D
ocTe
ch_v
2d0_
en.d
oc
MaxMin
M
+UO-UB+UB
L1N
DC24V+DC24V-
PE
1 2 3 4 5 6 7 8 9 10
U1
V1
W1
U V W
1 2 3 4
5
6
7
8
I8I1
Q1.1 Q1.2
Circ
uitb
reak
er NH-fuse set
This setup plan shows the wiring of the necessary components to enable you to use the standard functions of the Micro Automation Set 23.
Note
Das Micro Automation Set 23 consists of a LOGO! logic module (2) with relay outputs and integrated time function. A SITRANS P pressure measuring transducer (7) is connected to an integrated analog input of the LOGO! logic module.
The LOGO! AM2 AQ (3) is used as an expansion module with two analog outputs. An analog output is connected to the SINAMICS G110 frequency converter (5). The SIRIUS monitoring relay (4) is connected to a digital input of the LOGO! logic module, and the three-pole wire electrode (8) is connected to the SIRIUS monitoring relay.
The asynchronous motor (6) is connected to the SINMAICS G110 frequency converter.
The 24V energy supply of the devices is provided by a LOGO! Power 1.3A (1).

Setup
Micro Automation Set 23 Entry ID 23753479
2.2 Setup plan – Simulating the controlled system
Figure 2-2
DC24V+DC24V-
PE
1M I0.0
M I V M A+
B+
Q1.2 V1+
I8Standard PC
• STEP 7-Micro/WIN• PC Access• MS Excel
1
2
V1.1 01.08.2006 9/38
Cop
yrig
ht ©
Sie
men
s A
G 2
006
All
right
s re
serv
ed
Set
23_D
ocTe
ch_v
2d0_
en.d
oc
The setup plan shows the wiring of the components when using the simulation of the controlled system. The wiring is made in addition to the wiring described in Chapter 2.2. The SITRANS P pressure measuring transducer has to be removed. The functionalities of the simulation are described in Chapter 4.5.
You require a S7-200 CPU 224 XP (1) for simulating the controlled system of the Micro Automation Set.
Via a USB-PPI cable, a standard PC (2) with the Port 0 of the S7-200 controller.

Hardware and Software Components
Micro Automation Set 23 Entry ID 23753479
V1.1 01.08.2006 10/38
Cop
yrig
ht ©
Sie
men
s A
G 2
006
All
right
s re
serv
ed
Set
23_D
ocTe
ch_v
2d0_
en.d
oc
3 Hardware and Software Components
3.1 Hardware and software components
Note By using this component you can employ the Micro Automation Set 23 with the standard functionalities.
The cooling water facility simulated here is designed for a 1.1 kW asynchronous motor with an appropriate SINAMICS G110 frequency converter. As an alternative you can use a cheaper and easier variant which is consequently more suitable for a test setup.
Products Table 3-1
Component Qty. MLFB / Order Number Note
LOGO! Power 24V/1,3A 1 6EP1331-1SH02 LOGO! 12/24RC 1 6ED1052-1MD00-0BA5 DC LOGO! AM2 AQ 1 6ED1055-1MM00-0BA0 SIRIUS (level) monitoring relay
1 3UG3501-1AL20
SITRANS P pressure measuring transducer
1 7MF1564-3BB10-1AA1 0 to 1.6 bar
Wire electrode for level monitoring
3UG3207-3A three-pole
Standard: SINAMICS G110 frequency converter
1 6SL3211-0AB21-5AA1 Analog with EMV- Filter
Alternatively: SINAMICS G110 frequency converter
1 6SL3211-0AB13-7BA1 Analog with EMV-Filter
Standard: Asynchronous motor
1 1LA7083-2AA10
Alternatively: Asynchronous motor
1 1LA7060-4AB10
Accessories Table 3-2
Component Qty. MLFB / Order Number Note
Miniature circuit-breaker 1 5SX2116-6 1 pol. B, 16A
NH-fuse set 1 3NA3810 + 3NH3030
25A + socket
Alternatively: 1 3NA3803 10A

Hardware and Software Components
Micro Automation Set 23 Entry ID 23753479
V1.1 01.08.2006 11/38
Cop
yrig
ht ©
Sie
men
s A
G 2
006
All
right
s re
serv
ed
Set
23_D
ocTe
ch_v
2d0_
en.d
oc
Component Qty. MLFB / Order Number Note NH-fuse set + 3NH3030 + socket Top hat rail installation kit 1 6SL3261-1BA00-0AA0 for G110 G110 Basic Operator Panel 1 6SL3255-0AA00-4BA0 Feed-through terminal, beige 8WA1011-1DF11 Ø 2.5 mm² to
24A>800V PE feed-through terminal 8WA1011-1PF00 Ø 2.5 mm² Bridge 8WA1822-7VF01 Standard DIN rail 35mm 1 6ES5 710-8MA11 483 mm
Configuration software/tools Table 3-3
Component Qty. MLFB / Order Number Note
LOGO!Soft Comfort 1 6ED1058-0BA01-0YA0 LOGO! PC cable 1 6ED1057-1AA00-0BA0 COM

Hardware and Software Components
Micro Automation Set 23 Entry ID 23753479
V1.1 01.08.2006 12/38
Cop
yrig
ht ©
Sie
men
s A
G 2
006
All
right
s re
serv
ed
Set
23_D
ocTe
ch_v
2d0_
en.d
oc
3.2 Additional hardware and software components – Simulating the controlled system
Note By using this component you can employ the Micro Automation Set 23 with an extended functionality. The components mentioned here are required in addition to the hardware and software described in Chapter 3.1.
If the 1.1 kW asynchronous motor mentioned in Chapter 3.1 is not used, the parameters of the controlled system are to be adjusted according to the technical data of the alternatively used asynchronous motor.
Products Table 3-4
Component Qty. MLFB / Order Number Note
S7-200 CPU 224 XP 1 6ES7 214-2AD23-0XB0 DC
Accessories Table 3-5
Component Qty. MLFB / Order Number Note
PC/PPI cable 1 6ES7 901-3DB30-0XA0 USB
Configuration software/tools Table 3-6
Component Qty. MLFB / Order Number Note
SIMATIC STEP 7-Micro/WIN
1 6ES7810-2CC03-0YX0
PC Access by using SP2 (OPC Server)
1 6ES7840-2CC01-0YX0 or Test version (60 days) http://siemens.de/s7-200
Microsoft Excel 1 ---

Function Principle
Micro Automation Set 23 Entry ID 23753479
4 Function Principle
4.1 Entering the pressure as measured variable and providing it as analog measured value
Table 4-1
No. Function Comment
1. The measured variable of this cooling water circulation is the pressure. A pressure measuring transducer is used for measuring this variable.
2. The SITRANS P pressure measuring transducer is used for converting a physical pressure into a electrical signal. An expansion measuring strip attached to a ceramic diaphragm, is in the stainless steel casing.
V1.1 01.08.2006 13/38
Cop
yrig
ht ©
Sie
men
s A
G 2
006
All
right
s re
serv
ed
Set
23_D
ocTe
ch_v
2d0_
en.d
oc
Stainless steel casingDiaphragm
DMS
3. If the operating pressure p is applied to the ceramic diaphragm, the DMS will be stretched or extended.
U
Uconst.
Repeater
UOThe resulting higher or lower resistance causes a voltage drop, which is fed to the repeater and converted to an output voltage of DC 0 to 10V.
Transformer
Measuring signal
(The output pressure is linear proportional to the input pressure)
4. Via the integrated analog input at the LOGO! logic module, the measurement voltage (0 to 10 V) of the pressure measuring transducer is continuously picked up. You can calculate the current pressure via the scaling of the pressure measuring range 0 to 1.6 bar and the voltage range 0 to 10 V. (The conversion p V is used as illustration. In the LOGO! logic module, the measuring signal is used in V)
bar
V0
0 1
10
,6
Measuring signal
1.06 V= 0.17 bar
0,80
5
1.06V
0.17bar

Function Principle
Micro Automation Set 23 Entry ID 23753479
4.2 Adjusting the system pressure on a constant level
Figure 4-1
PIPIP setpoint
P actual
+-
∆P+
Consumer 1,2 u 3Q c
Distance
-
SensorQ Pn setp
Table 4-2
No. Function Comment
1. To provide the consumers of the cooling water system with the same pressure even in case of variable load, a PI controller is employed.
2.
V1.1 01.08.2006 14/38
Cop
yrig
ht ©
Sie
men
s A
G 2
006
All
right
s re
serv
ed
Set
23_D
ocTe
ch_v
2d0_
en.d
oc
The measured actual pressure value (PActual) will be compared to the Setpoint value (PSetpoint) stored in the LOGO! logic module. The PI controller compensates for the difference ∆P by calculating a setpoint speed.
0.17 bar
PIPI0.29 barP setpoint
P Ist
+-
∆Pn setpoint
2010 min-1
3. • The difference ∆P is compensated by
increasing or reducing the motor speed nSetpoint and thus the conveying current QP.
• If the speed of the motor nSetpoint is increased, more cooling water QP will be conveyed and the pressure PAcutal in the system will rise.
• If the speed of the motor nSetpoint is reduced, less cooling water QP will be conveyed and the pressure PAcutal in the system will go down.
DistanceDistance
n setpoint Q P2010 min-1 9 m³/h
+

Function Principle
Micro Automation Set 23 Entry ID 23753479
No. Function Comment
4. The difference ∆P is caused by the variable load (consumer current QC) of consumers 1, 2 and 3.
V1.1 01.08.2006 15/38
Cop
yrig
ht ©
Sie
men
s A
G 2
006
All
right
s re
serv
ed
Set
23_D
ocTe
ch_v
2d0_
en.d
oc
• If more consumers are connected, the consumer current QC will increase and the pressure PActual in the system will go down.
• If consumers are disconnected, the consumer current QC will go down and the pressure PActual in the system will increase.
Distance
-Consumer 2 and 3 active
- 8.0m^3/hQ c
SensorDistance
Q P9.0m³/h
+ Sensor
4.3 Controlling the asynchronous motor via the analog interface of LOGO!
Table 4-3
No. Function Comment
1. The setting (0 to 10 V) for the motor speed nSetpoint is continuously transferred by the LOGO! expansion module AM2 AQ to the SINAMICS G110 and there it is scaled to a frequency setpoint value (0 to 50 Hz). The lower and upper limit of the frequency setpoint value depends on the minimum and maximum motor frequency parameterized in the SINAMICS G110 (P1080=min and P1082=max).
Setting
V
Hz0
0 10
50
5
25
33.35 Hz
6.67V
6.67 V= 33.35 Hz
2. The asynchronous motor connected to the SINAMICS G110 accelerates or delays the frequency setpoint value stated by the frequency converter. (nSetpoint nActual)
Hz
nsetpoint nactual
25
50
The period between acceleration and delay of the frequency setpoint value nSetpoint to the actual motor speed nActual depends on the startup time and ramp-down time parameterized in the SINAMICS G110 (P1122=Startup time and P1121=Ramp down time)
(33.35 Hz – 13.00 Hz)
50 Hz10 s* 4.07 s
(nsetpl – nact)
P1082P1121*∆n in t=
Example at P1082 = 50Hz and P1122 =10s
33,35
13,00
Function Principle
Micro Automation Set 23 Entry ID 23753479
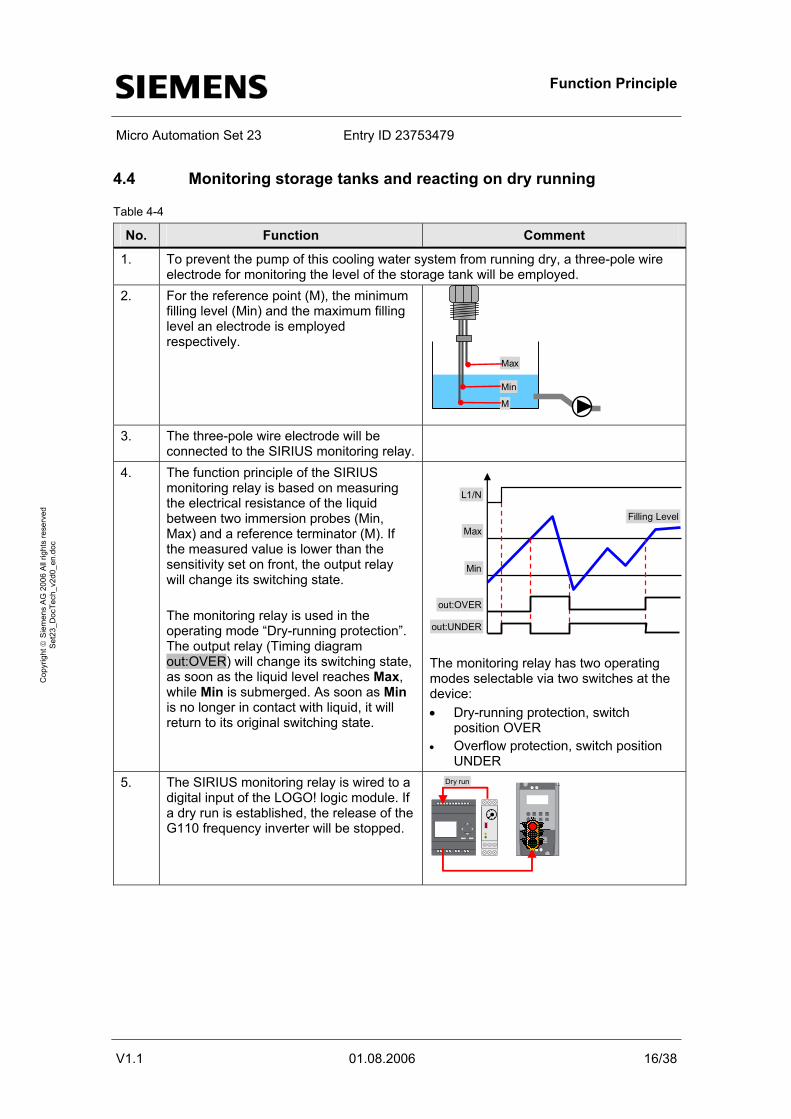
4.4 Monitoring storage tanks and reacting on dry running
Table 4-4
No. Function Comment
1. To prevent the pump of this cooling water system from running dry, a three-pole wire electrode for monitoring the level of the storage tank will be employed. For the reference point (M), the minimum filling level (Min) and the maximum filling level an electrode is employed respectively.
Max
Min
M
2.
3.
V1.1 01.08.2006 16/38
Cop
yrig
ht ©
Sie
men
s A
G 2
006
All
right
s re
serv
ed
Set
23_D
ocTe
ch_v
2d0_
en.d
oc
The three-pole wire electrode will be connected to the SIRIUS monitoring relay.
4. The function principle of the SIRIUS monitoring relay is based on measuring the electrical resistance of the liquid between two immersion probes (Min, Max) and a reference terminator (M). If the measured value is lower than the sensitivity set on front, the output relay will change its switching state. The monitoring relay is used in the operating mode “Dry-running protection”. The output relay (Timing diagram out:OVER) will change its switching state, as soon as the liquid level reaches Max, while Min is submerged. As soon as Min is no longer in contact with liquid, it will return to its original switching state.
L1/N
Max
Min
out:OVER
out:UNDER
Filling Level
The monitoring relay has two operating modes selectable via two switches at the device: • Dry-running protection, switch
position OVER • Overflow protection, switch position
UNDER
Dry run
The SIRIUS monitoring relay is wired to a digital input of the LOGO! logic module. If a dry run is established, the release of the G110 frequency inverter will be stopped.
5.

Function Principle
Micro Automation Set 23 Entry ID 23753479
V1.1 01.08.2006 17/38
Cop
yrig
ht ©
Sie
men
s A
G 2
006
All
right
s re
serv
ed
Set
23_D
ocTe
ch_v
2d0_
en.d
oc
Note You can connect other resistance sensors in the range of 5 to 100 kOhm, e.g. photo resistor, temperature sensors, position encoder on resistance basis etc. to the Min. and Max. terminals of the SIRIUS monitoring relay. Thus, the monitoring relay is not only suitable for monitoring the level of liquids.

Function Principle
Micro Automation Set 23 Entry ID 23753479
4.5 Simulating the controlled system
Table 4-5
Function Comment No. You can simulate the controlled system of this cooling water application by using the S7-200 controller (see Chapter 3.2). Thus the application can be tested without a complex setup under almost real conditions.
1.
The S7-200 controller is continuously calculating the actual pressure value PActual and transfers it to the LOGO! logic module with the integrated analog voltage output. The current signal of the SITRANS pressure measuring transducer is simulated by the analog output of the S7-200 controller.
P actual
2.
V1.1 01.08.2006 18/38
Cop
yrig
ht ©
Sie
men
s A
G 2
006
All
right
s re
serv
ed
Set
23_D
ocTe
ch_v
2d0_
en.d
oc
The LOGO! logic module is continuously transferring the setpoint motor speed nSetpoint via the analog output of the LOGO! module AM2 AQ to the S7-200 controller.
n setpoint
3.
The distance to be controlled by the LOGO! logic module, is implemented in the S7-200 controller as follows.
PIQ
H
H
Pnact
QAn
Q
t
QP HA
A
Q
-
+
QC
Consumer 1,2,3S7-200 ControllerLOGO!
nSet
Pact
1 2
3
4 5
4.
5. (1) A PT1 element in the S7-200 controller simulates the delay of the speed setpoint nSetpoint to the actual motor speed nActual.
nact
t
nSet

Function Principle
Micro Automation Set 23 Entry ID 23753479
Function Comment No.
(2) The conveyor current of pump QP is calculated on the basis of the current motor speed nActual, the quality of the used pump and the asynchronous motor.
-
nact
n
QQP +
6.
(3) The consumed consumer current QC is calculated depending on the number of consumers.
A
Q
-
+
QC
Consumer 1,2,3
1 2 3
7.
V1.1 01.08.2006 19/38
Cop
yrig
ht ©
Sie
men
s A
G 2
006
All
right
s re
serv
ed
Set
23_D
ocTe
ch_v
2d0_
en.d
oc
(4) The difference the conveying current of the pump and the consumer current results in a conveying current QA being proportional to the pressure drop. According to the curve on the right the delivery head is HA ~ QA².
Q
H HA
QA+
8.
H
PHAPact
(5) The actual pressure value PActual is calculated from the delivery head HA.
9.
4.6 Visualizing the simulated controlled system
Table 4-6
No. Function Comment
1. The simulation of all system parameters of the cooling water system is made via the S7-200 controller.
MS Excel (OPC Client)
PC Access (OPC Server)
Via the PC-Access OPC server and MS Excel as OPC client, all system parameters of this simulation can be displayed and processed.
MS Excel (OPC Client)
MS Excel (OPC Client)
PI Distance Sensor

Function Principle
Micro Automation Set 23 Entry ID 23753479
V1.1 01.08.2006 20/38
Cop
yrig
ht ©
Sie
men
s A
G 2
006
All
right
s re
serv
ed
Set
23_D
ocTe
ch_v
2d0_
en.d
oc
No. Function Comment
2. It is possible to log the process data of the simulated controlled system via the MS Excel OPC client. The process data will be buffered in the S7-200 controller and transferred to the OPC client subject to recall. By using the MS Excel standard means, you can create a layout (diagram).
The following values are logged: • Actual speed • Number of consumers • Actual pressure • Setpoint pressure

Configuring the Startup Software
Micro Automation Set 23 Entry ID 23753479
5 Configuring the Startup Software
5.1 Preliminary remarks
For the startup we offer you software examples with test code and test parameters as download. The software examples support you during the first steps and tests with your Micro Automation Sets. They enable quick testing of hardware and software interfaces between the products described in the Micro Automation Sets.
The software examples are always assigned to the components used in the set and show their basic interaction. However, they are not real applications in the sense of technological problem solving with definable properties.
V1.1 01.08.2006 21/38
Cop
yrig
ht ©
Sie
men
s A
G 2
006
All
right
s re
serv
ed
Set
23_D
ocTe
ch_v
2d0_
en.d
oc
5.2 Downloading the startup code
The software examples are available on the HTML page from which you downloaded this document. Table 5-1
No. Version File name Contents
1 Standard Set23_LOGO!_V2d0_en.lsc LOGO!Soft Comfort 2 Set23_S7-200_V2d2_en.mwp STEP 7-Micro/WIN 3 Set23_ExcelOPC_V2d0_en.xls MS Excel 4
Simulation Set23_PC-access_V2d1_en.pca PC-Access
5.3 Configuring Components
It is assumed here that the necessary software has been installed on your computer and that you are familiar with handling the software.
Note
Please carefully read all safety and warning notices given in these operating instructions, and all warning labels attached to the device before installing and commissioning the SINAMICS G110. Please maintain warning labels in a legible condition and do not remove them from the device.
! Warning

Configuring the Startup Software
Micro Automation Set 23 Entry ID 23753479
5.3.1 Configuring components – Standard functionality
Installing and wiring hardware
Table 5-2
Action Comment No.
1. Mount the components of Chapter 3.1 to the top hat rail.
2. Connect the LOGO! expansion module to the LOGO! logic module and let the clip snap in (see comment).
V1.1 01.08.2006 22/38
Cop
yrig
ht ©
Sie
men
s A
G 2
006
All
right
s re
serv
ed
Set
23_D
ocTe
ch_v
2d0_
en.d
oc
3. Attach the G110 Basic Operator Panel
(BOP) to the SINAMICS G110 frequency converter.
4. Wire all components together. Do not switch on the power supply.
See Chapter 2.1
Switch on the power supply for LOGO! Power. Do not activate the power supply of the SINAMICS G110 frequency converter yet.
5.
Configuring the LOGO! logic module Table 5-3
Action Comment No.
Connect your PC to the COM 1 with the LOGO! logic module via the LOGO! PC cable.
1. LOGO! PC cable
Configuration PC Open the file Set23_LOGO!_V2d0_en.lsc with the LOGO!Soft Comfort.
2.
3. Download the project via the “Extras\Transfer\PC -> LOGO!“ into the LOGO! logic module.

Configuring the Startup Software
Micro Automation Set 23 Entry ID 23753479
No. Action Comment
Set the LOGO! logic module to the “RUN“ mode.
4.
Configuring the SIRIUS monitoring relay Table 5-4
No. Action Comment
1.
V1.1 01.08.2006 23/38
Cop
yrig
ht ©
Sie
men
s A
G 2
006
All
right
s re
serv
ed
Set
23_D
ocTe
ch_v
2d0_
en.d
oc
The SIRIUS monitoring relay is to be set to the desired sensitivity. By using the potentiometer (setting wheel) you set the specific resistance of the liquid to be monitored.
Product kOhm Product kOhmButter milk 1Fruit juice 1Vegetable juice 1Milk 1Soup 2,2Beer 2,2Coffee 2,2Ink 2,2Salt water 2,2Wine 2,2
Natural water 5Waste water 5Starch solution 5Oil 10Condensation 18Lather 18Jams 45Jelly 45Sugar solution 90Whisky 220Distilled water 450
Set the sensitivity to 5 kOhm.
OVERUNDER
The monitoring mode of the SIRIUS monitoring relay is to be set dry run. Turn the DIP switch to “OVER“.
2.
Parameterizing SINAMICS G110 Table 5-5
No. Action Value Value Alternative
Comment
1. Activate the voltage supply for the SINAMICS G110. 2. Press the Parameter key of the SINAMICS G110 BOP to
come to the parameterization mode. When using the arrow keys you come to the parameters described in the following. The values to be entered into the columns “Value Standard“ and “Value Alternative“ refer to the asynchronous motors of Chapter 3.1.
1x P 00000000
3. Start the fast commissioning. 1 P 0010P 0010 + P 4. Set the country settings to Europe. 0 P 0100P 0100 + P
5. Set the rated motor voltage to 230V. 230 P 0304P 0304 + P

Configuring the Startup Software
Micro Automation Set 23 Entry ID 23753479
No. Action Value Value Alternative
Comment
6. Set the rated motor current to 4.33 or 0.73 A.
4.33 0.73 P 0305P 0305 + P
7. Set the rated motor output to 1.15 or 0.12 kW.
1.15 0.12 P 0307P 0307 + P
8. Set the rated motor frequency to 50Hz.
50 P 0310P 0310 + P
9. Set the nominal motor speed to 2837 or 1350 min-1.
2837 1350 P 0311P 0311 + P
10. Select the terminal strip as command source of the SINAMICS G110.
2 P 0700P 0700 + P
11. Select the analog input as source for the frequency setpoint value of the SINAMICS G110 .
2 P 1000P 1000 + P
12. Set the minimum frequency to 0Hz.
V1.1 01.08.2006 24/38
Cop
yrig
ht ©
Sie
men
s A
G 2
006
All
right
s re
serv
ed
Set
23_D
ocTe
ch_v
2d0_
en.d
oc
0 P 1080P 1080 + P
13. Set the maximum frequency to 50Hz. 50 P 1082P 1082 + P
14. Set the startup time from the minimum to the maximum speed of the asynchronous motor to 3s.
3 P 1120P 1120 + P
15. Set the startup time from the maximum to the minimum speed of the asynchronous motor to 3s.
3 P 1121P 1121 + P
16. 1 P 3900P 3900 + P Exit the fast commissioning.
Exit the parameterization mode by pressing the parameter key while having activated the operating mode (r0000).
n x / 00000000 + P
17.
5.3.2 Configuring the components – Simulating the controlled system
Installing and wiring hardware Table 5-6
Action Comment No.
1. Mount the components of Chapter 3.2 to the top hat rail.
2. Wire all components together. See Chapter 2.2 The SITRANS P pressure measuring transducer has to be removed.
Do not switch on the power supply.
Switch on the power supply for LOGO! Power.
3.

Configuring the Startup Software
Micro Automation Set 23 Entry ID 23753479
Configuring the S7-200 controller Table 5-7
Action Comment No.
Connect the PC to a USB Port with the S7-200 controller to the Port 0 by using the USB-PC/PPI cable.
1.
Configuration PC
PC/PPI cabel
2. Open the file Set23_S7-200_V2d2_en.mwp with STEP 7-Micro/WIN.
V1.1 01.08.2006 25/38
Cop
yrig
ht ©
Sie
men
s A
G 2
006
All
right
s re
serv
ed
Set
23_D
ocTe
ch_v
2d0_
en.d
oc
3. Carry out the following settings in the “PG/PC Interface“ under “Start/Settings/Control Panel“. • Access point of the application
Micro/WIN PC/PPI cable(PPI) • Transmission rate:
187.5 Kbit/s • Local connection: • USB
Transfer the project to the S/-200 controller via ”File/Load to CPU“.
4.
Set the S7-200 controller to the “RUN“ mode.
5.
Configuring the OPC Server PC-Access Table 5-8
Action Comment No.
Open the file Set23_PC-access_V2d1_en.pca with the PC-Access.
1.
2. Save the project under any name. The OPC Server of the PC Access always uses the items of PCA file last saved. The process should only be done once.

Configuring the Startup Software
Micro Automation Set 23 Entry ID 23753479
Configuring the OPC Client MS Excel Table 5-9
Action Comment No.
1. Open the file Set23_ExcelOPC_V2d0_en.xls with MS Excel.
2. Add the OPC S7-200 Excel Add-In via “Extras/Add-Ins“. The *.xla file is in your PC-Access installation path.
Default installation path: C:\Program Files\Siemens\S7-200 PC Access Add-In: Bin\OPCS7200ExcelAddin.xla
V1.1 01.08.2006 26/38
Cop
yrig
ht ©
Sie
men
s A
G 2
006
All
right
s re
serv
ed
Set
23_D
ocTe
ch_v
2d0_
en.d
oc
Activate the tool bar for the OPC S7-200 Excel Add-In via “View/Toolbars“.
3.
Via “Start Data Acquisition“ in the toolbar you can now start the OPC MS Excel Client.
4.
By means of a symbol in the info area of the task bar you can see whether the OPC Server is started.
5.

Live-Demo
Micro Automation Set 23 Entry ID 23753479
6 Live-Demo
The features of the Micro Automation Set 23 were “packed” in an application example describing the cooling water system for an injection mold facility.
The functionalities and features of program codes and hardware can be tested as follows if the components specified in Chapter 5.3 have been configured correctly.
6.1 Overview of the Live-Demo
V1.1 01.08.2006 27/38
Cop
yrig
ht ©
Sie
men
s A
G 2
006
All
right
s re
serv
ed
Set
23_D
ocTe
ch_v
2d0_
en.d
oc
Figure 6-1
Start
End
This
thro
ughp
ut c
an b
e re
peat
ed a
s of
ten
as y
ou li
ke.
Pos
sibl
e sc
enar
ios
are
liste
d in
tabl
e 6-
1.
Observing the behavior of the controlled system and interfering with
the control process.(chapt. 6.3)
Parameterizing the simulation of the controlled system (chapt. 6.2)
Simulating the cooling water level in the storage tank (chapt. 6.5)
Displaying the values directly at LOGO! logic module. (Chapt. 6.7)
Processing the values directly via the LOGO! logic module. (chapt. 6.6)
Logging behavior of the controlled system and its graphic display. (Kap. 6.4)
MAS 23 – Standard functionality
MAS 23 – Simulating the
controllerd system
Table 6-1
Description Chapter Scenario
1. Switching the consumers of the cooling water system on or off 6.8 Optimizing the PI control by changing the control parameters (P- and I-parts) in the LOGO! as well as the startup and ramp-down time of the frequency inverters
6.9 2.
3. Simulating the dry run in the storage tank 6.10

Live-Demo
Micro Automation Set 23 Entry ID 23753479
6.2 Parameterizing the simulation of the controlled system
OPC MS Excel Client – Page 2 Figure 6-2
V1.1 01.08.2006 28/38
Cop
yrig
ht ©
Sie
men
s A
G 2
006
All
right
s re
serv
ed
Set
23_D
ocTe
ch_v
2d0_
en.d
oc
12
34
5
6789
1011
The default values are aligned to the SINAMICS G110 frequency converter and the asynchronous motor “Standard“ of Chapter 3.2. A change of the default values requires a change of the hardware or the parameters of the fictive cooling water. To change the parameters, enter the desired value in the yellow input fields of the “Fix parameters“ operating image with an active OPC connection and confirm with “Write to PLC“. (1) The height between the surface of the liquid level at the inlet side and the number of the
consumers to be provided
(2) Highest admissible pressure in the cooling water system
(3) Conveying current of the pump in case of nominal speed of the asynchronous motor
(4) Delivery head of the pump in case of nominal speed of the asynchronous motor
(5) Nominal speed of the asynchronous motor
(6) Maximum speed of the asynchronous motor (G110 parameter P1080) (7) Minimum speed of the asynchronous motor (G110 parameter P1082) (8) Duration of the acceleration of min. speed to max. speed (G110 parameter P1120) (9) Duration of the dealy of max. speed to min. speed (G110 parameter P1121)
(10) Highest admissible pressure of the pressure measuring transducer
(11) Lowest admissible pressure of the pressure measuring transducer

Live-Demo
Micro Automation Set 23 Entry ID 23753479
6.3 Operating the simulation of the controlled system
OPC MS Excel Client – Page 1 Figure 6-3
V1.1 01.08.2006 29/38
Cop
yrig
ht ©
Sie
men
s A
G 2
006
All
right
s re
serv
ed
Set
23_D
ocTe
ch_v
2d0_
en.d
oc
123
4567
89
10 11
12
In the “Simulation“ operating image, the controlled system is displayed in the S7-200 controller and the process values are visualized. By means of the cooling water consumption, which is determined via the editable number of consumers, you can interfere in the control process. (1) Setpoint speed of the asynchronous motor
(2) Actual speed of the asynchronous motor (the delay is taken into account)
(3) Conveying current of the pump
(4) Consumers (1, 2 or 3), input by user
(5) Consumer current caused by the number of consumers
(6) Conveying current in the cooling water system less the required current
(7) Delivery head
(8) Setpoint pressure in the cooling water system. When changing the LOGO! logic module the setpoint value is to be changed as well. The default value in the LOGO! logic module is 1.81V. (corresponds to 0.29 bar)
(9) Actual pressure in the cooling water system
(10) Diagram for illustrating the difference between setpoint speed and actual speed
(11) Diagram for illustrating the difference between setpoint pressure and actual pressure
(12) Controlled system in the S7-200 control

Live-Demo
Micro Automation Set 23 Entry ID 23753479
6.4 Recording the simulation of the controlled system
OPC MS Excel Client – Page 3 Figure 6-4
V1.1 01.08.2006 30/38
Cop
yrig
ht ©
Sie
men
s A
G 2
006
All
right
s re
serv
ed
Set
23_D
ocTe
ch_v
2d0_
en.d
oc
123
45
6
7
In the “Data Logging/Graph“ operating image, you can log the behavior of the controlled system in the S7-200 controller via a settable period of time. You can generate and display a maximum of 249 data records. (1) Interval in milliseconds in which the process data are saved.
(2) In the ring buffer, old process data are overwritten by new process data Lend = 1. Process data are written until the buffer is filled Lend = 0.
(3) The recording of the process data is restarted after an increase or decrease of the consumers Ltrig = 1. The process data are continuously recorded Ltrig =0.
(4) Buffer size of the process data (10 to 249 data records).
(5) Data record last filled with writing.
(6) All logged process data are retrieved from the buffer of the S7-200 control. The process data are stored in the “Data Source for Data Logging/Graph“ operating image. The following process data are logged:
a. Actual speed,
b. Number of consumers,
c. Actual pressure and
d. Setpoint pressure.
(7) The logged process values are displayed in the diagram in a visualized form. If necessary, the data source of the diagram is to be set via “Right Click/Data Source/Series“. The process values are displayed in percent to ensure a better overview.

Live-Demo
Micro Automation Set 23 Entry ID 23753479
6.5 Simulating the filling level in the storage tank
In this cooling water system the pump will be blocked as soon as a low filling level of the storage tank is established. Due to the default settings this tank is empty Thus the pump will be blocked.
The following steps are to be carried out for simulating a sufficient filling level of the storage tank or a dry run.
Table 6-2
No. Action Comment
1. All electrodes of the probe for level monitoring should get contact with the water. For example a glass of water can be used as storage tank. Max
Min
M
V1.1 01.08.2006 31/38
Cop
yrig
ht ©
Sie
men
s A
G 2
006
All
right
s re
serv
ed
Set
23_D
ocTe
ch_v
2d0_
en.d
oc
2. • The SIRIUS monitoring relay controls
the relay output. • The yellow LED is on. • The connected LOGO! logic module
controls the output for releasing the SINAMICS G110 and
• Starts simultaneously the operating hours counter.
The simulation in the S7-200 controller will not be started without the release of the SINAMICS G110 frequency converter.
Filling level OK!
3. To simulate the dry run, the electrode (Max) and the electrode (Min) of the probe for level monitoring may not be in contact with water.
Max
Min
M 4. • The SIRIUS monitoring relay
deactivates the relay output. • The yellow LED goes out. • The connected LOGO! logic module
deactivates the output for activating the SINAMICS G110 and
• The operating hours counter is stopped.
Dry run!

Live-Demo
Micro Automation Set 23 Entry ID 23753479
6.6 Editing the setpoint value by using the LOGO! operator panel
If the system parameters of the cooling water system are to be changed, you should be able to change the setpoint value stored in the LOGO! logic module.
Apart from the possibility to change it directly in the LOGO!Soft Comfort project file, you can also change it via the integrated operator buttons of the LOGO! logic module.
Table 6-3
Action Comment No.
Press the cursor “Down“ key of the LOGO! logic module until the date and the time are displayed on the LOGO! logic module.
5.
V1.1 01.08.2006 32/38
Cop
yrig
ht ©
Sie
men
s A
G 2
006
All
right
s re
serv
ed
Set
23_D
ocTe
ch_v
2d0_
en.d
oc
ESC OK
MO 10:452006-07-25
s
LOGO! 12/24RC
Press the “ESC“ key (1). Select the menu item “SET PRAM” with the cursor keys (2) and confirm with “OK“ (3).
ESC OK
StopSet ParamSetPrg Name
s
LOGO! 12/24RC
>
1
2
2
3
6.
Select the block “B1:1” with the cursor keys (1). With the “OK“ key (2) you select the parameter “SP“ an. By using the cursor keys (1) the value can be changed to Volt (181 = 1.81 V) and confirmed with “OK“ (2).
ESC OK
B1 1SP= +00181PV= +00188AQ= +00000
s
LOGO! 12/24RC
1
1
2
7.
8. The setpoint value for the PI controller in the LOGO! logic module is now changed. In parallel, the new setpoint value for simulating the controlled system is to be transferred to the S7-200 controller.
Please see Chapter 6.2.2, item 8.

Live-Demo
Micro Automation Set 23 Entry ID 23753479
6.7 Displaying values by using the LOGO! display
When using the LOGO! logic module display, some process data of the PI control are displayed.
Table 6-4
No. Action Comment
9. In the default message text of the LOGO! logic module, the current actual pressure of the cooling water system and the setpoint speed of the asynchronous motor are displayed. The values are displayed in Volt.
V1.1 01.08.2006 33/38
Cop
yrig
ht ©
Sie
men
s A
G 2
006
All
right
s re
serv
ed
Set
23_D
ocTe
ch_v
2d0_
en.d
oc
By means of the cursor keys “Up“ and “Down“ you can select further message texts.
ESC OK
Preassure[V] 1.93Revolution[V] 4.21
s
LOGO! 12/24RC
10. In the second message text of the LOGO! logic module the setpoint pressure of the cooling water system is displayed. As the setpoint value cannot be displayed with a decimal point, the value is to be divided by 100. (181 = 1.81 V)
ESC OK
PreassureSetpoint
181/100[V]
s
LOGO! 12/24RC
ESC OK
Lapsed hours[h] 1Remaining[h] 999
s
LOGO! 12/24RC
In the third message text of the LOGO! logic module the operational hours counter is displayed. The value “Lapsed hours“ indicates how many hours the asynchronous motor has already been in operation. The output box “Remaining“ displays the hours until the next maintenance of the asynchronous motor.
11.
6.8 Scenario 1: Simulating the disturbance variable and recording the control process
Table 6-5
No. Action Comment
12. OPC MS Excel Client – Page 3 Make sure that the following parameters are set for the recording in the S7-200 control: • Lt: 500ms (1) • Lend: 0 (2)
1234
0• Ltrig: 1 (3) • Lmaxrec: 30 (4)

Live-Demo
Micro Automation Set 23 Entry ID 23753479
No. Action Comment
13. OPC MS Excel Client – Page 1 Increase the number of those consumers connected to the cooling water system to 3 (output value 1 or 2). • Input: Enter 3 (1)
1 23
• Button: Write the value in S7-200 (2) • Issued: Current value in S7-200 (3) In the first moment, the current pressure(PActual) will drop.
PSetpoint PActual
14.
V1.1 01.08.2006 34/38
Cop
yrig
ht ©
Sie
men
s A
G 2
006
All
right
s re
serv
ed
Set
23_D
ocTe
ch_v
2d0_
en.d
oc
The PI controller of the LOGO! logic module will compensate the disturbance variable (consumers) and increase the setpoint speed (nSetpoint). The actual speed (nActual) will be adjusted to the setpoint value.
nSetpoint nActual
15.
16. After appr. 10 seconds, the actual pressure will be adjusted to the setpoint value.
PSetpointPActual
17. OPC MS Excel Client – Page 3 If sufficient data records are generated, the recorded data can be transferred from S7-200 controller to MS Excel.
1
2• Maximum data records (Lmaxrec) = currently recorded data records (Lactrec) (1)
• Starting the data transfer S7-200 MS Excel (2)
18. Now the layout in MS Excel represents the control process since the last change of the disturbance variable (consumers).

Live-Demo
Micro Automation Set 23 Entry ID 23753479
6.9 Scenario 2: Changing the control parameters
To optimize the control process, the following parameters can be adjusted.
• P-part of the PI controller (Default: 2)
• I-part of the PI controller (Default: 1s)
• Setup / ramp-down time of the motor (Default: 3s) Table 6-6
Action Comment No.
Open the LOGO!Soft Comfort Project Set23_LOGO!_V2d0_en.lsc
19.
20.
V1.1 01.08.2006 35/38
Cop
yrig
ht ©
Sie
men
s A
G 2
006
All
right
s re
serv
ed
Set
23_D
ocTe
ch_v
2d0_
en.d
oc
Double-click the PI controller.
21. • Increase the P-part of the PI-
controller KC (1) to 10. • Increase the I-part of the PI-controller
TI (2) auf 30 s.
12
22. Save the LOGO!Soft Comfort Project and proceed as in Chapter 5.3.1 “Configuring LOGO! logic module“ to transfer the changed project.
23. Change the acceleration and ramp-down time of the asynchronous motor in SIAMICS G110 and in the S7-200 controller for simulating the controlled system from 3 to 2 seconds respectively.
• SINAMICS G110: Please see Chapter 3.2.1 “Parameterizing SINAMICS G110“ Table 5-5 No. 14 and 15.
• Controlled system simulation: Please see Chapter 6.2 No. 8 and 9.

Live-Demo
Micro Automation Set 23 Entry ID 23753479
No. Action Comment
24. If the disturbance variable of the controlled system simulation is changed (please see Chapter 6.8, Scenario 1), you can observe that • The actual pressure PActual is faster
coming claser to the setpoint pressure PSetpoint..
• The correction is less precise. • The correction tends to overshoot.
6.10 Scenario 3: Simulating the dry run of the storage tank
Table 6-7
Action Comment No.
V1.1 01.08.2006 36/38
Cop
yrig
ht ©
Sie
men
s A
G 2
006
All
right
s re
serv
ed
Set
23_D
ocTe
ch_v
2d0_
en.d
oc
To simulate the dry run of the storage tank, the electrodes of the probe are to be taken out of the water for monitoring the level.
25.
Max
Min
M 26. • The SIRIUS monitoring relay
deactivates the relay output. • The yellow LED goes out. • The connected LOGO! logic module
deactivates the output for releasing the SINAMICS G110 and
Filling level low!
• Stops simultaneously the operating hours counter
The simulation in the S7-200 controller will not be stopped without the release of the SINAMICS G110 frequency converter.

Technical Data
Micro Automation Set 23 Entry ID 23753479
V1.1 01.08.2006 37/38
Cop
yrig
ht ©
Sie
men
s A
G 2
006
All
right
s re
serv
ed
Set
23_D
ocTe
ch_v
2d0_
en.d
oc
7 Technical Data
LOGO! Power 24V 1.3 Table 7-1
Criterion Technical data Additional note
Supply voltage 85 to 264 V AC Output voltage DC 24 V (setting range DC
22.2 to 26.4 V)
Output current 1.3 Dimensions (W x H x D) in mm
54 x 90 x 55
LOGO! 12/24 RC Table 7-2
Criterion Technical data Additional note
Supply voltage 10.8 V to 28.8 V DC Digital inputs 8 I5, I6: High-speed counters
I7, I8: Can also be used as analog input (0-10V) (I7 = AI1, I8 = AI2)
Digital outputs 4 relays No short-circuit protection, external fuse necessary
Clock Available (date / time) Dimensions (W x H x D) in mm
72 x 90 x 55
LOGO! AM2 AQ Table 7-3
Criterion Technical data Additional note
Supply voltage 24 V DC Analog outputs 2 0 to 10 V Dimensions (W x H x D) in mm
36 x 90 x 55

Technical Data
Micro Automation Set 23 Entry ID 23753479
V1.1 01.08.2006 38/38
Cop
yrig
ht ©
Sie
men
s A
G 2
006
All
right
s re
serv
ed
Set
23_D
ocTe
ch_v
2d0_
en.d
oc
SITRANS P pressure measuring transducer Table 7-4
Criterion Technical data Additional note
Three-wire circuit auxiliary power
DC 15 to 36 V
Output signal 0 to 10 V Measuring range 0 to 1.6 bar Highest admissible operating pressure
5 bar
SIRIUS Monitoring relay Table 7-5
Criterion Technical data Additional note
Supply voltage AC 230 V Sensitivity 5 to 100 kOhm Adjustable Overall width 22.5 mm
SIRIUS wire electrode for level monitoring Table 7-6
Criterion Technical data Additional note
Cable connection 3 x 0.5mm², 2 m Number of poles Two-pole Length 500 mm Max. operating temperature 90 °C Max. operating pressure 10 bar
SINAMICS G110 frequency converter Table 7-7
Technical data Criterion
0AB13 0AB21
Additional note
Mains voltage AC 200 to 240 V ±10% AC 200 to 240 V ±10% Network frequency 47 to 63 Hz 47 to 63 Hz Rated current 2.30 A 7.80 A Rated power 27. 0.37 kW 28. 1.50 kW Input / output 29. 0 AO, 1 AI, 3DI,
0PTC-I, 1 RO 30. 0 AO, 1 AI, 3DI,
0PTC-I, 1 RO
Technical Data
Micro Automation Set 23 Entry ID 23753479
V1.1 01.08.2006 39/38
Cop
yrig
ht ©
Sie
men
s A
G 2
006
All
right
s re
serv
ed
Set
23_D
ocTe
ch_v
2d0_
en.d
oc
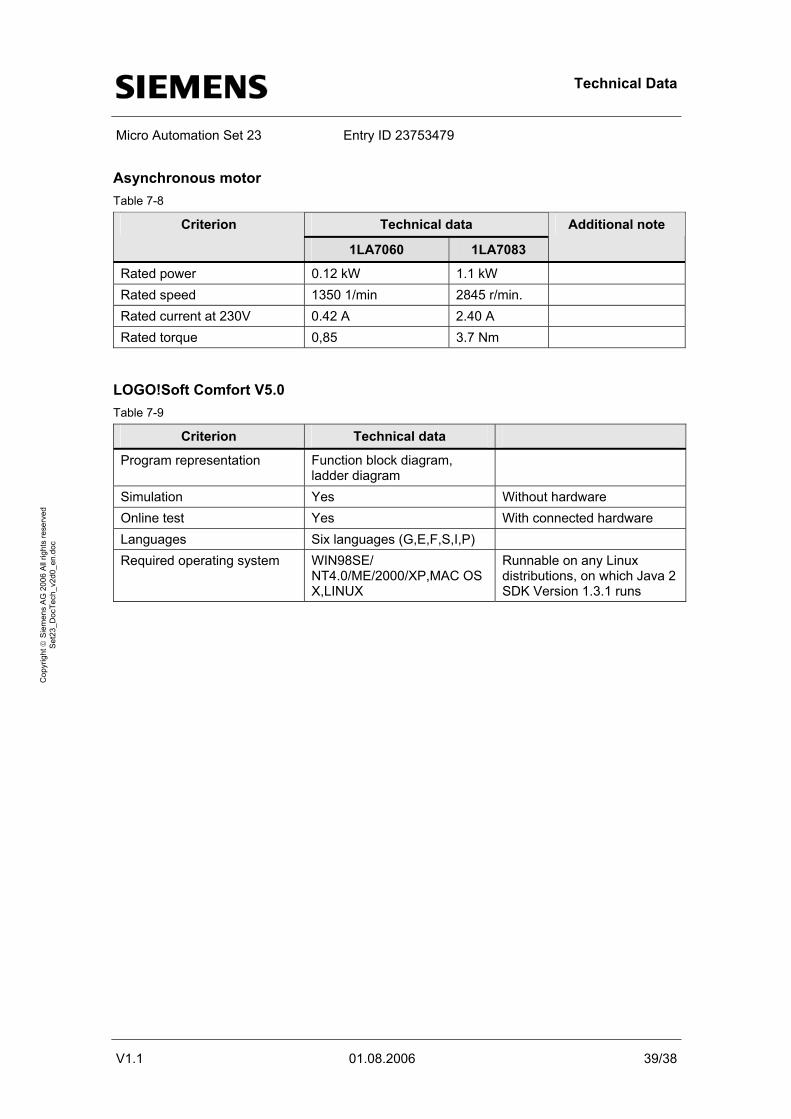
Asynchronous motor Table 7-8
Technical data Criterion
1LA7060 1LA7083
Additional note
Rated power 0.12 kW 1.1 kW Rated speed 1350 1/min 2845 r/min. Rated current at 230V 0.42 A 2.40 A Rated torque 0,85 3.7 Nm
LOGO!Soft Comfort V5.0 Table 7-9
Criterion Technical data
Program representation Function block diagram, ladder diagram
Simulation Yes Without hardware Online test Yes With connected hardware Languages Six languages (G,E,F,S,I,P) Required operating system WIN98SE/
NT4.0/ME/2000/XP,MAC OS X,LINUX
Runnable on any Linux distributions, on which Java 2 SDK Version 1.3.1 runs