Embed Size (px)
Citation preview

Micro- and nanoplastics in wastewater treatment
systems and receiving water
Reina Maricela Blair
School of Geographical and Earth Sciences
College of Science and Engineering
University of Glasgow

2
Table of Contents
Acronyms ............................................................................................................................................ 3
1 Introduction and Literature Review ............................................................................................ 4
1.1 Summary ............................................................................................................................. 4
1.2 Background and Rationale .................................................................................................. 4
1.3 Microplastics ....................................................................................................................... 6
1.4 Microplastics in Freshwater ................................................................................................ 8
1.4.1 Freshwater .................................................................................................................. 8
1.4.2 Wastewater ............................................................................................................... 19
1.4.3 Ecological Impacts ..................................................................................................... 20
1.5 WWT Systems in the UK.................................................................................................... 21
1.6 Methods for Studying MNP .............................................................................................. 22
1.6.1 Sampling and Sorting ................................................................................................ 23
1.6.2 Analytical Techniques for Identification ................................................................... 25
1.6.3 Modelling of Transport ............................................................................................. 27
1.7 Research Objectives .......................................................................................................... 27
1.8 References ........................................................................................................................ 28

3
Acronyms
COD Chemical oxygen demand
FT-IR Fourier-transform infrared spectroscopy
MNP Micro- and nanoplastics
MRI Magnetic resonance imaging
p.e. Population equivalent
PE Polyethylene
Pest Polyester
PET Polyethylene terephthalate
PMMA Polymethyl methacrylate
PP Polypropylene
PS Polystyrene
PTFE Teflon
PVC Polivynil chloride
SEM Scanning electron microscopy
TEM Transmission electron microscopy
WWT Wastewater treatment
WWTP Wastewater treatment plant
4
1 Introduction and Literature Review
1.1 Summary
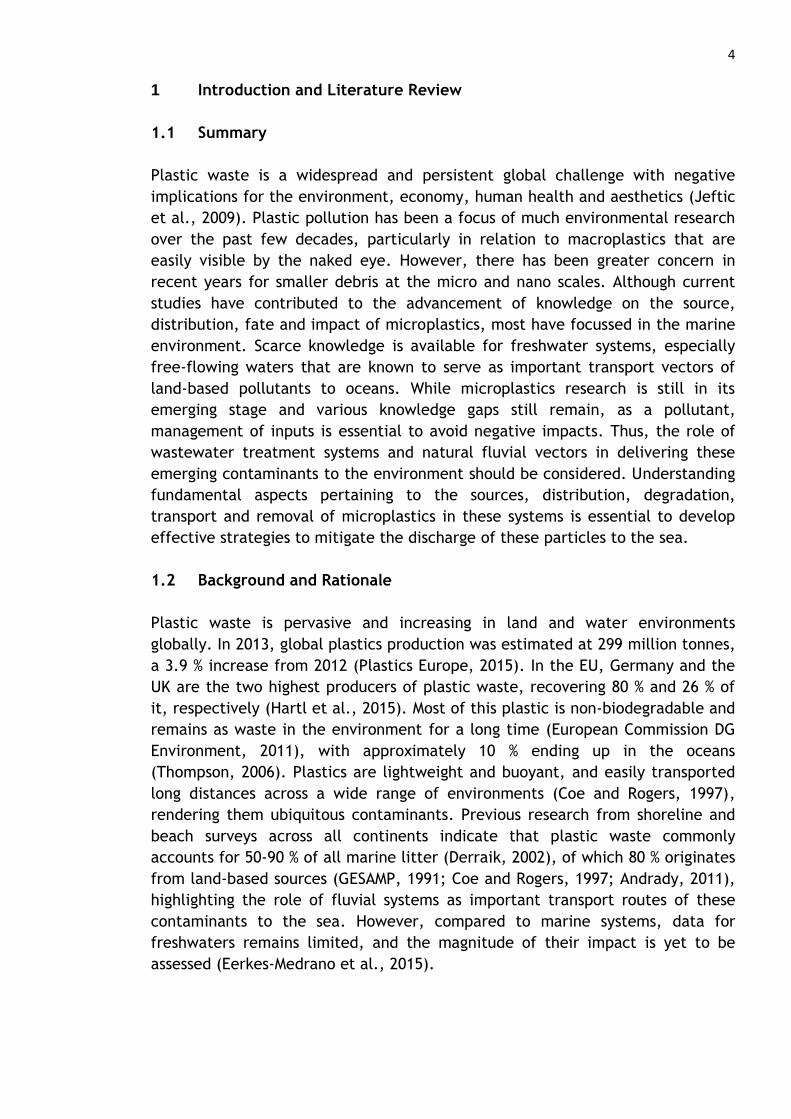
Plastic waste is a widespread and persistent global challenge with negative
implications for the environment, economy, human health and aesthetics (Jeftic
et al., 2009). Plastic pollution has been a focus of much environmental research
over the past few decades, particularly in relation to macroplastics that are
easily visible by the naked eye. However, there has been greater concern in
recent years for smaller debris at the micro and nano scales. Although current
studies have contributed to the advancement of knowledge on the source,
distribution, fate and impact of microplastics, most have focussed in the marine
environment. Scarce knowledge is available for freshwater systems, especially
free-flowing waters that are known to serve as important transport vectors of
land-based pollutants to oceans. While microplastics research is still in its
emerging stage and various knowledge gaps still remain, as a pollutant,
management of inputs is essential to avoid negative impacts. Thus, the role of
wastewater treatment systems and natural fluvial vectors in delivering these
emerging contaminants to the environment should be considered. Understanding
fundamental aspects pertaining to the sources, distribution, degradation,
transport and removal of microplastics in these systems is essential to develop
effective strategies to mitigate the discharge of these particles to the sea.
1.2 Background and Rationale
Plastic waste is pervasive and increasing in land and water environments
globally. In 2013, global plastics production was estimated at 299 million tonnes,
a 3.9 % increase from 2012 (Plastics Europe, 2015). In the EU, Germany and the
UK are the two highest producers of plastic waste, recovering 80 % and 26 % of
it, respectively (Hartl et al., 2015). Most of this plastic is non-biodegradable and
remains as waste in the environment for a long time (European Commission DG
Environment, 2011), with approximately 10 % ending up in the oceans
(Thompson, 2006). Plastics are lightweight and buoyant, and easily transported
long distances across a wide range of environments (Coe and Rogers, 1997),
rendering them ubiquitous contaminants. Previous research from shoreline and
beach surveys across all continents indicate that plastic waste commonly
accounts for 50-90 % of all marine litter (Derraik, 2002), of which 80 % originates
from land-based sources (GESAMP, 1991; Coe and Rogers, 1997; Andrady, 2011),
highlighting the role of fluvial systems as important transport routes of these
contaminants to the sea. However, compared to marine systems, data for
freshwaters remains limited, and the magnitude of their impact is yet to be
assessed (Eerkes-Medrano et al., 2015).

5
The emphasis on plastic pollution research in oceans may be because, until
recently, its accumulation and impacts appeared to be more evident in these
environments (Ryan et al., 2009). For example, “patches” of accumulated
floating macroplastic debris were observed in gyres and convergence areas in
oceans over a decade ago (e.g. Pacific garbage patch; Moore et al., 2001; Ryan
et al., 2009; European Commission, 2011), garnering widespread attention of the
media, policymakers, and the scientific community (European Commission,
2011). Furthermore, the marked mechanical effects of plastic litter on marine
biota due to entanglement and ingestion raised concerns of its potential harms
to biodiversity and ecosystems (Derraik, 2002; Ryan et al., 2009; Thompson et
al., 2009). While oceans have been used as waste dumps for years (despite
global efforts to prevent this; Gordon, 2006), the majority of plastic litter is
produced inland, thus examining their transport to marine environments by
rivers can allow for identification and regulation of its main sources (Ryan et al.,
2009; Dris et al., 2015).
At present, the increased awareness of the growing production and accumulation
of plastic pollution in the environment has brought greater focus to the need for
development of policies and management strategies. The United Nations
Environment Programme (UNEP), for instance, called for an urgent need to
address plastic pollution of oceans through implementation and enforcement of
coordinated strategies, effective policies and regulations, campaigns, and other
incentives at national, regional and global levels (Jeftic et al., 2009). The
European Marine Strategy Framework Directive (MSFD) 2008/56/EC emphasised
the need for more data on the amount, distribution, and composition of plastic
debris (Galgani et al., 2011; Sadri and Thompson, 2014). But despite the
extensive research devoted to monitoring plastic debris over the past decades,
the full extent of its quantity, distribution, and impact remains widely unknown.
Thus, the problem of controlling plastic waste may be confounded by lack of
measurement of the extent and thus understanding of source and impact, rather
than strategy (Coe and Rogers, 1997). For example, the importance of plastic
fragments at the micro and nano scales has only recently been recognised, and
method development to define and measure them is still under way.
Microplastics and nanomaterials have been classified by Scotland’s Centre of
Expertise for Waters (CREW) as emerging contaminants, or alternatively, as
“contaminants of emerging concern” (CEC) for Scottish watercourses, due to the
lack of adequate data for reliable risk assessment and their toxic characteristics
(Hartl et al., 2015). Therefore it is essential to refine the initial estimates of
plastic debris in oceans and inland waters to include these smaller and
“invisible” fractions and identify their main sources before further actions or
regulations can be implemented.
The concepts of micro- and nano-sized plastics as emerging contaminants, and
the role of wastewater and freshwater systems as sinks or sources of these
6
materials to the environment provide the underlying motivation of this study.
The purpose of this report is to revise and summarise theory and literature
relevant to the topic of microplastics and nanoplastics pollution in freshwaters
and wastewater systems, the selection of methodology, and the definition of
research objectives. The first section explores the concepts of micro- and
nanoplastics, as defined by various authors, leading into a discussion of the
current knowledge relating to these plastic debris categories in freshwater
systems in the following section. Next, a brief overview of wastewater
treatment systems in the UK is included to set the conceptual framework to
explore their potential role as transport routes of plastic debris to rivers, and
conversely, the impact of these materials on treatment plant efficacy. The
following section focuses on the subject of method development by providing a
quick overview of techniques and approaches used by various authors, focusing
on those relevant to the expected experimental plan for this study. The
introductory chapter ends with the statement of purpose and specific objectives
that will be addressed in this PhD research.
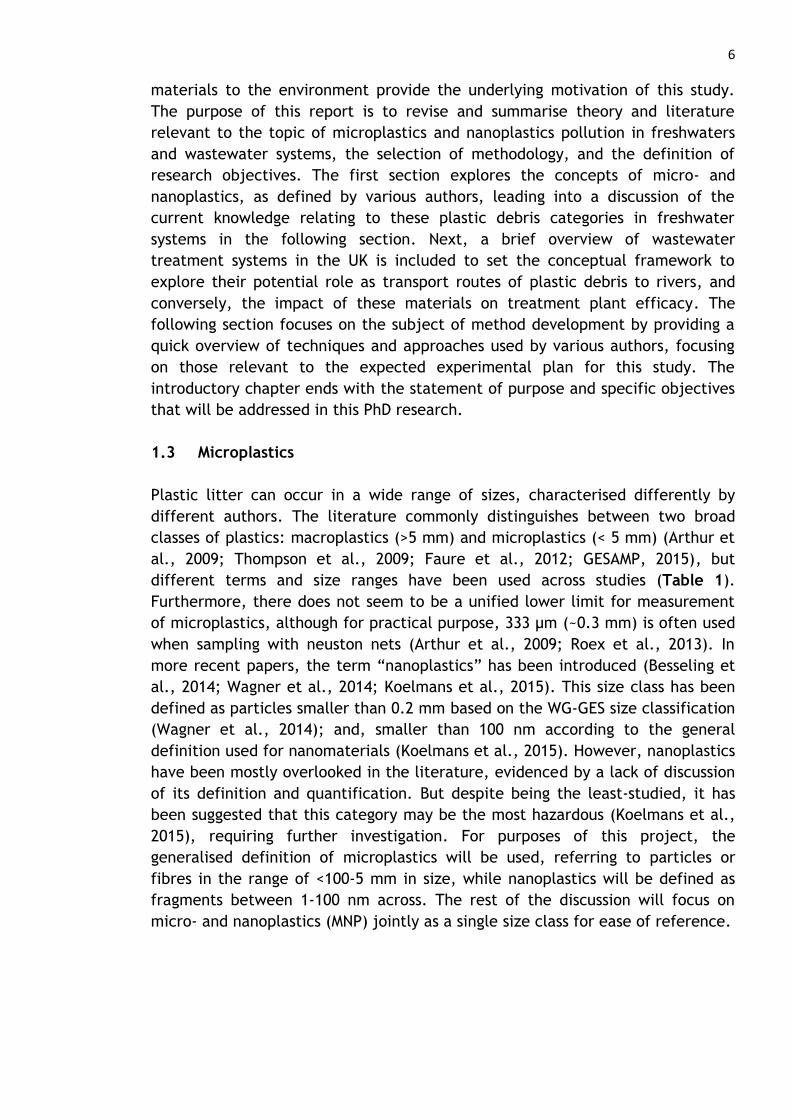
1.3 Microplastics
Plastic litter can occur in a wide range of sizes, characterised differently by
different authors. The literature commonly distinguishes between two broad
classes of plastics: macroplastics (>5 mm) and microplastics (< 5 mm) (Arthur et
al., 2009; Thompson et al., 2009; Faure et al., 2012; GESAMP, 2015), but
different terms and size ranges have been used across studies (Table 1).
Furthermore, there does not seem to be a unified lower limit for measurement
of microplastics, although for practical purpose, 333 µm (~0.3 mm) is often used
when sampling with neuston nets (Arthur et al., 2009; Roex et al., 2013). In
more recent papers, the term “nanoplastics” has been introduced (Besseling et
al., 2014; Wagner et al., 2014; Koelmans et al., 2015). This size class has been
defined as particles smaller than 0.2 mm based on the WG-GES size classification
(Wagner et al., 2014); and, smaller than 100 nm according to the general
definition used for nanomaterials (Koelmans et al., 2015). However, nanoplastics
have been mostly overlooked in the literature, evidenced by a lack of discussion
of its definition and quantification. But despite being the least-studied, it has
been suggested that this category may be the most hazardous (Koelmans et al.,
2015), requiring further investigation. For purposes of this project, the
generalised definition of microplastics will be used, referring to particles or
fibres in the range of <100-5 mm in size, while nanoplastics will be defined as
fragments between 1-100 nm across. The rest of the discussion will focus on
micro- and nanoplastics (MNP) jointly as a single size class for ease of reference.

7
Table 1 Definitions of plastic size classes in the literature
Preffix Size Class Size Range Source
nano nano, micro, millimetre (NMM)
not available Besseling et al., 2014 (abstract)
nanoplastic < 0.2 mm Wagner et al., 2014
< 100 nm Koelmans et al., 2015
micro microlitter ~0.06 - 0.5 mm Gregory and Andrady, 2003
microplastic < 0.5 mm Thompson et al., 2004
Fendall and Sewell, 2009
Hoellein et al., 2014 (abstract)
Sanchez et al., 2014
Corcoran et al., 2015
0.333 - 5 mm Arthur et al., 2009
micro debris < 2 mm Lechner et al., 2014
small microplastic < 1 mm Vianello et al., 2013
0.2 - 1 mm MSFD Technical Subgroup on Marine Litter, 2013
> 0.3 mm (< 1 mm) Faure et al., 2015
large microplastic 1 - 5 mm
MSFD Technical Subgroup on Marine Litter, 2013
Faure et al., 2015
meso mesolitter > 0.5 mm Gregory and Andrady, 2003
meso debris
5 - 25 mm MSFD Technical Subgroup on Marine Litter, 2013
2 - 20 mm Lechner et al., 2014
> 5 mm Sanchez et al., 2014
macro macroplastic/ macro debris
> 25 mm MSFD Technical Subgroup on Marine Litter, 2013
20 mm Sanchez et al., 2014
> 5 mm Faure et al., 2015
mega mega debris 100 mm Sanchez et al., 2014
Microplastics can originate from primary and secondary sources, and this
determines their shape and composition. Primary microplastics are
manufactured in small sizes for different applications, including use of personal
care products, synthetic fibres for clothes, and pre-production pellets for
fabrication of other plastic products (Thompson et al., 2004; Arthur et al., 2009;
Ryan at al., 2009; Roex et al., 2013; Storck et al., 2015). Also, researchers
suggest that the manufacture of nanoplastics may increase with their use in
electronic devices, medicines, cars, and airplanes (Roex et al., 2013), which may
be of growing concern as effective detection methods have yet to be developed.
These MNP will be collected mostly intact in industrial and household sewage,
and go through wastewater treatment (WWT) facilities before being discharged
into the aquatic environment (Roex et al., 2015). In addition to primary sources,
secondary MNP originate from larger pieces due to weathering by UV radiation
and physical defragmentation by mechanical forces, and their production rates

8
depend on environmental characteristics and type of plastics (Williams and
Simmons, 1996; Thompson et al., 2004; Arthur et al., 2009; Ryan at al., 2009;
Cole et al., 2011; Dubaish and Liebezeit, 2013), thus their direct input to oceans
may be harder to trace and quantify.
Chemical composition, size and surface features of MNPs can provide insight to
its origins. For example, microplastics found in personal care products tend to
be smaller than 0.3 mm, contain additives (e.g. plasticisers), and are composed
mainly of polyethylene (PE), but also commonly contain polypropylene (PP),
polyethylene terephthalate (PET), polymethyl methacrylate (PMMA) and Teflon
(PTFE) (Roex et al., 2015; Storck et al., 2015). Pre-production pellets will be
mainly spherical or cylindrical around 5 mm in size (GESAMP, 2015). In addition,
PE, PP, and polystyrene (PS) are often used in packaging and thus are indicative
of urban origins; while denser polymers like polyvinyl chloride (PVC) and
polyester (Pest) are commonly used in construction and textiles, respectively
(GESAMP, 2015), and will be introduced likely as fragments and fibres from
sewage effluent (Sadri and Thompson, 2014). To my best knowledge, there is no
data in the literature on the relative abundances of primary to secondary MNP,
and only few studies examine the correlation between larger and smaller
fragments for secondary MNP. Thus, there is a need to address these knowledge
gaps for accurate quantification of MNP fractions, assessment of the relationship
among abundances of different size classes, and application of precise source
characterisation approaches for understanding the potential contributions of
different urban and industrial sources (Lee et al., 2013). This information is
crucial from a management and policy standpoint, since it is predicted that even
if land-based inputs are controlled, plastic debris densities in oceans will
continue to increase from secondary sources (Eerkes-Medrano et al., 2015).
1.4 Microplastics in Freshwater
1.4.1 Freshwater
Microplastics were described as early as the 1960s and 1970s (GESAMP, 2015),
but it was not until 2004 that the term became widely used (Thompson et al.,
2004). Although plastic litter is not a new problem, only recently have MNP
become a focus of the scientific community with publications on the topic
increasing rapidly (Faure et al., 2012; GESAMP 2015), particularly in marine
systems (see reviews by Andrady et al., 2011 and Cole et al., 2011). Existing
data on MNP pollution of freshwater and terrestrial habitats are less abundant
than those for marine systems (Figure 1; Thompson et al., 2009; Wagner et al.,
2014, Eerkes-Medrano et al., 2015), but the number of publications are also
increasing, most of them since 2014. The research published between 2011 and
2014 on microplastics in freshwaters in Asia, Europe, and North America has
recently been reviewed (Eerkes-Medrano et al., 2015); all reviewed papers

9
report the presence of different size classes of plastics in freshwaters, as well as
high relative abundances of MNP compared to macroplastics, in both sediment
and surface waters (Table 2).
Figure 1 Comparison of marine vs freshwater studies of microplastics pollution published between 2011 – 2015, based on Web of Knowledge search engine accessed 25/11/2015.
In America, most research has concentrated in the North American region, with
only one study providing MNP data from Chile in South America (Browne et al.,
2011). Furthermore, the North American studies have focussed mainly in the
Great Lakes area (Zbysewski and Corcoran, 2011; Eriksen et al., 2013; Rios-
Mendoza and Evans, 2013; Zbysewski et al., 2014; Corcoran et al., 2015),
including the St. Lawrence River watershed (Castañeda et al., 2014). Of these,
only two studies collected data from freshwater bottom sediments (Castañeda et
al., 2014; Corcoran et al., 2015), and one considered open-water survey (the
Laurentian Great Lakes system; Eriksen et al., 2013). The rest of the studies
focussed on beach surveys. Across these studies, MNP were present in both
sediment and surface waters, with higher MNP densities compared to
macroplastic densities, and with high predominance of pellets and fragments,
indicative of primary sources. In addition, microbeads found in the St. Lawrence
River were comparable in size, shape and composition to those found in the
Laurentian Great Lakes, indicating a possible transport of MNP sources from the
municipalities along the river to the lakes (Castañeda et al., 2014).
0
10
20
30
40
50
60
70
2011 2012 2013 2014 2015
Oceans
Freshwater

1
0
Table 2 Studies on microplastics pollution in freshwaters published since 2011
Continent Country Water Body Authors Samples Collected
Techniques Used Size Classes Main Findings
America USA Los Angeles River, Coyote Creek/San Gabriel River system
Moore et al. 2011
surface, mid, and near-bottom water
manta trawl with mesh size 1 mm for surface samples; manta trawl with streambed sampler for mid and bottom samples; initial visual sorting with naked eye and dissecting microscope; sieving through mesh sizes 4.75, 2.8, 1.0 mm of smaller pieces;
1-4.75 mm, >4.75 mm
Greatest abundances and densities observed during wet periods (i.e. rain event on November 22), with total counts of 74 items per m3 in Coyote Creek, 337 items per m3 in San Gabriel, and 12,932 items per m3 in L.A. River, for pieces 1-4.75 mm in size. Microplastics <5 mm were 16x more abundant than macroplastics (3x more by weight). Most abundant debris type were foamed polysterene, followed by pellets, hard plastic fragments, thin films, line, and whole items. Extrapolation of data using flow rates estimated a yield of 2.33 x 10⁹ plastic objects and particles for all sampling devices over 72-hr period.
America Canada/USA Lake Huron Zbyszewski and Corcoran 2011
sediment beach surveying for collection of visible debris with stainless steel trowel; FT-IR; SEM
<5 mm plastic pellets, >5 mm broken plastic, polystyrene
In Lake Huron, a total of 3,209 pieces were found, including 2984 pellets, 108 fragments, and 117 pieces of styrofoam.
America Canada/USA Lakes Superior, Huron, and Erie
Eriksen et al. 2013
surface water
manta trawl with mesh size 333 µm; size fraction sieving (0.355-0.999 mm, 1.00-4.749 mm, >4.75 mm); SEM; energy dispersive x-ray spectroscopy (EDS)
0.355-0.999 mm, 1.00-4.749 mm, >4.75 mm
Spatial variability was observed across samples, ranging from ~450 to >450,000 items per km2, and Lake Erie (the most populated) had the highest abundances. An average abundance of 43,157 items per km2 was calculated for all samples. Pellets and fragments were more abundant, and the smallest size class accounted for 81% of the total count. Most pieces are suspected to originate from consumer products, likely introduced by nearby urban effluent.

1
1
Continent Country Water Body Authors Samples Collected
Techniques Used Size Classes Main Findings
America USA Great Lakes Rios Mendoza and Evans 2013 (abstract)
n/a n/a n/a n/a
America Canada/USA St. Lawrence River Castañeda et al. 2014
sediment benthic grab with mesh size 500 µm; visual manual separation and identification under dissecting microscope; differential scanning calorimetry for chemical composition
0.40-2.16 mm (range of microbeads collected)
Microbeads were found at 8 of 10 sites. Mean density was 13,759 + 13,685 items per m2 across all sites. They were a variety of colours and sizes and their melting point suggested PE composition.
America USA Dunkirk, Fredonia, and Plattsburg WWTP in New York
Chaskey et al. 2014 (poster)
WWTP effluent
volume reduced sampling and array sieving with mesh sizes 1 mm, 355 µm, 125µm; H2SO4 and H2O2
digestion and filtration with mesh size 125 µm; inspection under dissecting microscope
<1 mm Suspect plastic-like particles were present in all WWTP effluent and discharged at rates of 109,556, 81,911, and 1,061,953 particles per day from Plattsburgh, Fredonia, and Dunkirk, respectively. Particle colour ranged from bright red and blue to opaque, and signs of erosion and UV-degradation were observed.
America USA North Shore Channel Hoellein et al. 2014 (abstract)
n/a SEM; rRNA sequencing (in progress)
0.3-5 mm (micro)
Higher microplastic concentrations were observed downstream of WWTP relative to upstream, mainly consisting of fragments and plastic fibers.
America USA North Shore Channel McCormick et al. 2014
surface water
neuston nets with mesh size 333 µm; sieving through mesh sizes 2 mm and 330 µm; H2O2 digestion; density separation with NaCl; direct count with stereo microscope; SEM; bacterial measurements (DNA extraction and sequencing); dissolved nutrients (SRP, NH4,NOx)
2 mm-330 µm Microplastics were found in all samples, and concentrations were higher downstream of WWTP effluent discharge. Mean concentrations were 1.94 (0.81) m3 upstream and 17.93 (11.05) m3 downstream. Foams and pellets were found downstream, in lower concentrations than fragments and fibers. Extensive colonisation of microplastics was observed, mainly consisting of prokaryotic cells. Higher constituent concentrations were also measured downstream of WWTP.

1
2
Continent Country Water Body Authors Samples Collected
Techniques Used Size Classes Main Findings
America USA Chesapeake Bay estuarine rivers
Yonkos et al. 2014
surface water
manta trawl with mesh size 0.33 mm; fraction sieving through 5.0 mm and 0.3 mm; H2O2 digestion of oven-dried samples; visual pre-selection with dissecting microscope; Raman microspectroscopy
0.3-2 mm, 2-5 mm
Microplastics were collected in 59 out of 60 samples. Concentrations were low and variable across replicates, locations and sampling period, ranging over 3 orders of magnitude between <1.0 g/km2 and 563 g/km2. Concentrations peaked in September at all sites, and microplastics concentrations increased with proximity to more densely urban areas. Sizes 0.3-2.0 mm and flexible sheets were more abundant, followed by synthetic fibers, extruded polystyrene, and larger fragments (2.0-5.0 mm)
America Canada/USA Lakes Erie and St. Clair Zbyszewski et al. 2014
sediment beach surveying for collection of visible debris with stainless steel trowel; FT-IR; SEM
<2 cm (styrofoam, pellets, plastic fragments), intact or near-intact debris
In Lake Erie, a total of 1,576 pieces were collected, including 603 pellets, 934 fragments, and 39 pieces of styrofoam. In Lake St. Clair, a total of 817 pieces were collected, including 110 pellets, 192 fragments, 234 pieces of styrofoam, and 281 intact or near-intact debris
America Canada Lake Ontario Corcoran et al. 2015
sediment beach surveying for collection of visible debris; Raman; box corer for lake bottom sediment samples; size fraction sieving (<0.5, 0.5-0.71, 0.71-0.85, 0.85-1, >1 mm), density separation with sodium polytungstate (SPT); microscopy; FTIR
<1 cm, 1-5 cm, >5 cm for visible samples; <5 mm (micro)
A total of 6,172 pieces were collected from beach sites, including pellets, fragments, intact items, and polysterene. Pellets showed composition of PE and PP. Pieces in the 1-5 cm range and white/translucent colours were predominant. Microplastics ranging from 0.5-3 mm in size were found in bottom sediments at depths <8 cm, with PE accounting for the majority of microplastics. Higher abundances were observed in sediment collected at a site near the centre of the lake as compared to a site near the outlet.
1
3
Continent Country Water Body Authors Samples Collected
Techniques Used Size Classes Main Findings
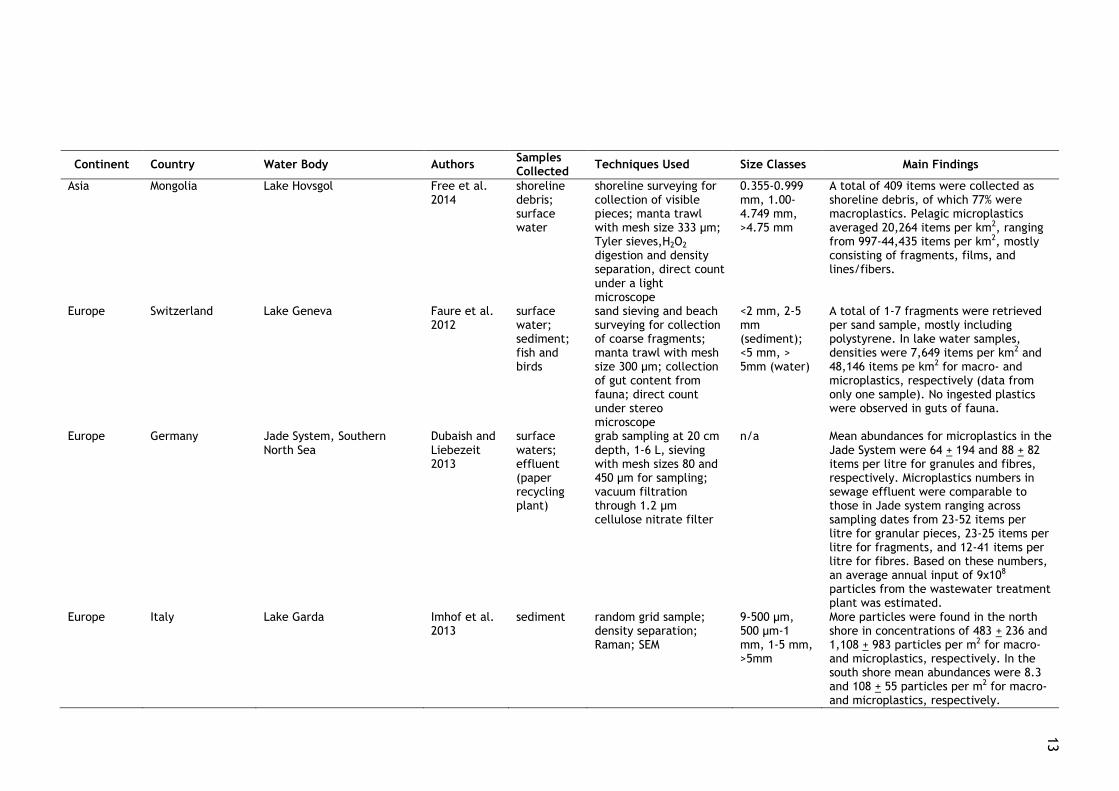
Asia Mongolia Lake Hovsgol Free et al. 2014
shoreline debris; surface water
shoreline surveying for collection of visible pieces; manta trawl with mesh size 333 µm; Tyler sieves,H2O2
digestion and density separation, direct count under a light microscope
0.355-0.999 mm, 1.00-4.749 mm, >4.75 mm
A total of 409 items were collected as shoreline debris, of which 77% were macroplastics. Pelagic microplastics averaged 20,264 items per km2, ranging from 997-44,435 items per km2, mostly consisting of fragments, films, and lines/fibers.
Europe Switzerland Lake Geneva Faure et al. 2012
surface water; sediment; fish and birds
sand sieving and beach surveying for collection of coarse fragments; manta trawl with mesh size 300 µm; collection of gut content from fauna; direct count under stereo microscope
<2 mm, 2-5 mm (sediment); <5 mm, > 5mm (water)
A total of 1-7 fragments were retrieved per sand sample, mostly including polystyrene. In lake water samples, densities were 7,649 items per km2 and 48,146 items pe km2 for macro- and microplastics, respectively (data from only one sample). No ingested plastics were observed in guts of fauna.
Europe Germany Jade System, Southern North Sea
Dubaish and Liebezeit 2013
surface waters; effluent (paper recycling plant)
grab sampling at 20 cm depth, 1-6 L, sieving with mesh sizes 80 and 450 µm for sampling; vacuum filtration through 1.2 µm cellulose nitrate filter
n/a Mean abundances for microplastics in the Jade System were 64 + 194 and 88 + 82 items per litre for granules and fibres, respectively. Microplastics numbers in sewage effluent were comparable to those in Jade system ranging across sampling dates from 23-52 items per litre for granular pieces, 23-25 items per litre for fragments, and 12-41 items per litre for fibres. Based on these numbers, an average annual input of 9x10⁸ particles from the wastewater treatment plant was estimated.
Europe Italy Lake Garda Imhof et al. 2013
sediment random grid sample; density separation; Raman; SEM
9-500 µm, 500 µm-1 mm, 1-5 mm, >5mm
More particles were found in the north shore in concentrations of 483 + 236 and 1,108 + 983 particles per m2 for macro- and microplastics, respectively. In the south shore mean abundances were 8.3 and 108 + 55 particles per m2 for macro- and microplastics, respectively.

1
4
Continent Country Water Body Authors Samples Collected
Techniques Used Size Classes Main Findings
Europe Italy Lagoon of Venice Vianello et al. 2013
sediment box corer; density separation with NaCl and filtration through 32 µm steel-wire sieve and 0.7 µm fiberglass filter; micro-FT-IR; SEM
<1 mm (small micro)
Total abundance of small microplastics (S-MPPs) ranged from 2,175 to 672 particles per kg1. Polymer types identified included: PE, PP, PEP, Pest, PAN, PS, Alkyd, PVC, PVOH, ad Polyamide, with PE and PP accounting for more than 82% of total S-MPPs. Irregular fragments, fibers, films, and pellets/granules, respectively, were observed in 87%, 10%, 2%, and 1% of all stations, and 93% of S-MPPs were size 30-500 µm. There was high correlation between total S-MPPs concentrations with the finer fraction of sediment and metal pollution index. Signs of degradation were observed.
Europe Netherlands River Dommel Besseling et al. 2014 (abstract)
n/a spatially and temporally explicit model based on advective transport, homo- and hetero-aggregation, sedimentation-resuspension, polymer degradation and burial.
nano-, micro-, and millimetre (NMM) sized particles; size range for each class not specified
Particle size, biofilm formation and water turbulence affect fate and retention of NMM sized polymer particles and the positioning of the accumulation hot spots along the river.
Europe Austria/Slovakia Danube river Lechner et al. 2014
surface water
volume-reduced sampling with driftnets with mesh size 500 µm; density separation; visual sorting and direct count with naked eye
<2 mm (micro), 2-20mm (meso)
Average plastic load of the river was 316.8 + 4,664.6 items per 1000m3 (79.4% industrial, 20.6% others, by density), equivalent to 4.8 + 24.2 g per 1000m3 (29.7% industrial, 70.3% others, by mass).

1
5
Continent Country Water Body Authors Samples Collected
Techniques Used Size Classes Main Findings
Europe Sweden Langeviksverket WWTP in Lysekil
Magnusson and Nóren 2014
incoming and effluent water; sludge; recipient water
Ruttner sampler for effluent water filtered through mesh size 300 µm; towing of zooplankton net with mesh size 300 µm at 20, 50, and 200 m downstream of effluent tube; visual examination under stereo microscope; FT-IR
>300 µm Incoming water had mean concentration of 15,000 particles per m3, equivalent to inflow of 3,200,000 particles per hour. More than 99% were retained in sludge, and effluent water discharged 1,770 particles per hour. Shape affected retention, with fibres being retained to a higher degree. Concentrations of 1.1-1.8 particles per m3 were found in recipient water compared to 0.45 m3 in reference site, and concentrations were higher near the effluent tube compared to 200 m downstream.
Europe UK Thames river Morritt et al. 2014
surface water
GPS tracked fyke nets (mesh size not defined); direct counts
n/a A total of 8,490 plastic items were collected between 17 September and 13 December 2012, and were grouped into 7 main contributory categories. General plastics made up 20-25% of total litter in all sites, while wrappers and containers accounted for 21-28%. No major trends were observed moving from upstream to downstream sites, but higher number of items observed near sewage treatment outflows.
Europe UK Tamar estuary Sadri and Thompson 2014
surface water
manta net with mesh size 300 µm; size fraction sieving (3 mm, 1 mm, and 270 µm); FTIR
>5 mm, 3-5 mm, 1-3 mm, <1 mm
Overall mean concentrations were 0.028 items per m3. Microplastics accounted for 81% of all plastic debris, and the 1-3 mm size class was most abundant. Polyethylene was most abundant (40%), followed by PS (25%),and PP (19%).
Europe Germany Elbe, Mosel, Neckar, and Rhine rivers
Wagner et al. 2014
sediment density separation; visual inspection
<5 mm Concentrations of 34-64 items per kg1 dy weight were measured, and River Rhine had the highest load. Fragments accounted for 60% of total microplastics, and the remainder were fibers.

1
6
Continent Country Water Body Authors Samples Collected
Techniques Used Size Classes Main Findings
Europe Switzerland Lakes Geneva (including inlets and outlets), Constance, Neuchâtel, Maggiore, Zurich, and Brienz
Faure et al. 2015
surface water; sediment; fish and birds
spatial sample collection for beach sediments; density separation with NaCl and filtration through mesh size 300 µm; manta trawl with mesh size 300 µm for water samples; collection of gut content from fauna; visual sorting under dissecting microscope for larger fragments; H2O2 digestion; FTIR; mass spectrometry (gas and liquid chromatography)
>5 mm (macro), >1 mm (large micro), > 300 µm (small micro)
Microplastics were found in all beach sediments and surface water samples. Across all lakes, beach average densities were 1,300 + 2,000 and ranged from 20-7,200 items per m2 for microplastics; and 90 + 250 and ranged from 0-150,000 items per m2 for macroplastics. Measured densities at the surface of all swiss lakes averaged 91,000 + 120,000 and 1,800 + 3,100 particles per km2 for micro- and macroplastics, respectively. In rivers, average densities for all samples were 790 + 1,600 and 1.9 + 3.5 items per h1 for micro- and macroplastics, respectively. Pellets were less abundant but had a higher mass proportion than foams and fibers. In terms of composition, of all particles analysed, 62% were PE, 15% PP, and 12% PS. Only 7.5% of fish analysed showed signs of ingested plastics, while plastics were found in 8 of 9 dissected birds, with a mean of 4.3 + 2.6 items per bird.
Europe Germany Rivers Rhine and Main Klein et al. 2015
sediment composite bulk sample of wet sediment sieved through mesh size >10 mm; dry sieveing with mesh size 63, 200, 630 µm; density separation with NaCl and vacuum filtration through 45 mm filter; H2O2 and H2SO4 digestion with vacuum filtration; direct count with naked eye and under binocular microscope for pieces 63-630 µm; FTIR
630-5000, 200-630, 63-200 µm (discarded particles <63 µm)
Microplastics in the Rhine and Main shore sediments accounted for 228-3,763 and 786-1,368 items per kg1 , respectively. The 630-5,000 µm category was most abundant by weight, but numerically, the 63-200 µm pieces were predominant. Spheres and fibers were more abundant in the lower size categories, and fragments dominated the 630-5,000 µm size class. Over 50% of total plastic weight was attributed to PE and PP, while numerically, PS particles were more abundant.

1
7
Continent Country Water Body Authors Samples Collected
Techniques Used Size Classes Main Findings
Worldwide Australia (Port Douglas), Japan (Kyushu), Oman, United Arab Emirates (Dubai), Chile (Viña del Mar, Punta Arenas), Philippines (Malapascua Island), Portugal (Faro), Azores (Ponta Delgado), USA (Virginia, California), South Africa (Western Cape), Mozambique (Pemba), UK (Sennon Cove, Plymouth, Tyne)
Browne et al. 2011
sediment; effluent
van Veen grabs for sampling of effluent; density separation with NaCl; FTIR;
n/a Abundance of microplastics ranged from 2 to 31 fibres per 250 mL of sediment, mostly consisting of Pest (56%), followed by acrylic (23%), PP (7%), PE (6%), and polyamide fibres (3%). Microplastics abundances were positively correlated with population density, and disposal sites contained >250% more microplastics than reference sites. Effluent contained at least 1 particle of microplastic per litre, and again Pest was predominant.

18
In Asia, a study in Lake Hovsgol, Mongolia, reported average pelagic
microplastics densities of 20,264 items per km2, despite its remoteness and low
population density (Free et al., 2014). As microplastic abundance would be
expected to be relatively lower in such areas, this was attributed to the lake’s
long residence time, small surface area, and lack of proper waste management
(Free et al., 2014), indicating strong need for effective control measures.
Although no other studies were found for MNP in freshwaters in Asia, the
continent contributes considerably to the global plastic production (Plastics
Europe, 2015); and marine data indicate that over the last decade, plastic litter
increased by a factor of 10 every 2-3 year in the Japanese coast (Haruo, 2000).
More recently, MNP pollution has been reported in coastlines of Japan (Browne
et al., 2011) and Korea (Lee et al., 2013; Kang et al., 2015). In this context, the
region may present useful opportunities for studying these plastic particles in
freshwaters under highly populated and industrialised conditions.
The rest of the available literature presents studies across Europe, where work
has been conducted in Switzerland (Faure et al., 2012; Faure et al., 2015), Italy
(Imhof et al., 2013; Vianello et al., 2013), Germany (Dubaish and Liebezeit,
2013; Wagner et al., 2014; Klein et al., 2015), , Netherlands (Besseling et al.,
2014), Austria (Lechner et al., 2014), and the UK (Morritt et al., 2014; Sadri and
Thompson, 2014). In addition, a single study collected and summarised global
data from coastlines across all continents (Browne et al., 2011). In Switzerland
and Italy, for example, the research studies focussed on lake systems, where
microplastics were observed in Lake Geneva (Faure et al. 2012; 2015), Lake
Garda (Imhof et al., 2013), and the Lagoon in Venice (Vianello et al., 2013),
usually at higher concentrations than macroplastics. In Germany, microplastics
commonly in the form of fragments, granules, and fibres were reported in
sediments in various rivers, including the Rhine, Elbe, Mosel, Neckar, and Main
rivers (Wagner et al., 2014; Klein et al., 2015), and the Jade system of the
southern North Sea (Dubaish and Liebezeit, 2013). Globally, microplastics
abundances generally were positively correlated with population density, and
proximity to disposal sites (Browne et al., 2011). Nevertheless, the spatial
coverage of the MNP studies in freshwater systems remains limited.
Most of the earlier freshwater research appears to have focussed on lentic
systems, but rivers and wastewater treatment systems are gaining more
attention as important vectors not only to sea, but also to lakes and estuaries.
Rivers are dynamic systems with less water volume for dilution relative to lakes
and oceans, so they can concentrate MNP, particularly urban rivers receiving
direct sewage discharges (McCormick et al., 2014; Rech et al., 2014). Also,
riverine systems can act as temporary sinks, while transport can quickly increase
during rain events, as influenced by factors such as flow rate and bottom
currents (Galgani et al., 2000; McCormick et al., 2014; Rech et al., 2014). For
example, beach studies in Brazil (Araujo and Costa, 2007; Ivar and Costa, 2013)

19
attributed the presence of solid waste, including plastics, to domestic sources
along the river basin, proximity of river sources, and increased river flow during
high rain events (Rech et al., 2014; Sadri and Thompson, 2014). Similarly, a
study identified the Danube River as an important transport route of plastics
from production sites in Germany and Austria to the Black Sea, and proposed
that inter- and intra-annual variations in MNP drift densities were linked to
differences in the release of plastics from processing facilities (Lechner et al.,
2014). In Chicago, higher MNP densities were observed after rain events during
wet periods for two urban rivers, with evidence of higher abundances of primary
MNP that are not regulated by total maximum daily loads (TMDLs), and are being
discharged into oceans (McCormick et al., 2014). However, contradicting data
also emerged. A study of larger plastic pieces (size categories not defined) in the
Thames river did not find major trends from up- to downstream sites, although
generally higher abundances were observed in sites near sewerage discharge
(Morritt et al., 2014). In the Tamar River estuary in the UK, the authors also did
not find evidence that the river acted as a sink or source of plastic fragments
present in the system (Sadri and Thompson; 2014), although this is believed to
be influenced largely by its location in an unpopulated catchment, while fluvial
systems would be expected to act as sources under more populated or
industrialized conditions (Eerkes-Medrano et al., 2015), emphasizing the need
for further evaluation of freshwater systems in order to be conclusive.
1.4.2 Wastewater
The relationship between population density, as well as urban and industrial
activities with MNP concentrations can be explored via analysis of wastewater
effluent in treatment facilities and receiving waters. A handful of studies are
available providing data on effluent discharge of MNP from wastewater
treatment plants (WWTP) in the US (Chaskey et al., 2014; Hoellein et al., 2014:
McCormick et al., 2014), UK (Browne et al., 2011), Gemany (Dubaish and
Liebezeit, 2013) and Sweden (Magnusson and Nóren, 2014). In the North Shore
Channel in Chicago, higher microplastic concentrations, consisting mostly of
fragments and plastic fibres, were observed downstream of the WWTP relative
to upstream (Hoellein et al., 2014: McCormick et al., 2014). Likewise, a global
study found that disposal sites contained >250% more microplastics than
reference sites upstream (Browne et al., 2011). In New York, discharge rates of
109,556, 81,911, and 1,061,953 particles per day were reported from three
different WWTP (Chaskey et al., 2014), while an average annual input of 9 x 10⁸
particles was estimated from a WWTP in Germany (Dubaish and Liebezeit, 2013).
A more recent study in Europe was conducted in a relatively small plant in
Langeviksverket serving ~12,000 population equivalents (p.e) (Magnusson and
Nóren, 2014). Here, although most of the microplastics entering the WWTP were
retained in the sludge, the plant continued to discharge MNP, as evidenced by
higher concentrations in the recipient water compared to the reference site

20
upstream (Magnusson and Nóren, 2014). It is possible that larger WWTP will
contribute larger MNP loads, and thus an additional filtration step before
discharging effluent to receiving waters may help reduce its MNP concentrations
(based on comparable data collected in two other larger WWTP in Sweden,
Magnusson and Nóren, 2014). However, the general absence of quantitative
studies in WWT systems does not allow for a proper assessment of their
contribution, making this an area of high priority for further MNP research.
1.4.3 Ecological Impacts
A few studies on freshwater systems have also considered the ecological effects
of MNP (see review by Eerkes-Medrano et al., 2015), although little remains
known. Owing to their small size, MNP are ingested directly and indirectly by
aquatic species more readily than larger particles, sometimes when mistaken for
food, and can lead to harmful physical effects (Derraik, 2002). Evidence from
marine studies for example, indicate that MNP ingestion may lead to choking,
blocked digestive tracts, damage to organs, debilitation, and ultimately death
(see review by Derraik, 2002). Some available studies in freshwater have
observed similarities in MNP ingestion by freshwater and marine organisms
(Imhof et al., 2013; Rochman et al., 2013; Sanchez et al., 2014; see review by
Eerkes-Medrano et al., 2015), while others found little evidence of uptake by
fish and bird species in lakes (Faure et al., 2012; Faure et al., 2015). In addition,
microplastic pieces can adsorb persistent organic pollutants (POPs), potentially
introducing toxicity throughout the food web (Mato et al., 2001; Endo et al.,
2005; Bakir et al., 2012; Rios-Mendoza and Evans, 2013), which could eventually
reach humans by bioaccumulation (Farrel and Nelson, 2013). Desorption of POPs
and other manufacturing additives can increase pollutant concentrations in
waters and increase the susceptibility of the larger pieces to degradation
(Dubaish and Liebezeit, 2013). Nevertheless, information on sorption and
leaching of POPs from microplastics is scarce (Arthur et al., 2009), and most of
the knowledge on toxicity derives from marine and laboratory experiments
(Eerkes-Medrano et al., 2015), while data from freshwaters remains limited.
It has also been suggested that certain MNP, such as synthetic fibres can be
airborne and as inhaled by humans, make their way to lung tissue and potentially
contribute to the formation of tumours (Pauly et al., 1998). Conversely, MNP
surfaces (plastisphere) provide habitats for microbial colonisation and biofilm
formation, allowing for migration of opportunistic pathogens and invasive
species (Zettler et al., 2013, McCormick et al., 2014). The latter may be
relevant for WWTP as it could affect the functioning of the treatment processes,
as well as increase the transport of WWT bacteria from these facilities to
receiving waters (Zettler et al., 2013; Tagg et al., 2015).

21
1.5 WWT Systems in the UK
Wastewater treatment systems may be potential point sources for MNP pollution
to aquatic ecosystems. Considerable amounts of MNP collected by sewerage
systems can be discharged into the waterways via WWTP effluent, particularly
near urban and industrial centres receiving large quantities of sewage every year
(Browne et al., 2011; Eriksen et al., 2013; Eerkes-Medrano, 2015). The WWTP
may not remove MNP completely and an estimated 160 particles per inhabitant
per hour are discharged from these facilities into receiving waters (Storck et al.,
2015), and subsequently transported to oceans. Therefore, the role of WWTP in
the degradation, transport, and removal of MNP, particularly those originating
from primary sources, should be considered. Additionally, as the systems are
expected to function properly in order to minimize treatment costs and ensure
adequate water quality standards, the impact of MNP in the treatment process
should also be evaluated.
In the UK, over 11 billion litres of wastewater are collected daily, most
commonly via combined sewerage systems, although separate collection systems
for surface water and foul drainage also exist (Defra, 2012). Treatment of the
collected sewage in the country is regulated by the Urban Waste Water
Treatment Directive (91/271/EEC) and, widely, involves: preliminary treatment
in which screening traps are used to remove large solids; primary treatment in
large tanks for sedimentation of suspended solids; secondary or biological
treatment for breakdown and reduction of residual dissolved organic matter; and
tertiary treatment tailored for removal of specific pollutants such as phosphorus
or nitrogen (Defra, 2012; Scottish Water, 2015: The World Bank Group, 2015). In
Scotland, wastewater collection, transport and treatment is largely designed and
operated as a 5-stage process by Scottish Water (Figure 2), and is regulated by
the Scottish Environment Protection Agency (SEPA). However, depending on the
size of the community (measured in p.e. units), and the specific water quality
requirements, treatment stages can be added or modified as needed and
allowed by available resources (Defra, 2012; The World Bank Group, 2015). For
example, between the 1990s and 2000s, “less sensitive areas” were identified
across the UK, allowing for primary treatment to be minimised according to the
Directive, but currently this designation is no longer used in the UK (Defra,
2012). Furthermore, the Directive mandates secondary treatment for
agglomerations of >2000 p.e., and advanced or tertiary treatment for
agglomerations greater than 10,000 p.e in sensitive areas. The UK generally is
compliant with these provisions (Defra, 2012).

22
Figure 2 Scottish Water’s 5-stage wastewater treatment process (Source: Scottish Water)
The Directive also requires that both collection systems and WWTP have the
capability to deal with seasonal changes, especially peak wet weather flows, and
the UK has made improvements to both, as described in the Defra report (2012).
These include upgrading the capacity of sewer networks across the country (e.g.
London, Ayrshire, Belfast) between 2010 and 2015, and ensuring implementation
of secondary treatment in all required WWTP to achieve 100% compliance
(Defra, 2012). In Scotland, under storm conditions, flooding is prevented by
using combined sewage overflows (CSO) that are monitored and improved if
considered to be Unsatisfactory Intermittent Discharges (UID) under the agreed
Quality & Standards (Q&S), partly determined by aesthetic requirements
(Scottish Water, 2015).
1.6 Methods for Studying MNP
Because MNP research is still a developing field, there are no standardised
procedures for their study, and method advancement is still in its early stages
(Eerkes-Medrano et al., 2015; Tagg et al., 2015). The different size class
distinctions and methods used may reduce comparability of results across
studies, highlighting the need to unify size class definition and develop simple,
low-cost, and precise methods for their detection and monitoring (Galgani et al.,
2013; Eerkes-Medrano et al., 2015). However, it may still be too early to do so,
as we have yet to identify the spectrum, sizes, and types of MNP that require
23
greater attention; thus for now, standardised procedures may prove useful only
in situations that call for regular site-specific monitoring or have limited budgets
(Free et al., 2014; Eerkes-Medrano et al., 2015). Nevertheless, a review of
methods for identification and quantification of MNP in marine environments is
available (Hidalgo-Ruz et al., 2012), and more recently, the NOAA Marine Debris
Program published a manual on recommended laboratory methods for
quantifying plastics in oceanic waters and sediments (Masura et al., 2015). The
methods used for freshwater systems are similar to those implemented in marine
studies.
The review of methods presented here is based on the anticipated pathway for
the study and includes the forensic techniques predominantly mentioned in the
literature, tailored to gather information for quantification and characterisation
of MNP, as well as describe their behaviour and fate in WWT and fluvial systems.
1.6.1 Sampling and Sorting
Traditional sampling techniques for both surface water and sediments are
common. Surface waters are often sampled through volume-reduced methods
using manta trawls and neuston nets (Hidalgo-Ruz et al., 2012), while bulk grab
sampling has been described for effluent discharge collection (Browne et al.,
2011; Chaskey et al., 2014; Magnusson and Nóren, 2014). For lake sediments,
selective sampling of visible pieces from beach transects was a frequent
practice, and bulk sampling equipment has been used for collection of lake
bottom sediments (Hidalgo-Ruz et al., 2012; Castañeda et al., 2014; Corcoran et
al., 2015).
Sample processing usually involved a combination of approaches including visual
pre-selection, size fraction sieving, flotation and density separation, filtration,
and acid, alkaline or enzymatic digestion (Hidalgo-Ruz et al., 2012; Cole et al.,
2014; Tagg et al., 2015). Sieve analysis is useful for separation of particles into
different size ranges. A wide range of sieve sizes have been used across studies,
and will largely determine the minimum sizes of plastic debris that are collected
and quantified (Hidalgo-Ruz et al., 2012). For example, higher MNP abundances
are usually reported where smaller mesh sizes were used in sieving and filtration
(Hidalgo-Ruz et al., 2012; Storck et al.,2015). This is important as it may reduce
the comparability or accuracy of results, possibly underestimating abundances in
some cases from loss of material that is not retained in sieves and gets
discarded.
Further sorting is performed with the use of flotation and density separation,
and studies also differ in the solutions used for this method. Most authors
reported the use of sodium chloride (NaCl) for separation of low density
particles from sediment as the lower plastic density encourages flotation

24
(Hidalgo-Ruz et al., 2012). A few studies have also employed sodium iodide (NaI)
and sodium polytungstate (SPT) for polymers with higher densities, although this
tends to be more costly (Claessens et al., 2013). However, the basic method is
the same across studies. Briefly, the sample is mixed with the solution, shaken
for a certain amount of time, and left to settle so that the low-density particles
rise to the surface. The floating pieces can be manually picked out, and the
smaller ones can be extracted under vacuum filtration of the supernatant
through membrane filter (Hidalgo-Ruz et al., 2012). The filtered samples can
then be kept under sterile conditions until further analysis.
Sample digestion was also employed by most studies for isolation of MNP from
confounding organic material. Similar to density separation, different solvents
may be utilised although hydrogen peroxide (H2O2) treatment is more common.
The effectiveness of this approach was tested (Nuelle et al., 2014; Tagg et al.,
2015), recommending that a 7-day sample treatment with 30-35% of H2O2 is more
effective in removing organic material from the filter, improving filtration time
without damaging the polymer.
After initial sorting, suspected MNP particles are characterised according to
different categories (e.g. type, shape, colour), and quantified for assessment of
spatial and temporal distributions (Hidalgo-Ruz et al., 2012). Quantities of MNP
are often expressed as abundance, mass, or both, and the units used to report
results differ among studies. Abundances of MNP are commonly expressed as
particles per unit area for sediment samples (e.g. km2 or m2), and particles per
unit volume for water samples (e.g. m3), although total pieces counted were
also reported in shoreline surveys (Table 3; see reviews by Hidalgo-Ruz et al.,
2002 and Eerkes-Medrano et al., 2015). Mass was occasionally used in grams per
km2, and yield in items per unit time were also reported in studies considering
discharge from WWTP and river flow. Larger pieces are often counted with the
naked eye or under a stereo microscope with further identification of smaller
pieces with the use of forensic techniques.

25
Table 2 Units commonly used by freshwaters studies on microplastics
Sample Type Unit Studies
sediment/ shoreline debris
total pieces Zbyszewski and Corcoran 2011
Faure et al. 2012
Free et al. 2014
Zbyszewski et al. 2014
Corcoran et al. 2015
items/particles per m2 Imhof et al. 2013
Castañeda et al. 2014
Faure et al. 2015
items/particles per kg1 Vianello et al. 2013
Wagner et al. 2014
Klein et al. 2015
items/particles per 250 mL of sediment Browne et al. 2011
water/effluent water
items/particles per m3 Moore et al. 2011
Magnusson and Nóren 2014
McCormick et al. 2014
Sadri and Thompson 2014
items/particles per km2 Faure et al. 2012
Eriksen et al. 2013
Free et al. 2014
Faure et al. 2015
items/particles per litre Browne et al. 2011
Dubaish and Liebezeit 2013
items/particles per 1000 m3 Lechner et al. 2014
grams per 1000 m3 Lechner et al. 2014
grams per km2 Yonkos et al. 2014
yield/discharge (rivers/WWTP)
items/particles per 72 hrs Moore et al. 2011
items/particles per year Dubaish and Liebezeit 2013
items/particles per day Chaskey et al. 2014
items/particles per hour Magnusson and Nóren 2014
1.6.2 Analytical Techniques for Identification
Source characterisation and composition of MNP can be performed with the use
of electron microscopy and spectroscopic techniques. Electron microscopy can
be employed when wavelength becomes a limiting factor in light microscopy,
since electrons have shorter wavelengths, which enables better resolution
(Nanoscience Instruments) and thus provides further insight on the chemical and
morphological characteristics of the plastic particles. There are two types of

26
electron microscopy: scanning electron microscopy (SEM) and transmission
electron microscopy (TEM), with the main difference being that in SEM,
electrons are bounced off the sample, while in TEM electrons go through the
sample creating a shadow. While SEM appears to be employed often (Zbyszewski
and Corcoran, 2011; Eriksen et al., 2013; Imhoff et al., 2013; Vianello et al.,
2013; Hoellein et al., 2014; McCormick et al., 2014; Zbyszewski et al., 2014) no
studies reported using TEM. Application of TEM may be particularly useful for the
rarely-identified plastics in the nano-sized category.
Similarly, spectroscopic tools can be used for added analysis of individual
particles, with Raman and Fourier Transform-Infra Red (FT-IR) spectroscopy used
more frequently. These techniques are applied to gather information on the
chemical composition of polymers and the crystalline structure of the particles
that can provide insight into the sorption behaviour for persitent,
bioaccumulating, and toxic substances, as well as the degradation of MNP based
on bond distances (Gerrard and Madams, 1986). Here, the basic principle is that
infrared radiation is passed through a sample, where it is absorbed, reflected or
transmitted. For example, Raman spectroscopy measures light scattered
whereas FT-IR measures absorbed light. Although there are few differences
between techniques, the end result is a molecular fingerprint represented by
absorption and transmission, and similar to a fingerprint no two will be alike
since different materials will generate different spectra based on their unique
molecular structures, which allows for identification of the compounds (Das and
Agrawal, 2011). This information can be used to trace sample important in
understanding site-specific loadings. By comparison, FT-IR is being implemented
more recently and broadly than Raman, perhaps owing its popularity to being
non-destructive, less costly and easier to use, and involving less sample
preparation (Tagg et al., 2015).
Spectroscopy methods can be combined with microscopy to improve accuracy.
For example, a couple of studies reported the use of micro-FT-IR and molecular
mapping by focal plane array (FPA), proposing this approach can help to reduce
scanning time, and facilitate the analysis of entire membrane filters and smaller
pieces without affecting spatial resolution (Vianello et al., 2013; Tagg et al.,
2015).
While the presence of microplastics in effluent indicates that current WWTP
processes are not removing MNP from wastewater, there is an absence of
discussion of approaches to examine the system and the impact that MNP may
have on WWT efficiency, such as bacterial treatment or blockages. Bacterial
growth, for example, can be measured a number of ways, including direct count
techniques or measuring of chemical oxygen demand (COD; APHA, 1992), in
which case an increase in COD would indicate a reduction or poisoning of the
bacterial population. Otherwise, with a healthy bacterial population, COD should

27
be removed faster. Additionally, techniques to test for blockages can be
potentially employed. For example, assessing whether biofilms are trapping or
removing some of the MNP fragments in trickling systems, using magnetic
resonance imaging (MRI) methods to visualise if flow paths (pore spaces) are
blocked by MNP. The latter could be done by using laboratory sand columns to
mimic WWTP processes, and employing standardised protocols to measure
hydraulic conductivity and water quality parameters.
1.6.3 Modelling of Transport
Higher abundances may be expected in habitats that accumulate smaller
particles of sediment (Browne et al., 2011), and their distribution may be
influenced by sediment transport and deposition processes (Castañeda et al.,
2014; Vianello et al., 2013; Klein et al., 2015). Hydrodynamic effects can have
greater influence in MNP distribution than population density, industrial
activities, or sewage discharge and MNP concentrations in river shores in
Germany (Klein et al., 2015). In this regard, transport models can be useful tools
to model MNP behaviour in riverine systems and evaluate the factors that control
their transport and distribution. Sources and discharge can be used as with other
contaminants to predict MNP loading and build models for MNP transport and
identification of areas of high deposition, although this approach was rarely
discussed in the MNP literature. In the Danube, plastic load at mean flow in the
Danube, and a correction factor for population density were used to calculate
plastic inputs to the Black Sea (Lechner et al., 2014). Flow rate data from two
California rivers were also used to estimate yields of >2 billion particles over a
72 hour period (Moore et al., 2011). In Venice, high correlations were observed
between small microplastics and fine grain size, indicating both follow similar
sinking and accumulation processes, with higher accumulation of MNP in low
energy sites (Vianelllo et al., 2013). Fundamentally, if plastics behave in the
same way as sediment, available hydraulic models can be easily applied to MNP
load studies, and if they behave differently, the models can be fine-tuned to get
their behaviour in properly. One possibility for this is the use of Delft hydraulics
model (Delft 3D suite) for rivers and estuaries. This model allows particle
tracking and has a morphology module that predicts sediment movement
(Deltares, https://oss.deltares.nl/web/delft3d/about). Correlation analysis can
be performed on grain and MNP size classes, and incorporated into the transport
model to project loading of MNP from freshwaters systems, including WWTP.
1.7 Research Objectives
This PhD study aims to describe and model the behaviour of MNPs in wastewater
treatment and fluvial systems.
The specific objectives of this project are:

28
1. Detect and quantify MNP in incoming and effluent water in a WWTP and
recipient water in an urban catchment
2. Identify the main sources and categories of MNP entering these systems
3. Evaluate the impact of MNP on WWTP efficacy at different treatment
stages
4. Assess the ability of WWTP to process MNP, and predict loading of MNP to
the environment
5. Model transport and distribution of MNP in receiving waters to determine
whether these systems are acting as sinks or sources
The premise of this research project is to fill in gaps of knowledge about MNP
debris in freshwaters and wastewater, and generate incisive understanding of
the distribution and behaviour of MNPs in these environments. Therefore, we
expect that the results of this project will inform stakeholders (e.g. legislators,
manufacturers, industry) and aid in the identification of priority areas for
further research, monitoring and regulation of MNP, and the development of
effective programmes and mitigation strategies. This project is also relevant to
the Scottish Government’s Hydro Nation goals of connecting research and policy,
developing the economic, environmental and social values of Scotland’s water
resources, and raising Scotland’s international profile and knowledge exchange.
1.8 References
Andrady AL. 2011. Microplastics in the marine environment. Mar. Pollut. Bull. 62: 1596-1605. Araújo MC, Costa M. 2007. An analysis of the riverine contribution to the solid wastes
contamination of an isolated beach at the Brazilian Northeast. Manage. Environ. Qual.: Int. J. 18: 6–12.
Andrady AL. 2009. Proceedings of the International Research Workshop on the Occurrence, Effects and Fate of Micro-plastic Marine Debris, Sept 9-11, 2008. NOAA Technical Memorandum NOS-OR&R-30. Arthur C, Baker J, and Bamford H (eds.).
APHA, AWWA and WPCF. 1992. Standard Methods for the Examination of Water and Wastewater, 18th ed., American Public Health Association: Washington, D.C.
Bakir A, Rowland SJ, Thompson RC. 2012. Competitive sorption of persistent organic pollutants onto microplastics in the marine environment. Mar. Pollut. Bull. 64: 2782-2789.
Besseling E, Quik JTK, Koelmans AA. 2014. Modeling the fate of nano- and microplastics in freshwater systems. May 2014, SETAC Annual Meeting, Basel, Switzerland. Abstract.
Browne MA, Crump P, Niven SJ, Teuten E, Tonkin A, Galloway T, Thompson R. 2011. Accumulation of microplastic on shorelines worldwide: sources and sinks. Environ. Sci. Technol. 45: 9175-9179.
Castañeda RA, Avlijas S, Simard, MA, Ricciardi A. 2014. Microplastic pollution in St. Lawrence River sediments. Can. J. Fish. Aquat. Sci. 71: 1767-1771.
Chaskey E, Hirsch T, Drake T, Ehmann K, Chu Y. 2014. Micro-plastic pollution: a comparative survey of wastewater effluent in New York. Poster.
Claessens M, van Cauwenberghe L, Vandegehuchte MB, Janssen CR. 2013. New techniques for the detection of microplastics in sediments and field collected organisms. Mar. Pollut. Bull. 70: 227-233.
Coe J, Rogers D. (eds.). 1997. Marine Debris: Sources, Impacts and Solutions. Springer, New York, pp. 161-170.
Cole M, Lindeque P, Halsband C, Galloway TS. 2011. Microplastics as contaminants in the marine environment: a review. Mar. Pollut. Bull. 62: 2588-2597.

29
Cole M, Webb H, Lindeque PK, Fileman ES, Halsband C, Galloway TS. 2014. Isolation of microplastics in biota-rich seawater samples and marine organisms. Scientific reports, 4.
Corcoran PL, Norris T, Ceccanese T, Walzak MJ, Helm PA, Marvin CH. 2015. Hidden plastics of Lake Ontario, Canada and their potential preservation in the sediment record. Environ. Pollut. 204: 17-25.
Das RS, Agrawal YK. 2011. Raman spectroscopy: recent advancements, techniques and applications. Vib. Spectrosc. 57: 163-176.
Defra (Department for Enviroment, Food, and Rural Affair). 2012. Waste water treatment in the United Kingdom – 2012: implementation of the European Union Urban Waste Water Treatment Directive – 91/271/EEC. 47 pp. Accessed online 30/12/2015 at <https://www.gov.uk/government/uploads/system/uploads/attachment_data/file/69592/pb13811-waste-water-2012.pdf>.
Derraik JG. 2002. The pollution of the marine environment by plastic debris: a review. Mar. Pollut. Bull. 44: 842-852.
Dubaish F, Liebezeit G. 2013. Suspended microplastics and black carbon particles in the Jade system, southern North Sea. Water Air Soil Poll. 224: 1-8.
Eerkes-Medrano D, Thompson RC, Aldridge DC. 2015. Microplastics in freshwater systems: a review of the emerging threats, identification of knowledge gaps and prioritisation of research needs. Water Res. 75: 63-82.
Endo S, Takizawa R, Okuda K, Takada H, Chiba K, Kanehiro H, Date T. 2005. Concentration of polychlorinated biphenyls (PCBs) in beached resin pellets: variability among individual particles and regional differences. Mar. Pollut. Bull. 50: 1103-1114.
Eriksen M, Mason S, Wilson S, Box C, Zellers A, Edwards W, Amato S. 2013. Microplastic pollution in the surface waters of the Laurentian Great Lakes. Mar. Pollut. Bull. 77: 177-182.
European Commission DG Environment. 2011. Plastic waste in the environment – Final report. April 2011.
European Commission. 2011. Plastic Waste: Ecological and Human Health Impacts. Science for Environment Policy: In-depth Reports. 41pp.
Farrel P, Nelson K. 2013. Trophic level transfer of microplastic: Mytilus edulis (L.) to Carcinus maenas (L.). Environ. Pollut. 177: 1-3.
Faure F, Corbaz M, Baecher H, de Alencastro L. 2012. Pollution due to plastics and microplastics in Lake Geneva and in the Mediterranean Sea. Arch. Sci., 65: 157-164.
Faure F, Demars C, Wieser O, Kunz M, de Alencastro L. 2015. Plastic pollution in Swiss surface waters: nature and concentrations, interaction with pollutants. Environ. Chem.
Fendall LS, Sewell MA. 2009. Contributing to marine pollution by washing your face: microplastics in facial cleansers. Mar. Pollut. Bull. 58: 1225-1228.
Free CM, Jensen OP, Mason SA, Eriksen M, Williamson NJ, Boldgiv B. 2014. High-levels of microplastic pollution in a large, remote, mountain lake. Mar. Pollut. Bull. 85: 156-163.
Galgani F, Leauté JP, Moguedet P, Souplet A, Verin Y, Carpentier A, Goraguer H, Latrouite D, Andral B, Cadiou Y, Mahe JC, Poulard JC, Nerisson P. 2000. Litter on the sea floor along European coasts. Mar. Pollut. Bull. 40: 516–527.
Galgani F, Hanke G, Werner S, Piha H. 2011. MSFD GES technical subgroup on marine litter. Technical recommendations for the implementation of MSFD requirements. JRC Scientific and Technical Report, EUR, 25009, 93.
Galgani F, Hanke G, Werner S, De Vrees L. 2013. Marine litter within the European Marine Strategy Framework Directive. ICES J. Mar. Sci. 70: 1055-1064.
GESAMP (Joint Group of Experts on the Scientific Aspects of Marine Environmental Protection). 1991. The state of the marine environment. London: Blackwell Scientific Publications. 146.
GESAMP (Joint Group of Experts on the Scientific Aspects of Marine Environmental Protection). 2015. Sources, fate and effects of microplastics in the marine environment: a global assessment. Kershaw PJ (ed.). (IMO/FAO/UNESCO-IOC/UNIDO/WMO/IAEA/UN/UNEP/UNDP Rep. Stud. GESAMP No. 90, 96 p.
Gerrard DL, Maddam WF. 1986. Polymer characterization by Raman spectroscopy. Appl. Spectrosc. Rev. 22: 251-334.
Gordon M. 2006. Eliminating Land-based Discharges of Marine Debris in California: A Plan of Action. Plastic Debris Rivers to Sea Project, Algalita Marine Research Foundation, California Coastal Commission, 91 pp.
Gregory MR, Andrady AL. 2003. Plastics in the marine environment. In Plastics and the Environment. Andrady AL. (ed.). John Wiley & Sons, Inc., Hoboken, NJ, USA. pp 379-401.
Haruo O., Fukamoto Y. 2000. A Sorting Method for Small Plastic Debris Floating on the Sea Surface and Stranded on Sandy Beaches. Bulletin of the Faculty of Fisheries 51:71-93.

30
Hidalgo-Ruz V, Gutow L, Thompson RC, Thiel M. 2012. Microplastics in the marine environment: a review of the methods used for identification and quantification. Environ. Sci. Technol. 46: 3060-3075.
Hoellein TJ, McCormick A, Kelly JJ. 2014. Riverine microplastic: abundance and bacterial community colonization. Joint Aquatic Sciences Meeting. Portland, OR, USA. Abstract.
Imhof HK, Ivleva NP, Schmid J, Niessner R, Laforsch C. 2013. Contamination of beach sediments of a subalpine lake with microplastic particles. Curr. Biol. 23: 867-868.
Ivar do Sul JA, Costa MF. Plastic pollution risks in an estuarine conservation unit. In Conley DC, Masselink G, Russell PE, O’Hare TJ. (eds.). Proceedings from the 12th International Coastal Symposium (Plymouth, England), Journal of Coastal Research, Special Issue No. 65, 2013, pp 48–53.
Jeftic L, Sheavly SB, Adler E. 2009. Marine litter: a global challenge. Meith N. (ed.). Regional Seas, United Nations Environment Programme.
Kang JH, Kwon OY, Lee KW, Song YK, Shim WJ. 2015. Marine neustonic microplastics around the southeastern coast of Korea. Mar. Pollut. Bull. 96: 304-312.
Klein S, Worch E, Knepper TP. 2015. Occurrence and spatial distribution of microplastics in river shore sediments of the Rhine-Main area in Germany. Environ. Sci. Technol. 19: 6070-6076.
Koelmans AA, Besseling E, Shim WJ. 2015. Nanoplastics in the aquatic environment. In Marine Anthropogenic Litter. Bergmann M, Gutow L, Klages M. (eds.). Springer, Berlin pp. 325–342.
Lechner A, Keckeis H, Lumesberger-Loisl F, Zens B, Krusch R, Tritthart M, Schludermann E. 2014. The Danube so colourful: a potpourri of plastic litter outnumbers fish larvae in Europe's second largest river. Environ. Pollut. 188: 177-181.
Lee J, Hong S, Song YK, Hong SH, Jang YC, Jang M, Shim WJ. 2013. Relationships among the abundances of plastic debris in different size classes on beaches in South Korea. Mar. Pollut. Bull. 77: 349-354.
Magnusson K, Norén F. 2014. Screening of microplastic particles in and down-stream a wastewater treatment plant. Technical Report published for IVL Swedish Environmental Research Institute, August 2014; Swedish Environmental Research Institute: Stockholm, Sweden.
Masura J, Baker J, Foster G, Arthur C. 2015. Laboratory methods for the analysis of microplastics in the marine environment: recommendations for quantifying synthetic particles in waters and sediments. NOAA Technical Memorandum NOS-OR&R-48.
Mato Y, Isobe T, Takada H, Kanehiro H, Ohtake C, Kaminuma T. 2001. Plastic resin pellets as a transport medium for toxic chemicals in the marine environment. Environ. Sci. Technol. 35: 318-324.
McCormick A, Hoellein TJ, Mason SA, Schluep J, Kelly JJ. 2014. Microplastic is an abundant and distinct microbial habitat in an urban river. Environ. Sci. Technol. 48: 11863-11871.
Moore C.J., Moore S.L., Leecaster M.K., Weisberg S.B. 2001. A comparison of plastic and plankton in the North Pacific central gyre. Marine Pollution Bulletin 40:83-88.
Moore CJ, Lattin GL, Zellers AF. 2011. Quantity and type of plastic debris flowing from two urban rivers to coastal waters and beaches of Southern California. Journal of Integrated Coastal Zone Management. 11: 65-73.
Morritt D, Stefanoudis PV, Pearce D, Crimmen OA, Clark PF. 2014. Plastic in the Thames: a river runs through it. Mar. Pollut. Bull. 78: 196-200.
MSFD Technical Subgroup on Marine Litter. 2013. Monitoring Guidance for Marine Litter in European Seas, Draft report. Brussels: European Commission.
Nuelle MT, Dekiff JH, Remy D, Fries E. 2014. A new analytical approach for monitoring microplastics in marine sediments. Environ. Pollut. 184: 161-169.
Pauly JL, Stegmeier SJ, Allaart HA, Cheney RT, Zhang PJ, Mayer AG, Streck RJ. 1998. Inhaled cellulosic and plastic fibers found in human lung tissue. Cancer Epidem. Biomar. 7: 419-428.
Plastics Europe (2015) Plastics—The Facts 2014/2015. An Analysis of European Plastics Production, Demand and Waste Data (Plastics Europe, Brussels).
Rech S, Macaya-Caquilpán V, Pantoja JF, Rivadeneira MM, Madariaga DJ, Thiel M. 2014. Rivers as a source of marine litter–A study from the SE Pacific. Mar. Pollut. Bull. 82: 66-75.
Rios Mendoza LM, Evans CY. 2013. Plastics are invading not only the ocean but also the Great Lakes. Abstracts of Papers of the American Chemical Society Vol. 245.
Rochman CM, Hoh E, Kurobe T, Teh, SJ. 2013. Ingested plastic transfers hazardous chemicals to fish and induces hepatic stress. Scientific Reports, 3.
Roex E, Vethaak D, Leslie H, Kreuk MD. 2013. Potential risk of microplastics in the fresh water environment. STOWA, Amersfoort.

31
Ryan PG, Moore CJ, van Franeker JA, Moloney CL. 2009. Monitoring the abundance of plastic debris in the marine environment. Philos. T. Roy. Soc. B 364: 1999–2012.
Sadri SS, Thompson RC. 2014. On the quantity and composition of floating plastic debris entering and leaving the Tamar Estuary, Southwest England. Mar. Pollut. Bull. 81: 55-60.
Sanchez W, Bender C, Porcher JM. 2014. Wild gudgeons (Gobio gobio) from French rivers are contaminated by microplastics: preliminary study and first evidence. Environ. Res.128: 98-100.
Scottish Water. 2015. Waste Water Treatment. Accessed online 30/10/2015 at <http://www.scottishwater.co.uk/old-education/all-about-water/waste-water-treatment>
Storck FR, Karlsruhe TZW, Kools, SA. 2015. Microplastics in Fresh Water Resources. Tagg AS, Sapp M, Harrison JP, Ojeda JJ. 2015. Identification and quantification of microplastics
in wastewater using FPA-based reflectance micro-FT-IR imaging. Anal. Chem. 87: 6032-6040. The World Bank Group. 2015. Introduction to Wastewater Treatment Processes. Accessed online
30/10/2015 at <http://water.worldbank.org/shw-resource-guide/infrastructure/menu-technical-options/wastewater-treatment>
Thompson RC, Olsen Y, Mitchell RP, Davis A, Rowland SJ, John AWG, McGonigle D, Russell AE. 2004. Lost at sea: where is all the plastic? Science 304: 838.
Thompson RC. 2006. Plastic debris in the marine environment: consequences and solutions. Marine Nature Conservation in Europe 2006 107. Chicago
Thompson RC, Swan SH, Moore CJ, vom Saal FS. 2009. Our plastic age. Philos. Trans. R. Soc. London, Ser. B Biol. Sci. 364 (1526), 1973–1976.
Vianello A, Boldrin A, Guerriero P, Moschino V, Rella R, Sturaro A, Da Ros L. 2013. Microplastic particles in sediments of Lagoon of Venice, Italy: first observations on occurrence, spatial patterns and identification. Estuar. Coast. Shelf Sci. 130: 54-61.
Wagner M, Scherer C, Alvarez-Muñoz D, Brennholt N, Bourrain X, Buchinger S, Reifferscheid G. 2014. Microplastics in freshwater ecosystems: what we know and what we need to know. Environ. Sci. Eur. 26: 1-9
Williams AT, Simmons SL. 1996. The degradation of plastic litter in rivers: implications for beaches. J. Coast. Conserv. 2: 63-72.
Yonkos LT, Friedel EA, Perez-Reyes AC, Ghosal S, Arthur CD. 2014. Microplastics in four estuarine rivers in the Chesapeake Bay, USA. Environ. Sci. Technol. 48: 14195-14202.
Zbyszewski M, Corcoran PL. 2011. Distribution and degradation of fresh water plastic particles along the beaches of Lake Huron, Canada. Water Air Soil Pollut. 220: 365-372.
Zbyszewski M, Corcoran PL, Hockin A. 2014. Comparison of the distribution and degradation of plastic debris along shorelines of the Great Lakes, North America. Journal of Great Lakes Research, 40: 288-299.
Zettler ER, Mincer TJ, Amaral-Zettler LA. 2013. Life in the “plastisphere”: microbial communities on plastic marine debris. Environ. Sci. Technol. 47: 7137-7146.