Embed Size (px)
Citation preview
Micro- and Nanoelectrochemistry for Surface Patterning, Biosensing and
Electrocatalysis
Dissertation
zur Erlangung des Grades eines Doktors der Naturwissenschaften
Fakultät für Chemie und Biochemie
Ruhr-Universität Bochum
vorgelegt von
Jan Clausmeyer
- Bochum, Februar 2016 -


This work was carried out in the period from May 2012 to February 2016 in the Department of
Analytical Chemistry under the supervision of Prof. Dr. Wolfgang Schuhmann, Ruhr-Universität
Bochum, Germany.
First Examiner: Prof. Dr. Wolfgang Schuhmann
Second Examiner: Prof. Dr. Martin Muhler


Acknowledgements
I have been very fortunate to work with some very inspiring individuals and I hope my efforts
may be an inspiration to others. I am thankful to everyone who believed in me, advised me,
shared a piece of knowledge, created some opportunities or supported me otherwise. My
gratitude goes especially to these people without whom this work would not have been possible.
I thank Prof. Dr. Martin Muhler for agreeing to co-examine this work.
I am very grateful to all former and present members of Prof. Dr. Yuri Korchev’s group at the
Imperial College London who were involved with this amazing collaboration. Especially, I thank
Yuri Korchev for his contagious passion in science, the opportunity to work in his lab and to take
over some responsibilities. Dr. Paolo Actis openly shared his knowledge about nanoelectrodes,
encouraged me to go further and gave many helpful hints. I am also very thankful to Dr. Ainara
López Córdoba for welcoming me, being a good friend and sharing her knowledge about cells.
Working together with Dr. Yanjun Zhang was a pleasure because of his expertise, kindness and
his persistence that turned the collaboration into a very successful story.
I thank Dr. Nicolas Plumeré for his support at an early stage of my project as well as Dr. Justus
Masa and Dr. Edgar Ventosa for their inspirational input on electrocatalysis and battery
electrochemistry. It was my pleasure to collaborate with marvelous Dr. Lutz Stratmann and Dr.
Dominik Schäfer who both contributed tremendously. I am also grateful to Dr. Thomas Erichsen
and Dr. Kirill Sliozberg for their technical help on all kinds of issues and to Bettina Stetzka for
her unselfish support.
I thank all students I used to work with and who became esteemed colleagues or continue their
way elsewhere: Alexander Botz, Stefanie Stapf, Tuba Simsek, Youssef Slibi, João Junqueira,
Tsvetan Tarnev, Anna Tymoczko, Denis Öhl, Tobias Löffler and Patrick Wilde. I would like to
thank especially Anna Muhs and Miriam Marquitan for their tremendous efforts and
contributions.
I am grateful to all my great colleagues and friends who made life and work in the past years
amazing and unforgettable. Special thanks go to my parents and Monika for supporting me and
giving me everything to make me ready to start an endeavor like this. Most of all, I thank
Katharina for her love, support and understanding throughout the past years.
I am most thankful to Prof. Dr. Wolfgang Schuhmann for not missing a single chance to support
me. He provided countless opportunities for me and always found the right balance between
advising me and giving me the freedom to develop myself.


All experiments were conceived, analyzed and performed by the author of this thesis, if not noted
otherwise. If applicable, references to collaborations and contributions of other persons are
indicated in the beginning of each chapter. It is also indicated whether content appearing in this
thesis was published elsewhere.

Abstract
Exploiting the physiology of living organisms at the single-cell level, electrochemical
characterization of single nanoparticles, and high-throughput studies of biomolecule function all
share a common need for advanced micro- and nanotechnological methods as well as chemical
analysis with high spatial resolution. This work describes how the merits of micro- and
nanoelectrodes are applied for electrochemical surface patterning, the detection of various
analytes inside and around single cells, and electrocatalytic studies at individual nanoparticles.
For the selective electrochemical patterning, carbon surfaces are modified with organic
electrochemically addressable surface functionalities such as protected p-hydroquinone
moieties as well as nitrophenyl groups. Highly localized activation of the redox active films is
achieved using two different scanning probe techniques: The Scanning Electrochemical Droplet
Cell (SDC) as well as Scanning Electrochemical Microscopy (SECM). After selective local
modification, the activated surface groups can capture and immobilize molecules which allow
for the construction of high-density analytical biomolecule arrays.
For the analysis of cell metabolism and oxidative stress conditions, molecular oxygen and
hydrogen peroxide are detected at single cells using needle-type carbon nanoelectrodes.
Modification with Prussian Blue creates nanosensors for the selective detection of H2O2. Due to
the small size of the sensors, reactive oxygen species (ROS) are detected outside and inside the
cell. To increase the sensitivity of the amperometric sensors, an alternative scheme based on
potentiometric sensing is proposed.
Moreover, to increase the sensitivity and allow highly flexible sensor designs, field effect
transistor (FET) sensors are built on dual carbon nanoelectrodes. Polypyrrole deposited on the
tip of the dual probe acts as the transistor channel. The high-aspect ratio FET nanosensor is used
to detect the local acidification in the microenvironment of cancer cells. Modifying the transistor
channel with hexokinase allows for sensitive ATP measurements at single cells.
Finally, the merits of nanoelectrodes are exploited for the investigation of nanoparticle
electrocatalysts. Individual Ni(OH)2 nanoparticles deposited on nanoelectrodes are
characterized in non-ensemble measurements with respect to their properties for energy
storage and electrocatalytic activity for the oxygen evolution reaction (OER). Charging by
oxidation of Ni(OH)2 is limited by diffusion of protons in the particle bulk and the OER activity is
independent of particle size.

Contents
1 Introduction ............................................................................................................ 1
2 State of the Art ........................................................................................................ 2
2.1 Electrochemical Patterning toward Biomolecule Immobilization ....................................................... 2 2.1.1 Patterned electrode arrays ............................................................................................................................................. 3 2.1.2 Patterning via electrophoretic delivery of reagents ........................................................................................... 4 2.1.3 Patterning by means of Scanning Electrochemical Microscopy .................................................................... 4
2.1.3.1 Local production of reagents ................................................................................................................................ 4 2.1.3.2 Direct electrochemical reaction at the sample surface ............................................................................. 6
2.2 Nanoelectrodes – Motivation, Fabrication and Handling ........................................................................ 8 2.2.1 Nanoelectrode fabrication .............................................................................................................................................. 9
2.2.1.1 Insulated STM tips and fibers ............................................................................................................................... 9 2.2.1.2 Metals fused in capillaries................................................................................................................................... 10 2.2.1.3 Carbon-filled nanopipettes ................................................................................................................................. 11 2.2.1.4 Other nanoelectrode fabrication protocols ................................................................................................. 12
2.2.2 Special precautions and considerations for studies at nanoelectrodes .................................................. 13 2.2.2.1 Theory of electrochemistry at the nanoscale ............................................................................................. 13 2.2.2.2 Technical and instrumental aspects ............................................................................................................... 15
2.3 High-Resolution Electrochemical Imaging ................................................................................................. 16
2.4 Cell Analysis ........................................................................................................................................................... 19
2.4.1 Detection of reactive oxygen species ...................................................................................................................... 19 2.4.2 Electrochemical single-cell analysis ........................................................................................................................ 22
2.5 Field Effect Transistor Sensors ....................................................................................................................... 27
2.6 Nanoparticle Electrochemistry ....................................................................................................................... 31
3 Aim of the Work .................................................................................................. 35
4 Results and Discussion ..................................................................................... 37
4.1 Electrochemical Surface Patterning ............................................................................................................. 37 4.1.1 Global electrode modification with p-hydroquinone layers ......................................................................... 37 4.1.2 Potentiostatic patterning in the SECM ................................................................................................................... 39 4.1.3 Galvanostatic patterning in the SECM .................................................................................................................... 40
4.1.3.1 Patterning of TBDMS-protected p-hydroquinone layers ...................................................................... 40 4.1.3.2 Patterning of nitrophenyl layers ...................................................................................................................... 42
4.1.4 Patterning in the Scanning Droplet Cell ................................................................................................................. 47
4.2 Nanoelectrode Fabrication and Characterization ................................................................................... 51
4.3 Amperometric Nanosensors in Biological Applications ........................................................................ 54 4.3.1 Platinized nanoelectrodes for oxygen measurements .................................................................................... 54 4.3.2 Prussian Blue-modified nanoelectrodes for the detection of H2O2 ........................................................... 57 4.3.3 H2O2 measurements at single living cells .............................................................................................................. 65
4.4 Potentiometric Sensors on Nanoelectrodes............................................................................................... 71
4.5 Field Effect Transistor Sensors on Nanoelectrodes ................................................................................ 78
4.5.1 pH-sensitive polypyrrole FETs on dual carbon nanoelectrodes................................................................. 78 4.5.2 pH measurements at cells ............................................................................................................................................ 84 4.5.3 PPy-FET nanobiosensors for ATP measurements ............................................................................................ 86 4.5.4 ATP detection at cells ..................................................................................................................................................... 89

4.6 Single Nanoparticle Electrochemistry ......................................................................................................... 94 4.6.1 Electrocatalyst studies .................................................................................................................................................. 94 4.6.2 Study of energy storage materials ......................................................................................................................... 103
5 Conclusions and Outlook ............................................................................... 106
6 Experimental Procedures ............................................................................. 110
6.1 Syntheses ..............................................................................................................................................................110
6.2 Global Electrode Modification and Characterization ...........................................................................112 6.2.1 Surface modification with TBDMS-protected p-hydroquinone groups ................................................ 112 6.2.2 Surface modification with nitrophenyl groups ............................................................................................... 112
6.3 SECM Patterning and Imaging .......................................................................................................................113 6.3.1 Fabrication of microelectrodes............................................................................................................................... 113 6.3.2 Surface modification with TBDMS-protected p-hydroquinone groups ................................................ 113 6.3.3 Surface modification with nitrophenyl groups ............................................................................................... 113
6.4 Scanning Droplet Cell Patterning .................................................................................................................114
6.5 Atomic Force Microscopy ................................................................................................................................115
6.6 Fabrication and Handling of Carbon Nanoelectrodes ..........................................................................115
6.7 Setups for Electrochemical Measurements and Positioning of Nanoelectrodes ........................117
6.8 Protocols for the Modification and Characterization of Carbon Nanoelectrodes ......................120 6.8.1 General............................................................................................................................................................................... 120 6.8.2 SEM imaging .................................................................................................................................................................... 120 6.8.3 Platinization .................................................................................................................................................................... 121
6.8.4 Fabrication and characterization of PB-based H2O2 nanosensors .......................................................... 121 6.8.5 Fabrication and characterization of PPy FET nanosensors ....................................................................... 121 6.8.6 Immobilization of hexokinase on PPy-FET nanosensors ............................................................................ 122 6.8.7 Deposition and characterization of Ni(OH)2 nanoparticles ....................................................................... 122
6.9 Local Measurements at Cells..........................................................................................................................123 6.9.1 H2O2 detection in macrophage cells ..................................................................................................................... 123 6.9.2 pH and ATP measurements using PPy-FET nanosensors ........................................................................... 123
6.10 Cell Culture and Tissue Preparation ........................................................................................................123 6.10.1 Brain slice preparation ............................................................................................................................................ 123 6.10.2 Dorsal root ganglia (DRG) neuronal culture .................................................................................................. 124 6.10.3 Macrophage cell culture .......................................................................................................................................... 124 6.10.4 Melanoma and melanocyte culture .................................................................................................................... 124
6.10.5 Isolation of rat ventricular myocytes ................................................................................................................ 125
7 References .......................................................................................................... 126
8 Annex .................................................................................................................... 146
8.1 Abbreviation List ...............................................................................................................................................146
8.2 Publications .........................................................................................................................................................147
8.3 Conference Contributions ...............................................................................................................................148 8.3.1 Oral presentations ........................................................................................................................................................ 148 8.3.2 Poster presentations ................................................................................................................................................... 149

1 Introduction
1
1 Introduction
Parts of the introduction and state of the art are published in ref. [1]: “Clausmeyer, J.; Schuhmann,
W.; Plumeré, N.; TrAC Trends Anal. Chem. 2014, 58, 23–30” and ref. [2]: “Clausmeyer, J.;
Schuhmann, W.; TrAC Trends Anal. Chem. 2016, DOI: 10.1016/j.trac.2016.01.018”
From the metabolism and communication mechanisms in biological organisms to current
industrial technologies for energy conversion and storage, electrochemistry governs many
processes relevant to our present and future existence. Metabolic pathways and signal
transduction mechanisms in cells are largely dictated by the electrochemical properties of their
components, namely redox active molecules. At the same time, powerful analytical techniques
based on electrochemical phenomena help in investigating cells and biomolecules and thus
contribute to the understanding of life’s principles. Moreover, in order to cover our high demand
for energy in the future, electrochemistry has to provide sustainable strategies for the
conversion and storage of energy without relying on fossil fuels. Not only new catalyst and
energy storage materials with outstanding properties need to be developed but also suitable
techniques for assessing their performance are necessary to turn the gained knowledge into
more rational design of materials.
The entities of study, e.g. biological cells or nanostructured materials are very small and their
properties result from physicochemical phenomena taking place at the nano- and microscale.[3,4]
Thus, analytical methods based on nano- and microelectrodes are promising tools to obtain
analytical information from these small entities.[5–7] For instance, the physiology of single cells
can be studied or catalytic reactions occurring at single nanoparticles can be investigated. In
addition, highly resolved electrochemical imaging[8,9] yields information concerning the
heterogeneous electrochemical activity in biological systems[10,11] and energy materials.[12] These
techniques aim at obtaining information that is difficult to get using conventional analytical
methodologies. However, techniques based on nano- and microelectrodes are not only restricted
to the sole detection and analysis but electrochemical probe techniques offer manifold
possibilities for specific local manipulation of samples, localized delivery of reagents and the
generation of micro- and nanoscale structures. Electrochemical techniques are promising
alternatives to classical patterning schemes[13–16] due to their ability both for surface patterning
at the micro- and nanoscale as well as for high-resolution visualization of the patterned surface
chemistry.[17]

2 State of the Art
2.1 Electrochemical Patterning toward Biomolecule Immobilization 2
2 State of the Art
2.1 Electrochemical Patterning toward Biomolecule Immobilization
Microarrays of biomolecules patterned onto a solid support are powerful tools for high-
throughput investigation of biomolecules interactions.[13,14,18,19] DNA and protein arrays were
implemented for function determination, diagnostics and drug screening. In recent years much
effort was spent to reduce the dimensions of generated biomolecule patterns in order to
increase the density of information on a given surface area. Biomolecules need to be
immobilized on small patterns with high control over the surface chemistry. However, with
decreasing patterning dimensions it becomes increasingly challenging to maintain and
demonstrate the chemoselectivity of the immobilization procedure. Many characterization tech-
niques fail to provide information about the surface chemistry used for attachment of molecules.
In the light of these considerations, new concepts that push forward the limits of array
generation with high spatial resolution are necessary. Moreover, novel analytical methods for
localized characterization of patterned surfaces are needed. Special attention needs to be paid to
a critical assessment of the surface chemistry and chemoselectivity of immobilization
procedures.
The goal in the fabrication of bioarrays is to assemble as many different samples of biological
recognition elements as possible on a given surface area to increase throughput of the biological
assay. At the same time the amount of consumed sample for each spot is reduced with
decreasing pattern dimensions. The spatial information to create a laterally heterogeneous
surface, the patterning, may originate from various sources. Classically, different specimens to
immobilize are dispensed to discrete areas on a surface with the help of a nozzle or pin for
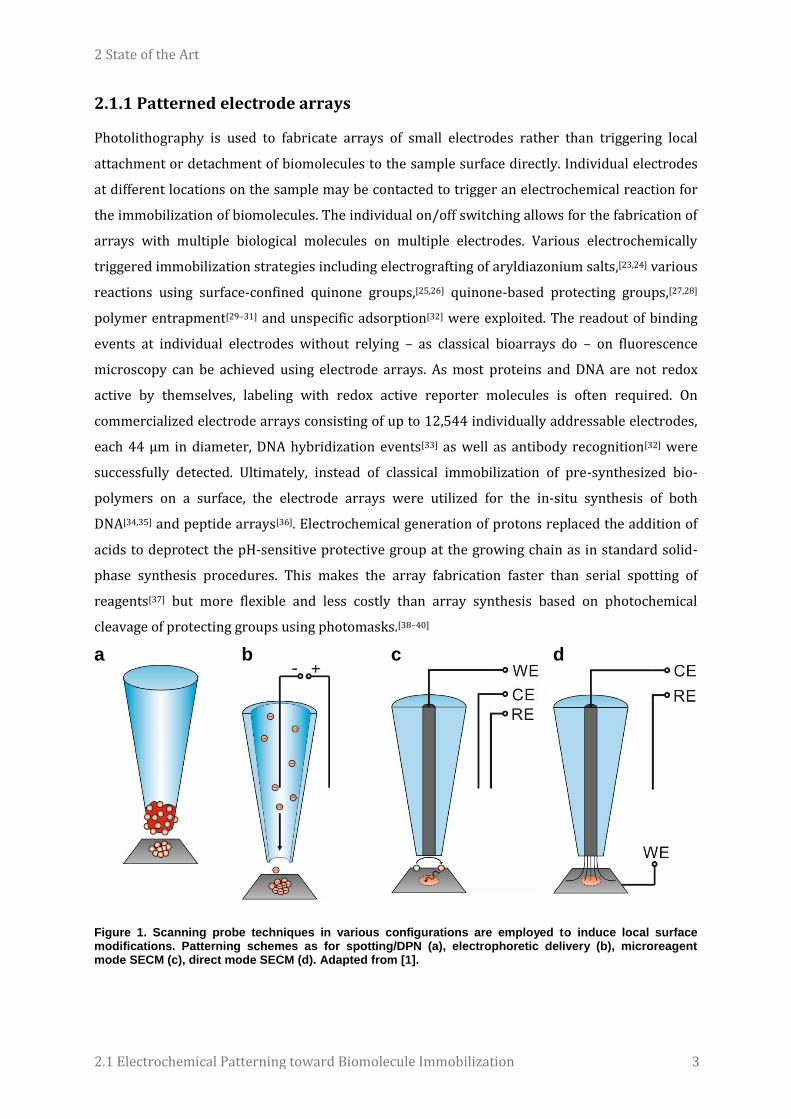
printing or spotting, respectively (Figure 1 a).[18,19] Recently, the spatial resolution of patterning
was significantly improved by using atomic force microscopy (AFM) integrating cantilevers with
a fluidic channel to dispense reagents.[20] These approaches imply a serial patterning process as
opposed to parallel patterning employing photolithographic techniques.[16] Parallel patterning
techniques typically use a photomask and light is irradiated to restricted areas on the sample
triggering chemical reactions to crosslink[21] or remove material such as photo-cleavable
protection groups or biomolecule repelling films from the surface.[22] The necessity for a
template limits the flexibility when designing the biomolecule array. Additionally, protocols
from classical photolithography as used in microelectronics fabrication cannot be easily adapted
to sensitive biomolecules because the reaction conditions may affect the structure and activity of
biomolecules already immobilized on the array surface.
2 State of the Art
2.1 Electrochemical Patterning toward Biomolecule Immobilization 3
2.1.1 Patterned electrode arrays
Photolithography is used to fabricate arrays of small electrodes rather than triggering local
attachment or detachment of biomolecules to the sample surface directly. Individual electrodes
at different locations on the sample may be contacted to trigger an electrochemical reaction for
the immobilization of biomolecules. The individual on/off switching allows for the fabrication of
arrays with multiple biological molecules on multiple electrodes. Various electrochemically
triggered immobilization strategies including electrografting of aryldiazonium salts,[23,24] various
reactions using surface-confined quinone groups,[25,26] quinone-based protecting groups,[27,28]
polymer entrapment[29–31] and unspecific adsorption[32] were exploited. The readout of binding
events at individual electrodes without relying – as classical bioarrays do – on fluorescence
microscopy can be achieved using electrode arrays. As most proteins and DNA are not redox
active by themselves, labeling with redox active reporter molecules is often required. On
commercialized electrode arrays consisting of up to 12,544 individually addressable electrodes,
each 44 µm in diameter, DNA hybridization events[33] as well as antibody recognition[32] were
successfully detected. Ultimately, instead of classical immobilization of pre-synthesized bio-
polymers on a surface, the electrode arrays were utilized for the in-situ synthesis of both
DNA[34,35] and peptide arrays[36]. Electrochemical generation of protons replaced the addition of
acids to deprotect the pH-sensitive protective group at the growing chain as in standard solid-
phase synthesis procedures. This makes the array fabrication faster than serial spotting of
reagents[37] but more flexible and less costly than array synthesis based on photochemical
cleavage of protecting groups using photomasks.[38–40]
a
b
c
d
Figure 1. Scanning probe techniques in various configurations are employed to induce local surface modifications. Patterning schemes as for spotting/DPN (a), electrophoretic delivery (b), microreagent mode SECM (c), direct mode SECM (d). Adapted from [1].
2 State of the Art
2.1 Electrochemical Patterning toward Biomolecule Immobilization 4
2.1.2 Patterning via electrophoretic delivery of reagents
Owing to the fact that most biomolecules are charged they may be locally delivered from micro-
and nanopipettes to the surface by applying a voltage between an electrode inside the pipette
and an external one (Figure 1 b). This configuration is also used in Scanning Ion Conductance
Microscopy (SICM)[41] to precisely control the distance between the fragile nanopipette tip and
the sample surface by measuring the ionic current through the pipette orifice (see paragraph
2.3). The advantage of this technique is that e.g. immobilized DNA[42] or proteins[43] are in
solution at all times during patterning which prevents from possible denaturation. The
requirement is a surface chemistry that is reactive enough to capture the delivered molecules
instantaneously in order to avoid dilution or broadening of the biomolecule patterns. Instead of
using the SICM-based distance control the nanopipette was also coupled to an AFM[44]. This
technique, often called nanofountain, allowed also for parallel patterning using multiple tips,[45]
however in air. Recently, a nanopipette was filled with an organic solvent containing an
aryldiazonium salt species which was driven out from the pipette and electroreduced at the
sample electrode to generate surface patterns.[46]
2.1.3 Patterning by means of Scanning Electrochemical Microscopy
Scanning Electrochemical Microscopy (SECM) employs a micro- or nanoelectrode which can be
moved with high precision along the three directions of space. Typically, an electrochemical
reaction is carried out at the microelectrode tip and the tip is brought close to the sample
surface. This results in a perturbation of the typical electrochemical behavior of the
microelectrode observed in bulk solution. For instance, kinetics of electrochemical reactions or
production of electrochemically active species at the sample can be detected, quantified and
visualized.[47] The advantage of SECM for patterning of surfaces is that interfacial reactions with
biomolecules can be locally triggered without prior loading of the tip as it is necessary in dip-pen
nanolithography (DPN) or nanofountain technology. Surface patterning using the SECM splits up
in two modes of operation, the microreagent mode (Figure 1 c) and the direct mode (Figure 1 d)
whose advantages and disadvantages will be discussed below.
2.1.3.1 Local production of reagents
Active reagents can be locally generated at a micro- or nanoelectrode by electrochemical
conversion of precursors available in bulk solution (Figure 1 c). The chemistry at the
microelectrode tip is precisely controlled by the applied potential. A follow-up chemical reaction
with specific functional groups at the sample surface may promote localized attachment,
detachment or deactivation of biomolecules. This principle is referred to as microreagent mode
or indirect mode of SECM. In the microreagent mode, changes in surface functionality may be
induced by local changes in the pH value invoked by electrochemical water splitting at the
2 State of the Art
2.1 Electrochemical Patterning toward Biomolecule Immobilization 5
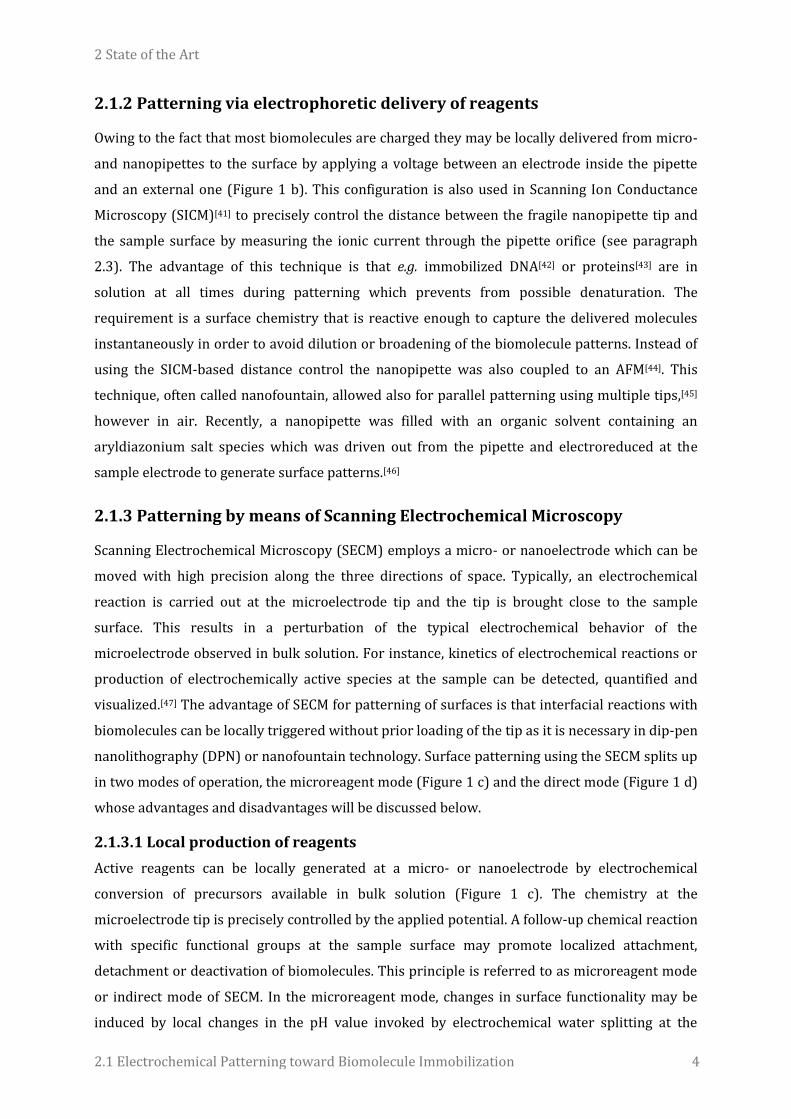
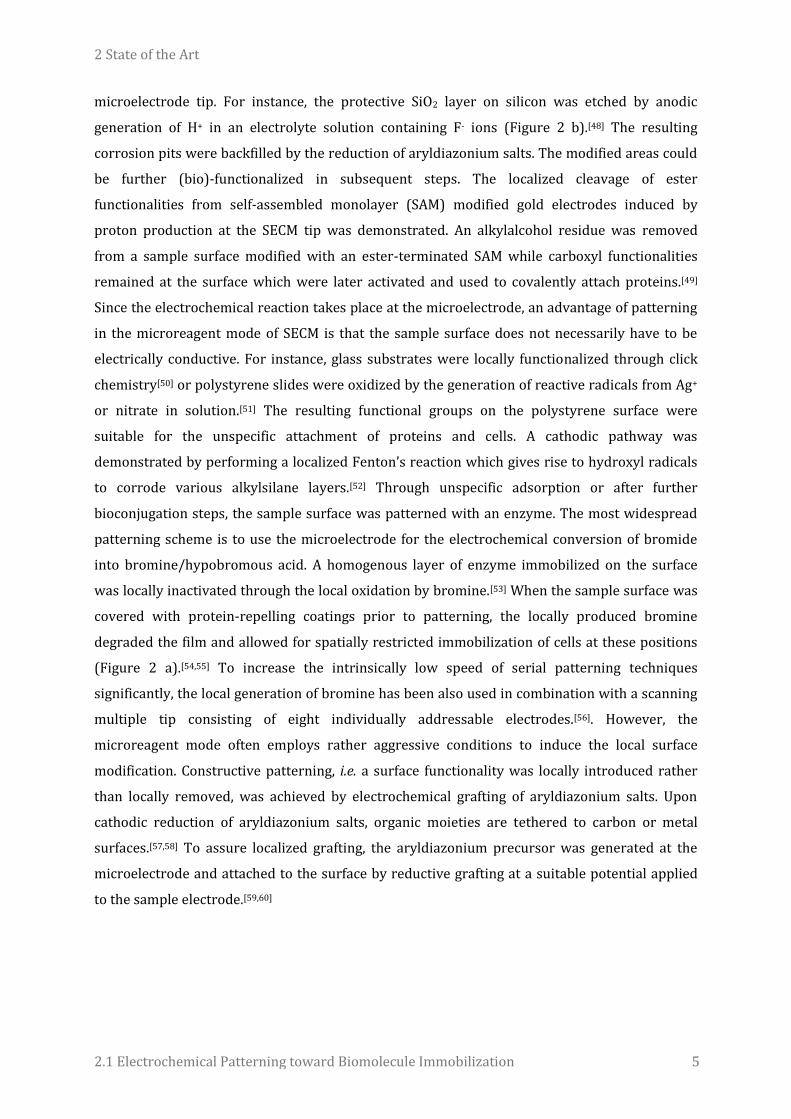
microelectrode tip. For instance, the protective SiO2 layer on silicon was etched by anodic
generation of H+ in an electrolyte solution containing F- ions (Figure 2 b).[48] The resulting
corrosion pits were backfilled by the reduction of aryldiazonium salts. The modified areas could
be further (bio)-functionalized in subsequent steps. The localized cleavage of ester
functionalities from self-assembled monolayer (SAM) modified gold electrodes induced by
proton production at the SECM tip was demonstrated. An alkylalcohol residue was removed
from a sample surface modified with an ester-terminated SAM while carboxyl functionalities
remained at the surface which were later activated and used to covalently attach proteins.[49]
Since the electrochemical reaction takes place at the microelectrode, an advantage of patterning
in the microreagent mode of SECM is that the sample surface does not necessarily have to be
electrically conductive. For instance, glass substrates were locally functionalized through click
chemistry[50] or polystyrene slides were oxidized by the generation of reactive radicals from Ag+
or nitrate in solution.[51] The resulting functional groups on the polystyrene surface were
suitable for the unspecific attachment of proteins and cells. A cathodic pathway was
demonstrated by performing a localized Fenton’s reaction which gives rise to hydroxyl radicals
to corrode various alkylsilane layers.[52] Through unspecific adsorption or after further
bioconjugation steps, the sample surface was patterned with an enzyme. The most widespread
patterning scheme is to use the microelectrode for the electrochemical conversion of bromide
into bromine/hypobromous acid. A homogenous layer of enzyme immobilized on the surface
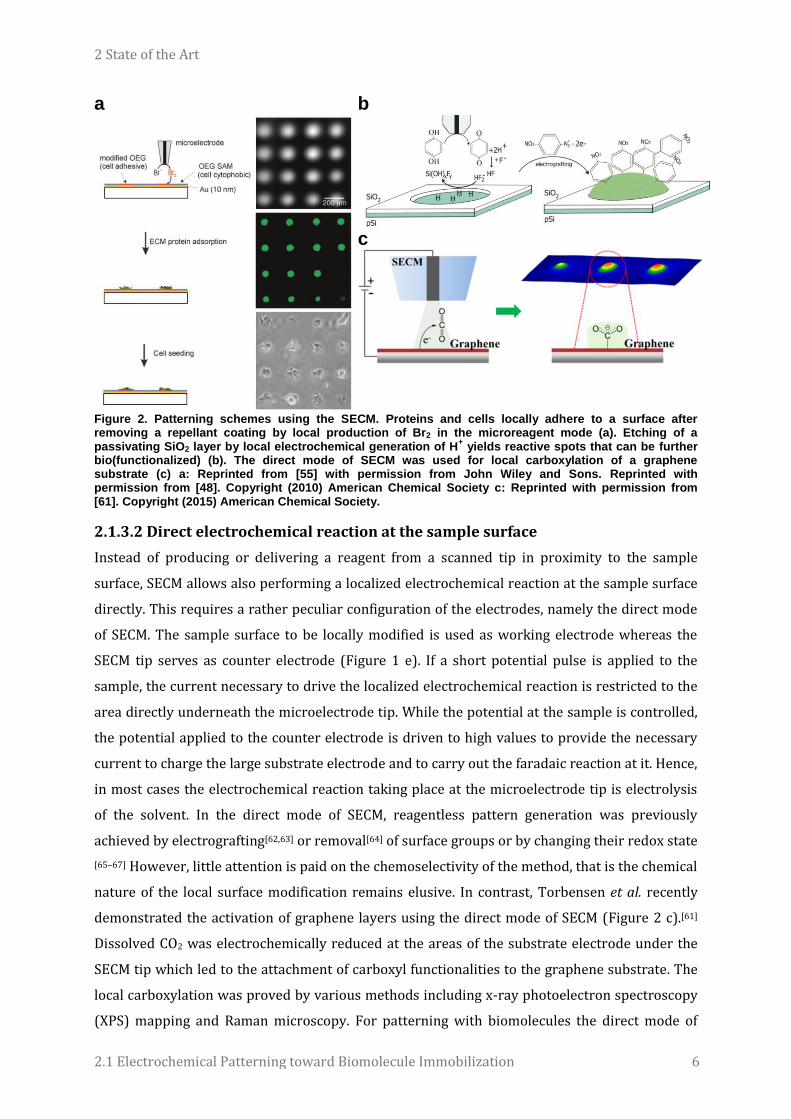
was locally inactivated through the local oxidation by bromine.[53] When the sample surface was
covered with protein-repelling coatings prior to patterning, the locally produced bromine
degraded the film and allowed for spatially restricted immobilization of cells at these positions
(Figure 2 a).[54,55] To increase the intrinsically low speed of serial patterning techniques
significantly, the local generation of bromine has been also used in combination with a scanning
multiple tip consisting of eight individually addressable electrodes.[56]. However, the
microreagent mode often employs rather aggressive conditions to induce the local surface
modification. Constructive patterning, i.e. a surface functionality was locally introduced rather
than locally removed, was achieved by electrochemical grafting of aryldiazonium salts. Upon
cathodic reduction of aryldiazonium salts, organic moieties are tethered to carbon or metal
surfaces.[57,58] To assure localized grafting, the aryldiazonium precursor was generated at the
microelectrode and attached to the surface by reductive grafting at a suitable potential applied
to the sample electrode.[59,60]
2 State of the Art
2.1 Electrochemical Patterning toward Biomolecule Immobilization 6
a
b
c
Figure 2. Patterning schemes using the SECM. Proteins and cells locally adhere to a surface after removing a repellant coating by local production of Br2 in the microreagent mode (a). Etching of a passivating SiO2 layer by local electrochemical generation of H
+ yields reactive spots that can be further
bio(functionalized) (b). The direct mode of SECM was used for local carboxylation of a graphene substrate (c) a: Reprinted from [55] with permission from John Wiley and Sons. Reprinted with permission from [48]. Copyright (2010) American Chemical Society c: Reprinted with permission from [61]. Copyright (2015) American Chemical Society.
2.1.3.2 Direct electrochemical reaction at the sample surface
Instead of producing or delivering a reagent from a scanned tip in proximity to the sample
surface, SECM allows also performing a localized electrochemical reaction at the sample surface
directly. This requires a rather peculiar configuration of the electrodes, namely the direct mode
of SECM. The sample surface to be locally modified is used as working electrode whereas the
SECM tip serves as counter electrode (Figure 1 e). If a short potential pulse is applied to the
sample, the current necessary to drive the localized electrochemical reaction is restricted to the
area directly underneath the microelectrode tip. While the potential at the sample is controlled,
the potential applied to the counter electrode is driven to high values to provide the necessary
current to charge the large substrate electrode and to carry out the faradaic reaction at it. Hence,
in most cases the electrochemical reaction taking place at the microelectrode tip is electrolysis
of the solvent. In the direct mode of SECM, reagentless pattern generation was previously
achieved by electrografting[62,63] or removal[64] of surface groups or by changing their redox state
[65–67] However, little attention is paid on the chemoselectivity of the method, that is the chemical
nature of the local surface modification remains elusive. In contrast, Torbensen et al. recently
demonstrated the activation of graphene layers using the direct mode of SECM (Figure 2 c).[61]
Dissolved CO2 was electrochemically reduced at the areas of the substrate electrode under the
SECM tip which led to the attachment of carboxyl functionalities to the graphene substrate. The
local carboxylation was proved by various methods including x-ray photoelectron spectroscopy
(XPS) mapping and Raman microscopy. For patterning with biomolecules the direct mode of
2 State of the Art
2.1 Electrochemical Patterning toward Biomolecule Immobilization 7
SECM was applied to locally remove a SAM and backfill the resulting holes with a differently
functionalized alkanethiol to which glucose oxidase was coupled.[68] Also exploiting SAM
formation, gold was locally deposited and redox enzymes were bound to the gold spots.[69] A
SAM terminated with nitro groups was locally reduced electrochemically to give rise to spots of
amino/hydroxylamino groups. Using classical coupling reagents, enzymes could be immobilized
exclusively to the modified areas.[66] Alternatively, the direct mode allows to locally deposit
biomolecules in one step by incorporation into electrodeposited polymers. As tested for
macroscopic electrodes and electrode arrays, incorporation of oligonucleotide-modified pyrrole
monomers into a polypyrrole backbone may be used to generate DNA arrays.[70] Similarly, the
enzyme glucose oxidase can be co-deposited physically inside a chitosan matrix by generating a
pH gradient in the gap between microelectrode and sample surface through proton reduction at
the sample and water oxidation at the counter electrode [71]. The same enzyme was also
deposited by the more specific avidin-biotin interaction with biotinylated electropolymerized
polypyrrole.[72] In general, the direct mode allows for patterning without reagents in solution. A
surface uniformly modified with a redox-active species may be locally activated to capture
biomolecules from solution. High patterning resolution was achieved by applying a voltage
between an AFM or Scanning Tunneling Microscopy (STM) tip and the sample: Nanostructured
surfaces suitable for biofunctionalization were generated through localized metal reduction[73]
or changes in organic surface functionalities.[65,74] In these cases, high voltages have to be applied
and the problem of an ill-defined surface chemistry is even more pronounced because of the
absence of supporting electrolyte and a reference electrode.
2 State of the Art
2.2 Nanoelectrodes – Motivation, Fabrication and Handling 8
2.2 Nanoelectrodes – Motivation, Fabrication and Handling
A nanoelectrode is a solid electrochemical interface whose size in at least two dimensions is
substantially below 1 µm. Recently, much progress has been made in the low-cost fabrication
and implementation of such tools into modern analytical chemistry. Needle-type nanoelectrodes
are of particular interest as their high-aspect ratio is a prerequisite for many applications, for
instance for their use in scanning probe techniques and sensors for electrochemical analysis in
small confined volumes.[75] The small size of nanoelectrodes dictates their special
electrochemical properties which substantially deviate from the electrochemical behavior
observed at macroscopic electrodes. These features of nanoelectrodes are exploited in their
electroanalytical applications. First, since the diffusion layer of a substance produced or
consumed in an electrochemical reaction scales proportionally with electrode size, highly
localized measurements can be performed at nanoelectrodes. Second, the greatly increased mass
transport rates of reactants or products to and from the nanoelectrode allow to study catalytic
reactions without mass transport limitation and assure a high signal-to-noise ratio in sensing
schemes. However, there is still a lack in understanding size-dependent effects on the
electrochemical behavior of very small nanoelectrodes. As the electrode dimension approach the
ones of molecules and atoms, classical theory to describe electrochemical processes no longer
holds true.[76].
The use of nanometric electrochemical sensors is motivated by the small dimensions of samples
that require the sensor to be of smaller or at most equal size compared to the entity of interest.
Nanoelectrodes allow the study of electrochemical processes at single nanoparticles.
Investigating individual particles rather than whole statistical ensembles will help in elucidating
the relationship between particle size and catalytic activity. In contrast to a statistical ensemble,
the properties (size, activity, composition, geometry) of a single particle are not distributed over
a wide range and hence direct connections between these measures can be made. In addition,
electrocatalytic turnover at single particles exhibits high mass transport rates which allows to
investigate reaction kinetics without mass transport limitation.
In biological systems, microelectrochemical techniques have been used to study cell metabolism,
factors leading to pathogenic conditions as well as intercellular communication via the release of
neurotransmitters.[7,11,77,78] These techniques allow to detect metabolites and messenger
molecules released from individual cells to study cell function at the single-cell level. Individual
cell fates can be monitored and often analytical information complementary to standard optical
methods is obtained. Exploiting these novel technologies will bring about a deeper
understanding of physiological processes occurring inside living cells. Rare and unstable
substances can be detected directly at their location of production inside the cell.
2 State of the Art
2.2 Nanoelectrodes – Motivation, Fabrication and Handling 9
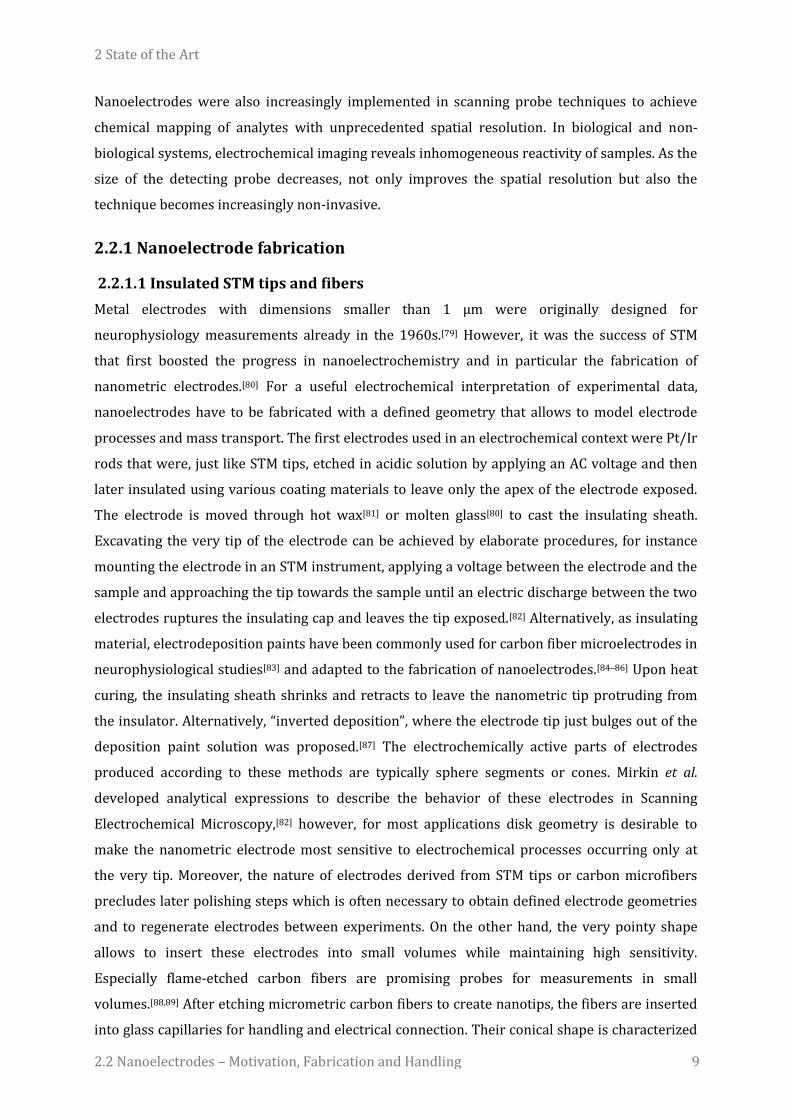
Nanoelectrodes were also increasingly implemented in scanning probe techniques to achieve
chemical mapping of analytes with unprecedented spatial resolution. In biological and non-
biological systems, electrochemical imaging reveals inhomogeneous reactivity of samples. As the
size of the detecting probe decreases, not only improves the spatial resolution but also the
technique becomes increasingly non-invasive.
2.2.1 Nanoelectrode fabrication
2.2.1.1 Insulated STM tips and fibers
Metal electrodes with dimensions smaller than 1 µm were originally designed for
neurophysiology measurements already in the 1960s.[79] However, it was the success of STM
that first boosted the progress in nanoelectrochemistry and in particular the fabrication of
nanometric electrodes.[80] For a useful electrochemical interpretation of experimental data,
nanoelectrodes have to be fabricated with a defined geometry that allows to model electrode
processes and mass transport. The first electrodes used in an electrochemical context were Pt/Ir
rods that were, just like STM tips, etched in acidic solution by applying an AC voltage and then
later insulated using various coating materials to leave only the apex of the electrode exposed.
The electrode is moved through hot wax[81] or molten glass[80] to cast the insulating sheath.
Excavating the very tip of the electrode can be achieved by elaborate procedures, for instance
mounting the electrode in an STM instrument, applying a voltage between the electrode and the
sample and approaching the tip towards the sample until an electric discharge between the two
electrodes ruptures the insulating cap and leaves the tip exposed.[82] Alternatively, as insulating
material, electrodeposition paints have been commonly used for carbon fiber microelectrodes in
neurophysiological studies[83] and adapted to the fabrication of nanoelectrodes.[84–86] Upon heat
curing, the insulating sheath shrinks and retracts to leave the nanometric tip protruding from
the insulator. Alternatively, “inverted deposition”, where the electrode tip just bulges out of the
deposition paint solution was proposed.[87] The electrochemically active parts of electrodes
produced according to these methods are typically sphere segments or cones. Mirkin et al.
developed analytical expressions to describe the behavior of these electrodes in Scanning
Electrochemical Microscopy,[82] however, for most applications disk geometry is desirable to
make the nanometric electrode most sensitive to electrochemical processes occurring only at
the very tip. Moreover, the nature of electrodes derived from STM tips or carbon microfibers
precludes later polishing steps which is often necessary to obtain defined electrode geometries
and to regenerate electrodes between experiments. On the other hand, the very pointy shape
allows to insert these electrodes into small volumes while maintaining high sensitivity.
Especially flame-etched carbon fibers are promising probes for measurements in small
volumes.[88,89] After etching micrometric carbon fibers to create nanotips, the fibers are inserted
into glass capillaries for handling and electrical connection. Their conical shape is characterized

2 State of the Art
2.2 Nanoelectrodes – Motivation, Fabrication and Handling 10
by a small diameter at the tip while maintaining a relatively large surface area which ensures
still high sensitivity.
2.2.1.2 Metals fused in capillaries
Another widespread method to produce nanoelectrodes with good control of the electrode
geometry and high reproducibility is to pull nanopipettes together with an incorporated metal
wire using a laser-assisted pipette puller (Figure 3 a).[90,91] A piece of solid metal wire with a
diameter ranging between 10 and 100 µm is inserted in a borosilicate or quartz glass capillary
and gently heated using the laser puller while applying vacuum to the two ends of the capillary.
This causes the glass capillary to collapse concentrically and thus to tightly enclose the
micrometric wire in the capillary. In a second step, more heat is applied and the two ends of the
capillary are strongly pulled apart whereas both the glass sheath and the metal wire reduce their
dimensions to yield two nearly identical nanoelectrodes. This method has been most commonly
used to produce Pt electrodes, but also Au[92] and Ag wires[93] can be processed. After removing
excess glass from the tip by either chemical etching in HF or electrode polishing the electrodes
are well-defined metal disks fused in a coplanar and concentric glass insulator. The radii of the
active electrode range between a few nanometer to a few micrometer, whereas the overall
diameter including the insulator is typically 5 to 20 times larger than the active area. Zhang’s
group used an extension of this method to obtain extremely small electrodes of down to 1 nm.[94]
In order to ensure sufficient mechanical stability for mechanical polishing, the pulled
nanoelectrode was inserted into a second capillary and pulled again so that the electrode was
surrounded by a thicker insulating sheath (Figure 3 b).
a
b
Figure 3. Fabrication protocols to produce nanoelectrodes. Fabrication by laser-assisted fusing of Pt followed by pulling and polishing yields needle-type nanoelectrodes (scale bar 5 µm) (a). Reinforcement with an additional capillary and polishing yields a Pt electrode with a size of 3 nm (b). a: Adapted from [91] with permission from John Wiley and Sons. b: Reprinted with permission from [94]. Copyright (2009) American Chemical Society.

2 State of the Art
2.2 Nanoelectrodes – Motivation, Fabrication and Handling 11
The method requires additional polishing protocols to ensure high control over the tip geometry
and a defined state of the electrode surface.[91,95] The long tapered shape and the shear modulus
of the glass allows to bring the nanoelectrode tips into mechanical vibration and exploit the
electrode’s resonant frequencies for positioning using shear force Scanning Electrochemical
Microscopy (SF-SECM).[96,97] However, for high-resolution imaging of high-aspect ratio sample,
and measurements in microenvironments and inside single cells the large diameter of the
insulating glass sheath limits the electrodes’ applications.[98]
2.2.1.3 Carbon-filled nanopipettes
An alternative fabrication route to high aspect ratio nanoelectrode probes with small electrode
sizes has gained attention. Takahashi et al. described the pyrolytic decomposition of carbon
precursor gases inside pulled quartz glass nanopipettes which gives rise to nanometric carbon
electrodes with small overall dimensions at the probe tip.[99,100] The method is based on earlier
work conducted in Ewing’s group.[101] A glass capillary is first pulled to a pipette exhibiting a
nanometric or micrometric orifice. Then the pipette is connected to a carbon gas source that
provides the precursor gas (methane, acetylene, propane, butane or a mixture of the latter) at
high pressure. To exclude oxygen, the pipette is inserted into a second, unpulled capillary which
is connected to an argon or nitrogen gas cylinder with a slight gas flow. By applying heat with a
jet torch or Bunsen burner the gas inside the pipette pyrolyzes to yield a conductive carbon
remainder covering the inside walls of the pipette. When using relatively large pipette openings,
the carbon-filled pipette remains open unless it is otherwise clogged with other material.[101]
When the inner diameter of the pipette at its tip is sufficiently small, the procedure yields disk-
shaped carbon electrodes surrounded by an insulating glass sheath.[102]
The pyrolysis method provides possibilities for the construction of multifunctional
electrochemical probes when using multi-barrel capillaries as the template for the electrode
fabrication.[99] Before pyrolysis one of the two barrels is blocked to exclude the carbon gas from
one barrel while conductive carbon is exclusively deposited in the open one. The resulting
probes find applications in high-resolution electrochemical and topographical imaging by means
of SECM in combination with SICM. Accordingly, also dual probes with two individually
addressable carbon nanoelectrodes[103] or even probes with quadruple functionality can be
made by using capillaries with multiple barrels and blocking the desired number of channels to
perform carbon pyrolysis in the remaining ones.[104]
Unlike the two previously discussed families of nanoelectrode fabrication procedures which are
both top-down approaches of nanofabrication, pyrolytic filling of capillaries is a combination of a
top-down and a bottom-up approach. A macroscopic capillary is manipulated to form a template
with nanometric dimensions but then atomic building blocks (gas molecules) form larger

2 State of the Art
2.2 Nanoelectrodes – Motivation, Fabrication and Handling 12
structures to fill the capillary with the actual electrode material. This makes the resulting
electrode material difficult to characterize concerning its composition, electronic structure and
other physicochemical properties, especially because most spectroscopic tools for the analysis of
surfaces fail at such nanometric dimensions. It is commonly known that the kinetics of
heterogeneous electron transfer at carbon electrodes strongly depend on the extent of
graphitization, orientation of the graphitic lattice and the termination with functional groups.
Raman spectroscopy is the method of choice to assess the nature of carbon surfaces as it
distinguishes between the basal plane and edge plane of graphitic carbon and allows to estimate
the content of defects in the sp2 lattice. However, a sufficiently large surface area is necessary to
acquire Raman information of the carbon material. McNally and Wong addressed this issue by
fabricating relatively large micrometric carbon cone electrodes using similar parameters for the
fabrication as would be necessary to fabricate smaller disk-shaped carbon nanoelectrodes
(pyrolysis of acetylene in nitrogen atmosphere in a Bunsen burner flame).[105] Their Raman
spectroscopic investigation lead to the conclusion that the material contains only little defects
and that mainly the basal plane of graphite is exposed, making the material somewhat similar to
highly oriented pyrolytic graphite (HOPG). However, the electrochemical reversibility of
different redox species contradicted this observation pointing rather towards structural
similarity with hydrogenated glassy carbon (GC).
A different, however conceptionally similar method to fabricate carbon probes with nanometric
tips is the deposition of carbon inside pulled capillaries by means of chemical vapor deposition
(CVD). After filling the pulled pipette with a dilute solution of CVD catalyst and allowing to dry,
the carbon is deposited in a furnace at temperatures above 800 °C while in a methane/argon
flow. The resulting electrodes are hollow carbon pipettes whose outside glass insulator can be
etched chemically to expose the outside of the carbon to the solution.[106] By varying the
deposition temperature, gas mixture and geometric properties of the pipettes, the CVD method
offers fine tuning of the final carbon pipettes including the extent of graphitization of the carbon
material as investigated by Raman spectroscopy.[107,108] The carbon pipettes have been used for
injection of chemicals[109] into living cells and for intracellular potential measurements[110]. For
highly localized electrochemical measurements they are limited to rather specific applications
due to their hollow shape.[111]
2.2.1.4 Other nanoelectrode fabrication protocols
Very small electrodes are obtained by attaching a single carbon nanotube[112,113] or metal
nanowire[114] to a macroscopic holder to contact and handle the nanometric object. These probes
have extremely small diameters which qualifies them as excellent tools for measurements in
microdroplets and living cells. Another strategy is to coat pulled nanopipettes with a conductive
film by sputter deposition of metals.[115,116] Similar metallic coatings were reported on

2 State of the Art
2.2 Nanoelectrodes – Motivation, Fabrication and Handling 13
nanometric optical fibers.[117–119] After insulating the sheath with non-conducting polymer films,
the electrodes are typically ring-shaped and surrounding the open orifice of the capillary or
aperture of the optical fiber, which gives the possibility to couple the electrochemical
measurements with a complimentary technique such as SICM or optical microscopy techniques.
For combined electrochemical and AFM imaging, many studies use modified AFM cantilevers.
The active electrode can serve as the AFM tip itself or is separated from the AFM tip. Cantilevers
with the nanoelectrode fused in the tip were first fabricated from a kinked Pt wire that was
electrochemically sharpened, then pressed to form the cantilever and then insulated.[120] Later,
single carbon nanotubes were attached to AFM cantilevers and insulated to act as the electrode
tip.[121,122] In a different fabrication strategy, commercial pyramidal AFM tips were modified by
metal deposition followed by insulation. Then, by means of Focused Ion Beam (FIB) milling, a
smaller tip was cut out, leaving a rectangular metal electrode at the base of the AFM tip.[123,124]
2.2.2 Special precautions and considerations for studies at nanoelectrodes
2.2.2.1 Theory of electrochemistry at the nanoscale
Nanoelectrodes commonly find applications in quantitative investigation of the kinetics of
heterogeneous electron transfer reactions. Also, the diffusion-limited currents for conversion of
soluble redox mediators are used to determine the active electrode size based on models
describing the diffusion layer. However, a number of theoretical and experimental studies show
that the classical theory developed to describe the electrochemical behavior of macroscopic
electrodes or even microelectrodes predicts false results. In laboratory practice, the size of the
electroactive area of electrodes with rotational symmetry is normally estimated using the
equation for the steady-state diffusion-limited current at a microelectrode, Iss = AnFDcr, with Iss
the current, A a factor to describe different electrode geometries, n the number of transferred
electrons, F the Faraday constant, D the diffusivity of the redox probe, c its bulk concentration
and r, the radius of the electroactive disk. By comparing the calculated electrode radii from the
limiting current for [Ru(NH3)6]3+ reduction to the geometrical radii as measured by Scanning
Electron Microscopy (SEM), Agyekum et al. observed a systematic underestimation of the
electrode size based on the limiting currents.[125] The deviation was observed for electrodes with
geometrical radii smaller than 50 nm and became more pronounced with decreasing electrode
size. A number of effects have to be considered for the quantitative analysis of electrochemical
phenomena at the nanoscale. Most of these effects are derived from the fact that the thickness of
the diffusion layer (also often termed depletion layer or concentration distribution layer)
linearly decreases with decreasing electrode size. While in classical theory the diffusion layer
and the electrochemical double layer are treated separately from each other, this separation
may no longer be justified for treatment of nanometric electrodes. As the electrode dimensions
decrease, the electrochemical double layer occupies an increasingly large fraction of the
2 State of the Art
2.2 Nanoelectrodes – Motivation, Fabrication and Handling 14
diffusion layer and electroactive species start to interact with the interfacial electric field. This
effect is referred to as the electrochemical double layer (EDL) effect. In the presence of an excess
of supporting electrolyte, when the Debye length is short, this effect can be neglected for
electrodes larger than 10 nm.[126] With smaller electrodes or in the absence of supporting
electrolyte however the mass transfer rates may be increased or decreased by the electric field
in the electrochemical double layer, depending on the charge of the electroactive species with
respect to the electrode surface.[127] He et al. proposed a holistic model for a dynamic
electrochemical double layer that takes into account that the concentration distribution of
species in the diffusion layer is coupled with the structure of the electrochemical double layer
and that the latter itself is dependent on the reaction rate.[76,128] For instance, for the reduction of
[Ru(NH3)6]3+ the dynamic EDL model predicts slightly larger limiting currents than expected
from the classical theory which contradicts the experimental results obtained by Agyekum et al.
who found smaller currents compared to the expectation from the geometric electrode size.
Also the size-dependence of electron transfer rates have been discussed controversially. Since
the early applications of nanoelectrodes to measure the rate constants conducted by Penner et
al. [80] who reported excessively fast electron transfer at electrodes of small dimensions, various
groups have published results contradicting these findings.[92,129] Liu et al. stated that electrode
kinetics are not adequately described by a single value for the heterogeneous electron transfer
rate for electrodes in the low nm regime. Instead, the rate constants vary radially on the small
electrode surface because of an extended range of electron tunneling.[130] According to the model
taking into account these edge effects the predicted voltammetric response for a reduction of
cations seems more reversible (i.e. faster electron transfer with respect to the mass transport
rate) than predicted by conventional voltammetric theory. It has to be kept in mind that electron
transfer reactions at the nanoscale must be considered as stochastic events and hence are
temporally varying so that the concept of a rate constant may become useless.[131,132] As a
consequence of this, García-Morales and Krischer stated that the electrode potential itself
fluctuates, which lead them to the conclusion that electron transfer rates at nanoelectrodes must
be a priori faster than the ones observed at larger electrodes.
For electrodes having the size of only a few atoms it is the experimental uncertainty regarding
the electrode properties that makes it difficult to validate or reject proposed theoretical models.
Often “apparent” or “effective” electrode sizes have to be assumed for small electrodes to
account for the uncertainties concerning their geometry.[90] However, there seems to be general
consent that predictions and interpretation of results made by classical theory lead to fairly
precise results for all but the very smallest electrodes i.e. for r > 10 nm.[126,133,134] Generally,
despite great progress has been made both in the fabrication and handling of nanoelectrodes as

2 State of the Art
2.2 Nanoelectrodes – Motivation, Fabrication and Handling 15
well as concerning the theoretical prediction of their electrochemical behavior there is still an
existing gap between the experimental and the theoretical approach.
2.2.2.2 Technical and instrumental aspects
Knowledge of the electrode geometry is indispensable for the correct interpretation of
experimental results. Except estimating geometrical parameters by electrochemical methods,
SEM and Transmission Electron Microscopy (TEM) are the common tools for characterization of
electrodes. SEM fails to provide good images of electrodes whose critical features are smaller
than about 20-50 nm. TEM has been shown to be a powerful tool to measure electrode radii of
down to 1 nm,[94,135,136] however has no topographical resolution. Unfortunately, small deviations
from the expected electrode geometry are detrimental for the correct interpretation of
experimental results. For instance, it is most difficult to identify slightly recessed or protruding
electrodes. When looking at the voltammetric response of nanoelectrodes, the limiting currents
are diminished if the active electrode is recessed in the insulating sheath on account of the extra
distance to the electrode surface that has to be passed by the electroactive species by slow one-
directional diffusion.[90] To identify this recession of the electrode only by means of voltammetry
is impossible and consequently, the active electrode size is underestimated. In case of a
protruding electrode, the electrode radius is overestimated. SECM gives additional possibilities
to evaluate the electrode geometry. Mirkin’s group proposed AFM as an additional
characterization tool that allows good topographical resolution and hence to identify recessed or
protruding electrodes.[137]
Even after using elaborate fabrication techniques and thorough polishing procedures,
nanoelectrodes are very likely to change size, shape and state of the surface during handling,
storage and electrochemical experiments. Amemiya’s group observed severe damages to Pt
nanoelectrodes caused by electrostatic discharges (ESD) when the experimenter touches the
electrodes.[138] The electric charges accumulated in the human body are transferred to the
electrode and lead to extreme electric fields at the nanoscale tip which cause the electrode tip to
melt when a discharge with a nearby object occurs. As a countermeasure, discharge protection
gear such as conductive wrist straps or shoes and ESD-safe lab coats, gloves and tweezers in
combination with grounded conductive mats can be used. Another issue arises from the use of
certain potentiostats which transmit a current peak to the electrode when the cell is switched
on. The rapid charging may also lead to substantial electrode disruption.[138] To avoid these
glitches voltammetric amplifiers working in the 2-electrode system or patch clamp amplifiers
are often used.

2 State of the Art
2.3 High-Resolution Electrochemical Imaging 16
2.3 High-Resolution Electrochemical Imaging
For an electrochemical reaction at an electrode surface, the diffusion layer scales with the size of
the electrode. When a micro- or nanoelectrode is positioned in close proximity to a sample
surface so that their diffusion layers overlap, highly resolved maps of local electrochemical
activity are obtained when scanning the micrometric probe over the surface. SECM is the only
scanning probe technique that yields truly chemical information about the samples in
question.[8–10] In the most basic operational mode, the feedback mode, a redox mediator in
solution is oxidized or reduced at the microscopic SECM tip electrode under mass transport-
limited conditions. When the sample surface reaches into the diffusion layer of the SECM tip, the
current recorded at the tip is altered. For an electrochemically inactive sample, diffusional
access to the microelectrode is blocked (referred to as negative feedback) whereas an
electrochemically active sample permits recycling of the redox mediator between the SECM tip
and the sample. This leads to an increase of tip current as the two diffusion layers overlap
(positive feedback). Nanoelectrodes are necessary to achieve high-resolution electrochemical
images.
The precise control of the tip-to-sample distance still continues to be a challenge for
implementation of small nanoelectrodes into high-resolution SECM. Using the electrochemical
tip current to control or measure the tip-to-sample distance is problematic because the
information regarding sample topography and electrochemical activity of the sample are
convoluted. True distance control independent from the local electrochemical activity is
achieved by coupling other techniques such as AFM, shear force detection [96,139,140] or SICM to
SECM.[8,9] These strategies require nanoelectrodes with an additional functionality which is
exploited for the topography measurement (as discussed further below).
Carbon nanoelectrodes made by carbon deposition inside nanopipettes exhibiting radii down to
some 10 nm were used to obtain high-resolution images of various cell types including hair cells.
These cells are very difficult to image because of their high aspect ratio.[100] The key for obtaining
such highly resolved images lies in the use of high aspect ratio probes with a thin insulating
layer. Despite the difficulties in positioning electrodes in the lower nm size regime, Mirkin and
coworkers recently reported the imaging of individual catalytically active Au nanoparticles using
nanoelectrodes of down to 3 nm radius in the basic feedback mode of SECM.[141] In addition, they
used the nanoelectrode to detect H2 electrogenerated from the hydrogen evolution reaction
(HER) at the nanoparticles.
2 State of the Art
2.3 High-Resolution Electrochemical Imaging 17
a
c
b
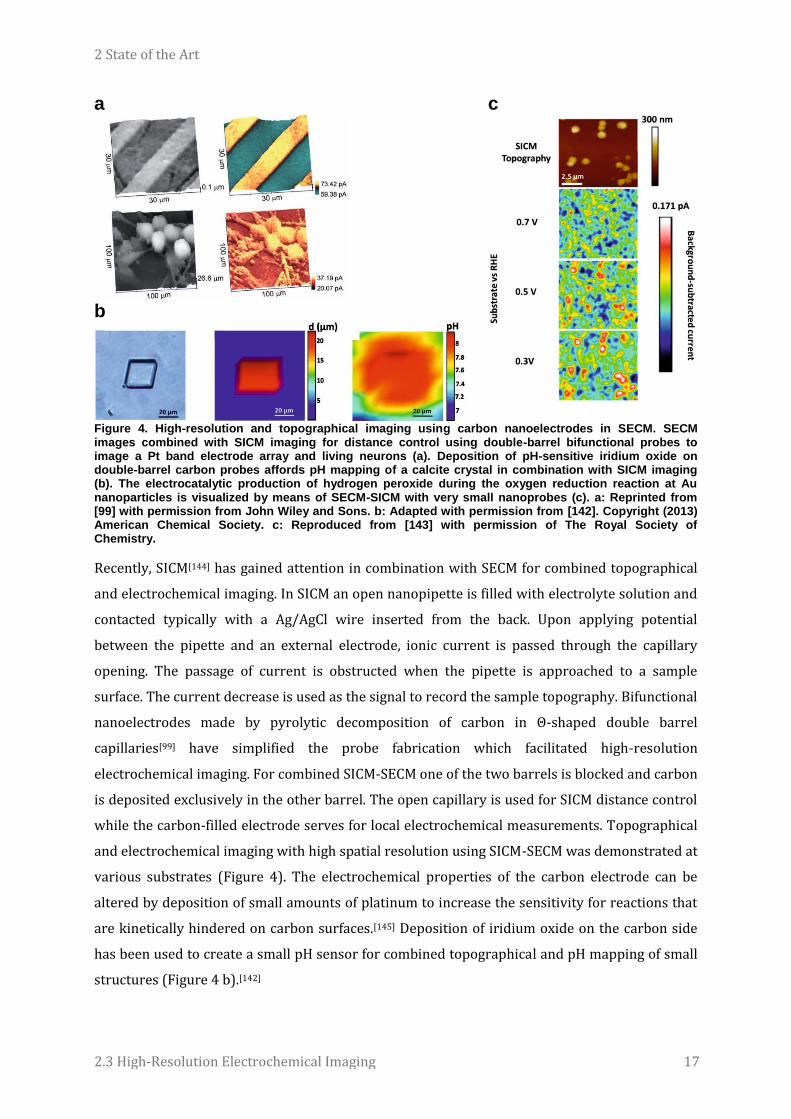
Figure 4. High-resolution and topographical imaging using carbon nanoelectrodes in SECM. SECM images combined with SICM imaging for distance control using double-barrel bifunctional probes to image a Pt band electrode array and living neurons (a). Deposition of pH-sensitive iridium oxide on double-barrel carbon probes affords pH mapping of a calcite crystal in combination with SICM imaging (b). The electrocatalytic production of hydrogen peroxide during the oxygen reduction reaction at Au nanoparticles is visualized by means of SECM-SICM with very small nanoprobes (c). a: Reprinted from [99] with permission from John Wiley and Sons. b: Adapted with permission from [142]. Copyright (2013) American Chemical Society. c: Reproduced from [143] with permission of The Royal Society of Chemistry.
Recently, SICM[144] has gained attention in combination with SECM for combined topographical
and electrochemical imaging. In SICM an open nanopipette is filled with electrolyte solution and
contacted typically with a Ag/AgCl wire inserted from the back. Upon applying potential
between the pipette and an external electrode, ionic current is passed through the capillary
opening. The passage of current is obstructed when the pipette is approached to a sample
surface. The current decrease is used as the signal to record the sample topography. Bifunctional
nanoelectrodes made by pyrolytic decomposition of carbon in Θ-shaped double barrel
capillaries[99] have simplified the probe fabrication which facilitated high-resolution
electrochemical imaging. For combined SICM-SECM one of the two barrels is blocked and carbon
is deposited exclusively in the other barrel. The open capillary is used for SICM distance control
while the carbon-filled electrode serves for local electrochemical measurements. Topographical
and electrochemical imaging with high spatial resolution using SICM-SECM was demonstrated at
various substrates (Figure 4). The electrochemical properties of the carbon electrode can be
altered by deposition of small amounts of platinum to increase the sensitivity for reactions that
are kinetically hindered on carbon surfaces.[145] Deposition of iridium oxide on the carbon side
has been used to create a small pH sensor for combined topographical and pH mapping of small
structures (Figure 4 b).[142]

2 State of the Art
2.3 High-Resolution Electrochemical Imaging 18
While the initial studies were rather dedicated to the investigation of biological samples,
O’Connell and Wain used SICM-SECM for electrocatalyst studies.[143,146] Due to the high
resolution and precise distance control they were able to resolve individual Pt nanoparticles and
investigate their consumption of oxygen during the ORR. Both the nanoelectrode and the
substrate modified with a small concentration of nanoparticles were polarized to reduce O2 and
thus compete for the free reactant in solution.[147] They also visualized the diffusion layers of
hydrogen peroxide generated during the incomplete reduction of O2 on individual gold
nanoparticles (Figure 4 c).[143] The platinized carbon probe was polarized at a potential to collect
generated H2O2 by anodic detection. By changing the potential applied to the nanoparticle-
modified substrate, different amounts of H2O2 were detected from the single Au particles.

2 State of the Art
2.4 Cell Analysis 19
2.4 Cell Analysis
2.4.1 Detection of reactive oxygen species
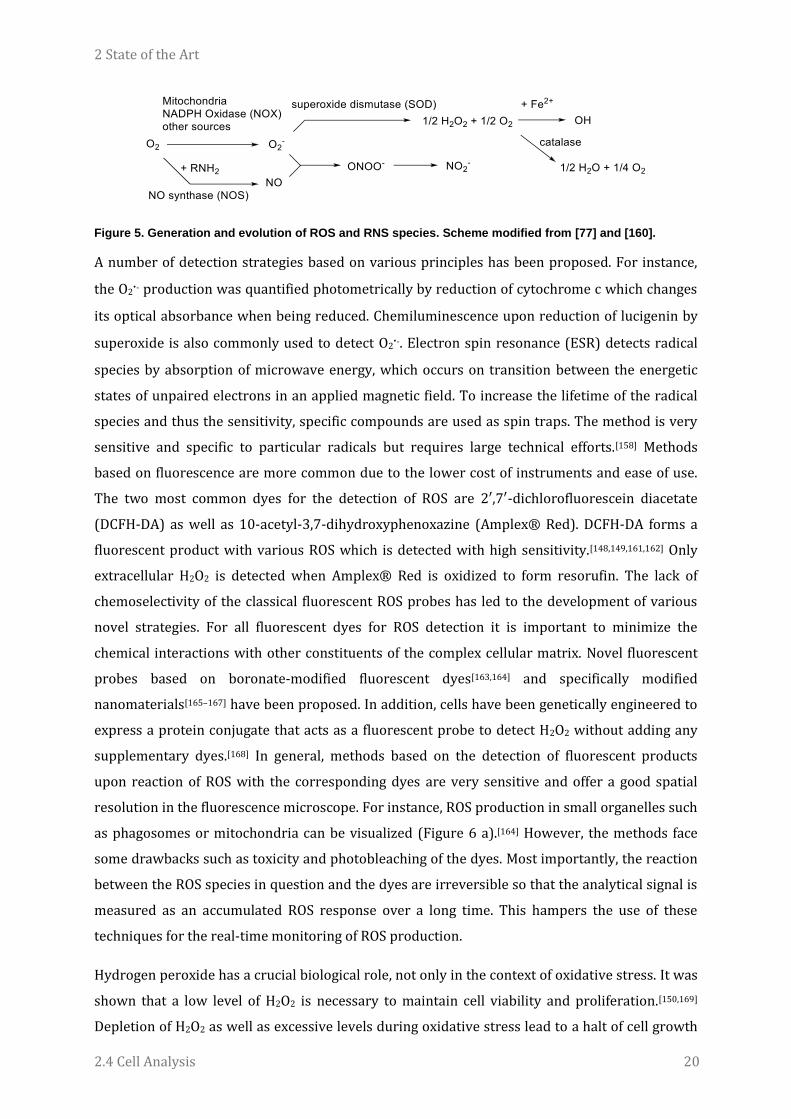
Reactive oxygen species are radicals or otherwise unstable molecules generated during cell
metabolism. Their main source is the incomplete reduction of dioxygen to form superoxide O2∙-
which then further reacts to H2O2 via decomposition catalyzed by superoxide dismutase (SOD)
(Figure 5). Also external sources such as UV irradiation or toxic chemicals can cause ROS
production. H2O2 is the precursor for the highly reactive hydroxyl radical ∙OH. In the presence of
Fe2+ hydrogen peroxide undergoes Fenton reaction to form ∙OH. The hydroxyl radical can extract
hydrogen from any organic compound. Thus, an overproduction or imbalance of ROS damages
parts of the cell and leads to irreversible chemical modifications of lipids, proteins and
DNA.[148,149] Oxidative cell stress can be the cause for cell ageing,[150] inflammation,[151]
neurodegeneration,[152] pain,[153] heart failure[154] and cancer.[155] Apart from their detrimental
effect on cell viability, ROS also play a role in signaling and defense against pathogens.[156] For
instance macrophage cells, an essential part of the immune system, kill bacteria by engulfing
them into phagosomes and attack them by excess amounts of O2- and NO which are released into
the phagosomes by activity of the NADPH-dependent oxidase (NOX) and nitric oxide synthase
(NOS), respectively.[157] The controlled release of ROS requires antioxidative protection
mechanisms. Apart from SOD these include the enzymes catalase and gluthathione peroxidase
which neutralize H2O2. Also other oxidizable substances such as ascorbic acid, glutathione itself
and other antioxidants scavenge ROS.[150] The generation of ROS is closely related to the
generation of reactive nitrogen species (RNS), the most important of which are nitric oxide
(∙NO), peroxynitrite (ONNO∙) and nitrite (NO2-) (Figure 5). Analytical information regarding the
production of reactive oxygen species from single cells can help to understand the development
of various pathogenic conditions. Hence, micro- and nanoelectrodes are of particular interest as
analytical tools in the context of oxidative cell stress.[77] The reliable extracellular and
intracellular detection and quantification of ROS is crucial to evaluate the pathogenic effect of
oxidative stress on cells and thus has been subject to extensive research.[7,77,156,158,159] The
detection of ROS is a difficult analytical task. Due to their very unstable nature many ROS have a
short lifetime in the cell and their abundance is limited to small volumes in or around the cell.
Hence, analytical tools with high sensitivity, capabilities for real-time detection and high spatial
resolution are required. In addition, to describe the effects of particular members of the ROS
family on the cells viability, selective measurements are desirable.
2 State of the Art
2.4 Cell Analysis 20
Figure 5. Generation and evolution of ROS and RNS species. Scheme modified from [77] and [160].
A number of detection strategies based on various principles has been proposed. For instance,
the O2∙- production was quantified photometrically by reduction of cytochrome c which changes
its optical absorbance when being reduced. Chemiluminescence upon reduction of lucigenin by
superoxide is also commonly used to detect O2∙-. Electron spin resonance (ESR) detects radical
species by absorption of microwave energy, which occurs on transition between the energetic
states of unpaired electrons in an applied magnetic field. To increase the lifetime of the radical
species and thus the sensitivity, specific compounds are used as spin traps. The method is very
sensitive and specific to particular radicals but requires large technical efforts.[158] Methods
based on fluorescence are more common due to the lower cost of instruments and ease of use.
The two most common dyes for the detection of ROS are 2′,7′-dichlorofluorescein diacetate
(DCFH-DA) as well as 10-acetyl-3,7-dihydroxyphenoxazine (Amplex® Red). DCFH-DA forms a
fluorescent product with various ROS which is detected with high sensitivity.[148,149,161,162] Only
extracellular H2O2 is detected when Amplex® Red is oxidized to form resorufin. The lack of
chemoselectivity of the classical fluorescent ROS probes has led to the development of various
novel strategies. For all fluorescent dyes for ROS detection it is important to minimize the
chemical interactions with other constituents of the complex cellular matrix. Novel fluorescent
probes based on boronate-modified fluorescent dyes[163,164] and specifically modified
nanomaterials[165–167] have been proposed. In addition, cells have been genetically engineered to
express a protein conjugate that acts as a fluorescent probe to detect H2O2 without adding any
supplementary dyes.[168] In general, methods based on the detection of fluorescent products
upon reaction of ROS with the corresponding dyes are very sensitive and offer a good spatial
resolution in the fluorescence microscope. For instance, ROS production in small organelles such
as phagosomes or mitochondria can be visualized (Figure 6 a).[164] However, the methods face
some drawbacks such as toxicity and photobleaching of the dyes. Most importantly, the reaction
between the ROS species in question and the dyes are irreversible so that the analytical signal is
measured as an accumulated ROS response over a long time. This hampers the use of these
techniques for the real-time monitoring of ROS production.
Hydrogen peroxide has a crucial biological role, not only in the context of oxidative stress. It was
shown that a low level of H2O2 is necessary to maintain cell viability and proliferation.[150,169]
Depletion of H2O2 as well as excessive levels during oxidative stress lead to a halt of cell growth
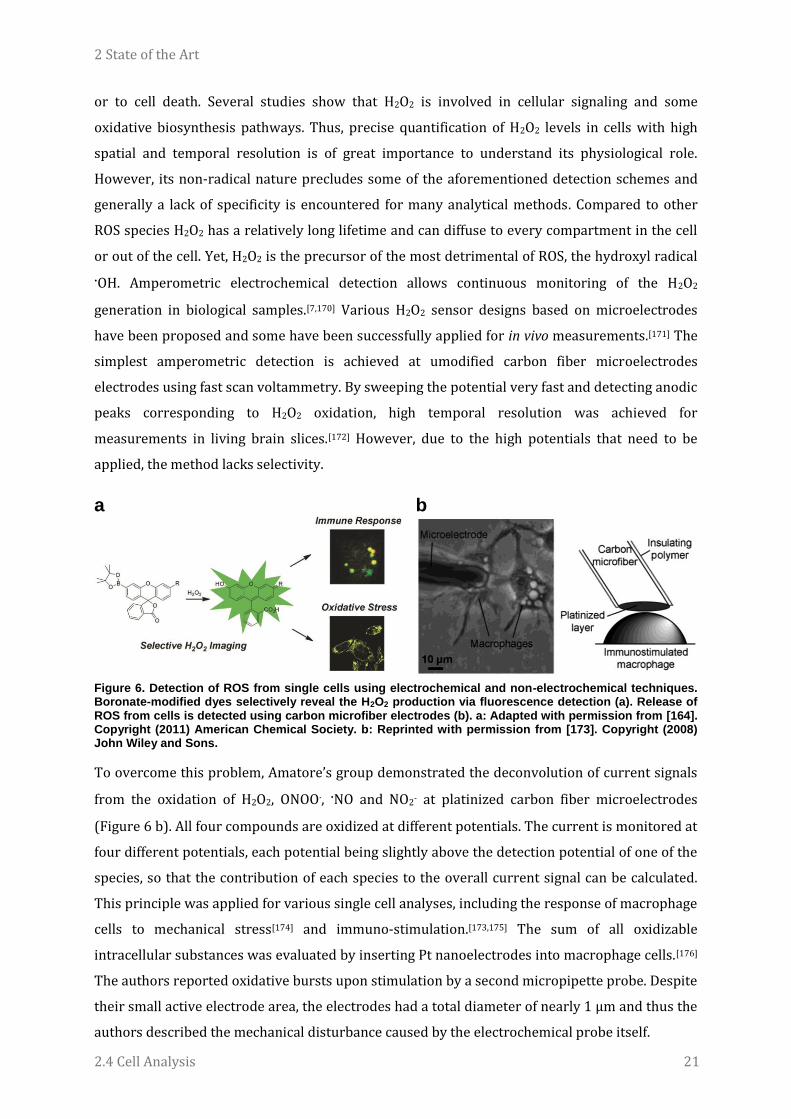
2 State of the Art
2.4 Cell Analysis 21
or to cell death. Several studies show that H2O2 is involved in cellular signaling and some
oxidative biosynthesis pathways. Thus, precise quantification of H2O2 levels in cells with high
spatial and temporal resolution is of great importance to understand its physiological role.
However, its non-radical nature precludes some of the aforementioned detection schemes and
generally a lack of specificity is encountered for many analytical methods. Compared to other
ROS species H2O2 has a relatively long lifetime and can diffuse to every compartment in the cell
or out of the cell. Yet, H2O2 is the precursor of the most detrimental of ROS, the hydroxyl radical
∙OH. Amperometric electrochemical detection allows continuous monitoring of the H2O2
generation in biological samples.[7,170] Various H2O2 sensor designs based on microelectrodes
have been proposed and some have been successfully applied for in vivo measurements.[171] The
simplest amperometric detection is achieved at umodified carbon fiber microelectrodes
electrodes using fast scan voltammetry. By sweeping the potential very fast and detecting anodic
peaks corresponding to H2O2 oxidation, high temporal resolution was achieved for
measurements in living brain slices.[172] However, due to the high potentials that need to be
applied, the method lacks selectivity.
a
b
Figure 6. Detection of ROS from single cells using electrochemical and non-electrochemical techniques. Boronate-modified dyes selectively reveal the H2O2 production via fluorescence detection (a). Release of ROS from cells is detected using carbon microfiber electrodes (b). a: Adapted with permission from [164]. Copyright (2011) American Chemical Society. b: Reprinted with permission from [173]. Copyright (2008) John Wiley and Sons.
To overcome this problem, Amatore’s group demonstrated the deconvolution of current signals
from the oxidation of H2O2, ONOO∙, ∙NO and NO2- at platinized carbon fiber microelectrodes
(Figure 6 b). All four compounds are oxidized at different potentials. The current is monitored at
four different potentials, each potential being slightly above the detection potential of one of the
species, so that the contribution of each species to the overall current signal can be calculated.
This principle was applied for various single cell analyses, including the response of macrophage
cells to mechanical stress[174] and immuno-stimulation.[173,175] The sum of all oxidizable
intracellular substances was evaluated by inserting Pt nanoelectrodes into macrophage cells.[176]
The authors reported oxidative bursts upon stimulation by a second micropipette probe. Despite
their small active electrode area, the electrodes had a total diameter of nearly 1 µm and thus the
authors described the mechanical disturbance caused by the electrochemical probe itself.
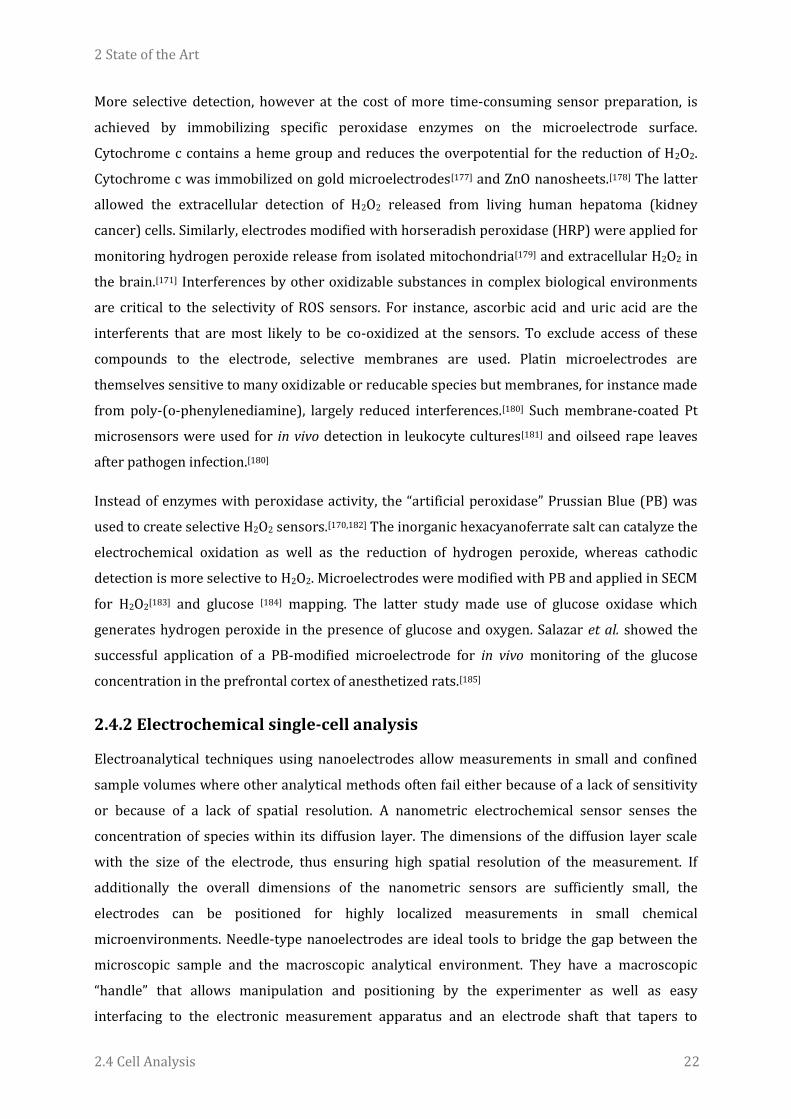
2 State of the Art
2.4 Cell Analysis 22
More selective detection, however at the cost of more time-consuming sensor preparation, is
achieved by immobilizing specific peroxidase enzymes on the microelectrode surface.
Cytochrome c contains a heme group and reduces the overpotential for the reduction of H2O2.
Cytochrome c was immobilized on gold microelectrodes[177] and ZnO nanosheets.[178] The latter
allowed the extracellular detection of H2O2 released from living human hepatoma (kidney
cancer) cells. Similarly, electrodes modified with horseradish peroxidase (HRP) were applied for
monitoring hydrogen peroxide release from isolated mitochondria[179] and extracellular H2O2 in
the brain.[171] Interferences by other oxidizable substances in complex biological environments
are critical to the selectivity of ROS sensors. For instance, ascorbic acid and uric acid are the
interferents that are most likely to be co-oxidized at the sensors. To exclude access of these
compounds to the electrode, selective membranes are used. Platin microelectrodes are
themselves sensitive to many oxidizable or reducable species but membranes, for instance made
from poly-(o-phenylenediamine), largely reduced interferences.[180] Such membrane-coated Pt
microsensors were used for in vivo detection in leukocyte cultures[181] and oilseed rape leaves
after pathogen infection.[180]
Instead of enzymes with peroxidase activity, the “artificial peroxidase” Prussian Blue (PB) was
used to create selective H2O2 sensors.[170,182] The inorganic hexacyanoferrate salt can catalyze the
electrochemical oxidation as well as the reduction of hydrogen peroxide, whereas cathodic
detection is more selective to H2O2. Microelectrodes were modified with PB and applied in SECM
for H2O2[183] and glucose [184] mapping. The latter study made use of glucose oxidase which
generates hydrogen peroxide in the presence of glucose and oxygen. Salazar et al. showed the
successful application of a PB-modified microelectrode for in vivo monitoring of the glucose
concentration in the prefrontal cortex of anesthetized rats.[185]
2.4.2 Electrochemical single-cell analysis
Electroanalytical techniques using nanoelectrodes allow measurements in small and confined
sample volumes where other analytical methods often fail either because of a lack of sensitivity
or because of a lack of spatial resolution. A nanometric electrochemical sensor senses the
concentration of species within its diffusion layer. The dimensions of the diffusion layer scale
with the size of the electrode, thus ensuring high spatial resolution of the measurement. If
additionally the overall dimensions of the nanometric sensors are sufficiently small, the
electrodes can be positioned for highly localized measurements in small chemical
microenvironments. Needle-type nanoelectrodes are ideal tools to bridge the gap between the
microscopic sample and the macroscopic analytical environment. They have a macroscopic
“handle” that allows manipulation and positioning by the experimenter as well as easy
interfacing to the electronic measurement apparatus and an electrode shaft that tapers to

2 State of the Art
2.4 Cell Analysis 23
microscopic dimensions on the opposite end. These capabilities are most called for in the
chemical analysis of biological samples, tissues and single cells. In fact, the development of
nanoelectrode fabrication protocols was to a large extent driven by the search for answers to
biological questions. Compared to the ubiquitous optical methods in the life sciences,
electrochemical detection of substances with biological relevance have a direct correlation
between the measured signal and the amount of analyte via Faraday’s law of electrolysis. In
particular, this applies to the quantification of neurotransmitters, most of which are
electroactive substances. Discrete neurotransmitter release events are detected when a
microelectrode is positioned close to a cell and the content of all incident neurotransmitter
vesicles is electrochemically converted at the electrode.[186] From the charge and shape of the
resulting current spikes size, shape and behavior of the neurotransmitter-containing membrane
vesicles are characterized.[187] This way, electrochemistry contributed tremendously to the
understanding of intercellular communication between cells. Moreover, by in vivo
voltammetry,[188,189] where microelectrodes are placed in the intact brain of living animals, the
functionality of the complex central nervous system can be correlated to the animal’s behavior
and external stimuli that act on the animal. In these applications, neurotransmitters are
normally detected outside the cell and hence, electrodes with dimensions similar to the cell’s
dimensions (i.e. a few µm) are desirable to assure a high efficiency of collection of
neurotransmitters. Similarly, ROS release from single cells was detected at microelectrodes
(Figure 6 b).
A sensor small enough (4 µm) for the intracellular detection of oxygen was already reported in
1967.[190] Much later, inspired by the great success of patch clamping techniques, where
micropipettes are used to study transport processes in biological membranes, researchers
sought for more ways to explore the intracellular space. Ewing’s group and others made
substantial progress to the field by showing the feasibility of intracellular detection of O2,[191]
neurotransmitters,[192,193] glucose[194] and nitric oxide.[195] However, the diameter of the
employed electrochemical probes was rather in the micrometer range. For the feasibility studies
often cell models exhibiting particularly large cell bodies were chosen. As electroanalytical
techniques for the analysis of cells are trying to emerge towards real biomedical problems, the
dimensions of the probes need to be reduced to avoid damages caused to the cell when sensors
are inserted. Another often neglected challenge is to minimize the influence of the
electrochemical conversion of the analyte for detection at the micro/nanosensor on the
physiological state of the cell. For amperometric sensors it needs to be taken into account that
the electrode used for detection of the species in question is a consumer or producer of
electroactive species itself. These invasive effects of the detecting probe can be minimized by
reducing the dimensions of the probe with respect to the size of the studied objects, so that the
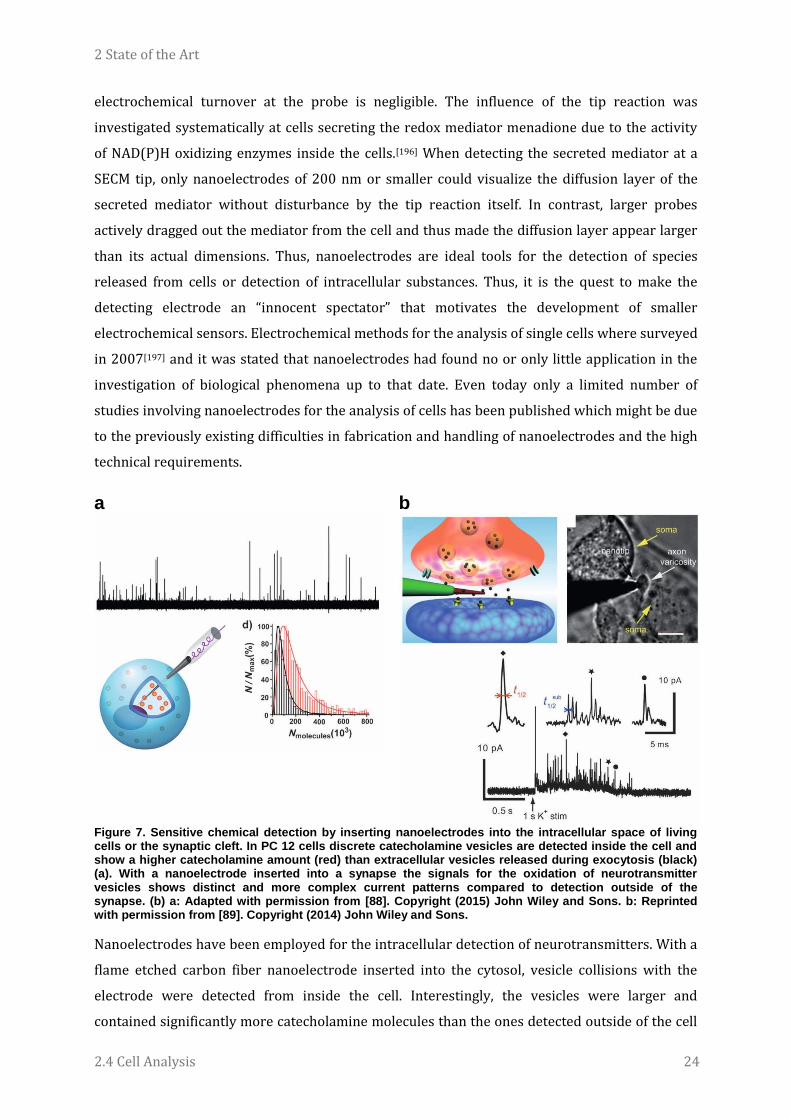
2 State of the Art
2.4 Cell Analysis 24
electrochemical turnover at the probe is negligible. The influence of the tip reaction was
investigated systematically at cells secreting the redox mediator menadione due to the activity
of NAD(P)H oxidizing enzymes inside the cells.[196] When detecting the secreted mediator at a
SECM tip, only nanoelectrodes of 200 nm or smaller could visualize the diffusion layer of the
secreted mediator without disturbance by the tip reaction itself. In contrast, larger probes
actively dragged out the mediator from the cell and thus made the diffusion layer appear larger
than its actual dimensions. Thus, nanoelectrodes are ideal tools for the detection of species
released from cells or detection of intracellular substances. Thus, it is the quest to make the
detecting electrode an “innocent spectator” that motivates the development of smaller
electrochemical sensors. Electrochemical methods for the analysis of single cells where surveyed
in 2007[197] and it was stated that nanoelectrodes had found no or only little application in the
investigation of biological phenomena up to that date. Even today only a limited number of
studies involving nanoelectrodes for the analysis of cells has been published which might be due
to the previously existing difficulties in fabrication and handling of nanoelectrodes and the high
technical requirements.
a
b
Figure 7. Sensitive chemical detection by inserting nanoelectrodes into the intracellular space of living cells or the synaptic cleft. In PC 12 cells discrete catecholamine vesicles are detected inside the cell and show a higher catecholamine amount (red) than extracellular vesicles released during exocytosis (black) (a). With a nanoelectrode inserted into a synapse the signals for the oxidation of neurotransmitter vesicles shows distinct and more complex current patterns compared to detection outside of the synapse. (b) a: Adapted with permission from [88]. Copyright (2015) John Wiley and Sons. b: Reprinted with permission from [89]. Copyright (2014) John Wiley and Sons.
Nanoelectrodes have been employed for the intracellular detection of neurotransmitters. With a
flame etched carbon fiber nanoelectrode inserted into the cytosol, vesicle collisions with the
electrode were detected from inside the cell. Interestingly, the vesicles were larger and
contained significantly more catecholamine molecules than the ones detected outside of the cell
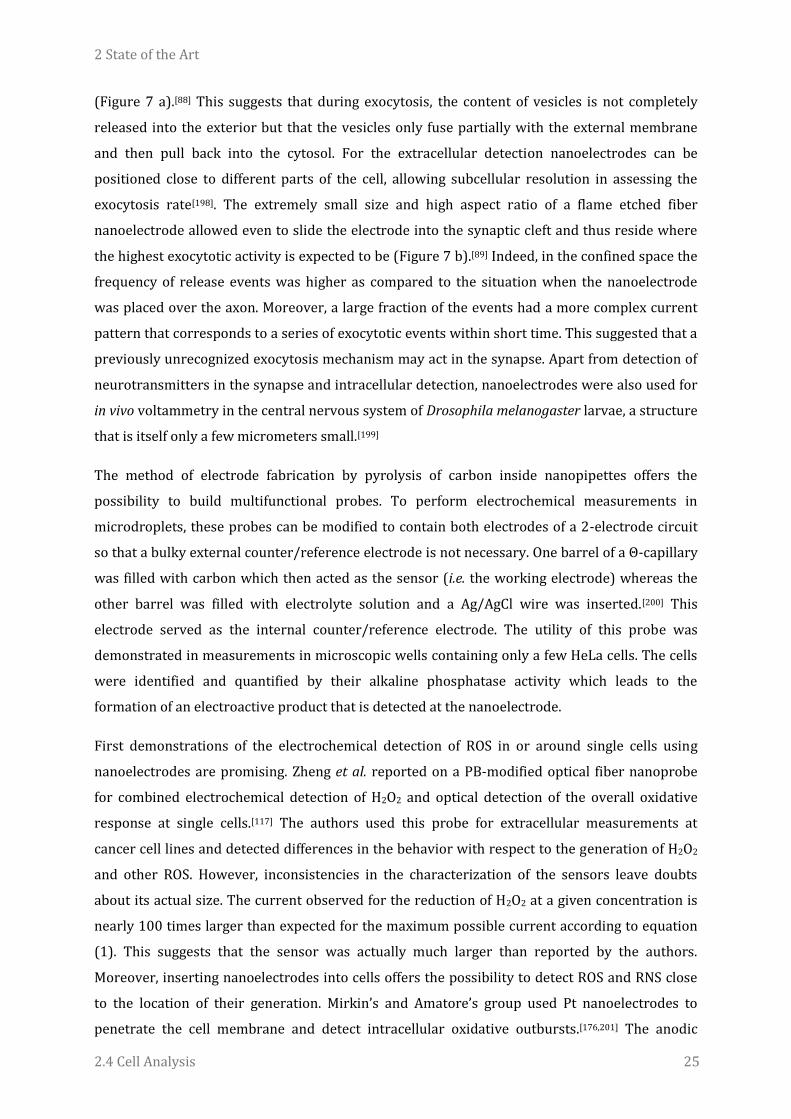
2 State of the Art
2.4 Cell Analysis 25
(Figure 7 a).[88] This suggests that during exocytosis, the content of vesicles is not completely
released into the exterior but that the vesicles only fuse partially with the external membrane
and then pull back into the cytosol. For the extracellular detection nanoelectrodes can be
positioned close to different parts of the cell, allowing subcellular resolution in assessing the
exocytosis rate[198]. The extremely small size and high aspect ratio of a flame etched fiber
nanoelectrode allowed even to slide the electrode into the synaptic cleft and thus reside where
the highest exocytotic activity is expected to be (Figure 7 b).[89] Indeed, in the confined space the
frequency of release events was higher as compared to the situation when the nanoelectrode
was placed over the axon. Moreover, a large fraction of the events had a more complex current
pattern that corresponds to a series of exocytotic events within short time. This suggested that a
previously unrecognized exocytosis mechanism may act in the synapse. Apart from detection of
neurotransmitters in the synapse and intracellular detection, nanoelectrodes were also used for
in vivo voltammetry in the central nervous system of Drosophila melanogaster larvae, a structure
that is itself only a few micrometers small.[199]
The method of electrode fabrication by pyrolysis of carbon inside nanopipettes offers the
possibility to build multifunctional probes. To perform electrochemical measurements in
microdroplets, these probes can be modified to contain both electrodes of a 2-electrode circuit
so that a bulky external counter/reference electrode is not necessary. One barrel of a Θ-capillary
was filled with carbon which then acted as the sensor (i.e. the working electrode) whereas the
other barrel was filled with electrolyte solution and a Ag/AgCl wire was inserted.[200] This
electrode served as the internal counter/reference electrode. The utility of this probe was
demonstrated in measurements in microscopic wells containing only a few HeLa cells. The cells
were identified and quantified by their alkaline phosphatase activity which leads to the
formation of an electroactive product that is detected at the nanoelectrode.
First demonstrations of the electrochemical detection of ROS in or around single cells using
nanoelectrodes are promising. Zheng et al. reported on a PB-modified optical fiber nanoprobe
for combined electrochemical detection of H2O2 and optical detection of the overall oxidative
response at single cells.[117] The authors used this probe for extracellular measurements at
cancer cell lines and detected differences in the behavior with respect to the generation of H2O2
and other ROS. However, inconsistencies in the characterization of the sensors leave doubts
about its actual size. The current observed for the reduction of H2O2 at a given concentration is
nearly 100 times larger than expected for the maximum possible current according to equation
(1). This suggests that the sensor was actually much larger than reported by the authors.
Moreover, inserting nanoelectrodes into cells offers the possibility to detect ROS and RNS close
to the location of their generation. Mirkin’s and Amatore’s group used Pt nanoelectrodes to
penetrate the cell membrane and detect intracellular oxidative outbursts.[176,201] The anodic

2 State of the Art
2.4 Cell Analysis 26
signal occurring upon cell penetration was composed of various contributions from the
oxidation of RNS/ROS. Yet, despite the radii of the active electrodes was only tens of nm, the
overall diameter of the probes approached 1 µm, leading to considerable disruption of the cell’s
natural function in the moment of and after penetration. When using smaller probes, such
disturbance is largely avoided.[108,113]
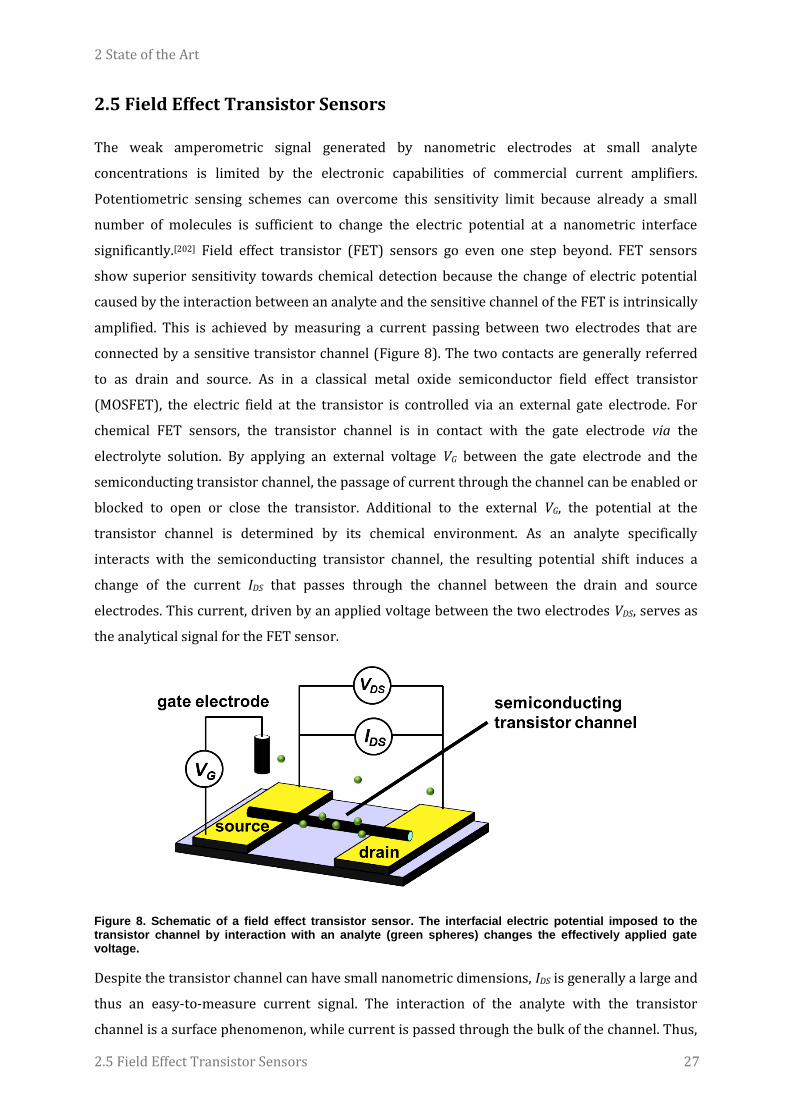
2 State of the Art
2.5 Field Effect Transistor Sensors 27
2.5 Field Effect Transistor Sensors
The weak amperometric signal generated by nanometric electrodes at small analyte
concentrations is limited by the electronic capabilities of commercial current amplifiers.
Potentiometric sensing schemes can overcome this sensitivity limit because already a small
number of molecules is sufficient to change the electric potential at a nanometric interface
significantly.[202] Field effect transistor (FET) sensors go even one step beyond. FET sensors
show superior sensitivity towards chemical detection because the change of electric potential
caused by the interaction between an analyte and the sensitive channel of the FET is intrinsically
amplified. This is achieved by measuring a current passing between two electrodes that are
connected by a sensitive transistor channel (Figure 8). The two contacts are generally referred
to as drain and source. As in a classical metal oxide semiconductor field effect transistor
(MOSFET), the electric field at the transistor is controlled via an external gate electrode. For
chemical FET sensors, the transistor channel is in contact with the gate electrode via the
electrolyte solution. By applying an external voltage VG between the gate electrode and the
semiconducting transistor channel, the passage of current through the channel can be enabled or
blocked to open or close the transistor. Additional to the external VG, the potential at the
transistor channel is determined by its chemical environment. As an analyte specifically
interacts with the semiconducting transistor channel, the resulting potential shift induces a
change of the current IDS that passes through the channel between the drain and source
electrodes. This current, driven by an applied voltage between the two electrodes VDS, serves as
the analytical signal for the FET sensor.
Figure 8. Schematic of a field effect transistor sensor. The interfacial electric potential imposed to the transistor channel by interaction with an analyte (green spheres) changes the effectively applied gate voltage.
Despite the transistor channel can have small nanometric dimensions, IDS is generally a large and
thus an easy-to-measure current signal. The interaction of the analyte with the transistor
channel is a surface phenomenon, while current is passed through the bulk of the channel. Thus,
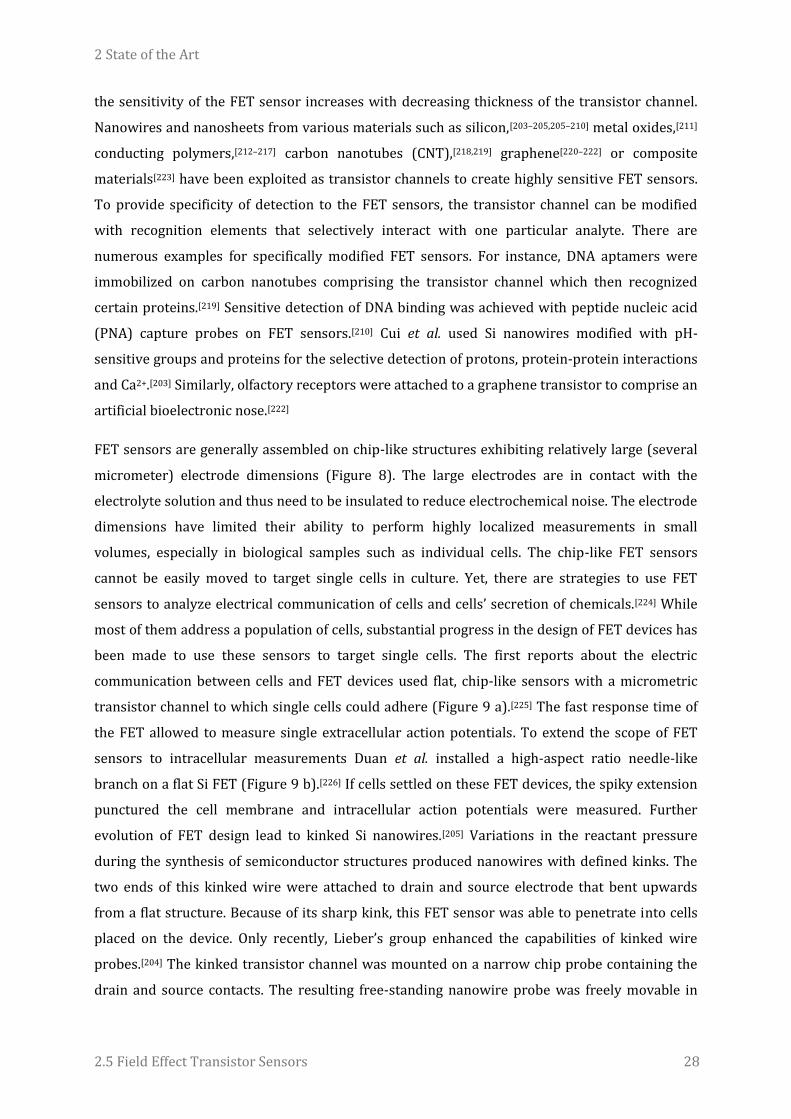
2 State of the Art
2.5 Field Effect Transistor Sensors 28
the sensitivity of the FET sensor increases with decreasing thickness of the transistor channel.
Nanowires and nanosheets from various materials such as silicon,[203–205,205–210] metal oxides,[211]
conducting polymers,[212–217] carbon nanotubes (CNT),[218,219] graphene[220–222] or composite
materials[223] have been exploited as transistor channels to create highly sensitive FET sensors.
To provide specificity of detection to the FET sensors, the transistor channel can be modified
with recognition elements that selectively interact with one particular analyte. There are
numerous examples for specifically modified FET sensors. For instance, DNA aptamers were
immobilized on carbon nanotubes comprising the transistor channel which then recognized
certain proteins.[219] Sensitive detection of DNA binding was achieved with peptide nucleic acid
(PNA) capture probes on FET sensors.[210] Cui et al. used Si nanowires modified with pH-
sensitive groups and proteins for the selective detection of protons, protein-protein interactions
and Ca2+.[203] Similarly, olfactory receptors were attached to a graphene transistor to comprise an
artificial bioelectronic nose.[222]
FET sensors are generally assembled on chip-like structures exhibiting relatively large (several
micrometer) electrode dimensions (Figure 8). The large electrodes are in contact with the
electrolyte solution and thus need to be insulated to reduce electrochemical noise. The electrode
dimensions have limited their ability to perform highly localized measurements in small
volumes, especially in biological samples such as individual cells. The chip-like FET sensors
cannot be easily moved to target single cells in culture. Yet, there are strategies to use FET
sensors to analyze electrical communication of cells and cells’ secretion of chemicals.[224] While
most of them address a population of cells, substantial progress in the design of FET devices has
been made to use these sensors to target single cells. The first reports about the electric
communication between cells and FET devices used flat, chip-like sensors with a micrometric
transistor channel to which single cells could adhere (Figure 9 a).[225] The fast response time of
the FET allowed to measure single extracellular action potentials. To extend the scope of FET
sensors to intracellular measurements Duan et al. installed a high-aspect ratio needle-like
branch on a flat Si FET (Figure 9 b).[226] If cells settled on these FET devices, the spiky extension
punctured the cell membrane and intracellular action potentials were measured. Further
evolution of FET design lead to kinked Si nanowires.[205] Variations in the reactant pressure
during the synthesis of semiconductor structures produced nanowires with defined kinks. The
two ends of this kinked wire were attached to drain and source electrode that bent upwards
from a flat structure. Because of its sharp kink, this FET sensor was able to penetrate into cells
placed on the device. Only recently, Lieber’s group enhanced the capabilities of kinked wire
probes.[204] The kinked transistor channel was mounted on a narrow chip probe containing the
drain and source contacts. The resulting free-standing nanowire probe was freely movable in
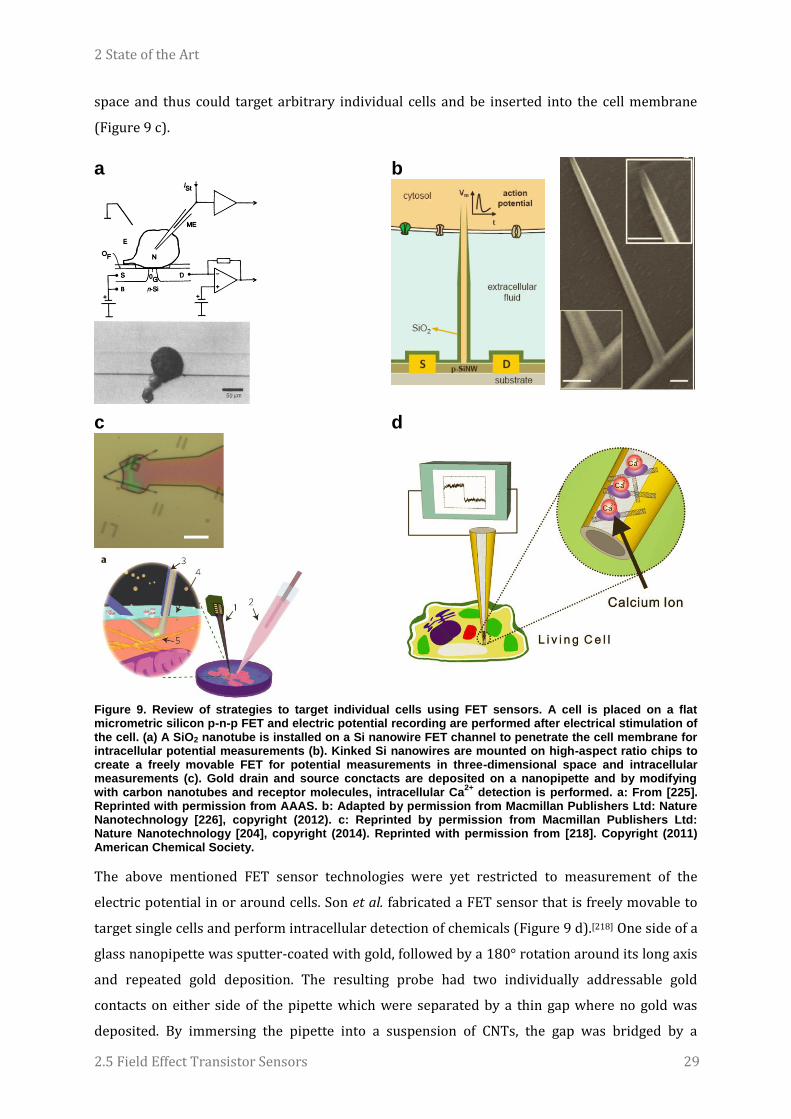
2 State of the Art
2.5 Field Effect Transistor Sensors 29
space and thus could target arbitrary individual cells and be inserted into the cell membrane
(Figure 9 c).
a
b
c
d
Figure 9. Review of strategies to target individual cells using FET sensors. A cell is placed on a flat micrometric silicon p-n-p FET and electric potential recording are performed after electrical stimulation of the cell. (a) A SiO2 nanotube is installed on a Si nanowire FET channel to penetrate the cell membrane for intracellular potential measurements (b). Kinked Si nanowires are mounted on high-aspect ratio chips to create a freely movable FET for potential measurements in three-dimensional space and intracellular measurements (c). Gold drain and source conctacts are deposited on a nanopipette and by modifying with carbon nanotubes and receptor molecules, intracellular Ca
2+ detection is performed. a: From [225].
Reprinted with permission from AAAS. b: Adapted by permission from Macmillan Publishers Ltd: Nature Nanotechnology [226], copyright (2012). c: Reprinted by permission from Macmillan Publishers Ltd: Nature Nanotechnology [204], copyright (2014). Reprinted with permission from [218]. Copyright (2011) American Chemical Society.
The above mentioned FET sensor technologies were yet restricted to measurement of the
electric potential in or around cells. Son et al. fabricated a FET sensor that is freely movable to
target single cells and perform intracellular detection of chemicals (Figure 9 d).[218] One side of a
glass nanopipette was sputter-coated with gold, followed by a 180° rotation around its long axis
and repeated gold deposition. The resulting probe had two individually addressable gold
contacts on either side of the pipette which were separated by a thin gap where no gold was
deposited. By immersing the pipette into a suspension of CNTs, the gap was bridged by a

2 State of the Art
2.5 Field Effect Transistor Sensors 30
network of CNTs which comprised the transistor channel. The CNTs were functionalized with a
fluorescent dye that acted as a capturing agent for Ca2+ ions. Using these probes, the authors
were able to perform Ca2+ determination inside single cells.
2 State of the Art
2.6 Nanoparticle Electrochemistry 31
2.6 Nanoparticle Electrochemistry
Nanoparticles and nanostructured materials are ubiquitous in modern chemistry. Especially
they are irreplaceable in catalysis because of their enhanced turnover rate for chemical and
electrochemical conversion reactions. Intensive research was dedicated to the synthesis,[227]
characterization[228] and application of nanoparticles in homogeneous and heterogeneous
catalysis.[229] The development of advanced materials with enhanced catalytic activity requires a
deep understanding of the underlying mechanisms and principles that govern the special
performance of nanostructured materials:[230] a) Adsorption and desorption behavior of
reactants and products during catalytic reactions are altered with respect to bulk materials
because of the high number of under-coordinated surface and edge atoms in nanoparticles. b)
Additionally, nanoparticles can have special electronic properties because the energy of
electrons in the particles is affected by the tight spatial confinement in the small particle
volume.[228] c) The high surface area creates a large interface for chemical reactions and the
small dimensions ensure fast diffusional transport of the reactants and products but also may
change the selectivity of the reaction.[231] The first two effects may have an impact on the kinetic
rates of a catalytic reaction. Compton coined the term “true nano effect” to describe a kinetic
acceleration due to the size of the nanoparticle.[232] For the design of new catalyst materials, the
interplay of these effects has to be understood. However, classical analytical tools for the
analysis of nanoparticles are hindered by the polydispersity of nanoparticle ensembles. Thus,
methods addressing individual particles, rather than particle ensembles have to be developed.
Electrochemical measurements associated with individual particles are performed in the nano-
impact (or nano-collision) method.[233] A microelectrode is used to measure electrochemical
responses when nanoparticles in solution collide with the electrode surface. The first reported
example of this method was a gradual blocking of an otherwise active Au electrode surface when
non-active latex particles settled on the microelectrode.[234] The stochastic events of particle
collisions yield information about the particle size or reaction rates for electrocatalytic
reactions. For instance, the charge transmitted for anodic oxidation of silver nanoparticles[235] or
reduction of Fe3O4 particles[236] correlates to the particle volume and thus allows to determine
the size distribution of particles. A key advantage of all techniques addressing the
electrochemistry at single nanoparticles is the extremely fast mass transport of reactants and
reaction products to and away from the electrode surface which allows to study electrocatalytic
reactions with a minimum influence of mass transport limitations. Moreover, upon intermittent
or permanent contact of particles at the surface, the particles are electrically connected and
electrocatalytic reactions such as the hydrogen evolution reaction[232,237] or oxygen evolution
reaction[238] are driven. Kahk et al. investigated the effect of particle size of Ag particles for the

2 State of the Art
2.6 Nanoparticle Electrochemistry 32
HER.[232] The height of current spikes when particles came in short contact with the electrode
depends on the applied potential and follows Butler-Volmer kinetics. The authors calculated the
heterogeneous electron transfer rates and found a size-dependence for Ag particles but not for
Au particles. However, the transient nature of the nano-impact method prevents the correlation
of particle size and electrochemical activity of the same particle. A single particle cannot be
studied over a long time in steady-state measurements so that either its size or its activity can be
determined but not both. This is especially problematic for particle populations with high
polydispersity.
As an alternative, high-resolution SECM or scanning electrochemical droplets were proposed for
the study of single electrocatalytically active particles.[141,143,146,239,240] These studies show the
feasibility of detecting the products of catalytical conversion and at the same time, the
electrochemical image gives an estimation of the particle size. The production of hydrogen was
detected from Au particles.[141] For the ORR, the oxygen consumption was visualized on Pt
particles[146] as well as the generation of H2O2 during incomplete oxygen reduction on Au
particles.[143] However, due to the technical difficulties, these techniques did not yet afford a
systematic correlation of structural parameters and particle activity.
Nanoelectrodes themselves are very good tools to study the size and catalytic activity without
the technical difficulties associated with positioning and distance control of small electrodes.
Nanoelectrodes can serve as a template for the synthesis of a single particle. If the electrode
dimensions are sufficiently small, controlled electrochemical deposition yields particles with
similar or slightly larger size than the electrode (Figure 10 a).[231,241,242] Alternatively, pre-
synthesized nanoparticles have also been immobilized to the electrode surface using different
chemical surface modification strategies[135,136] or simply physisorption (Figure 10 b, c).[243]
Chen and Kucernak pointed out that when investigating the ORR at individual Pt
nanoparticles[231] the mass transport rates at such small electrodes exceed by far the ones
obtainable in rotating disk electrode (RDE) experiments. Figure 10 b shows the mass transport
rates corresponding to different particle sizes. To achieve the same mass transport rate as found
at an electrode as large as 1 µm one would have to rotate an RDE with a technically impossible
rotation speed of 106 rpm. By first depositing Pt electrochemically on nanoelectrodes and
performing the ORR in acidic medium the authors describe two interesting phenomena.
Whereas macroscopic Pt electrodes are known to reduce oxygen completely via the 4-electron
pathway to water, more hydrogen peroxide via the 2-electron reduction was produced at
smaller particles. This observation is an effect of the enhanced mass transport. For a sequential 2
by 2-electron transfer, the high mass transport rate leads to a quick escape of intermittently
produced H2O2 before further reduction occurs. Hence, the electrocatalyst at too small particle

2 State of the Art
2.6 Nanoparticle Electrochemistry 33
size is less efficient due to the decreased electron yield. Figure 10 b also shows the decreasing
number of transferred electrons n as a function of decreasing particle size. Moreover, the
authors observed an effective deceleration of the electron transfer rate as indicated by higher
Tafel slopes at smaller particles and they attribute this finding to the EDL effect that diminished
the driving force for the reaction within the double layer. A similar phenomenological
observation seems to occur at Au nanoparticles (NP) which were attached to Pt nanoelectrodes
by silane chemistry.[136] From voltammograms at these electrodes the authors extracted a size-
dependent shift of half wave potentials E1/2 and concluded that Au particles with 24 nm had a
higher specific electrocatalytic activity than those with 14 nm. E1/2 is a measure of the
reversibility of the electrode process, i.e. the electron transfer rate with respect to the mass
transport rate. Since also the mass transport rate changes with particle size, the observed shift in
E1/2 is not necessarily equivalent to an increased specific catalytic activity.
a
b
c
d
Figure 10. Single nanoparticles deposited on nanoelectrodes allow non-ensemble electrocatalyst studies at high mass transport rates. A single Pt nanoparticle is deposited on a nanoelectrode (a) and during the oxygen reduction reaction (ORR) at the single particles, the number of transmitted electrons decreases with smaller particle size due to fast removal of intermediate H2O2 (b). The graph also shows the mass transport rate found at the corresponding particle sizes. TEM images are suitable to show the attachment of small gold nanoparticles to platinum (c) and carbon nanoelectrodes (d). a: Reprinted with permission from [241]. Copyright (2003) American Chemical Society. b: Reprinted with permission from [231]. Copyright (2004) American Chemical Society. c: Reprinted with permission from [136]. Copyright (2010) American Chemical Society. d: Reprinted from [135] with permission from John Wiley and Sons.
For elucidating the relation between catalytic activity and size of particles it is necessary to have
a precise method to measure particle sizes. The effective electrode size after attachment of a

2 State of the Art
2.6 Nanoparticle Electrochemistry 34
particle can be estimated by comparing the limiting currents for electrochemical reaction of
redox mediators from voltammograms before and after particle deposition.[135,244] The size is
estimated more precisely by exploiting redox properties or adsorption processes that are
specific to the material of the nanoparticle. For instance, the electric charge consumed for
hydrogen adsorption/desorption on platinum was used to determine the surface area and hence
the size of Pt nanoparticles.[231,241] In a similar way the charge for the formation and reduction of
a gold oxide layer can be used to measure the size of Au nanoparticles.[242,243]
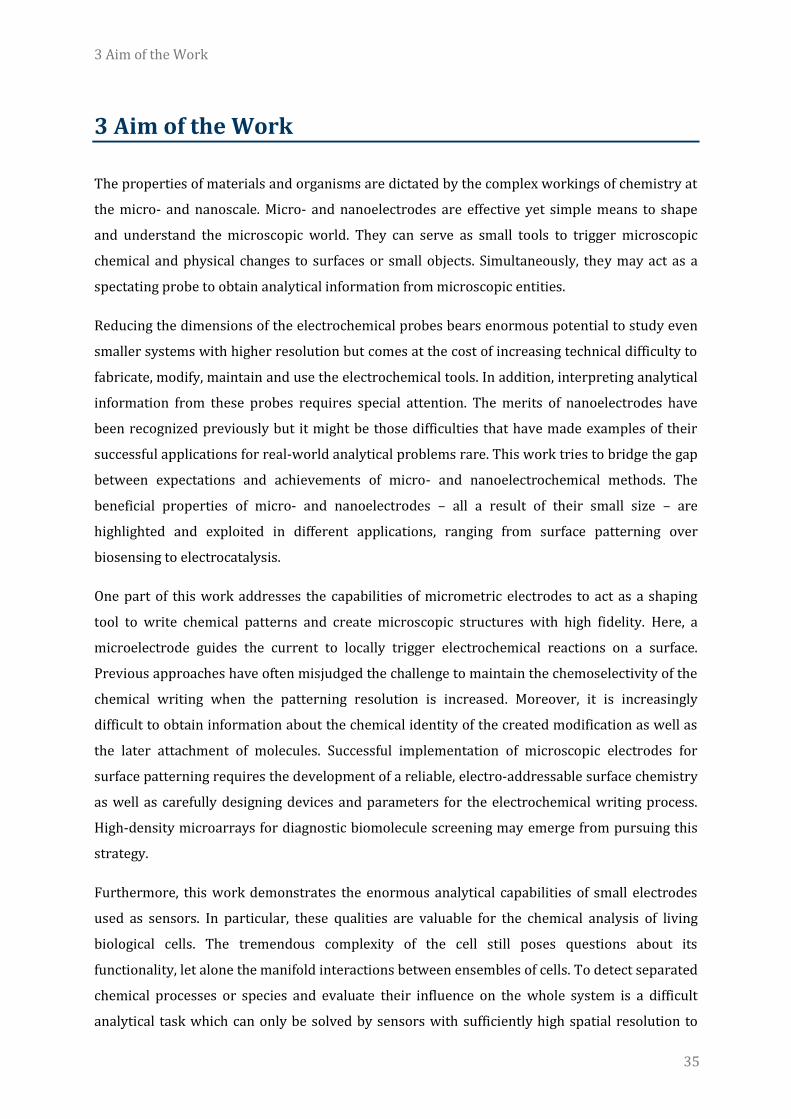
3 Aim of the Work
35
3 Aim of the Work
The properties of materials and organisms are dictated by the complex workings of chemistry at
the micro- and nanoscale. Micro- and nanoelectrodes are effective yet simple means to shape
and understand the microscopic world. They can serve as small tools to trigger microscopic
chemical and physical changes to surfaces or small objects. Simultaneously, they may act as a
spectating probe to obtain analytical information from microscopic entities.
Reducing the dimensions of the electrochemical probes bears enormous potential to study even
smaller systems with higher resolution but comes at the cost of increasing technical difficulty to
fabricate, modify, maintain and use the electrochemical tools. In addition, interpreting analytical
information from these probes requires special attention. The merits of nanoelectrodes have
been recognized previously but it might be those difficulties that have made examples of their
successful applications for real-world analytical problems rare. This work tries to bridge the gap
between expectations and achievements of micro- and nanoelectrochemical methods. The
beneficial properties of micro- and nanoelectrodes – all a result of their small size – are
highlighted and exploited in different applications, ranging from surface patterning over
biosensing to electrocatalysis.
One part of this work addresses the capabilities of micrometric electrodes to act as a shaping
tool to write chemical patterns and create microscopic structures with high fidelity. Here, a
microelectrode guides the current to locally trigger electrochemical reactions on a surface.
Previous approaches have often misjudged the challenge to maintain the chemoselectivity of the
chemical writing when the patterning resolution is increased. Moreover, it is increasingly
difficult to obtain information about the chemical identity of the created modification as well as
the later attachment of molecules. Successful implementation of microscopic electrodes for
surface patterning requires the development of a reliable, electro-addressable surface chemistry
as well as carefully designing devices and parameters for the electrochemical writing process.
High-density microarrays for diagnostic biomolecule screening may emerge from pursuing this
strategy.
Furthermore, this work demonstrates the enormous analytical capabilities of small electrodes
used as sensors. In particular, these qualities are valuable for the chemical analysis of living
biological cells. The tremendous complexity of the cell still poses questions about its
functionality, let alone the manifold interactions between ensembles of cells. To detect separated
chemical processes or species and evaluate their influence on the whole system is a difficult
analytical task which can only be solved by sensors with sufficiently high spatial resolution to

3 Aim of the Work
36
target single cells. Cells communicate by releasing substances into their environment and
respond to released substances. Understanding these signaling pathway mechanisms requires
tools not only to detect biologically relevant substances in relation to cells but also map their
spatial distribution in space and follow the temporal dynamics of their release and uptake.
Moreover, to quantify toxic unstable substances only occurring for a short time inside the cell,
sensors that target the interior of the cell are necessary. All these requirements are met by
electrochemical sensors based on nanoelectrodes. Hence, the aim of this work is to establish
nanoelectrodes as non-invasive sensors for the analysis of single cells, analyte mapping and
intracellular measurements.
However, the small amount of chemical species originating from a single cell is not easy to
detect. In addition, the sensitive nature of cells requires non-invasive techniques. Hence, the
challenges addressed herein are to reduce the sensor dimensions while still ensuring high
sensitivity for the analytical method. Moreover, strategies for specific sensor modifications are
to be developed that allow chemical analysis with high selectivity in complex biological matrices.
In the last part of this work the objects of interest are even smaller. Electrochemical processes
occurring at single nanoparticles are investigated, which demands very sophisticated analytical
techniques. The constant search for materials for efficient conversion and storage of chemical
energy calls for a deep understanding of the factors that govern the special chemical properties
and catalytic activity of nanomaterials. However, methods looking at particle ensembles
complicate the distinction between different geometric and electronic effects that determine
their behavior. Nanoelectrodes may be used as extremely small probes to enter the realm of
nanomaterials. Hence, this work assesses the use of nanoelectrodes as a platform for the
systematic electrochemical characterization of single nanoparticles. The dual role of
nanoelectrodes, both to serve as a template for nanoparticle deposition and simultaneously as a
connection from the nanoparticle to the macroscopic world is expected to be of high importance.
In summary, the aim of the work is to exploit the advantageous properties of microscopic
electrodes as tools for various analytical and technological applications. Their successful
implementation for these critical applications is expected to enhance the scope of micro- and
nanoelectrochemical methods for surface patterning, biosensing and electrocatalysis in general.
4 Results and Discussion
4.1 Electrochemical Surface Patterning 37
4 Results and Discussion
4.1 Electrochemical Surface Patterning
Synthesis of TBDMS-HQ diazonium precursors, optimization of global electrode functionalization
and characterization as well as preliminary experiments for SECM patterning were developed and
described in the author’s Master thesis.[245] The scanning droplet cell was constructed by Kirill
Sliozberg, Ruhr-Universität Bochum. Parts of this section were published in ref. [246]: “Clausmeyer,
J.; Henig, J.; Schuhmann, W.; Plumeré, N.; ChemPhysChem 2014, 15, 151.” Experiments concerning
the patterning of nitrophenyl layers were performed by Lutz Stratmann, Ruhr-Universität Bochum.
Parts of the section were published in ref. [247]: “Stratmann, L.*; Clausmeyer, J.*; Schuhmann, W.;
ChemPhysChem 2015, 16, 3477-3482”.
* These authors contributed equally
4.1.1 Global electrode modification with p-hydroquinone layers
An electrochemical patterning strategy for the local activation and selective attachment of
biomolecules requires a well-defined surface chemistry that can be triggered electrochemically.
A layer of p-hydroquinone (HQ) moieties protected by the tert-butyldimethylsilyl (TBDMS)
protecting group meets these criteria (Figure 11 a). Global chemoselective electrochemical
activation (i. e. integral electrode surfaces deprotection) of protected quinones has been
demonstrated previously.[248–250] However, local chemoselective deprotection via
electrochemical methods was not reported due to the high chemical sensitivity of the quinone
groups. Moreover, redox-active quinone films have important patterning applications since they
allow for versatile and modular functionalization of surfaces via the electrochemical triggering
of interfacial Diels-Alder-cycloaddition[26,251] as well as 1,2-[252] and 1,4-addition.[253–255] The
electrochemically cleavable protecting groups, in particular based on the silylether
functionality,[256] introduce additional surface properties in the initial state.[27,28,248,250,257–259]
For the formation of the electroactive film, an approach based on the reduction of aryl
diazonium salts was selected owing to the excellent stability of the organic tether on a large
variety of conductive materials.[57,58] The bulky TBDMS group was chosen not only to protect the
quinone, but also to limit the formation of multilayers during electrografting.[260] The rigid linker
between the quinone and aminophenyl moieties avoids, upon tethering, undesired interaction of
the quinone with the surface or neighboring quinones.

4 Results and Discussion
4.1 Electrochemical Surface Patterning 38
The aryldiazonium salt was generated in situ in the electrochemical cell [261] and, upon cathodic
reduction, grafted to glassy carbon electrodes (GCE). In 0.1 M TBAHFP/acetonitrile, the amine
precursor was converted into its corresponding diazonium salt by addition of a small amount of
acid and tert-butylnitrite. The diazonium salt was electrochemically reduced in a cyclic
voltammogram between 0.4 and -0.1 V vs. SHE whereas the success of the surface modification
was evaluated by the passivation of the electrode surface.[57,58,246]
a
b
0.0 0.5 1.0 1.5
0
5
10
i /
µA
E / V vs. SHE
2
1
0.0 0.5
-1
0
1
c
0.0 0.2 0.4 0.6
-2
-1
0
1
220
310
1
i /
µA
E / V vs. SHE
2
Figure 11. Electrografted p-hydroquinone groups are deprotected, oxidized and functionalized with thiols under electrochemical control (a). CV for the electrochemical cleavage of the TBDMS protecting group in 50 mM acetate buffer pH 4.4, 0.1 M NaClO4. (b) Inset: CV characterization in 0.1 M phosphate buffer pH 7.0 after deprotection (solid line) and before deprotection (dashed line). Michael addition to the surface-confined benzoquinone in 250 µM 2-mercaptoethanol, 0.1 M phosphate buffer pH 7.0 (c). The numbers on the graph represent subsequent cycles. Scan rates 50 mV/s for (b) to (c) and 200 mV/s for (c).
After electrografting, the cleavage of the TBDMS group from surface-confined HQ is accom-
plished by anodic oxidation to the benzoquinone (BQ) under concomitant cleavage of the Si-O
bond[256] in aqueous electrolyte (Figure 11 b). During the first anodic scan of the cyclic
voltammogram (CV), the onset of the irreversible reaction takes place at a potential of 0.8 V vs.
SHE. Apart from a gradual increase in anodic current due to the oxidation of water, a current
peak at 1.2 V vs. SHE is seen. This signal is attributed to the direct oxidation of the hydroquinone
species and cleavage of the silylether protecting group.[256] After the first forward sweep,
symmetric current peaks at 0.6 V vs. SHE anodically and 0.2 V vs. SHE cathodically occur which
are attributed to the oxidation and reduction of the HQ/BQ couple, indicating successful
deprotection of the quinone. After transferring the modified electrode to neutral buffer, the

4 Results and Discussion
4.1 Electrochemical Surface Patterning 39
presence of the surface-confined deprotected quinone is confirmed by the reversible current
peaks in the CV at 0.34 V vs. SHE anodically and 0.15 V vs. SHE cathodically (Figure 11 b, inset).
The corresponding CV before electrochemical deprotection does not show any redox peaks.
From the charge transferred during the anodic peak, the surface coverage of active quinone was
determined to be (2 ± 1) 10-10 mol∙cm-2, which correlates with the theoretical value expected for
a monolayer assuming a spatial demand of 1 nm2 per molecule.
The peak separation (ΔE ≈ 200 mV) of the HQ/BQ couple deviates from the one expected for a
reversible surface confined redox couple (ΔE = 0 mV), however is typical of quinone systems
exhibiting an apparent two-electron transfer mechanism. Accordingly, slow electron transfer
kinetics of electrografted quinone derivatives have been observed previously on various
substrates[262–264] including glassy carbon.[265,266] The ability of the surface-tethered quinone
layer to undergo interfacial Michael addition reaction was evaluated using 2-mercaptoethanol as
a nucleophile. Upon addition of 2-mercaptoethanol as a model reactant, the current peaks
attributed to the surface-confined HQ/BQ couple shift in cathodic direction (Figure 11 c). The
shift in potential is consistent with an increased electron density in the aromatic system due to
the introduction of the sulfur-containing substituent.[253,254,267] This demonstrates that the
electrografted films of TBDMS-protected quinones are suitable for the reagentless
electrochemical activation and re-functionalization via tethering of Michael donors.
4.1.2 Potentiostatic patterning in the SECM
For patterning of redox-switchable surface moieties various electrochemical scanning probe
techniques were previously employed. Especially the direct mode of SECM seems suitable
because of its possibility for reagent-free surface modification. To activate the quinone-modified
glassy carbon substrate it is connected as the working electrode, a microelectrode serves as the
counter electrode and a reference electrode is placed in the electrolyte solution (Figure 12 a).
When applying a short potential pulse to the working electrode, the current for activation of the
sample is limited to the area underneath the micrometric counter electrode. However, the direct
mode is incapable of patterning of sensitive surface groups such as the quinone groups used in
this study: Attempts to cleave the TBDMS locally by applying a short anodic potential pulse in
the direct mode SECM result in massive corrosion of the carbon substrate. To achieve the local
deprotection of surface-confined HQ moieties on glassy carbon electrodes, potential pulses of
1.4 V were applied for 500 ms in the same electrolyte solution as used in Figure 11 b. As a result,
indentations with a depth of several µm were formed due to the corrosion of the carbon
substrate (Figure 12 b). AFM images show that the damage of substrate occurs irrespective of
the distance between the micrometric counter electrode and the length of the potential pulses in
a range of 3 - 20 µm and 5 – 500 ms, respectively.
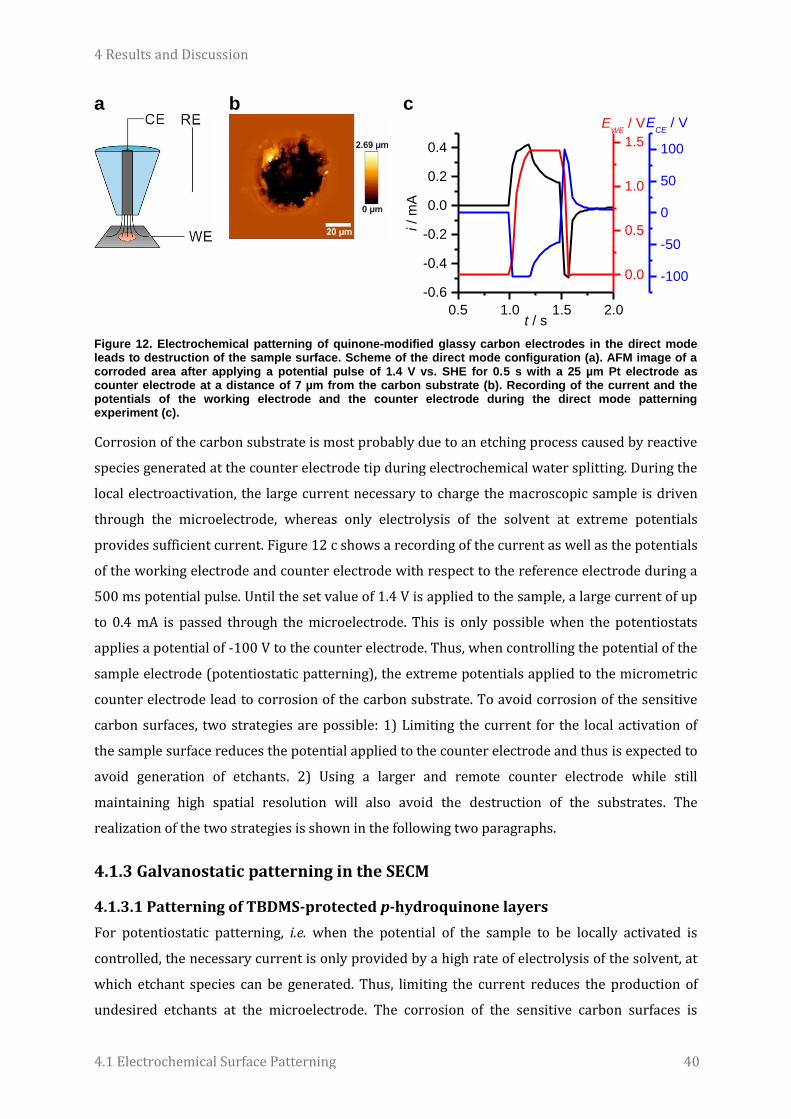
4 Results and Discussion
4.1 Electrochemical Surface Patterning 40
a
b
c
0.5 1.0 1.5 2.0
-0.6
-0.4
-0.2
0.0
0.2
0.4
i /
mA
t / s
0.0
0.5
1.0
1.5
-100
-50
0
50
100
ECE
/ VEWE
/ V
Figure 12. Electrochemical patterning of quinone-modified glassy carbon electrodes in the direct mode leads to destruction of the sample surface. Scheme of the direct mode configuration (a). AFM image of a corroded area after applying a potential pulse of 1.4 V vs. SHE for 0.5 s with a 25 µm Pt electrode as counter electrode at a distance of 7 µm from the carbon substrate (b). Recording of the current and the potentials of the working electrode and the counter electrode during the direct mode patterning experiment (c).
Corrosion of the carbon substrate is most probably due to an etching process caused by reactive
species generated at the counter electrode tip during electrochemical water splitting. During the
local electroactivation, the large current necessary to charge the macroscopic sample is driven
through the microelectrode, whereas only electrolysis of the solvent at extreme potentials
provides sufficient current. Figure 12 c shows a recording of the current as well as the potentials
of the working electrode and counter electrode with respect to the reference electrode during a
500 ms potential pulse. Until the set value of 1.4 V is applied to the sample, a large current of up
to 0.4 mA is passed through the microelectrode. This is only possible when the potentiostats
applies a potential of -100 V to the counter electrode. Thus, when controlling the potential of the
sample electrode (potentiostatic patterning), the extreme potentials applied to the micrometric
counter electrode lead to corrosion of the carbon substrate. To avoid corrosion of the sensitive
carbon surfaces, two strategies are possible: 1) Limiting the current for the local activation of
the sample surface reduces the potential applied to the counter electrode and thus is expected to
avoid generation of etchants. 2) Using a larger and remote counter electrode while still
maintaining high spatial resolution will also avoid the destruction of the substrates. The
realization of the two strategies is shown in the following two paragraphs.
4.1.3 Galvanostatic patterning in the SECM
4.1.3.1 Patterning of TBDMS-protected p-hydroquinone layers
For potentiostatic patterning, i.e. when the potential of the sample to be locally activated is
controlled, the necessary current is only provided by a high rate of electrolysis of the solvent, at
which etchant species can be generated. Thus, limiting the current reduces the production of
undesired etchants at the microelectrode. The corrosion of the sensitive carbon surfaces is

4 Results and Discussion
4.1 Electrochemical Surface Patterning 41
avoided when the patterning is performed galvanostatically, i.e. under control of the current. To
evaluate the success of the local modification during electrochemical writing, feedback mode
SECM is used as a tool to read out the patterns. In the feedback mode experiments,
ferrocenedimethanol serves as the redox mediator that discriminates between the surface
carrying TBDMS-protected quinone groups and the quinone-terminated surface after
deprotection. A Pt microelectrode is polarized at a potential for diffusion-limited oxidation of
ferrocenedimethanol and the modified glassy carbon electrode is polarized at a potential for
reduction of the corresponding ferricinium cation.
0 1 2 3
0
1
2
3
4
5
i no
rm =
i/i
bulk
dtip-sample
/rtip
Figure 13. Feedback mode SECM with ferrocenedimethanol as the redox mediator distinguishes between TBDMS-protected quinone moieties and deprotected quinone moiteties. Approach curves to pristine TBDMS-HQ surface and after electrochemical deprotection. Etip = 0.56 V vs. SHE and Esample = 0.21 V vs. SHE. Redox mediator 1 mM ferrocenedimethanol, 0.1 M KCl, 25 µm Pt electrode.
When the tip is approached to the carbon substrate modified globally with TBDMS-protected
quinone groups, re-reduction at the substrate is inhibited. Thus, because diffusional access to the
microelectrode is obstructed as the probe comes closer to the sample surface, the current at the
microelectrode decreases (Figure 13, blue curve). A negative feedback of current is recorded. In
contrast, the deprotected quinone surface permits the recycling of the redox probe as the
microelectrode tip approaches and thus the tip current increases with decreasing tip-to-sample
distance (positive feedback, Figure 13, red curve).
Patterning of the TBDMS-HQ-modified electrodes is achieved by applying short current pulses to
the glassy carbon samples with the micrometric counter electrode positioned in close proximity.
Under galvanostatic control the currents may be decreased to avoid the generation of etchants at
the microelectrode. The potential of the working electrode during a current pulse is
inhomogeneously distributed over the whole surface with its highest magnitude centered at the
position under the microelectrode. The relation between current and working electrode
potential and its spatial distribution is unknown. Hence, the current magnitude that leads to a
sufficient potential to drive the anticipated removal of the protective group at the carbon surface
has to be determined empirically. The SECM allows for fast screening of the parameters leading

4 Results and Discussion
4.1 Electrochemical Surface Patterning 42
to the desired surface modification without destruction of the film or the underlying
substrate.[247] To optimize the conditions for the local cleavage of the TBDMS group the
magnitude of the direct mode current pulses is varied. The resulting local surface modifications
are visualized by means of FB mode SECM (Figure 14). The SECM image shows an array of
locally modified spots created by applying direct mode current pulses with magnitudes between
11.5 µA and 13 µA. The FB current over the local modifications increases due to recycling of
ferrocenedimethanol, suggesting the successful local removal of the TBDMS group.
a
b
Figure 14. Destruction-free patterning is achieved by applying short galvanostatic pulses for removal of the TBDMS group. FB mode SECM image after applying 11.5, 12, 12.5 and 13 µA pulses (from left to right) (a). AFM image of the rightmost spot from the SECM image (b). Patterning: pulse duration 0.5 s, tip-to-sample distance 5 µm. Imaging: Feedback mode as described in Figure 13.
The intensity and width of the spots increases with higher patterning current, indicating
increasing efficiency of the local surface-confined reaction. Local corrosion of the carbon
surfaces can be excluded: AFM images show no observable damage after local surface
modification (Figure 14 b). Thus, patterning by current pulses in the direct mode of SECM is
suitable for local modifications of sensitive surface groups. Corrosion of the sample is avoided by
limiting the current passed through the micrometric counter electrode.
4.1.3.2 Patterning of nitrophenyl layers
Galvanostatic patterning in the direct mode of SECM was also successfully applied for a different
type of electrografted functional groups, proving that the method is generic and can be adapted
for local modifications using diverse surface chemistry. Electrografting of nitrophenyldiazonium
salts yields well-characterized organic films with NO2-groups exposed at the surface.[268] Then,
via a second electrochemical reduction step, the surface-confined nitro groups can be converted
to hydroxylamino and amino groups upon applying a cathodic potential in acidic medium. As
previously shown,[269–271] the reduced amino groups can then be used as anchoring groups for
biomolecule immobilization. The SECM was used as a tool for local reduction of NO2 groups and
subsequent localized immobilization of proteins to create protein arrays (Figure 15 a). For the
electrografting of nitrophenyl groups glassy carbon plates were immersed in 1 mM
nitrophenyldiazonium tetrafluoroborate, 0.1 M H2SO4 and a cyclic voltammogram from 0.4 V
to -0.3 V vs. Ag/AgCl/ 3 M KCl was recorded.[268] Analogous to previous work on
4-nitrothiophenol self-assembled monolayers[270] the redox state of the nitro groups may be
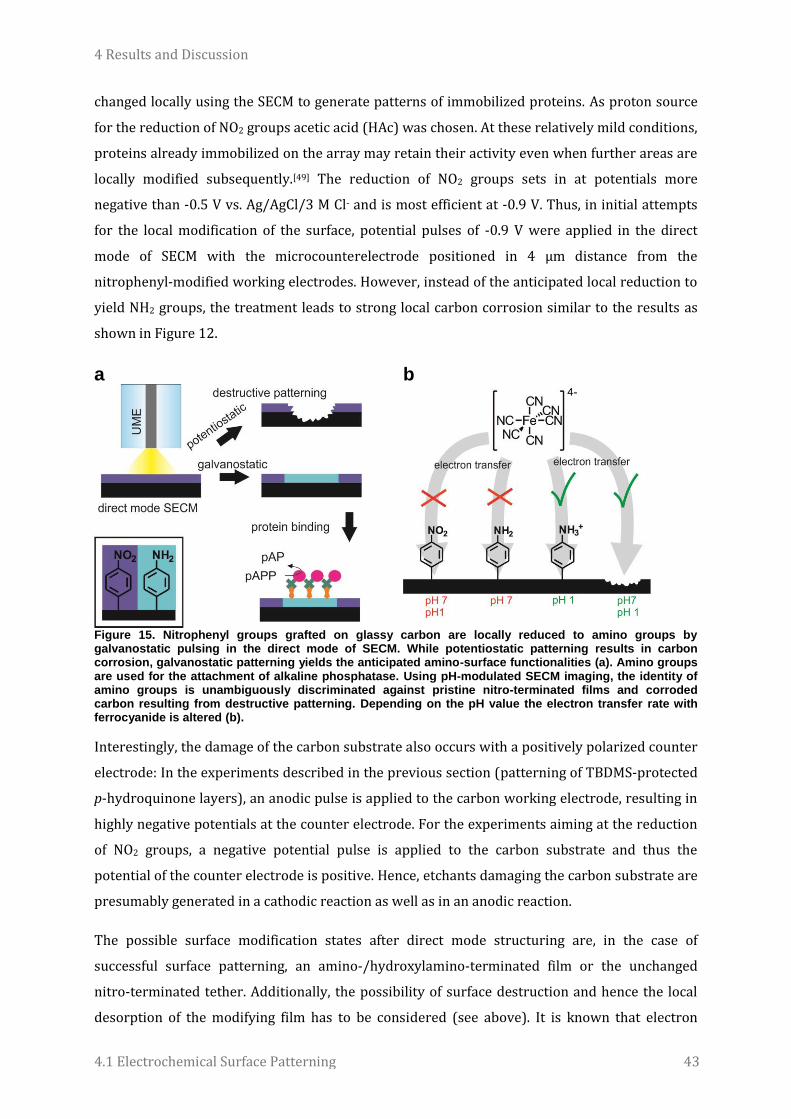
4 Results and Discussion
4.1 Electrochemical Surface Patterning 43
changed locally using the SECM to generate patterns of immobilized proteins. As proton source
for the reduction of NO2 groups acetic acid (HAc) was chosen. At these relatively mild conditions,
proteins already immobilized on the array may retain their activity even when further areas are
locally modified subsequently.[49] The reduction of NO2 groups sets in at potentials more
negative than -0.5 V vs. Ag/AgCl/3 M Cl- and is most efficient at -0.9 V. Thus, in initial attempts
for the local modification of the surface, potential pulses of -0.9 V were applied in the direct
mode of SECM with the microcounterelectrode positioned in 4 µm distance from the
nitrophenyl-modified working electrodes. However, instead of the anticipated local reduction to
yield NH2 groups, the treatment leads to strong local carbon corrosion similar to the results as
shown in Figure 12.
a
b
Figure 15. Nitrophenyl groups grafted on glassy carbon are locally reduced to amino groups by galvanostatic pulsing in the direct mode of SECM. While potentiostatic patterning results in carbon corrosion, galvanostatic patterning yields the anticipated amino-surface functionalities (a). Amino groups are used for the attachment of alkaline phosphatase. Using pH-modulated SECM imaging, the identity of amino groups is unambiguously discriminated against pristine nitro-terminated films and corroded carbon resulting from destructive patterning. Depending on the pH value the electron transfer rate with ferrocyanide is altered (b).
Interestingly, the damage of the carbon substrate also occurs with a positively polarized counter
electrode: In the experiments described in the previous section (patterning of TBDMS-protected
p-hydroquinone layers), an anodic pulse is applied to the carbon working electrode, resulting in
highly negative potentials at the counter electrode. For the experiments aiming at the reduction
of NO2 groups, a negative potential pulse is applied to the carbon substrate and thus the
potential of the counter electrode is positive. Hence, etchants damaging the carbon substrate are
presumably generated in a cathodic reaction as well as in an anodic reaction.
The possible surface modification states after direct mode structuring are, in the case of
successful surface patterning, an amino-/hydroxylamino-terminated film or the unchanged
nitro-terminated tether. Additionally, the possibility of surface destruction and hence the local
desorption of the modifying film has to be considered (see above). It is known that electron

4 Results and Discussion
4.1 Electrochemical Surface Patterning 44
transfer with charged redox mediators across amino-terminated films is largely dependent on
the pH value.[272,273] The pristine nitrophenyl film blocks the electrode surface for redox
mediators irrespective of the charge or pH value, while blank glassy carbon generally allows
efficient electron transfer (Figure 15 b). Amino groups may be protonated or deprotonated
according to the pH value of the electrolyte. Amino-terminated layers do not allow fast electron
transfer for the oxidation of [Fe(CN)6]4- at pH 7, while electron transfer is efficient at pH 1. The
acceleration of electron transfer for the protonated amino-film is presumably to a favorable
interaction between the positively charged surface and the highly negatively charged
ferrocyanide anion. At neutral pH value, however the blocking properties of the film dominate.
The different electron transfer rates for the oxidation of [Fe(CN)6]4- are exploited to distinguish
the different surface modifications in a pH-modulated feedback mode SECM imaging experiment.
a
0 5 10
1
2
blank pH 1
blank pH 7
-NO2 pH 1
-NO2 pH 7
-NH2 pH 1
-NH2 pH7i n
orm
= i/i
bulk
dtip-sample
/rtip
b
c
d
Figure 16. Aminophenyl-terminated sample areas are identified by pH-modulated feedback mode SECM imaging. Approach curves to the differently modified substrate surfaces (see legend) show the differences in electron transfer rate with the redox mediator [Fe(CN)6]
3- (a). Images of a test sample (b)
containing areas with different surface functionalization (c, d). The NH2-modified area is identified by the change of properties upon protonation/deprotonation. FB mode in 1 mM K3[Fe(CN)6] in either 0.1 M HCl (pH1) or 0.1 M phosphate buffer (pH 7) with Etip = 0 V and Esample = 0.5 V (pH 1) or Etip = -0.1 V and Esample = 0.4 V (pH 7).
On glassy carbon samples carrying the different possible surface modification states SECM
approach curves were recorded (Figure 16 a). The redox mediator [Fe(CN)6]3- is reduced at the

4 Results and Discussion
4.1 Electrochemical Surface Patterning 45
microelectrode tip. As expected, the nitro-terminated surface prevents re-oxidation of
ferrocyanide produced at the microelectrode irrespective of the pH value, leading to a negative
feedback of current at both tested pH values (purple curves). On the other hand, the blank glassy
carbon sample always exhibits a positive feedback due to the efficient recycling of ferrocyanide
(black curves). Only the amino/hydroxylamino surface (cyan curves) changes the electron
transfer rate upon protonation/deprotonation. This leads to a positive feedback at pH 1 (dotted
line) while at pH 7 the blocking properties dominate and the feedback is negative (solid line). To
demonstrate the possibility of distinguishing between the different surface modification states
on a laterally inhomogenous sample, a test sample was prepared and investigated by feedback
mode SECM (Figure 16 b-d). A glassy carbon plate was dipped partially into 4-nitrophenyl
diazonium solution for electrografting of nitrophenyl moieties by means of CV from 0.4 to -0.3 V
vs. Ag/AgCl/3 M Cl-. The plate was then turned by 90 ° and dipped partially into sulfuric acid for
the electrochemical reduction of nitro groups during CVs between 0.75 and -0.9 V vs.
Ag/AgCl/3 M Cl-. Finally the sample consisted of four differently modified segments. Two
segments of blank glassy carbon, one of which was exposed to sulfuric acid and reducing
potentials. One segment was covered with the unmodified nitro-terminated film. The last
segment exhibited electrochemically reduced amino/hydroxylamino groups. Two constant
height SECM array scans at different pH values were performed using [Fe(CN)6]3- as redox
mediator, which is reduced at the SECM tip (Figure 16 c, d). In the two tip current images higher
cathodic current values represent a positive feedback current due to efficient recycling of the
redox mediator at the sample surface. Higher anodic current values (negative feedback)
correspond to a decreased electron transfer rate due to the presence of a blocking film at the
carbon surface. As expected from the behavior seen in the approach curves, at pH 1 only the
nitrophenyl-modified area exhibits negative feedback. At this pH value, aminophenyl moieties
are protonated and thus permit recycling of the negatively charged redox probe. In contrast, at
pH 7 the amino functionalities are largely deprotonated and thus the blocking properties of the
film hinder electron transfer with the redox probe. Hence, modulation of the pH value during
feedback mode imaging allows to unambiguously distinguishing between a blank GC surface, a
nitrophenyl- or an aminophenyl-terminated surface.
A nitrophenyl-modified electrode is patterned in the direct mode by applying galvanostatic
pulses with different current magnitudes at different positions of the microelectrode. The
current magnitude that leads to the sufficiently low potential to drive the anticipated reduction
of nitro groups at the carbon surface is determined empirically. The spots modified during the
galvanostatic pulses are characterized in the feedback (FB) mode of the SECM with [Fe(CN)6]3- as
mediator at different pH values. To read out the local surface modification, a SECM line scan is
performed across a series of spots which were modified by applying cathodic current pulses
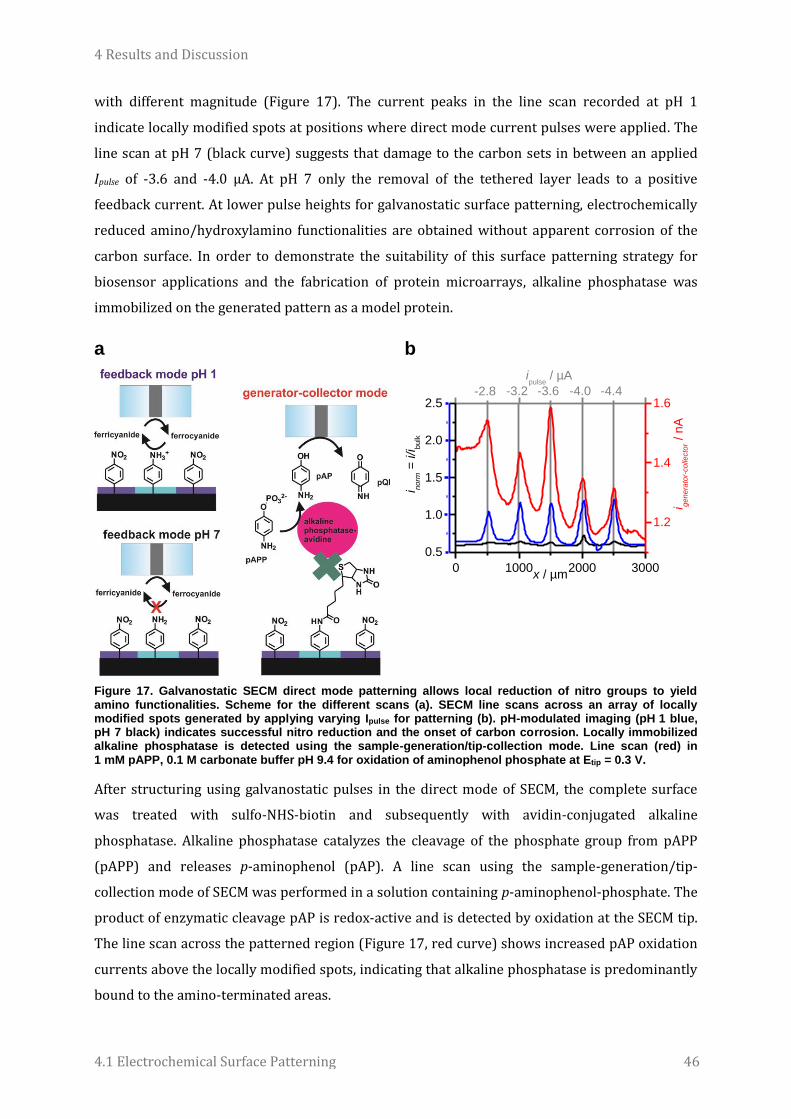
4 Results and Discussion
4.1 Electrochemical Surface Patterning 46
with different magnitude (Figure 17). The current peaks in the line scan recorded at pH 1
indicate locally modified spots at positions where direct mode current pulses were applied. The
line scan at pH 7 (black curve) suggests that damage to the carbon sets in between an applied
Ipulse of -3.6 and -4.0 µA. At pH 7 only the removal of the tethered layer leads to a positive
feedback current. At lower pulse heights for galvanostatic surface patterning, electrochemically
reduced amino/hydroxylamino functionalities are obtained without apparent corrosion of the
carbon surface. In order to demonstrate the suitability of this surface patterning strategy for
biosensor applications and the fabrication of protein microarrays, alkaline phosphatase was
immobilized on the generated pattern as a model protein.
a
b
0 1000 2000 3000
0.5
1.0
1.5
2.0
2.5
i no
rm =
i/i
bu
lk
x / µm
1.2
1.4
1.6
i ge
ne
rato
r-co
llecto
r / n
A
-2.8 -3.2 -3.6 -4.0 -4.4
ipulse
/ µA
Figure 17. Galvanostatic SECM direct mode patterning allows local reduction of nitro groups to yield amino functionalities. Scheme for the different scans (a). SECM line scans across an array of locally modified spots generated by applying varying Ipulse for patterning (b). pH-modulated imaging (pH 1 blue, pH 7 black) indicates successful nitro reduction and the onset of carbon corrosion. Locally immobilized alkaline phosphatase is detected using the sample-generation/tip-collection mode. Line scan (red) in 1 mM pAPP, 0.1 M carbonate buffer pH 9.4 for oxidation of aminophenol phosphate at Etip = 0.3 V.
After structuring using galvanostatic pulses in the direct mode of SECM, the complete surface
was treated with sulfo-NHS-biotin and subsequently with avidin-conjugated alkaline
phosphatase. Alkaline phosphatase catalyzes the cleavage of the phosphate group from pAPP
(pAPP) and releases p-aminophenol (pAP). A line scan using the sample-generation/tip-
collection mode of SECM was performed in a solution containing p-aminophenol-phosphate. The
product of enzymatic cleavage pAP is redox-active and is detected by oxidation at the SECM tip.
The line scan across the patterned region (Figure 17, red curve) shows increased pAP oxidation
currents above the locally modified spots, indicating that alkaline phosphatase is predominantly
bound to the amino-terminated areas.
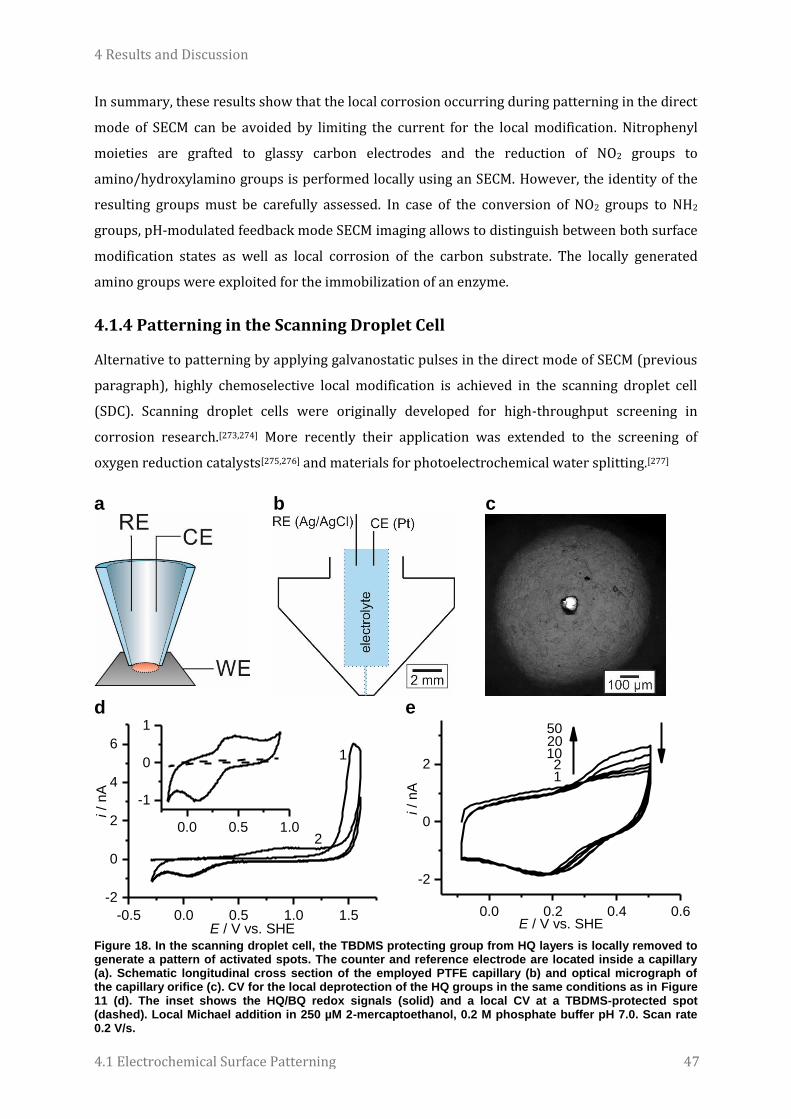
4 Results and Discussion
4.1 Electrochemical Surface Patterning 47
In summary, these results show that the local corrosion occurring during patterning in the direct
mode of SECM can be avoided by limiting the current for the local modification. Nitrophenyl
moieties are grafted to glassy carbon electrodes and the reduction of NO2 groups to
amino/hydroxylamino groups is performed locally using an SECM. However, the identity of the
resulting groups must be carefully assessed. In case of the conversion of NO2 groups to NH2
groups, pH-modulated feedback mode SECM imaging allows to distinguish between both surface
modification states as well as local corrosion of the carbon substrate. The locally generated
amino groups were exploited for the immobilization of an enzyme.
4.1.4 Patterning in the Scanning Droplet Cell
Alternative to patterning by applying galvanostatic pulses in the direct mode of SECM (previous
paragraph), highly chemoselective local modification is achieved in the scanning droplet cell
(SDC). Scanning droplet cells were originally developed for high-throughput screening in
corrosion research.[273,274] More recently their application was extended to the screening of
oxygen reduction catalysts[275,276] and materials for photoelectrochemical water splitting.[277]
a
b
c
d
-0.5 0.0 0.5 1.0 1.5
-2
0
2
4
6
2
i /
nA
E / V vs. SHE
1
0.0 0.5 1.0
-1
0
1
e
0.0 0.2 0.4 0.6
-2
0
2
50
1020
1
i /
nA
E / V vs. SHE
2
Figure 18. In the scanning droplet cell, the TBDMS protecting group from HQ layers is locally removed to generate a pattern of activated spots. The counter and reference electrode are located inside a capillary (a). Schematic longitudinal cross section of the employed PTFE capillary (b) and optical micrograph of the capillary orifice (c). CV for the local deprotection of the HQ groups in the same conditions as in Figure 11 (d). The inset shows the HQ/BQ redox signals (solid) and a local CV at a TBDMS-protected spot (dashed). Local Michael addition in 250 µM 2-mercaptoethanol, 0.2 M phosphate buffer pH 7.0. Scan rate 0.2 V/s.

4 Results and Discussion
4.1 Electrochemical Surface Patterning 48
In surface patterning, experimental setups similar to a SDC were employed for local deposition
of metals[278], metal oxidation[279,280] and deposition of conducting polymers.[281–285] Apart from
these examples, the SDC is well suited for local activation of modified surfaces. The SDC was
applied for the local electrochemical cleavage of TBDMS protecting groups from electrografted
p-hydroquinone moieties. To avoid corrosion of the carbon substrate, the protecting groups are
locally removed with high chemoselectivity to reveal spots of surface-tethered active quinone
moieties (Figure 18). In the SDC, the reference electrode and counter electrode are located
inside a capillary filled with electrolyte. When the capillary is in contact with the substrate, the
electrolyte droplet on the substrate surface dictates the size of the electrochemically addressed
area. By using soft capillaries made from polytetrafluoro-ethylene, damages to the surface are
excluded when touching the sample with the capillary. The capillaries have an orifice of only 100
µm diameter (Figure 18 c). The local deprotection is accomplished by applying the same
potential sweep as for integral deprotection (Figure 18 d). The CV for the deprotection in acidic
solution exhibits the same characteristics as the one recorded for global removal of the TBDMS
protecting group from grafted HQ moieties (compare to Figure 11). After the irreversible
oxidation of the HQ group under cleavage of the protective group, the signals attributed to the
HQ/BQ couple appear. After filling the capillary with pH 7 buffer solution and re-positioning it to
the deprotected spot, the reversible HQ/BQ signals are visible, whereas the CV recorded at a
TBDMS-protected spot shows no such signals (inset). The HQ/BQ redox signals provide direct
evidence for the anticipated local chemical modification and prove that the SDC allows for
chemoselective electrochemical patterning of the sensitive functional groups. Additionally, the
locally activated HQ groups can be re-functionalized via Michael addition with a thiol compound.
As previously described for the global Michael addition (Figure 11), the SDC is re-positioned on a
deprotected spot and HQ groups are oxidized in the presence of mercaptoethanol in the
capillary.
As expected, the current peaks attributed to the HQ/BQ couple shift towards more cathodic
potential. Hence, patterning in the SDC allows for site-selective immobilization of molecules on
the locally activated films. For the SDC, capillaries with different orifice sizes from 1 mm down to
100 µm can be used. In this study, the smallest orifice was used to achieve patterning with high
resolution. To assess the surface area of the wetted and thus electroactive spot on the TBDMS-
HQ-modified glassy carbon electrode, a potential step experiment with [Ru(NH3)6]3+ as redox
mediator was performed (see experimental part). The active surface area amounts to (8.6 ± 0.3)
10-5 cm2 which corresponds to a diameter of the droplet inside the capillary of 105 ± 2 µm and
thus is in good agreement with the dimensions of the capillary orifice.
In addition, the generated patterns of deprotected HQ groups surrounded by TBDMS-HQ can be
visualized by means of feedback mode SECM. The imaging contrast between the two surface

4 Results and Discussion
4.1 Electrochemical Surface Patterning 49
modification states is explained by the differences in heterogeneous electron transfer rate with
ferrocenedimethanol as redox mediator (also see Figure 13). The tip is scanned in constant
height mode over an array of spots of locally deprotected quinone resulting from patterning in
the scanning droplet cell (Figure 19 a). Accordingly, the SECM image of the area patterned in the
SDC exhibits clear circular features resulting from the modified spots. The diameter of the spots
is only slightly larger than the orifice of the SDC capillary. This is expected because SECM images
the diffusion layer of the modified spots which is larger than the spots themselves.
a
b
0 500 1000
1
2
in
orm
= i/i
bu
lk
x / µm
Figure 19. Generated patterns of deprotected HQ groups are visualized by means of SECM. Feedback mode SECM image of an array of deprotected spots generated in the SDC (a). Horizontal cross section through the same array (b). Etip = 0.56 V vs. SHE and Esample = 0.21 V vs. SHE. Redox mediator 1 mM ferrocenedimethanol, 0.1 M KCl, 25 µm Pt electrode, scanning height 5 µm.
In conclusion, non-destructive surface patterning is achieved using the scanning droplet cell for
the local electrochemical modification of surface functionalities. In contrast to the direct mode of
SECM, the counter electrode is large and remote from the substrate surface. Thus, degradation of
the sensitive sample surfaces by etchants generated at the counter electrode tip is excluded.
Moreover, the electrochemical data, namely the CVs for the electrochemical cleavage of the
TBDMS group, the redox signals for the surface-confined hydroquinone/benzoquinone couple
and the monitoring of the Michael addition of thiols to the quinone-terminated surface are direct
evidence for the anticipated local surface modifications.
The identity of the etchants responsible for carbon corrosion remains unknown. Possibly, the
very corrosive OH radical plays a role for the etching process. Previous studies for destructive
patterning in the SECM showed evidence that OH radicals are produced cathodically as well as
anodically. For instance, excessively high potentials applied to the microelectrode led to the
polymerization of vinylic monomers in solution which hints at the radical nature of the
etchants.[286] Also when cathodic potentials were applied to the microelectrode in the presence

4 Results and Discussion
4.1 Electrochemical Surface Patterning 50
of oxygen, incomplete reduction O2 led to the formation of OH radicals and to corrosion of
organic films.[287]
In the future, the spatial resolution and patterning density of the SDC could be significantly
increased by using nanopipettes instead of the micrometric PTFE capillaries employed in this
work. Strategies for the non-contact distance-control of the nanopipettes and formation of a
nanometric liquid meniscus on the sample surface have been described.[282,283,288,289] These
nanopipette based scanning probe methods, in conjunction with elaborated surface chemistry
for the immobilization of biomolecules[290] will create powerful electrochemical tools for the
fabrication and read-out of bionanoarrays.[1]

4 Results and Discussion
4.2 Nanoelectrode Fabrication and Characterization 51
4.2 Nanoelectrode Fabrication and Characterization
Carbon nanoelectrodes are fabricated according to a method first proposed by Takahashi et
al.[99] To create sharp, needle-type electrodes first nanopipettes are pulled from quartz glass
capillaries using a Sutter P-2000 laser puller. The size of the carbon nanoelectrodes is dictated
by the size of the capillary orifice, which along with the shape of the taper can be controlled by
adjusting the parameters of the puller. The outer radius of the glass insulator is as well dictated
by the pulling parameters and the specifications of the glassware used. The ratio between outer
radius of the whole probe and the inner radius (RG value) remains largely constant during the
pulling process. Using glassware with typical dimensions of 1.2 mm outer diameter and 0.9 mm
inner diameter, the ratio between outside radius and the active disk electrode after pyrolysis is
around 1.3, resulting in very small overall dimensions of the probe. To fabricate carbon
nanoelectrodes, conductive carbon is deposited inside the pulled quartz glass capillaries by
pyrolysis of a butane/propane mixture (Figure 20).
Figure 20. Laser-assisted pulling of quartz glass capillaries and subsequent pyrolysis of butane/propane gas in inert argon atmosphere inside the resulting nanopipettes yields carbon nanoelectrodes.
The pulled capillary is filled with the carbon precursor gas, inserted into a second unpulled
capillary that is filled with an inert argon atmosphere and heated to approx. 1200 °C using a
butane torch flame. As a result, the pyrolytic carbon clogs the nanopipette and forms a disk-
shaped electrode at the tip of the pipette. This fabrication procedure is a very fast and simple
route to carbon nanoelectrodes. Only inexpensive materials and equipment are necessary (see
experimental section) and electrodes are fabricated with nearly 100 % efficiency. The overall
time to produce one functional electrode ranges between 1 and 2 minutes. The nature of the
electrode materials was characterized by means of Raman spectroscopy. Because of the
difficulty to analyze nanometric sample areas, the spectra were not acquired from the
nanometric disk-shaped tip of the electrode but from the material deposited on the inside walls
of the nanopipettes after breaking open the capillary.[291] From the high intensity of the D band
relative to the G band as well as the absence of G’ and 2D bands it was concluded that the

4 Results and Discussion
4.2 Nanoelectrode Fabrication and Characterization 52
electrode material is graphite-like, however with a substantial amount of defects in the graphitic
structure.
-0.4 -0.2 0.0
-600
-400
-200
0
i /
pA
E / V vs. Ag/AgCl
-0.5 0.0
-5
0
Figure 21. Carbon nanoelectrodes are fabricated with tunable electrode radii. Cyclic voltammograms in 5 mM [Ru(NH3)6]Cl3, 0.1 M KCl for selected electrodes with radii of 2, 11, 68, 141, 271 nm calculated according to equation (1). Inset: Enlargement of the CV for the smallest electrode.
The quality and size of the electrochemically active part of the carbon electrodes is assessed
from cyclic voltammograms in ferrocenemethanol or [Ru(NH3)6]3+ (Figure 21). The flat current
plateaus in the cyclic voltammograms show that the reduction of [Ru(NH3)6]3+ is fast and only
limited by diffusional mass transport to the electrode. From these steady-state currents, the
radius of the disk-shaped electrodes is estimated according to equation (1).[292]
𝑖𝑠𝑠 = 4.64 𝑛 𝑐 𝐷 𝐹 𝑟 (1)
iss is the steady-state current, n the number of transferred electrons, c the concentration of redox
species in the bulk solution, D its diffusion coefficient, F the Faraday constant and r the radius of
the electrode. Equation (1) is valid for flat, disk-shaped electrodes surrounded by a coplanar
insulator and a RG value of 1.5.
Figure 22. SEM images show the high aspect ratio and disk-shaped geometry of carbon nanoelectrodes. Two different electrodes are shown. Electrochemically estimated radii were 60 nm (left electrode) and 4 nm (right electrode). Scale bars 200 nm.

4 Results and Discussion
4.2 Nanoelectrode Fabrication and Characterization 53
As the CVs for selected electrodes (Figure 21) show, the radius of the carbon nanoelectrodes can
be tuned in a range from a few nm to about 300 nm. A good correlation is observed comparing
the electrochemically estimated electrode radii with electrode dimensions observed in SEM
images of different electrodes (Figure 22). In addition, the SEM images show the pointy shape of
the electrodes that are surrounded by only a thin layer of insulating quartz glass, justifying the
assumptions made for the size determination according to equation (1). However, the image of a
small electrode exhibiting only an apparent electrochemically determined radius of 4 nm (right
image) demonstrate the limitations of SEM as a characterization tool for structures in the lower
nm regime. The resolution of the SEM is not sufficient to reliably determine the dimensions at
the apex of the nanoelectrode.
4 Results and Discussion
4.3 Amperometric Nanosensors in Biological Applications 54
4.3 Amperometric Nanosensors in Biological Applications
Experiments at brain slice samples were performed in collaboration with Paolo Actis, Sergiy Tokar
and Ainara López Córdoba, Imperial College London, who also provided cell samples. Parts of the
section were published in ref. [291]: “Actis, P.; Tokar, S.; Clausmeyer, J.; Babakinejad, B.;
Mikhaleva, S.; Cornut, R.; Takahashi, Y.; López Córdoba, A.; Novak, P.; Shevchuck, A. I.; Dougan, J.
A.; Kazarian, S. G.; Gorelkin, P. V.; Erofeev, A. S.; Yaminsky, I. V.; Unwin, P. R.; Schuhmann, W.;
Klenerman, D.; Rusakov, D. A.; Sviderskaya, E. V.; Korchev, Y. E.; ACS Nano 2014, 8, 875–884”.
Ainara López Córdoba, Imperial College London, provided DRG neurons. Macrophages were
cultured in collaboration with Melanie Mark and Miriam Marquitan, both Ruhr-Universität
Bochum. Experiments on macrophage cells were performed by Miriam Marquitan and partially
presented in her master thesis.[293] Parts of this section were published in ref. [294]: “Clausmeyer, J.;
Actis, P.; López Córdoba, A.; Korchev, Y.; Schuhmann, W.; Electrochem. Commun. 2014, 40, 28–
30.”
4.3.1 Platinized nanoelectrodes for oxygen measurements
Measuring the oxygen concentration around cells is useful to evaluate the respiratory activity
and the viability of cells.[295] The electrochemical detection of O2 requires electrochemical
sensors with a high sensitivity for the oxygen reduction reaction. However, it is known that
carbon electrode materials generally possess high overpotentials and slow electron transfer
rates for the reduction of O2. Thus, carbon nanoelectrodes are modified by depositing a small
amount of platinum on the electrode tip. It is important that the small overall dimensions of the
electrode are maintained. The cyclic voltammogram in a solution containing the platinum
precursor [PtCl6]2- shows a curve shape typical for a nucleation and growth mechanism (Figure
23 a): Only small cathodic currents are observed in the first cathodic sweep until the potential is
sufficiently negative to form Pt nuclei. In the subsequent anodic sweep larger cathodic currents
are observed, corresponding to the facilitated growth of Pt particles once nuclei are formed. In
addition, the enhanced current after deposition of a Pt particle may be attributed to the
reduction of protons. In the second cycle, more Pt is deposited on the electrode. To limit
uncontrolled growth of the Pt deposit, the potential is swept to only -0.5 V vs. Ag/AgCl/0.1 M Cl-.
As shown by cyclic voltammograms in air-saturated buffer solution containing
ferrocenemethanol as a redox probe (Figure 23 b), the amount of deposited Pt is sufficient to
reduce the overpotential for the oxygen reduction reaction while maintaining the small
electrode dimensions. The curve recorded after deposition of platinum shows a significantly
increased onset potential and higher currents for the oxygen reduction reaction whereas the
anodic diffusion-limited current corresponding to the oxidation of ferrocenemethanol remains
unchanged indicating mainly unchanged electrode size.
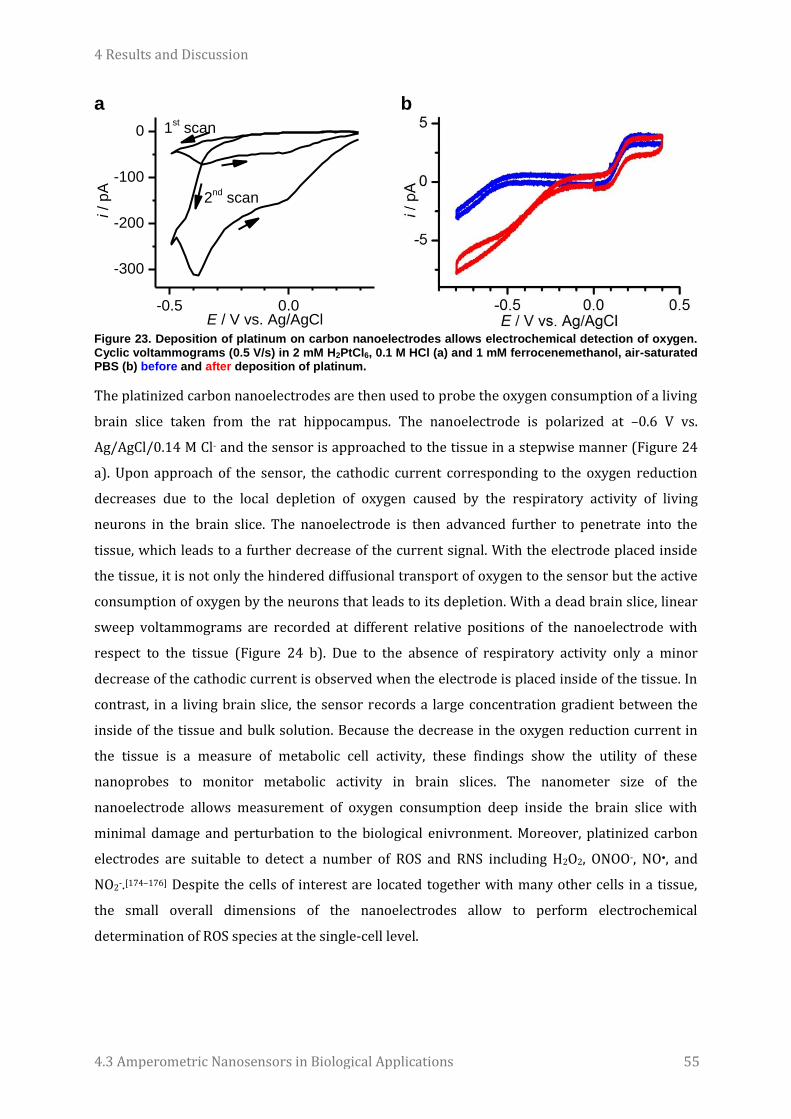
4 Results and Discussion
4.3 Amperometric Nanosensors in Biological Applications 55
a
-0.5 0.0
-300
-200
-100
0
2nd
scan
i /
pA
E / V vs. Ag/AgCl
1st scan
b
Figure 23. Deposition of platinum on carbon nanoelectrodes allows electrochemical detection of oxygen. Cyclic voltammograms (0.5 V/s) in 2 mM H2PtCl6, 0.1 M HCl (a) and 1 mM ferrocenemethanol, air-saturated PBS (b) before and after deposition of platinum.
The platinized carbon nanoelectrodes are then used to probe the oxygen consumption of a living
brain slice taken from the rat hippocampus. The nanoelectrode is polarized at –0.6 V vs.
Ag/AgCl/0.14 M Cl- and the sensor is approached to the tissue in a stepwise manner (Figure 24
a). Upon approach of the sensor, the cathodic current corresponding to the oxygen reduction
decreases due to the local depletion of oxygen caused by the respiratory activity of living
neurons in the brain slice. The nanoelectrode is then advanced further to penetrate into the
tissue, which leads to a further decrease of the current signal. With the electrode placed inside
the tissue, it is not only the hindered diffusional transport of oxygen to the sensor but the active
consumption of oxygen by the neurons that leads to its depletion. With a dead brain slice, linear
sweep voltammograms are recorded at different relative positions of the nanoelectrode with
respect to the tissue (Figure 24 b). Due to the absence of respiratory activity only a minor
decrease of the cathodic current is observed when the electrode is placed inside of the tissue. In
contrast, in a living brain slice, the sensor records a large concentration gradient between the
inside of the tissue and bulk solution. Because the decrease in the oxygen reduction current in
the tissue is a measure of metabolic cell activity, these findings show the utility of these
nanoprobes to monitor metabolic activity in brain slices. The nanometer size of the
nanoelectrode allows measurement of oxygen consumption deep inside the brain slice with
minimal damage and perturbation to the biological enivronment. Moreover, platinized carbon
electrodes are suitable to detect a number of ROS and RNS including H2O2, ONOO-, NO•, and
NO2-.[174–176] Despite the cells of interest are located together with many other cells in a tissue,
the small overall dimensions of the nanoelectrodes allow to perform electrochemical
determination of ROS species at the single-cell level.

4 Results and Discussion
4.3 Amperometric Nanosensors in Biological Applications 56
a
b
-0.5 0.0
-400
-300
-200
-100
0
-0.5 0.0
Live Brain Slice
i /
pA
E / V vs. Ag/AgCl
Dead Brain Slice
Figure 24. Oxygen consumption in a live tissue slice from rat hippocampus is monitored using platinized nanoelectrodes. Vertical oxygen concentration profile measured at -0.6 V vs. Ag/AgCl/0.14 Cl
- at different
positions of the nanoelectrode with respect to the tissue (a). Linear sweep voltammetry curves recorded with the nanoelectrode positioned 300 µm away, near the surface and 100 µm inside of the tissue in a dead brain slice and a living brain slice.
The nanoelectrode can be precisely inserted into an individual neuron within the brain slice to
monitor intracellular molecules. Cyclic voltammograms are measured continuously at 0.4 V/s as
the nanoelectrode is manually approached to the neuron (Figure 25 a). In the moment when the
cell membrane is penetrated, the stacked voltammograms show higher anodic currents at
potentials above 0.4 V. The anodic current is ascribed to the oxidation of various ROS and RNS
species, as observed by Amatore et al.[174–176] In another experiment, the nanoelectrode is
polarized at + 0.85 V vs. Ag/AgCl/0.14 M Cl-, a potential where all ROS/RNS species are oxidized,
and the amperometric current is monitored (Figure 25 b).
a
b
0 20 40 60
0.0
0.5
1.0
1.5
retraction
i /
pA
t / s
penetration
Figure 25. Platinized nanoelectrodes are inserted into individual neurons in a tissue to perform intracellu-lar electrochemical measurements. Stacked cyclic voltammograms with the voltammetric current repre-sented in false colors (a). The cell membrane is punctured after 25 s. Amperometric current at 0.85 V vs. Ag/AgCl/0.14 M Cl
- during penetration and retraction of the sensor (b).
In the moment of penetration, a current spike occurs, followed by a stable current plateau. After
withdrawal of the nanoprobe, the current jumps back to the initial baseline. The nearly constant
current recorded when the nanoelectrode is inside the cell corresponds to a steady flux of all
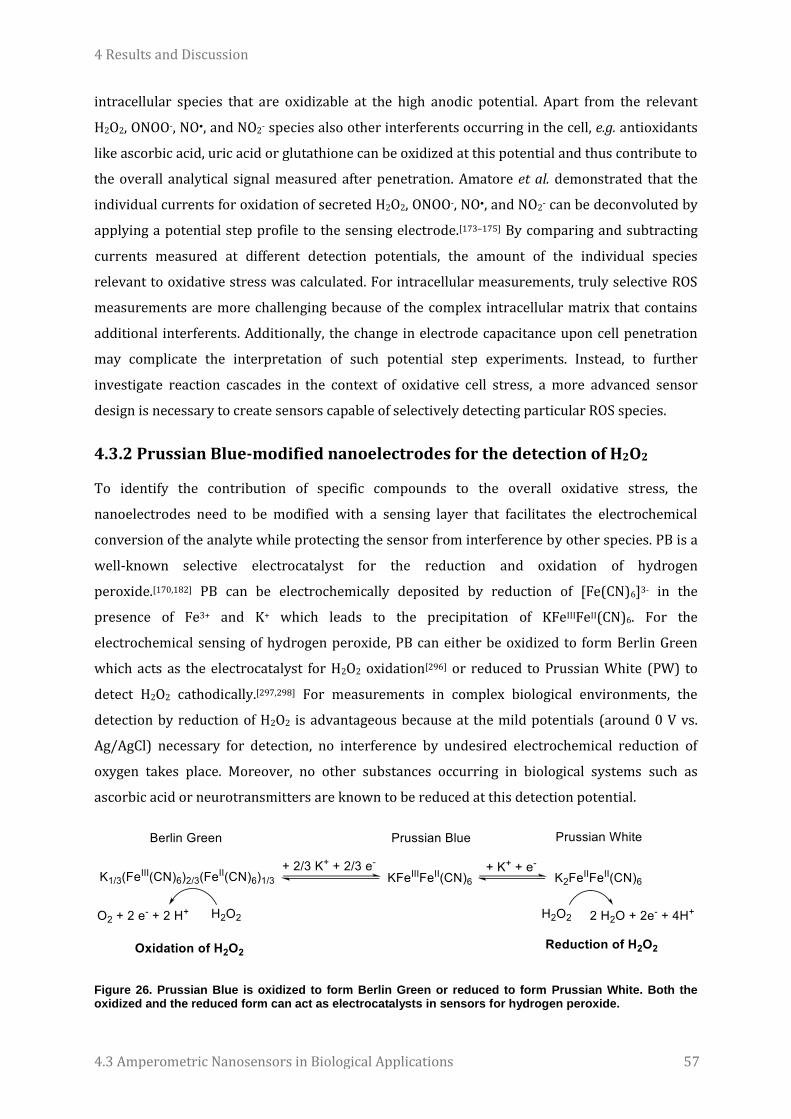
4 Results and Discussion
4.3 Amperometric Nanosensors in Biological Applications 57
intracellular species that are oxidizable at the high anodic potential. Apart from the relevant
H2O2, ONOO-, NO•, and NO2- species also other interferents occurring in the cell, e.g. antioxidants
like ascorbic acid, uric acid or glutathione can be oxidized at this potential and thus contribute to
the overall analytical signal measured after penetration. Amatore et al. demonstrated that the
individual currents for oxidation of secreted H2O2, ONOO-, NO•, and NO2- can be deconvoluted by
applying a potential step profile to the sensing electrode.[173–175] By comparing and subtracting
currents measured at different detection potentials, the amount of the individual species
relevant to oxidative stress was calculated. For intracellular measurements, truly selective ROS
measurements are more challenging because of the complex intracellular matrix that contains
additional interferents. Additionally, the change in electrode capacitance upon cell penetration
may complicate the interpretation of such potential step experiments. Instead, to further
investigate reaction cascades in the context of oxidative cell stress, a more advanced sensor
design is necessary to create sensors capable of selectively detecting particular ROS species.
4.3.2 Prussian Blue-modified nanoelectrodes for the detection of H2O2
To identify the contribution of specific compounds to the overall oxidative stress, the
nanoelectrodes need to be modified with a sensing layer that facilitates the electrochemical
conversion of the analyte while protecting the sensor from interference by other species. PB is a
well-known selective electrocatalyst for the reduction and oxidation of hydrogen
peroxide.[170,182] PB can be electrochemically deposited by reduction of [Fe(CN)6]3- in the
presence of Fe3+ and K+ which leads to the precipitation of KFeIIIFeII(CN)6. For the
electrochemical sensing of hydrogen peroxide, PB can either be oxidized to form Berlin Green
which acts as the electrocatalyst for H2O2 oxidation[296] or reduced to Prussian White (PW) to
detect H2O2 cathodically.[297,298] For measurements in complex biological environments, the
detection by reduction of H2O2 is advantageous because at the mild potentials (around 0 V vs.
Ag/AgCl) necessary for detection, no interference by undesired electrochemical reduction of
oxygen takes place. Moreover, no other substances occurring in biological systems such as
ascorbic acid or neurotransmitters are known to be reduced at this detection potential.
Figure 26. Prussian Blue is oxidized to form Berlin Green or reduced to form Prussian White. Both the oxidized and the reduced form can act as electrocatalysts in sensors for hydrogen peroxide.
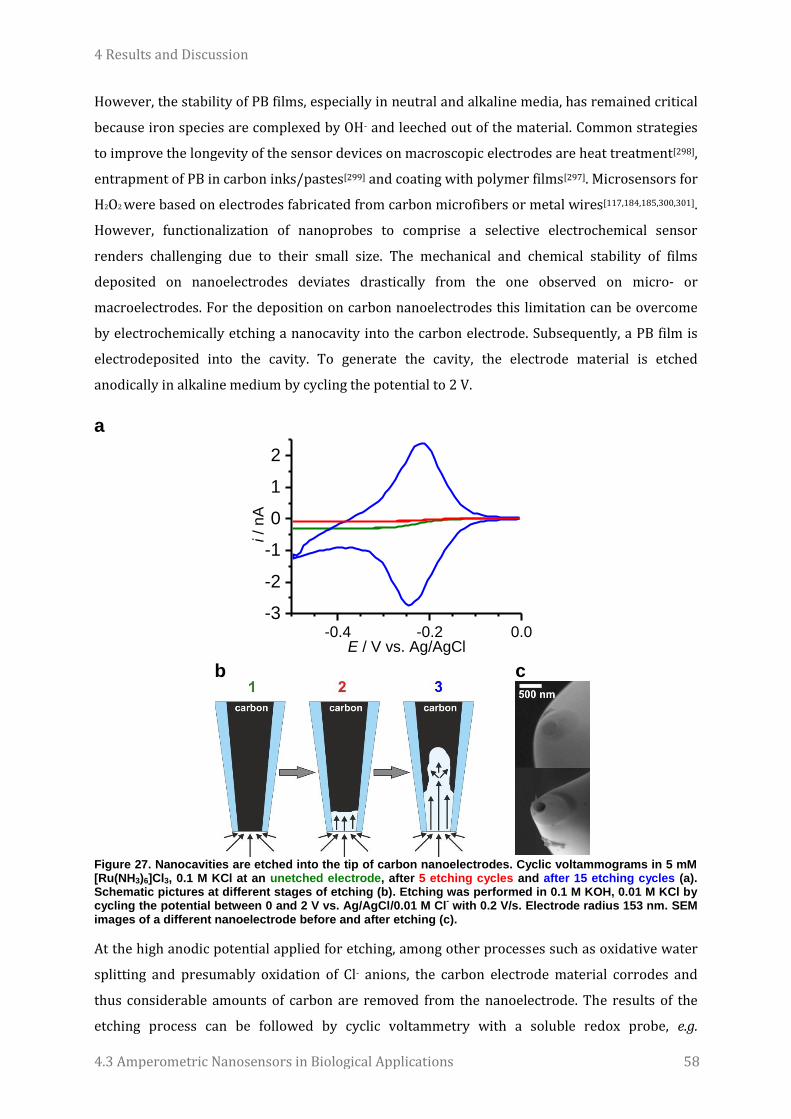
4 Results and Discussion
4.3 Amperometric Nanosensors in Biological Applications 58
However, the stability of PB films, especially in neutral and alkaline media, has remained critical
because iron species are complexed by OH- and leeched out of the material. Common strategies
to improve the longevity of the sensor devices on macroscopic electrodes are heat treatment[298],
entrapment of PB in carbon inks/pastes[299] and coating with polymer films[297]. Microsensors for
H2O2 were based on electrodes fabricated from carbon microfibers or metal wires[117,184,185,300,301].
However, functionalization of nanoprobes to comprise a selective electrochemical sensor
renders challenging due to their small size. The mechanical and chemical stability of films
deposited on nanoelectrodes deviates drastically from the one observed on micro- or
macroelectrodes. For the deposition on carbon nanoelectrodes this limitation can be overcome
by electrochemically etching a nanocavity into the carbon electrode. Subsequently, a PB film is
electrodeposited into the cavity. To generate the cavity, the electrode material is etched
anodically in alkaline medium by cycling the potential to 2 V.
a
-0.4 -0.2 0.0-3
-2
-1
0
1
2
i /
nA
E / V vs. Ag/AgCl
b
c
Figure 27. Nanocavities are etched into the tip of carbon nanoelectrodes. Cyclic voltammograms in 5 mM [Ru(NH3)6]Cl3, 0.1 M KCl at an unetched electrode, after 5 etching cycles and after 15 etching cycles (a). Schematic pictures at different stages of etching (b). Etching was performed in 0.1 M KOH, 0.01 M KCl by cycling the potential between 0 and 2 V vs. Ag/AgCl/0.01 M Cl
- with 0.2 V/s. Electrode radius 153 nm. SEM
images of a different nanoelectrode before and after etching (c).
At the high anodic potential applied for etching, among other processes such as oxidative water
splitting and presumably oxidation of Cl- anions, the carbon electrode material corrodes and
thus considerable amounts of carbon are removed from the nanoelectrode. The results of the
etching process can be followed by cyclic voltammetry with a soluble redox probe, e.g.

4 Results and Discussion
4.3 Amperometric Nanosensors in Biological Applications 59
[Ru(NH3)6]3+ (Figure 27 a). Demonstrated on an electrode with a radius of 153 nm, the initial
steady-state cathodic current for [Ru(NH3)6]3+ reduction decreases after applying 5 etching
cycles to the electrode. This behavior was theoretically predicted and experimentally observed
by Sun and Mirkin.[302] At a recessed microelectrode, the diffusion-limited steady-state currents
are decreased because the unidirectional diffusion inside of the recessed electrode is
substantially slower than the radial diffusion normally observed at planar micro- or
nanoelectrodes (Figure 27 b). Moreover, based on numerical solutions of the mass transport
laws, the depth of the recessed electrode can be estimated from the diminished steady-state
current. For the electrode shown in Figure 27, the steady-state current after 5 etching cycles
decreased to 30 % of the initial value, corresponding to a recess depth of ca. two times the
electrode radius, i.e. about 500 nm.[302] For all recessed electrodes made in this fashion, the
steady-state current after etching was at least diminished by 50 %, corresponding to a minimum
recess depth of one electrode radius. After longer periods of etching, a different behavior is
observed. The cyclic voltammograms for the electrodes after 15 etching cycles show nearly
symmetrical oxidation and reduction peaks with a small peak separation of 36 mV, centered
around the formal potential for the reduction of [Ru(NH3)6]3+. This observation indicates the
formation of a nanocavity within the carbon nanoelectrode which is surrounded by quartz glass.
The nanocavity electrode has structural similarities with a leaking thin layer cell:[303] Upon
sweeping the potential, the complete amount of soluble redox mediator inside the cavity is
oxidized/reduced leading to a depletion of the current after full conversion and thus, the peak
shape of the curve. The formation of a cavity is confirmed from scanning electron microscopy
(SEM) images of electrodes before and after etching. After etching, the contrast between the
cylindrical hole and the glass sheath seems higher than the contrast between the carbon disk
and the glass, suggesting the successful removal of carbon material.
Prussian Blue is then deposited electrochemically into the recessed electrode or nanocavity by
sweeping the potential to -0.4 V in the presence of [Fe(CN)6]3- and Fe3+ (Figure 28). When
Prussian Blue is deposited on an unetched, coplanar electrode, the cathodic current plateau
corresponding to the reduction of [Fe(CN)6]3- and Fe3+ gradually increases from cycle to cycle
(Figure 28 a). This finding is attributed to a growth of the Prussian Blue film that gradually
increases the effective surface area of the electrode and thus leads to an increasing rate of
deposition. After deposition the Prussian Blue film is electrochemically activated by extensive
cycling in acidic solution containing K+ ions. During this activation process K+ is incorporated
into the crystal lattice which increases the electrochemical reversibility and the stability of the
material.[182] However, the Prussian Blue film quickly dissolves or detaches during the activation
when Prussian Blue is deposited on an unetched nanoelectrode (Figure 28 b). The CV shows the
current peaks corresponding to the redox cycling between the oxidized Prussian Blue form and

4 Results and Discussion
4.3 Amperometric Nanosensors in Biological Applications 60
the reduced Prussian White. The decrease of the redox peaks indicates the loss of Prussian Blue
from the electrode. After typically around 100 activation cycles, the film is completely removed
from the electrode.
a
-0.5 0.0 0.5
-200
-100
0
E / V vs. Ag/AgCl
i /
pA
b
-0.5 0.0 0.5
-200
-100
0
100
140
50
i /
pA
E / V vs. Ag/AgCl
1
c
-0.5 0.0 0.5
-200
-100
0
100
i /
pA
E / V vs. Ag/AgCl
d
-0.5 0.0 0.5
-200
-100
0
100
200
11050
E / V vs. Ag/AgCl
i /
pA
1
e
-0.5 0.0 0.5
-4
-2
0
2
4
i /
nA
E / V vs. Ag/AgCl
f
-0.5 0.0 0.5
-2
0
2
140
50
i /
nA
E / V vs. Ag/AgCl
1
Figure 28. Deposition (a, c, e) and electrochemical activation (b, d, f) of Prussian Blue on an unetched (a, b), slightly recessed (c, d) and nanocavity electrode (e, f). Deposition in 1 mM K3[Fe(CN)6],
1 mM FeCl3, 0.1
M HCl, 0.1 M KCl at 0.2 V/s. Initial electrode sizes r = 144 nm (a, b), r = 114 nm (c, d) and 152 nm (e, f).

4 Results and Discussion
4.3 Amperometric Nanosensors in Biological Applications 61
In contrast, when Prussian Blue is deposited into a slightly recessed nanoelectrode generated by
electrochemical etching, the film remains largely stable during the electrochemical activation
(Figure 28 d). The deposition of PB in the recessed nanoelectrode (Figure 28 c) features a
current plateau for the reduction of [Fe(CN)6]3- and Fe3+ that first increases from cycle to cycle
and then reaches a stable value in the last deposition cycles. Presumably, the growth of the film
is self-limited when the film thickness increases and prevents further reduction of [Fe(CN)6]3-
and Fe3+. During the activation step (Figure 28 d), the intensity of the PB/PW redox peaks
decreases during the first cycles but stabilizes after about 100 cycles. The initial decrease is
attributed to a detachment of excess material from the electrode. However, the deposition of PB
inside the recession of the etched nanoelectrode drastically increases the stability of PB. The PB
is trapped inside the recession which prevents its dissolution or mechanical detachment upon
redox cycling. The observed formal redox potential of the PB/PW transition is 0.42 V vs. SHE.
The amount of PB is increased when the material is deposited inside a deep, etched nanocavity
in the carbon nanoelectrode (Figure 28 e and f). During deposition the CV shows PB/PW redox
peaks with increasing intensity. In the activation step, the peak intensities are largely unchanged
during potential cycling and show a typical value of 2 nA as opposed to 200 pA observed for
deposition in a slightly recessed electrode. The decrease of the peak separation ΔEp observed in
Figure 28 d and f indicates the improvement of electron transfer rate due to the electrochemical
activation.
For the amperometric detection of H2O2 at PB-modified electrodes the composition of the
surrounding medium influences the performance of the H2O2 sensor. As the reduction of PB to
PW involves the incorporation of K+ into the sensing film, the effect of the K+ concentration on
the reduction of PB was tested. Figure 29 a displays cyclic voltammograms recorded in
physiological buffer solution (pH 7.4) with varying concentrations of K+. The redox peaks for the
reduction of PB and oxidation of PW shift towards more anodic potentials when the K+
concentration is gradually increased from 4 mM to 894 mM. In addition, peak sharpening is
observed at higher K+ concentration. The formal reduction potential for the PB/PW is extracted
from the CVs according to E = ½ (Ep,a + Ep,c), with Ep,a and Ep,c the anodic and cathodic peak
potential, respectively. As expected from the Nernst equation, the formal potential depends
linearly on the logarithm of the K+ concentration (Figure 29 b). However, a linear fit of the
experimental data shows a slope of 80 mV dec-1 which is higher than the value of 59 mV
expected from the Nernst equation. Most likely, the deviation from the theoretical value is due to
non-unity stoichiometric coefficients for the involvement of electrons and K+ during the
reduction of PB to PW (see also Figure 26). The fitted intercept of 181 mV vs. Ag/AgCl is an
approximation of the standard reduction potential of PB. Due to the dependence of the peak
potentials on the K+ concentration the PB-modified nanoelectrodes are suited as pseudo-
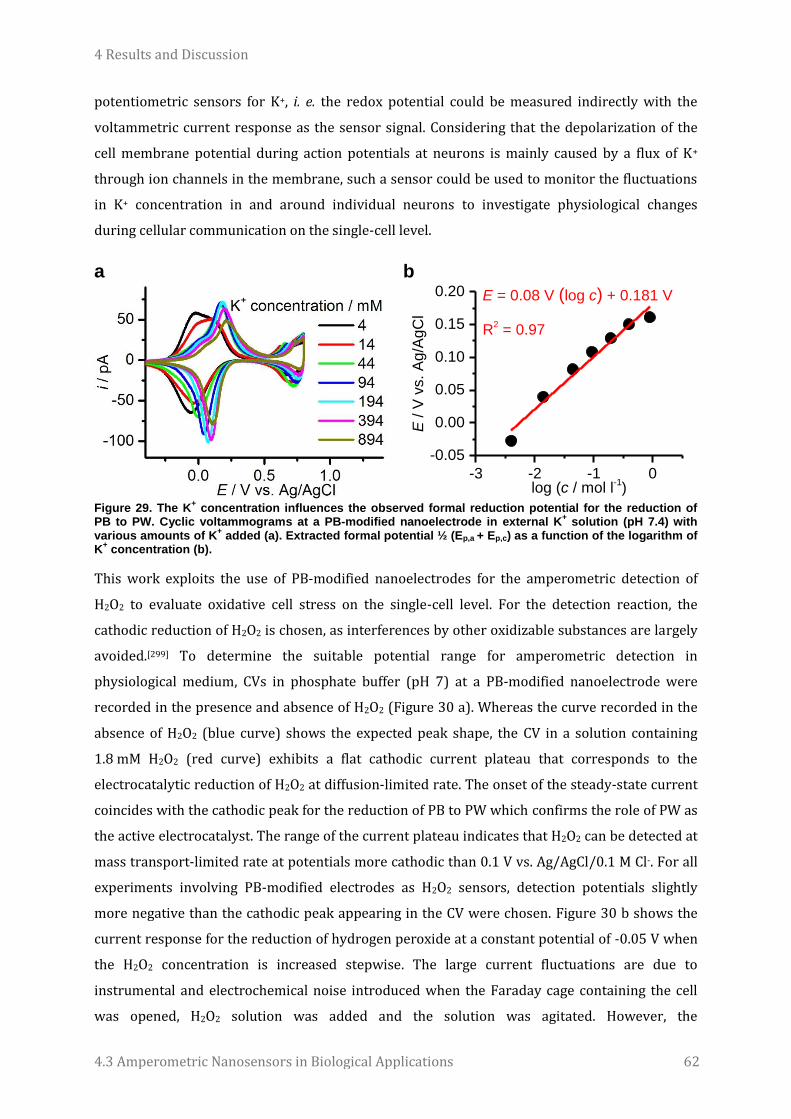
4 Results and Discussion
4.3 Amperometric Nanosensors in Biological Applications 62
potentiometric sensors for K+, i. e. the redox potential could be measured indirectly with the
voltammetric current response as the sensor signal. Considering that the depolarization of the
cell membrane potential during action potentials at neurons is mainly caused by a flux of K+
through ion channels in the membrane, such a sensor could be used to monitor the fluctuations
in K+ concentration in and around individual neurons to investigate physiological changes
during cellular communication on the single-cell level.
a
b
-3 -2 -1 0
-0.05
0.00
0.05
0.10
0.15
0.20
E /
V v
s.
Ag
/Ag
Cl
log (c / mol l-1)
E = 0.08 V (log c) + 0.181 V
R2 = 0.97
Figure 29. The K
+ concentration influences the observed formal reduction potential for the reduction of
PB to PW. Cyclic voltammograms at a PB-modified nanoelectrode in external K+ solution (pH 7.4) with
various amounts of K+ added (a). Extracted formal potential ½ (Ep,a + Ep,c) as a function of the logarithm of
K+ concentration (b).
This work exploits the use of PB-modified nanoelectrodes for the amperometric detection of
H2O2 to evaluate oxidative cell stress on the single-cell level. For the detection reaction, the
cathodic reduction of H2O2 is chosen, as interferences by other oxidizable substances are largely
avoided.[299] To determine the suitable potential range for amperometric detection in
physiological medium, CVs in phosphate buffer (pH 7) at a PB-modified nanoelectrode were
recorded in the presence and absence of H2O2 (Figure 30 a). Whereas the curve recorded in the
absence of H2O2 (blue curve) shows the expected peak shape, the CV in a solution containing
1.8 mM H2O2 (red curve) exhibits a flat cathodic current plateau that corresponds to the
electrocatalytic reduction of H2O2 at diffusion-limited rate. The onset of the steady-state current
coincides with the cathodic peak for the reduction of PB to PW which confirms the role of PW as
the active electrocatalyst. The range of the current plateau indicates that H2O2 can be detected at
mass transport-limited rate at potentials more cathodic than 0.1 V vs. Ag/AgCl/0.1 M Cl-. For all
experiments involving PB-modified electrodes as H2O2 sensors, detection potentials slightly
more negative than the cathodic peak appearing in the CV were chosen. Figure 30 b shows the
current response for the reduction of hydrogen peroxide at a constant potential of -0.05 V when
the H2O2 concentration is increased stepwise. The large current fluctuations are due to
instrumental and electrochemical noise introduced when the Faraday cage containing the cell
was opened, H2O2 solution was added and the solution was agitated. However, the

4 Results and Discussion
4.3 Amperometric Nanosensors in Biological Applications 63
chronoamperogram exhibits stable current plateaus with increasing intensity as more H2O2 is
added. The calibration curve of the current values vs. the H2O2 concentration exhibits a linear
trend for concentrations between 10 µM and 3 mM (Figure 30 c). The limit of detection (LOD),
defined as the analyte concentration at which the sensor response exceeds 3 standard deviations
of the sensor response in the absence of analyte, is typically 10 µM and is largely dictated by the
instrumental noise when measuring small currents below the pA range. The root-mean-square
noise for the shown measurements was typically 50-100 fA whereas the sensor response at the
LOD was a few hundreds of fA.
a
-0.2 0.0 0.2 0.4
-10
0
10
i /
pA
E / V vs. Ag/AgCl
b
500 1000 1500 2000
-150
-100
-50
0
i /
pA
t / s
c
0.0 0.5 1.0 1.5 2.0 2.5 3.0
0
50
100
150
200
-i /
pA
c / mmol l-1
0.01 0.1 1
1
10
100
Figure 30. PB-modified nanoelectrodes detect H2O2 with high sensitivity. CVs in 0.05 M phosphate buffer pH 7.0, 0.1 M KCl before and after addition of 1.8 mM H2O2 (a). Scan rate 0.05 V/s. Amperometric detection of H2O2 at -0.05 V vs. Ag/AgCl/0.1 M Cl
- upon stepwise addition of H2O2 standards (final concentrations 1
µM to 2.8 mM) (b). Calibration of the H2O2 reduction currents from (b) with respect to the H2O2 concentration (c). A logarithmic representation is shown in the inset. Recessed nanoelectrode with r = 108 nm in (a) and nanocavity electrode with r = 152 nm (b).
The concentration of H2O2 in cells under normal conditions is estimated below 1 µM.[169]
However, oxidative stress is associated with H2O2 levels in excess of 10 µM. Especially when
considering that most previous measurements determined the H2O2 concentration as an average
over extended periods of time, the transient H2O2 levels during oxidative bursts might be higher.
Hence, PB-modified nanosensors are sufficiently sensitive to detect H2O2 in oxidative stress
situations or during stimulated H2O2 production.[173,175] The upper detection limit is limited by
the stability of the sensor. At H2O2 concentrations substantially higher than 3 mM the sensor

4 Results and Discussion
4.3 Amperometric Nanosensors in Biological Applications 64
response rapidly decreases due to dissolution of the PB film in the presence of excess amounts of
H2O2. To compare the sensitivity of the sensors, the slope in the linear range of the calibration
curves was normalized by the surface area of the active nanoelectrode. For electrodes where
Prussian Blue was deposited into a slight recession after gentle etching (see also Figure 27 and
Figure 28) the average sensitivity for H2O2 is 13 ± 8 A mol-1 l cm-2. Sensors where PB was
deposited in deep nanocavities showed significantly higher sensitivity of 50 ± 30 A mol-1 l cm-2.
Because the latter sensors exhibit thicker PB films, the amount of the PB seems to be a critical
parameter for the performance of the sensors. Compared to previous studies reporting PB-based
H2O2 determination the present sensor has the smallest dimensions and one of the highest
values for the sensitivity.[182,304] However, the etching creates a channel inside the glass sheath
that has to be passed by the analyte before reaching the PB film inside the cavity, resulting in a
loss of sensitivity and increase of the response time due to slow planar diffusion inside the
cavity. As predicted for recessed electrodes[302] the steady-state currents observed for H2O2
reduction are only slightly diminished with respect to the maximum theoretical value expected
for ideal planar disk-shaped geometry. Taking the average sensitivity of 50 ± 30 A mol-1 l cm-2
and a typical electrode radius of 150 nm, the resulting calculated current is only three times
smaller than the ideal value obtained from the equation iss = 4.64∙r∙F∙c∙D (with
D = 1.7∙10−5 cm2 s−1).[294,305]
a
0 5 10
0.0
0.5
1.0
i /
i 0
t / h
b
Figure 31. Long-term stability of H2O2 sensors during constant detection in 2.9 mM (a) and 0.2 mM H2O2
(b). Currents for reduction H2O2 normalized by initial currents at t = 0 for PB deposited on a slightly recessed nanoelectrode and in a nanocavity electrode. Detection in 0.05 M Phosphate buffer pH 7.0, 0.1 M KCl at -0.05 V.
As the chemical stability of PB in neutral or alkaline solution has proven to be a critical
parameter for many sensor designs, the long-term stability for different sensors and different
conditions was tested at constant operation of the sensors. At neutral pH and in the presence of
millimolar concentrations of H2O2, the initial sensor response rapidly decreases for both slightly
recessed and nanocavity electrodes (Figure 31 a). After 5 hours of operation, only 50 % and
30 % of the initial current signal are retained for recessed and nanocavity electrodes,
4 Results and Discussion
4.3 Amperometric Nanosensors in Biological Applications 65
respectively. When less H2O2 is present (200 µM), both sensor types produce a stable current
signal during the first hour and still exhibit 80-90 % of sensitivity after 5 hours of constant H2O2
reduction. The stability is sufficient for typical experiments aiming at the detection of H2O2 in or
around single cells. These experiments have a duration of typically less than 2 hours and do not
require constant analyte detection during the entire experiment.
4.3.3 H2O2 measurements at single living cells
PB-modified carbon nanoelectrodes are suitable to target single cells to evaluate the role of H2O2
in the context of oxidative cell stress. To demonstrate the feasibility of intracellular H2O2
detection, dorsal root ganglia (DRG neurons) were used as a cell model. Prior to the cell
experiments, a one- or two-point calibration for H2O2 was performed in the cell medium
(external K+ solution). Since the linearity of the calibration curves in a wide concentration range
was already demonstrated (Figure 30), this quick calibration method is a good compromise
between the quantification of H2O2 and the overall duration of the experiments using living cells.
To measure the intracellular H2O2 concentration, the PB-modified sensors were mounted on a
micromanipulator in an angle of about 45° with respect to the Petri dish containing the cultured
cells in buffer solution. Using an optical microscope, the sensors were advanced to single
neurons under optical control until touching or nearly touching the cell surface. Then, the sensor
was moved 1 µm along the angular direction to impale the cell membrane while simultaneously
monitoring the current with a suitable detection potential applied to the electrode. Figure 32 a
shows optical micrographs of the nanosensors and a cell before and after successful penetration.
Due to the small overall size of the sensors, cell impalement was achieved with nearly 100 %
efficiency. After retraction of the sensor, the morphology of the cell is unchanged, indicating that
the cells are still alive after the penetration experiments. In control experiments bare carbon
nanoelectrodes without PB modification were inserted into cells while applying different
detection potentials (Figure 32 b, c). Irrespective of the applied potentials (ranging from -0.15 V
to + 0.1 V) no current signals are observed upon cell impalement. In contrast, large cathodic
current spikes with a duration of about 2 seconds are observed for inserting PB-modified
nanosensors into cells (Figure 32 d, e). Assuming that the observed current is only due to
electrocatalytic conversion of H2O2, the hydrogen peroxide concentration in the moment of
penetration reaches a few hundreds of µM or even the millimolar range. Two distinct typical
shapes for the chronoamperograms are observed. In some experiments, a large cathodic current
spike is followed by an anodic signal (Figure 21 d). The origin of the latter signals is unknown. At
the applied potential of -0.05 V no anodic oxidation of H2O2 at PB-modified electrodes is known.
Another typical curve shape does not show such anodic signal (Figure 32 e). Instead, the initial
cathodic current peak slowly decays and approaches 0.
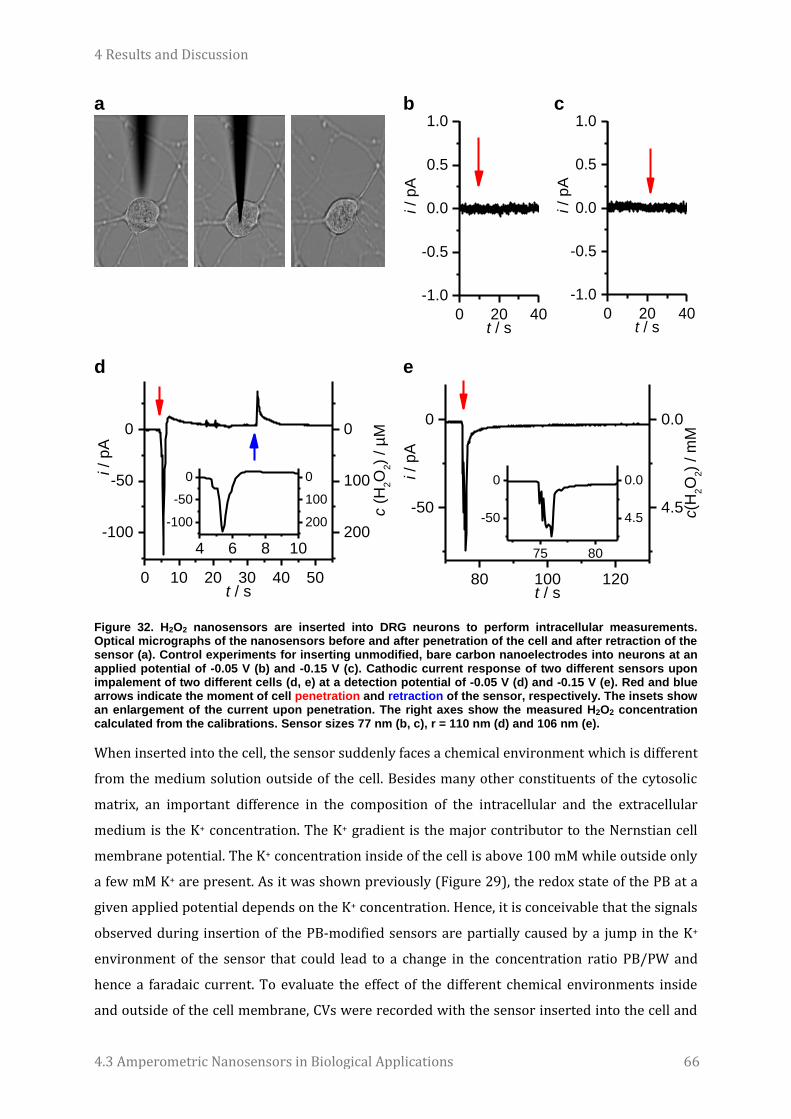
4 Results and Discussion
4.3 Amperometric Nanosensors in Biological Applications 66
a
b
0 20 40
-1.0
-0.5
0.0
0.5
1.0
i /
pA
t / s
c
0 20 40
-1.0
-0.5
0.0
0.5
1.0
i /
pA
t / s
d
0 10 20 30 40 50
-100
-50
0
200
100
0
c (
H2O
2)
/ µ
M
i /
pA
t / s
4 6 8 10
-100
-50
0
200
100
0
e
80 100 120
-50
0
4.5
0.0
c(H
2O
2)
/ m
M
i /
pA
t / s
75 80
-50
0
4.5
0.0
Figure 32. H2O2 nanosensors are inserted into DRG neurons to perform intracellular measurements. Optical micrographs of the nanosensors before and after penetration of the cell and after retraction of the sensor (a). Control experiments for inserting unmodified, bare carbon nanoelectrodes into neurons at an applied potential of -0.05 V (b) and -0.15 V (c). Cathodic current response of two different sensors upon impalement of two different cells (d, e) at a detection potential of -0.05 V (d) and -0.15 V (e). Red and blue arrows indicate the moment of cell penetration and retraction of the sensor, respectively. The insets show an enlargement of the current upon penetration. The right axes show the measured H2O2 concentration calculated from the calibrations. Sensor sizes 77 nm (b, c), r = 110 nm (d) and 106 nm (e).
When inserted into the cell, the sensor suddenly faces a chemical environment which is different
from the medium solution outside of the cell. Besides many other constituents of the cytosolic
matrix, an important difference in the composition of the intracellular and the extracellular
medium is the K+ concentration. The K+ gradient is the major contributor to the Nernstian cell
membrane potential. The K+ concentration inside of the cell is above 100 mM while outside only
a few mM K+ are present. As it was shown previously (Figure 29), the redox state of the PB at a
given applied potential depends on the K+ concentration. Hence, it is conceivable that the signals
observed during insertion of the PB-modified sensors are partially caused by a jump in the K+
environment of the sensor that could lead to a change in the concentration ratio PB/PW and
hence a faradaic current. To evaluate the effect of the different chemical environments inside
and outside of the cell membrane, CVs were recorded with the sensor inserted into the cell and
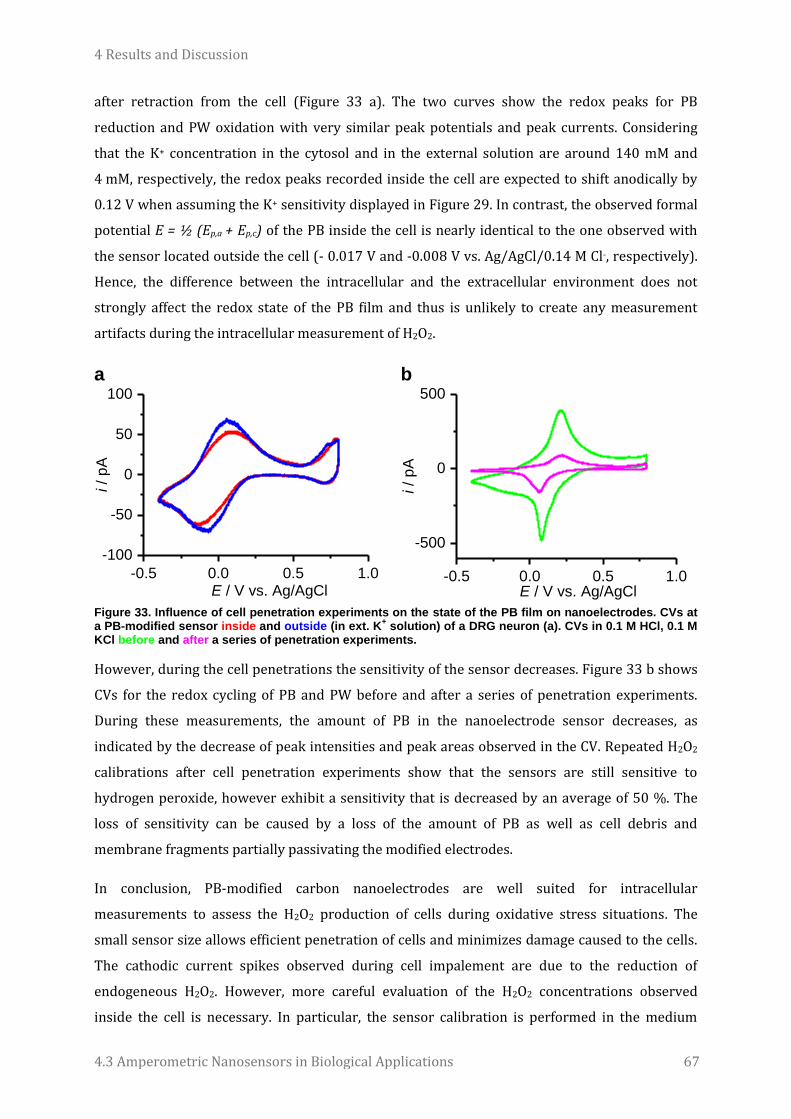
4 Results and Discussion
4.3 Amperometric Nanosensors in Biological Applications 67
after retraction from the cell (Figure 33 a). The two curves show the redox peaks for PB
reduction and PW oxidation with very similar peak potentials and peak currents. Considering
that the K+ concentration in the cytosol and in the external solution are around 140 mM and
4 mM, respectively, the redox peaks recorded inside the cell are expected to shift anodically by
0.12 V when assuming the K+ sensitivity displayed in Figure 29. In contrast, the observed formal
potential E = ½ (Ep,a + Ep,c) of the PB inside the cell is nearly identical to the one observed with
the sensor located outside the cell (- 0.017 V and -0.008 V vs. Ag/AgCl/0.14 M Cl-, respectively).
Hence, the difference between the intracellular and the extracellular environment does not
strongly affect the redox state of the PB film and thus is unlikely to create any measurement
artifacts during the intracellular measurement of H2O2.
a
-0.5 0.0 0.5 1.0
-100
-50
0
50
100
i /
pA
E / V vs. Ag/AgCl
b
-0.5 0.0 0.5 1.0
-500
0
500i /
pA
E / V vs. Ag/AgCl
Figure 33. Influence of cell penetration experiments on the state of the PB film on nanoelectrodes. CVs at a PB-modified sensor inside and outside (in ext. K
+ solution) of a DRG neuron (a). CVs in 0.1 M HCl, 0.1 M
KCl before and after a series of penetration experiments.
However, during the cell penetrations the sensitivity of the sensor decreases. Figure 33 b shows
CVs for the redox cycling of PB and PW before and after a series of penetration experiments.
During these measurements, the amount of PB in the nanoelectrode sensor decreases, as
indicated by the decrease of peak intensities and peak areas observed in the CV. Repeated H2O2
calibrations after cell penetration experiments show that the sensors are still sensitive to
hydrogen peroxide, however exhibit a sensitivity that is decreased by an average of 50 %. The
loss of sensitivity can be caused by a loss of the amount of PB as well as cell debris and
membrane fragments partially passivating the modified electrodes.
In conclusion, PB-modified carbon nanoelectrodes are well suited for intracellular
measurements to assess the H2O2 production of cells during oxidative stress situations. The
small sensor size allows efficient penetration of cells and minimizes damage caused to the cells.
The cathodic current spikes observed during cell impalement are due to the reduction of
endogeneous H2O2. However, more careful evaluation of the H2O2 concentrations observed
inside the cell is necessary. In particular, the sensor calibration is performed in the medium

4 Results and Discussion
4.3 Amperometric Nanosensors in Biological Applications 68
outside of the cell. Thus, the validity of the calibration for measurements in the cytosol, which
has a different and very complex composition, has to be assessed critically. Because it is difficult
to mimic the complex cytosolic matrix artificially, the focus of future investigations should be on
methods aiming at a sensor calibration inside the living cell. In the presented experiments,
surprisingly high transient H2O2 concentrations up to the millimolar range are observed
immediately after cell penetration. Despite the sensors have relatively small dimensions, it is
conceivable that these signals are at least partially caused by the mechanical disturbance caused
by puncture of the cell membrane. This behavior was – despite using larger electrochemical
probes – observed previously.[176] Thus, more thorough investigation is necessary to link the
measured H2O2 production to specific physiological conditions that favor the production of ROS
species. To give unambiguous evidence for the correlation between observed sensor signals and
the cellular mechanisms to produce ROS and H2O2 in particular, oxidative cell stress can be
induced artificially using a number of reagents or the cells’ natural protection mechanisms can
be specifically inhibited. Macrophages are known to kill bacteria as part of the immune response
to pathogens. Bacteria are engulfed into phagosomes and attacked by excess amounts of O2- and
NO which are released into the phagosomes by activity of NADPH oxidase and nitric oxide
synthase.[157] Murine macrophages have been previously used to study ROS and RNS production
by means of voltammetric methods.[176] To stimulate the macrophage cells, lipopolysaccharides
from E. coli (LPS) have been used previously.[173,175] Macrophages recognize the
lipopolysaccharide fragments as a potential pathogen and start an inflammatory response
primarily by increased expression of NOS which leads to enhanced production of NO.[306]
However, LPS stimulation also leads to an increased release of superoxide which is closely
related to H2O2 levels via the activity of superoxide dismutase (Figure 5). [160,307]
a
0 50 100
-8
-6
-4
-2
0
2
134
101
67
34
0
-34
c(H
2O
2)
/ µ
M
i /
pA
t / s
b
0 100 200
-5
0
5
10
84
0
-84
-167
c (
H2O
2)
/ µ
M
i /
pA
t / s Figure 34. Immunostimulated macrophages release H2O2 into the extracellular environment. Cell penetration experiments after stimulation with 5 µg/ml LPS. The arrows indicate the moments when the sensor is positioned close to the cell, penetration and retraction of the sensor.
Hence, macrophages were incubated with LPS and PB-modified nanoelectrodes were used to
evaluate the increased production of H2O2. Figure 34 shows two typical current-time curves
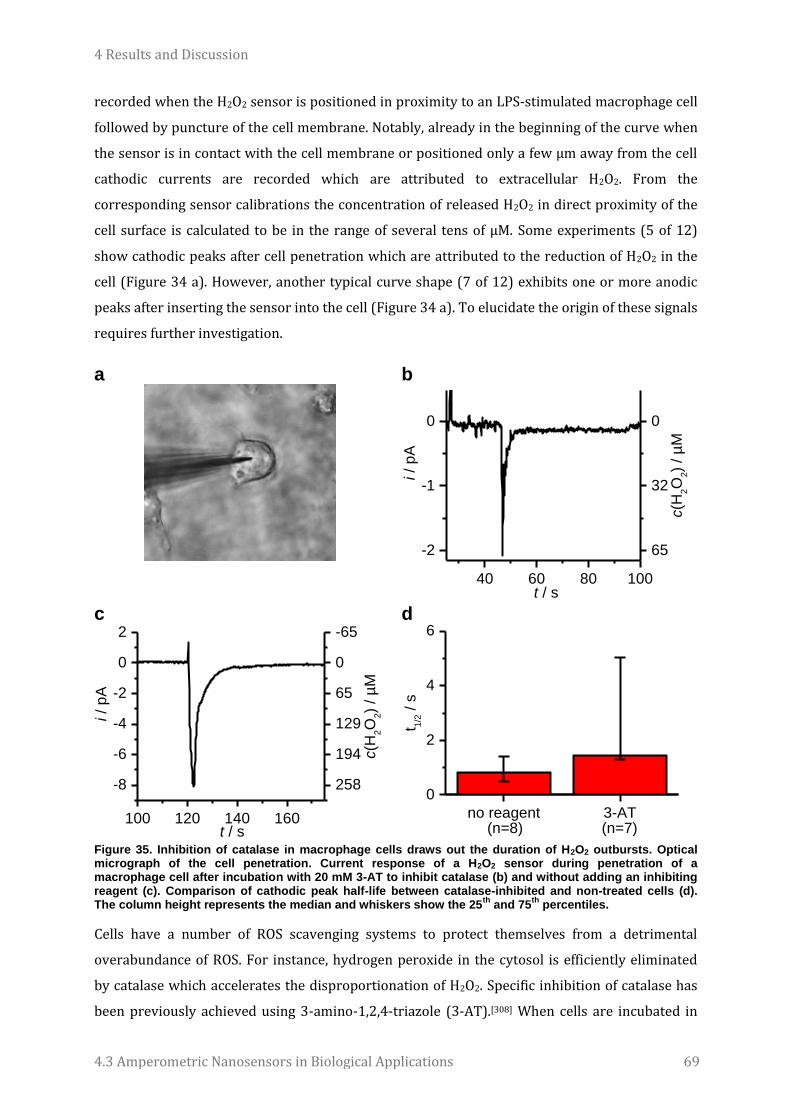
4 Results and Discussion
4.3 Amperometric Nanosensors in Biological Applications 69
recorded when the H2O2 sensor is positioned in proximity to an LPS-stimulated macrophage cell
followed by puncture of the cell membrane. Notably, already in the beginning of the curve when
the sensor is in contact with the cell membrane or positioned only a few µm away from the cell
cathodic currents are recorded which are attributed to extracellular H2O2. From the
corresponding sensor calibrations the concentration of released H2O2 in direct proximity of the
cell surface is calculated to be in the range of several tens of µM. Some experiments (5 of 12)
show cathodic peaks after cell penetration which are attributed to the reduction of H2O2 in the
cell (Figure 34 a). However, another typical curve shape (7 of 12) exhibits one or more anodic
peaks after inserting the sensor into the cell (Figure 34 a). To elucidate the origin of these signals
requires further investigation.
a
b
40 60 80 100
-2
-1
0
65
32
0
c(H
2O
2)
/ µ
M
i /
pA
t / s
c
100 120 140 160
-8
-6
-4
-2
0
2
258
194
129
65
0
-65
c(H
2O
2)
/ µ
M
i /
pA
t / s
d
no reagent 3-AT
0
2
4
6
(n=7)
t 1/2 /
s
(n=8) Figure 35. Inhibition of catalase in macrophage cells draws out the duration of H2O2 outbursts. Optical micrograph of the cell penetration. Current response of a H2O2 sensor during penetration of a macrophage cell after incubation with 20 mM 3-AT to inhibit catalase (b) and without adding an inhibiting reagent (c). Comparison of cathodic peak half-life between catalase-inhibited and non-treated cells (d). The column height represents the median and whiskers show the 25
th and 75
th percentiles.
Cells have a number of ROS scavenging systems to protect themselves from a detrimental
overabundance of ROS. For instance, hydrogen peroxide in the cytosol is efficiently eliminated
by catalase which accelerates the disproportionation of H2O2. Specific inhibition of catalase has
been previously achieved using 3-amino-1,2,4-triazole (3-AT).[308] When cells are incubated in
4 Results and Discussion
4.3 Amperometric Nanosensors in Biological Applications 70
presence of millimolar concentrations of 3-AT, the inhibitor covalently binds to catalase and
leads to an accumulation of H2O2 and consequently modifications of proteins, lipids and DNA in
the cell.[148,149] Thus, 3-AT can be used to evaluate the cell’s natural protection mechanisms
against excess amounts of H2O2. Also, for a more thorough assessment of the sensor response
during ROS production by the cell, macrophage cells were chosen as the cell model. Figure 35
shows the results of intracellular H2O2 measurements in cultured murine macrophages. The
current-time traces show similar shapes as seen for DRG neurons. In the moment of cell
impalement, a cathodic current spike is observed, followed by a decay of the current signal
(Figure 35 b). After addition of 3-AT to the cell medium, and thus after inhibition of catalase, the
decay of the cathodic peak is substantially retarded (Figure 35 c). Figure 35 d shows a
comparison of the peak half-lifes, i.e. the times after the penetration until the cathodic current
peaks have decreased by 50 %. After inhibition of catalase, the average half-life is 1.4 s whereas
cells not treated with 3-AT exhibited a half-life of 0.8 s. This behavior is attributed to the cell’s
diminished capability to annihilate H2O2 when a major part of its natural protection mechanisms
against ROS species is partially dysfunctional. These results demonstrate the utility of PB-
modified nanoelectrodes to evaluate the antioxidant capabilities of cells. In the future, this
technique may allow to correlate dysfunctionalities of protective mechanisms against an
overabundance of ROS with the development of pathogenic conditions. Because single cells are
targeted, the fate of individual cells in the development of diseases could be monitored.

4 Results and Discussion
4.4 Potentiometric Sensors on Nanoelectrodes 71
4.4 Potentiometric Sensors on Nanoelectrodes
Experiments were performed by Anna Muhs, Ruhr-Universität Bochum in a student project.
The results shown above demonstrate the capabilities of nanoelectrodes for the study of single
living cells. Nanoelectrodes are specifically modified by depositing electroactive materials on
their surface to improve the resulting sensor’s sensitivity and/or selectivity for certain analytes.
Until now, these electrochemical probes are amperometric sensors, i.e. the faradaic current
generated for the oxidation or reduction of an analyte is measured as a function of the analyte
concentration. As the dimensions of the active sensor decrease to the nanoscale and small
analyte concentrations are to be detected, amperometric sensors are limited by the capabilities
of state-of-the-art electronics current amplifiers, that is, the electronic noise of the instruments
becomes larger than the signal. The development of more powerful current amplifiers and
optimization of the measurement environment such as improved electromagnetic shielding and
isolation from vibration and thermal fluctuations may go some way in pushing forward the
reliable detection of small currents. However, it is unlikely that these strategies will allow to
measure only a few electrons passing nanometric electrodes in a faradaic detection reaction. For
instance, a current of 1 fA still corresponds to roughly 6000 electrons transmitted per second.
Hence, strategies to overcome this sensitivity limit have to be developed to boost the utility of
nanoelectrodes in sensing applications.
Potentiometry is known to allow chemical analysis with superior sensitivity. The analytical
signal is directly depending on the activity of the analyte, not the total amount. Moreover, given
that the sensor is small, virtually no analyte is consumed. This ensures that potentiometric
sensors are very powerful tools for detecting small analyte concentrations in small volumes,
which is particularly interesting for detection inside cells. For example, potentiometric sensors
were capable of detecting 100 pM Ca2+, Ag2+ and Pb2+ in only 3 µl sample volume which
corresponds to a total amount of 300 amol.[309] Previous designs of potentiometric sensors
mainly employ ion-selective membranes that permit the transfer of a specific analyte while
blocking access of other species to the electrode.[310–314] The concentration gradient built up at
these sensor interfaces creates the difference in electric potential that is described by the Nernst
equation. The pH electrode, where protons diffuse into a porous glass membrane to build up a
potential gradient is the most widespread realization of this concept. This principle was also
applied for micrometric sensors. For instance, glass pipettes with an opening of a few
micrometer or smaller and filled with selective ionophores have found widespread use in pH[315]
or Na+ and K+ sensing.[202,316,317] Alternatively, all-solid-state potentiometric sensors have been
proposed using metal electrodes at which the analyte specifically adsorbs at the interface.[318] It
was demonstrated that glass nanopipettes filled with carbon and subsequently platinized can
4 Results and Discussion
4.4 Potentiometric Sensors on Nanoelectrodes 72
potentially serve as potentiometric probes to measure the membrane potential upon cell
penetration.[319] The applications for chemical detection are, however, restricted to
measurement of the potential of a solution containing large concentrations of the simple model
redox pair ferricyanide/ferrocyanide and the capabilities for sensitive and dynamic detection of
small analyte concentrations are unrecognized.
No faradaic reactions were involved in the sensing scheme. However, potentiometric sensors
can be extended to exploit faradaic processes: The open circuit potential of an electrode
immersed in solution is dictated by the sum of all redox active compounds in contact with the
electrode. However, only the redox reactions showing the fastest reaction kinetics at that given
electrode surface force their redox potential upon the electrode. For an electrochemical sensor
designed to selectively detect only one analyte the electrode surface has to be modified such that
the overpotential for one particular reaction has is decreased to allow fast kinetics while the
electrode has to be made insensitive for other processes. While this was the main goal in most of
the extensive research in the development of amperometric sensors in the past decades, the
concept has found little realization in potentiometric sensors yet.
By depositing redox active species on an electrode surface, a sensor for potentiometric detection
of faradaic processes can be created. The potential of the sensing electrode is then dictated by
the redox active moieties in the mediating layer. The sensitivity of such a potentiometric sensor
for faradaic processes can be controlled by adjusting the amount of redox active species in the
film. A small amount of analyte can change the potential of the electrode drastically if the
electrode is modified by only a small amount of redox active species. The mediating layer needs
to cover the sensor surface completely to exclude interferences. Hence, small electrodes are
particularly well suited to construct sensors with superior sensitivity because a small amount of
redox active moieties is sufficient to cover the entire sensor surface. This is in contrast to
amperometric sensors where sensitivity issues are encountered in particular for smaller
sensors.
Prussian Blue-modified nanoelectrodes are well suited to demonstrate this principle in the
following considerations and experiments. PB meets the above stated criterion of selectivity. The
reduction of the analyte H2O2 is favored over other possible redox reactions of all species in the
solution. According to the Nernst equation, the open circuit potential EOCP of the PB-modified
electrode is dictated by the ratio of activities of the oxidized form PB and the reduced form PW
in the film:
𝐸𝑂𝐶𝑃 = 𝐸0 +
0.059 𝑉
𝑧𝑙𝑜𝑔
𝑎𝑃𝐵
𝑎𝑃𝑊
(2)

4 Results and Discussion
4.4 Potentiometric Sensors on Nanoelectrodes 73
E0 is the standard reduction potential for the reduction of PB to PW, z refers to the number of
transferred electrons and a denotes activities of the redox active species. Equation (2) can be
expressed in terms of the amounts of PB and PW in the film because the activity coefficients in
the standard state are unity and the volume of the film is assumed to be constant.
𝐸𝑂𝐶𝑃 = 𝐸0 +
0.059 𝑉
𝑧𝑙𝑜𝑔
𝑛𝑃𝐵
𝑛𝑃𝑊
(3)
The presence of H2O2 will change the amounts of PB/PW in the film with a first order reaction
kinetics law with respect to the H2O2 concentration (see also Figure 26):
𝑑𝑛𝑃𝐵
𝑑𝑡= 𝑘 [𝐻2𝑂2]
(4)
𝑑𝑛𝑃𝑊
𝑑𝑡= −𝑘 [𝐻2𝑂2]
(5)
[H2O2] is the bulk concentration of hydrogen peroxide and k is the apparent rate constant for the
oxidation of PW caused in the presence of H2O2. k is determined by not only the electron transfer
rate of H2O2 oxidation at the PB-modified electrode but also contains the mass transport rate of
H2O2 to the electrode which itself is a function of the electrode geometry. The integrated forms of
the rate laws are:
𝑛𝑃𝐵(𝑡) = 𝑘𝑡[𝐻2𝑂2] + 𝑛𝑃𝐵(𝑡 = 0) (6)
𝑛𝑃𝑊(𝑡) = −𝑘𝑡[𝐻2𝑂2] + 𝑛𝑃𝑊(𝑡 = 0) (7)
If the sensor is sufficiently small with respect to the volume of the electrochemical cell, the
consumption of H2O2 is negligible and its concentration can be regarded as constant. Hence, a
new rate constant K is defined as the apparent turnover of PW in the presence of H2O2.
𝑛𝑃𝐵(𝑡) = 𝐾𝑡 + 𝑛𝑃𝐵(𝑡 = 0) (8)
𝑛𝑃𝑊(𝑡) = −𝐾𝑡 + 𝑛𝑃𝑊(𝑡 = 0) (9)
Equations (8) and (9), inserted in equation (3) express the temporal dependence of the open
circuit potential of the electrode:
𝐸𝑂𝐶𝑃(𝑡) = 𝐸0 +
0.059 𝑉
𝑧𝑙𝑜𝑔
𝐾𝑡 + 𝑛𝑃𝐵(𝑡 = 0)
−𝐾𝑡 + 𝑛𝑃𝑊(𝑡 = 0)
(10)
Not the OCP itself but the change of OCP with time at different H2O2 concentrations is taken as
the analytical signal of the sensors. In the beginning of such a detection experiment, the OCP is
far cathodic of the standard redox potential of PB/PW, so that only PW is present:
𝑛𝑃𝐵(𝑡 = 0) = 0 (11)
𝑛𝑃𝑊(𝑡 = 0) = 𝑛𝑡𝑜𝑡𝑎𝑙 (12)
ntotal is the overall amount of PB/PW deposited on the electrode. Hence, equation (10) simplifies
to equation (13).
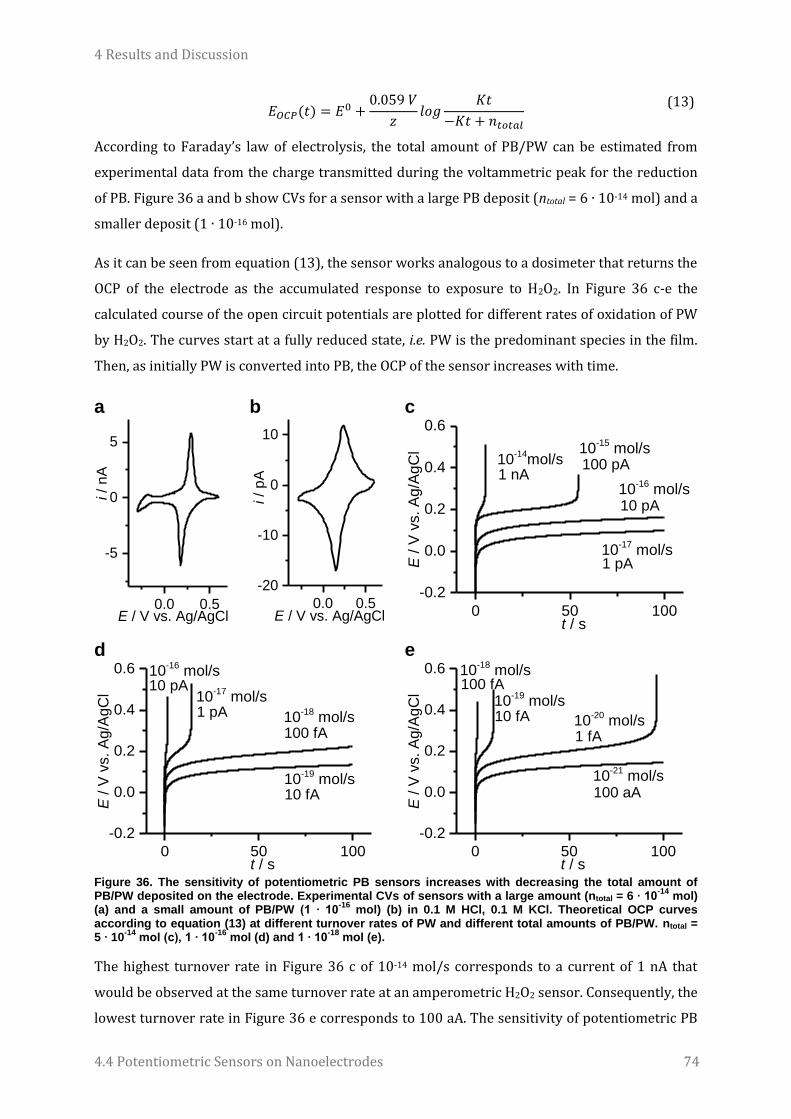
4 Results and Discussion
4.4 Potentiometric Sensors on Nanoelectrodes 74
𝐸𝑂𝐶𝑃(𝑡) = 𝐸0 +
0.059 𝑉
𝑧𝑙𝑜𝑔
𝐾𝑡
−𝐾𝑡 + 𝑛𝑡𝑜𝑡𝑎𝑙
(13)
According to Faraday’s law of electrolysis, the total amount of PB/PW can be estimated from
experimental data from the charge transmitted during the voltammetric peak for the reduction
of PB. Figure 36 a and b show CVs for a sensor with a large PB deposit (ntotal = 6 ∙ 10-14 mol) and a
smaller deposit (1 ∙ 10-16 mol).
As it can be seen from equation (13), the sensor works analogous to a dosimeter that returns the
OCP of the electrode as the accumulated response to exposure to H2O2. In Figure 36 c-e the
calculated course of the open circuit potentials are plotted for different rates of oxidation of PW
by H2O2. The curves start at a fully reduced state, i.e. PW is the predominant species in the film.
Then, as initially PW is converted into PB, the OCP of the sensor increases with time.
a
0.0 0.5
-5
0
5
i /
nA
E / V vs. Ag/AgCl
b
0.0 0.5
-20
-10
0
10
i /
pA
E / V vs. Ag/AgCl
c
0 50 100
-0.2
0.0
0.2
0.4
0.6
10 pA
100 pA
1 pA10
-17 mol/s
10-16
mol/s
10-15
mol/s
E /
V v
s.
Ag
/Ag
Cl
t / s
10-14
mol/s1 nA
d
0 50 100
-0.2
0.0
0.2
0.4
0.6
10 fA10
-19 mol/s
100 fA10
-18 mol/s
10 pA
1 pA10
-17 mol/s
E /
V v
s.
Ag
/Ag
Cl
t / s
10-16
mol/s
e
0 50 100
-0.2
0.0
0.2
0.4
0.6
100 aA10
-21 mol/s
1 fA10
-20 mol/s10 fA
10-19
mol/s100 fA10
-18 mol/s
E /
V v
s.
Ag
/Ag
Cl
t / s Figure 36. The sensitivity of potentiometric PB sensors increases with decreasing the total amount of PB/PW deposited on the electrode. Experimental CVs of sensors with a large amount (ntotal = 6 ∙ 10
-14 mol)
(a) and a small amount of PB/PW (1 ∙ 10-16
mol) (b) in 0.1 M HCl, 0.1 M KCl. Theoretical OCP curves according to equation (13) at different turnover rates of PW and different total amounts of PB/PW. ntotal = 5 ∙ 10
-14 mol (c), 1 ∙ 10
-16 mol (d) and 1 ∙ 10
-18 mol (e).
The highest turnover rate in Figure 36 c of 10-14 mol/s corresponds to a current of 1 nA that
would be observed at the same turnover rate at an amperometric H2O2 sensor. Consequently, the
lowest turnover rate in Figure 36 e corresponds to 100 aA. The sensitivity of potentiometric PB

4 Results and Discussion
4.4 Potentiometric Sensors on Nanoelectrodes 75
sensors increases with decreasing amount of ntotal. Figure 36 c and d show the theoretical OCP
curves for the large and small PB/PW amounts experimentally determined in Figure 36 a and b.
For the large PB sensor, marked differences in the OCP curves are only observed between
turnover rates from 10-16 to 10-14 mol/s whereas the smaller sensor may distinguish between
H2O2 concentrations leading to turnover rates between 10-18 and 10-16 mol/s. Even higher
sensitivity can be obtained when further decreasing the amount of electroactive material on the
sensor surface. For a sensor carrying a PB amount approx. 100 times smaller than the one
shown in Figure 36 b, a turnover rate of as little as 10-21 mol/s (ca. 600 molecules per s) is
sufficient to change the OCP in a reasonable amount of time and thus to induce a noticeable
sensor response. The predicted behavior is confirmed by experiments. Figure 37 shows
experimental OCP curves recorded at PB-modified electrodes in acidic solution containing
different concentration of H2O2. During each experiment, the sensors were first polarized to a
potential of -0.4 V vs. Ag/AgCl/3 M Cl-. This potential is substantially more cathodic than the
formal potential of the PB/PW couple (0.2 V vs. Ag/AgCl/3 M Cl-). Hence, predominantly the
reduced form PW was present in the initial stage of the experiment. After the initial charging of
the sensor, the electrochemical cell was switched off at t = 0 and the change of OCP was
monitored.
a
0 20 40 60
-0.4
-0.2
0.0
0.2
0.4
E /
V v
s.
Ag
/Ag
Cl
t / s
no H2O
2
0.5 mM
1 mM
1.5 mM
2 mM
2.5 mM
b
0 20 40
-0.4
-0.2
0.0
0.2
E /
V v
s.
Ag
/Ag
Cl
t / s
no H2O
2
5 µM
50 µM
500 µM
Figure 37. The OCP vs. time curves observed at PB-modified nanoelectrodes change with the H2O2 con-centration. Experimental curves measured at two different sensors with ntotal = 2 ∙ 10
-15 (a)
ntotal = 8 ∙ 10-15
mol (b) in 0.1 M HCl, 0.1 M KCl with different concentrations of H2O2.
The experiment was repeated in solutions with different concentrations of H2O2. As expected,
the OCP-time curve recorded in the absence of H2O2 is flat and the curves become steeper when
the H2O2 concentration is gradually increased to 2.5 mM (Figure 37 a). Hence, the observed
change in OCP is largely due to oxidation of PW to PB by H2O2. To assess the sensitivity of the
potentiometric sensor, the OCP is measured at smaller concentrations of H2O2 (Figure 37 b).
Compared to the blank measurement, the slope of the OCP curve is markedly higher in 50 µM
and 500 µM H2O2. However, in the presence of only 5 µM the OCP does not change faster as
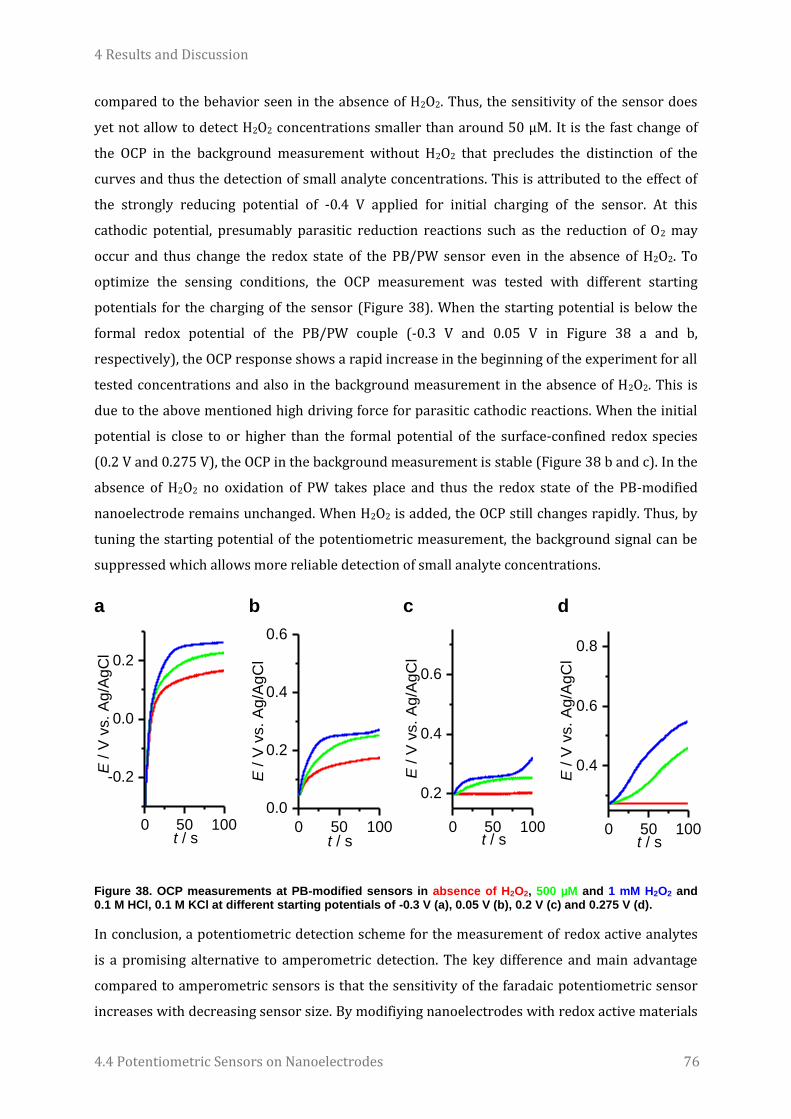
4 Results and Discussion
4.4 Potentiometric Sensors on Nanoelectrodes 76
compared to the behavior seen in the absence of H2O2. Thus, the sensitivity of the sensor does
yet not allow to detect H2O2 concentrations smaller than around 50 µM. It is the fast change of
the OCP in the background measurement without H2O2 that precludes the distinction of the
curves and thus the detection of small analyte concentrations. This is attributed to the effect of
the strongly reducing potential of -0.4 V applied for initial charging of the sensor. At this
cathodic potential, presumably parasitic reduction reactions such as the reduction of O2 may
occur and thus change the redox state of the PB/PW sensor even in the absence of H2O2. To
optimize the sensing conditions, the OCP measurement was tested with different starting
potentials for the charging of the sensor (Figure 38). When the starting potential is below the
formal redox potential of the PB/PW couple (-0.3 V and 0.05 V in Figure 38 a and b,
respectively), the OCP response shows a rapid increase in the beginning of the experiment for all
tested concentrations and also in the background measurement in the absence of H2O2. This is
due to the above mentioned high driving force for parasitic cathodic reactions. When the initial
potential is close to or higher than the formal potential of the surface-confined redox species
(0.2 V and 0.275 V), the OCP in the background measurement is stable (Figure 38 b and c). In the
absence of H2O2 no oxidation of PW takes place and thus the redox state of the PB-modified
nanoelectrode remains unchanged. When H2O2 is added, the OCP still changes rapidly. Thus, by
tuning the starting potential of the potentiometric measurement, the background signal can be
suppressed which allows more reliable detection of small analyte concentrations.
a
0 50 100
-0.2
0.0
0.2
E /
V v
s.
Ag
/Ag
Cl
t / s
b
0 50 100
0.0
0.2
0.4
0.6
E /
V v
s.
Ag
/Ag
Cl
t / s
c
0 50 100
0.2
0.4
0.6
E /
V v
s.
Ag
/Ag
Cl
t / s
d
0 50 100
0.4
0.6
0.8
E /
V v
s.
Ag
/Ag
Cl
t / s
Figure 38. OCP measurements at PB-modified sensors in absence of H2O2, 500 µM and 1 mM H2O2 and 0.1 M HCl, 0.1 M KCl at different starting potentials of -0.3 V (a), 0.05 V (b), 0.2 V (c) and 0.275 V (d).
In conclusion, a potentiometric detection scheme for the measurement of redox active analytes
is a promising alternative to amperometric detection. The key difference and main advantage
compared to amperometric sensors is that the sensitivity of the faradaic potentiometric sensor
increases with decreasing sensor size. By modifiying nanoelectrodes with redox active materials

4 Results and Discussion
4.4 Potentiometric Sensors on Nanoelectrodes 77
that dictate the OCP of the nanoelectrode, the sensor works analogous to a dosimeter. The
sensor can be recovered by applying a potential to restore the intial redox state. A repeated
sequence of potentiostatic recovery of the sensor followed by OCP measurement will allow
continuous detection of analytes. The principle of a potentiometric sensor for the detection of
faradaic reactions is demonstrated in this work using PB as the sensitive film for H2O2
measurements. Further optimization and characterization of the PB-based potentiometric
nanosensors has to follow before the sensor can be used in a real analytical application.
However, the presented method is generic. Any type of redox active molecules or materials that
i) have a reversible redox transition and ii) can be deposited on a nanoelectrode surface are
suitable for this detection scheme. This may empower nanoelectrodes for the detection of very
small analyte concentrations with unprecedented sensitivity.
4 Results and Discussion
4.5 Field Effect Transistor Sensors on Nanoelectrodes 78
4.5 Field Effect Transistor Sensors on Nanoelectrodes
Experiments were performed in collaboration with Yanjun Zhang and other researchers from the
Division of Medicine at the Imperial College London, who also provided cell samples. Parts of the
following section are also published in ref. [320]: “Zhang, Y.*; Clausmeyer , J.*; Babakinejad, B.*;
López Córdoba, A.; Ali, T.; Shevchuk , A.; Takahashi , Y.; Novak , P. Edward , C.; Lab, M.; Gopal, S.;
Chiappini, C.; Anand, U.; Magnani, L.; Coombes, C.; Gorelik, J.; Matsue, M.; Schuhmann, W.;
Klenerman, D.; Sviderskaya, E.; Korchev, Y.; ACS Nano 2016, In Press, DOI:
10.1021/acsnano.5b05211”
* These authors contributed equally
4.5.1 pH-sensitive polypyrrole FETs on dual carbon nanoelectrodes
The sensitivity of amperometric nanosensors is limited by the technical ability to measure small
currents below the pA range. Field effect transistor sensors overcome this problem by indirectly
measuring the electric potential change upon interaction of the FET with the analyte. The
potential modulates a large and easy-to-measure current signal passing through the transistor
channel. Due to the intrinsic amplification, the current has a high signal-to-noise ratio and thus
allows highly sensitive measurement and potentially even the detection of single molecules.
However, the complex fabrication and large sensor dimensions of state-of-the-art FET sensors
often preclude their application to measurements in small confined volumes especially for the
analysis of cells.
To overcome this problem, dual carbon nanoelectrodes are used as templates to form a FET
sensor that can be freely moved in space and has a high spatial resolution to target single cells. A
quartz Θ-capillary is pulled into a double-barrel nanopipette using a laser puller. Then, pyrolytic
decomposition of butane deposits conductive carbon, and produces two individually
addressable carbon nanoelectrodes, separated by a few nanometer thin glass wall.[99,103] The two
electrodes are of the same quality as single barrel carbon nanoelectrodes, however have a
semicircular shape. A CV with ferrocenemethanol as the redox mediator shows steady-state
current plateaus for fast ferrocenemethanol oxidation. Both electrodes show approximately the
same current, indicating similar size.

4 Results and Discussion
4.5 Field Effect Transistor Sensors on Nanoelectrodes 79
0.0 0.2 0.4 0.6
0
5
10
i /
pA
E / V vs. Ag/AgCl
Figure 39. CV at a dual carbon electrode (electrode 1, electrode 2) in 1 mM ferrocenemethanol, 0.1 M KCl, 0.2 V/s.
Equation (1), normally used to estimate the size of single barrel nanoelectrodes from the
limiting steady-state current, is only valid for circular electrodes surrounded by a coaxial
insulator. Hence, applying this equation to dual carbon electrodes can only give a rough
estimation of their size. For instance, the steady-state currents observed in Figure 39
correspond to a radius of 25 nm for each electrode assuming circular geometry. To generate a
field effect transistor, a semiconducting material is deposited on the dual carbon electrode to
comprise the channel of the transistor. To demonstrate the possibility of fabricating a functional
FET sensor on the tip of a dual carbon electrode, a polypyrrole (PPy) nanojunction is used as the
transistor channel. PPy is a conducting polymer with properties similar to a p-type
semiconductor. The polymer is deposited by an electrochemically initiated radical
polymerization. Upon applying anodic potential the pyrrole monomer is oxidized and forms first
dimers, then oligomers and finally PPy. Electric conduction occurs when PPy is oxidized, so that
positive charge carriers are introduced into the polymer backbone which then transport
electrical current.
Figure 40. Mechanism of electropolymerization and electrical conduction of PPy.
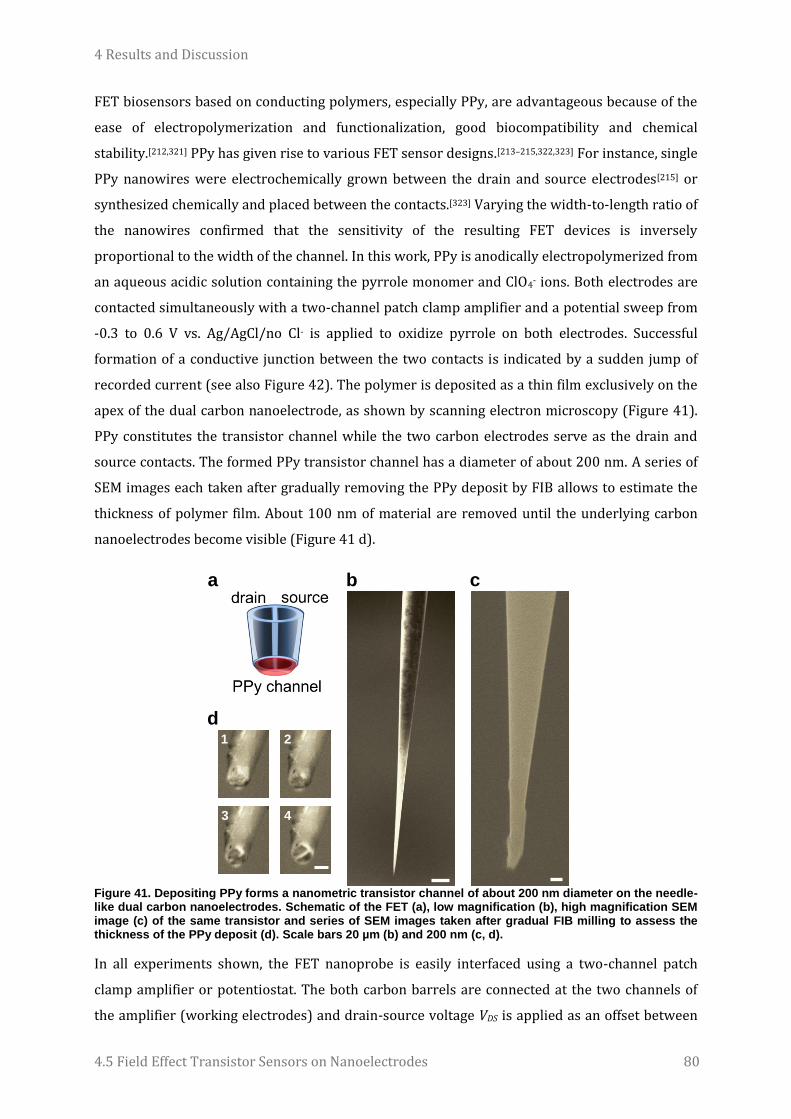
4 Results and Discussion
4.5 Field Effect Transistor Sensors on Nanoelectrodes 80
FET biosensors based on conducting polymers, especially PPy, are advantageous because of the
ease of electropolymerization and functionalization, good biocompatibility and chemical
stability.[212,321] PPy has given rise to various FET sensor designs.[213–215,322,323] For instance, single
PPy nanowires were electrochemically grown between the drain and source electrodes[215] or
synthesized chemically and placed between the contacts.[323] Varying the width-to-length ratio of
the nanowires confirmed that the sensitivity of the resulting FET devices is inversely
proportional to the width of the channel. In this work, PPy is anodically electropolymerized from
an aqueous acidic solution containing the pyrrole monomer and ClO4- ions. Both electrodes are
contacted simultaneously with a two-channel patch clamp amplifier and a potential sweep from
-0.3 to 0.6 V vs. Ag/AgCl/no Cl- is applied to oxidize pyrrole on both electrodes. Successful
formation of a conductive junction between the two contacts is indicated by a sudden jump of
recorded current (see also Figure 42). The polymer is deposited as a thin film exclusively on the
apex of the dual carbon nanoelectrode, as shown by scanning electron microscopy (Figure 41).
PPy constitutes the transistor channel while the two carbon electrodes serve as the drain and
source contacts. The formed PPy transistor channel has a diameter of about 200 nm. A series of
SEM images each taken after gradually removing the PPy deposit by FIB allows to estimate the
thickness of polymer film. About 100 nm of material are removed until the underlying carbon
nanoelectrodes become visible (Figure 41 d).
a
b
c
d 1 2
3 4
Figure 41. Depositing PPy forms a nanometric transistor channel of about 200 nm diameter on the needle-like dual carbon nanoelectrodes. Schematic of the FET (a), low magnification (b), high magnification SEM image (c) of the same transistor and series of SEM images taken after gradual FIB milling to assess the thickness of the PPy deposit (d). Scale bars 20 µm (b) and 200 nm (c, d).
In all experiments shown, the FET nanoprobe is easily interfaced using a two-channel patch
clamp amplifier or potentiostat. The both carbon barrels are connected at the two channels of
the amplifier (working electrodes) and drain-source voltage VDS is applied as an offset between

4 Results and Discussion
4.5 Field Effect Transistor Sensors on Nanoelectrodes 81
them (Figure 42 a). As current passes through the PPy channel, the current measured
individually at the two electrodes has nearly equal magnitude but opposite sign. This current is
the drain-source current IDS (or -IDS for the other electrode). The gate voltage VG is applied with
respect to the ground electrode of the current amplifier. An external Ag/AgCl wire in the
electrolyte solution is used as the gate electrode. The IDS-VDS curves show that IDS is linearly
dependent on VDS and can be reversibly switched by applying different gate voltages with
respect to an external Ag/AgCl electrode (Figure 42 b). When the potential (VG) is above 0 V, the
PPy channel is fully oxidized and becomes conductive due to the insertion of positive charge
carriers into the polymer backbone. At gate voltages below 0 V, the PPy becomes increasingly
reduced. Hence, the junction becomes insulating and the IDS vanishes. At VG of -0.6 V, the PPy
channel is fully insulating. Thus, by applying different VG, the PPy channel of the transistor can be
opened or closed.
a
b
0.00 0.05 0.10
0
50
100
1500.2 V0 V
-0.2 V
-0.4 V
I DS /
nA
VDS
/ V
-0.6 V
0 5 10
0
10
20
Figure 42. The PPy-FET is interfaced using a dual channel patch clamp amplifier (a) and shows typical transistor behavior. The current measured at the two electrodes has opposite polarity and represents IDS. VDS is applied between the two barrels, VG is applied with respect to an external Ag/AgCl electrode. IDS
depends linearly on the VDS. Recording at different VG from -0.6 V to 0.2 V vs. Ag/AgCl/0.1 M Cl- in 0.1 M
HCl (b).
Moreover, the drain-source current is strongly dependent on the pH value, turning the PPy
nano-FET into a sensitive pH sensor. When VG is swept dynamically while keeping a constant
small VDS of a few mV (IDS-VG curve), opening and closing of the transistor is observed (Figure 43
a). The IDS-VG curve also shows that the conductance shows a maximal value at a particular VG
and then decreases due to overoxidation of PPy.[215,323] The interaction of protons with the PPy
nanojunction has two effects: Firstly, a general increase of conductance is observed which leads
to higher values for IDS. The dependence of conductivity on pH is attributed to the
protonation/deprotonation of the pyrrolic nitrogen in the PPy nanowire. Protonation results in
the formation of delocalized radical cations and is accompanied by an increase in
conductivity.[215,323] Secondly, a shift in the IDS-VG curve is observed due to the electrical potential
shift induced by proton accumulation/depletion that adds to the externally applied gate voltage.
This phenomenon is the field effect. The shift is seen clearest in the IDS-VG curves normalized by

4 Results and Discussion
4.5 Field Effect Transistor Sensors on Nanoelectrodes 82
their peak current values (Figure 43 c). Extracting the position of the peaks on the VG scale
reveals a voltage shift of 51 mV per pH unit, close to the value of 59 mV predicted for Nernstian
behavior (Figure 43 d). Alternatively, pH measurements can be performed reliably by extracting
IDS by averaging over the full IDS-VG curve (Figure 43 b). For all following presented results, IDS
was measured in this fashion.
a
-0.4 -0.2 0.0 0.2 0.4
0.0
0.2
0.4
0.6
I DS /
nA
VG / V
pH2.4
pH4.5
pH7.0
pH7.5
b
2 3 4 5 6 7 8
0.0
0.2
0.4
I DS /
nA
pH
c
-0.4 -0.2 0.0 0.2 0.4
0.0
0.5
1.0
1.5
I DS /
ID
S,p
eak
VG / V
pH 2.4
pH 4.5
pH 7.0
pH 7.5
d
2 3 4 5 6 7 8
-0.1
0.0
0.1
0.2
VG
,peak /
V
pH Figure 43. The PPy-FET is a pH nanosensor. From IDS-VG curves (a) changes in pH value can be measured as change of average drain-source current (b). The IDS-VG curves normalized by their peak currents also show a shift of peak voltage (c) which can be taken as a measure for the pH as well (d). Measurements at VDS = 5 mV. VG was changed with 0.4 V/s.
The pH-sensitive PPy-FET can be used to monitor pH changes in the physiologically relevant
range from pH 5 to pH 7.5 in real time (Figure 44 a). Each data point corresponds to the average
IDS from a full VG sweep between -0.6 V and 0.3 V. The pH is changed by immersing the FET into
phosphate buffered solutions with different pH values. IDS responds to the changes in acidity of
the environment in a response time of a few seconds, indicated by the stable current plateaus
after changing the solution. When the pH after this calibration is changed back to the initial
value, the sensor response follows the pH change, indicating reversibility of the measurement.
The sensor response is linear with respect to the pH in the range between 5 and 7.5 (Figure 44
b). The sensitivity towards protons is expressed as 1/G0 ∙ ΔG/ΔpH, with the conductance G =
IDS/VDS and G0 the conductance at pH 7. Note that this measure is equivalent to 1/IDS,0 ∙ ΔIDS/ΔpH

4 Results and Discussion
4.5 Field Effect Transistor Sensors on Nanoelectrodes 83
and thus independent of VDS. To compare all pH sensors, normalization by G0 (or IDS,0) is
necessary because of the variation of the conductance between probes that is due to small
variations in the size of the electrodes and the size and quality of the deposited PPy. However,
the variation in the normalized sensitivity for pH is relatively small. The sensitivity is -0.5 ± 0.1
pH-1. Quantitative comparison of the sensitivity with values reported in the literature is difficult
because the values depend on specific experimental details. For instance, Shirale et al. report
similar sensitivities of up to 0.4 pH-1 for single PPy nanowires depending on the aspect ratio of
the PPy transistor channel.[323] However, the values were extracted at different VG and
normalized by IDS at a different pH value (pH 10) compared to this study.
a
0 100 200 300 400
5
10
15
20
257.554.75
5.96
6.95
I DS /
nA
t / s
7.55
b
5 6 7 8
4
6
8
10
12
14
16
I DS /
nA
pH
Figure 44. PPy-FET nanosensors monitor pH changes in the physiologically relevant range in real time. IDS as the sensor response to changing the pH in the phosphate-buffered media (a). IDS values depend linearly on the pH in the range between 5 and 7.5 (b).
In contrast to amperometric sensors or conventional ion-selective sensors like the standard pH
electrode, FET devices can also be applied as gas sensors and chemical noses.[222] This is because
the analytical signal IDS does not require electron or ion transfer at the electrochemical interface
between the electrode and the electrolyte solution. Instead, current also passes through the dry
transistor channel. Applying a gate voltage with respect to a gate electrode immersed in
electrolyte solution is not strictly necessary for the operation of the transistor sensor. Figure 45
shows the utility of the PPy-FET nanosensors for detection of H+/OH- from molecules in the gas
phase. The probe was pulled out of the solution, leaving the gate electrode disconnected. Yet, IDS
can pass the transistor channel. H+-donating/accepting compounds are detected when the FET
sensor is moved in proximity to small open vials filled with solutions of concentrated ammonia
and acetic acid (Figure 45). The two volatile compounds interact with the transistor at the solid-
gas interphase. When the FET probe is brought close to the container filled with NH3, IDS
decreases as expected from the response to alkaline pH seen for calibration curves in the liquid
phase (Figure 44). After retraction of the sensor, the signal recovers. Moving the sensor close to
the vial filled with acetic acid induces an increase of IDS due to the release of protons into the PPy
channel.
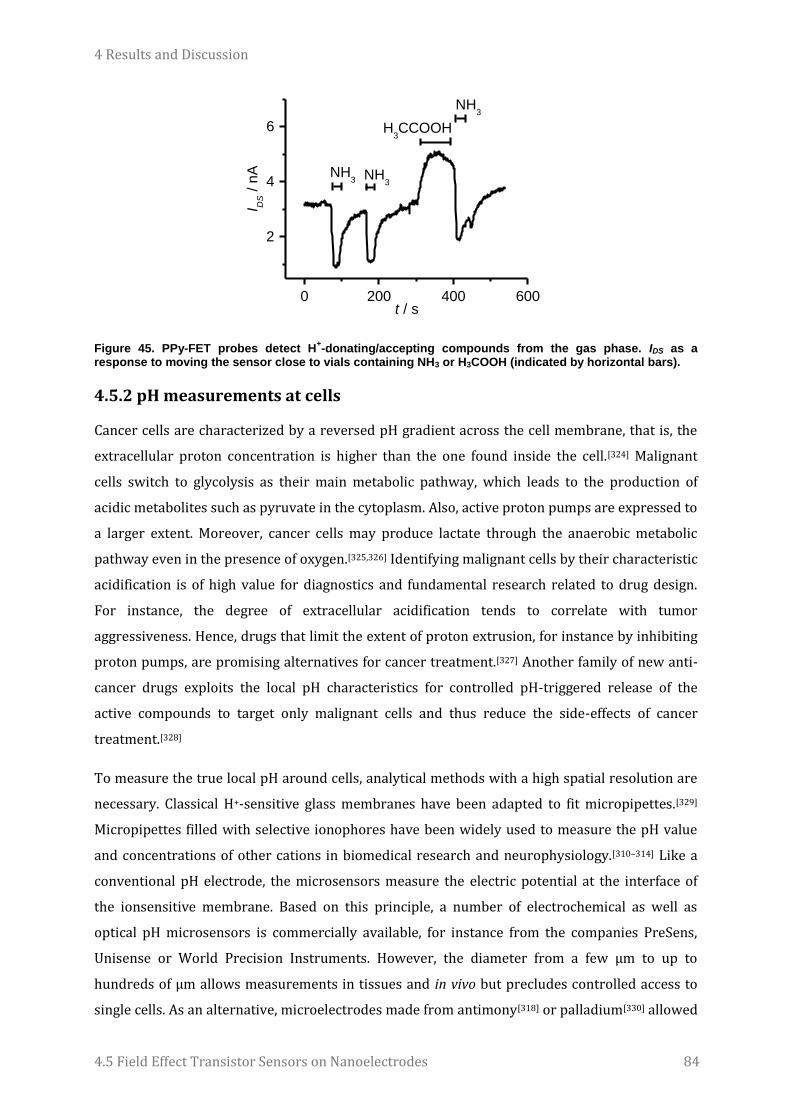
4 Results and Discussion
4.5 Field Effect Transistor Sensors on Nanoelectrodes 84
0 200 400 600
2
4
6
I DS /
nA
t / s
NH3
NH3
H3CCOOH
NH3
Figure 45. PPy-FET probes detect H+-donating/accepting compounds from the gas phase. IDS as a
response to moving the sensor close to vials containing NH3 or H3COOH (indicated by horizontal bars).
4.5.2 pH measurements at cells
Cancer cells are characterized by a reversed pH gradient across the cell membrane, that is, the
extracellular proton concentration is higher than the one found inside the cell.[324] Malignant
cells switch to glycolysis as their main metabolic pathway, which leads to the production of
acidic metabolites such as pyruvate in the cytoplasm. Also, active proton pumps are expressed to
a larger extent. Moreover, cancer cells may produce lactate through the anaerobic metabolic
pathway even in the presence of oxygen.[325,326] Identifying malignant cells by their characteristic
acidification is of high value for diagnostics and fundamental research related to drug design.
For instance, the degree of extracellular acidification tends to correlate with tumor
aggressiveness. Hence, drugs that limit the extent of proton extrusion, for instance by inhibiting
proton pumps, are promising alternatives for cancer treatment.[327] Another family of new anti-
cancer drugs exploits the local pH characteristics for controlled pH-triggered release of the
active compounds to target only malignant cells and thus reduce the side-effects of cancer
treatment.[328]
To measure the true local pH around cells, analytical methods with a high spatial resolution are
necessary. Classical H+-sensitive glass membranes have been adapted to fit micropipettes.[329]
Micropipettes filled with selective ionophores have been widely used to measure the pH value
and concentrations of other cations in biomedical research and neurophysiology.[310–314] Like a
conventional pH electrode, the microsensors measure the electric potential at the interface of
the ionsensitive membrane. Based on this principle, a number of electrochemical as well as
optical pH microsensors is commercially available, for instance from the companies PreSens,
Unisense or World Precision Instruments. However, the diameter from a few µm to up to
hundreds of µm allows measurements in tissues and in vivo but precludes controlled access to
single cells. As an alternative, microelectrodes made from antimony[318] or palladium[330] allowed
4 Results and Discussion
4.5 Field Effect Transistor Sensors on Nanoelectrodes 85
potentiometric pH sensing and imaging of pH gradients. “Pseudo-potentiometric” sensors are
built by adsorbing redox active molecules on the electrode whose redox transition involves the
consumption or release of H+ or OH-. The sensor signal is the peak potential of the corresponding
peaks in fast-scan voltammograms, as demonstrated for quinone species grafted to carbon
microfiber electrodes.[263]
To reduce the sensor dimensions, a nanopipette-based sensor suitable for intracellular pH
measurements was proposed recently.[331] The opening of the glass nanopipette was modified
with chitosan. Upon protonation, the modified orifice changed its surface charge which resulted
in a change of ion current passing through the nanopipette opening. Recent examples for pH
sensors based on carbon nanoelectrodes exploit a voltammetric detection scheme.
Nanoelectrodes were modified with pH-sensitive materials whose redox potentials shift in the
presence of different proton concentrations. The variation in redox potential is detected by the
shift of the corresponding voltammetric peaks. The principle was demonstrated for the
deposition of iridium oxide on the tip of nanoelectrodes (see also Figure 4 b).[142] Also the
adsorption of the organic compound syringaldazine proved suitable to comprise a pH-
responsive nanosensor.[332] These methods exhibited sufficiently high spatial resolution and low
response times to produce high-resolution images of micrometric sources of OH-.
PPy-FET nanosensors on dual carbon electrodes are suitable to perform pH measurements in
small confined volumes in biological samples. Due to the probes’ high sensitivity and small tip
dimensions it becomes possible to follow small pH changes (≈ 0.1 pH units) when investigating
the local pH around cancer cells. Reliable local pH measurements in the microenvironment of
cells would allow to identify individual cancer cells by their metabolic characteristics. For
instance, melanocytes are pigment-producing cells in the human skin and also the cells that
become cancerous in malignant melanoma, skin cancer. Compared to normal melanocytes,
melanoma cells have a higher metabolic activity and thus can acidify their extracellular
environment because of high glucose uptake rates, increased glycolysis, and the accumulation of
lactic acid.[326,333–335] Figure 46 a shows the pH value calculated from recorded IDS values when
vertically moving the PPy-FET nanoprobe into a cluster of cultured melanoma cells. As expected
from the highly active cells, a pH decrease from 7 to 6.3 is detected when the sensor is inserted
into the cell cluster. Retracting the sensor by 220 µm away from the cells restores the sensor
response to the value corresponding to the pH in the bulk medium. To compare the local pH
values around cancerous melanoma with the one found at healthy melanocytes, a calibrated
probe was also inserted into a cluster of melanocytes (Figure 46 b). In contrast to melanoma, no
local acidification was detected. Thus, the FET sensor is suitable to distinguish cancerous from
normal cells and by this could help to investigate an individual cell’s fate in the development of
cancer.

4 Results and Discussion
4.5 Field Effect Transistor Sensors on Nanoelectrodes 86
However, in the above mentioned experiments, prior to insertion of the sensor into the cell
cluster, the cluster was artificially formed by moving and gathering cells using the FET probe as
a manipulation tool. Yet, this treatment is necessary, because there is no noticeable sensor
response when the probe approaches a single isolated melanoma cell (Figure 46 c). The pH-
sensitivity of the probe is yet insufficient to detect the local pH change generated from a single
cancerous cell. Presumably, significant amounts of extracellular protons are only accumulated if
cells are located in a confined space obstructing the rapid diffusion of protons away from their
source. A single cancer cell is a micrometric source of protons exhibiting a hemispherical
diffusion layer so that released H+ may efficiently escape from the cell. This might be the reason
why the FET sensor does not detect protons released from the single cell. Similar observations
and considerations were made in previous studies conducted with different sensing strategies.
Thakur et al. reported an electrochemical detection strategy to probe the extracellular pH
change of cancer cells and claimed that at least 5 cancer cells were necessary to induce a
significant sensor reponse.[334] Also with regard to the application of flat, chip-like FET sensors
for metabolic studies it was recognized that the acidification is easier to detect if occurring in a
confined space between the cell and the detecting sensor.[224]
a
b
c
Figure 46. The high-aspect ratio FET probe can measure the extracellular acidity of cancer cells. The sensor is moved in and 220 µm out of a cluster of melanoma cells (a), a cluster of normal melanocytes (b) and close to a single melanoma cell (c). Arrows indicate the vertical movement of the probe.
4.5.3 PPy-FET nanobiosensors for ATP measurements
Adenosine triphosphate (ATP) is not only a molecule used by organisms to store and transport
chemical energy but also a co-neurotransmitter abundant in all nerves in the peripheral and
central nervous systems.[336,337] ATP has manifold and often opposing effects on different cell
types, depending on the ATP receptors expressed in the cells. Two families of ATP receptors are
responsible for particular signaling cascades: P2X receptors are ion channels for instance
partially responsible for the contraction of smooth muscle cells. P2Y receptors activate different
signaling cascades inside the cell via G proteins. For instance, for the control of muscle tone in
4 Results and Discussion
4.5 Field Effect Transistor Sensors on Nanoelectrodes 87
blood vessels, increased ATP levels lead to contraction of smooth vascular muscles via P2X
receptors but stimulate the release of nitric oxide from endothelial cells which dilates vessels.
Thus, ATP signaling is closely related with ischemic disorders, i.e. a restriction of oxygen and
glucose supply due to blocked blood vessels. In relation to cancer, ATP causes ambivalent
responses as well. Some P2Y receptors mediate cell proliferation and thus favor tumor
development while certain P2X receptors promote anti-proliferation and cell death.[337]
Moreover, ATP mediates the reception of pain, mechanosensitivity and sensitivity for O2 in the
brain.
Thus, analytical tools to detect and quantify the ATP release from cells in response to different
stimuli may help to identify communication mechanisms based on ATP. The classical method to
quantify the ATP release from cells, however from a whole cell population and without spatial
resolution, are luciferase assays[338–341]. Luciferase, a protein extracted from fireflies, converts its
substrate luciferin into a luminescent product, oxyluciferin, in the presence of O2 and ATP
whereas the luminescence serves as the analytical signal. The method shows very high
sensitivity towards ATP (picomolar detection limits) but the assay performs ex situ and thus is
not suitable to monitor the ATP release in real time. Most importantly, these methods obtain the
information from the bulk solution and hence only report the diluted analyte concentrations.
Alternatively, amperometric microsensors have been proposed for ATP detection in vivo.[336,342–
345] Mixtures of enzymes, namely adenosine deaminase, nucleoside phosphorylase and xanthine
oxidase are entrapped in a polymer film on Pt microelectrodes and the final product of the
enzymatic decomposition, H2O2 is detected by anodic oxidation.[343] A similar method used
glycerol kinase and glycerol-3-phosphate oxidase for the enzymatic cleavage of ATP that results
in the formation of H2O2.[342] These sensors with a minimal size of 25 µm were sufficiently small
to quantify the ATP release in response to O2 deprivation[336] or inflammation[344] in the brain.
Another interesting sensing approach used a cell itself as the sensor to quantify the ATP release
from other cells.[346] A PC12 cell which expresses P2X receptors and thus responds to ATP by
opening ion channels was patched to a micropipette. The whole-cell ion current through ATP-
dependent ion channels served as the sensor response. By positioning the sensor close to
cardiac myocytes, the ATP release from the single heart cells could be measured when the
cardiac myocyte faced ischemic, hypoxic (low O2 supply) or hypotonic (low osmolarity)
conditions. Migita et al. proposed an ion-selective FET (ISFET) responding to ATP.[347] The
enzyme apyrase was deposited in a polymer gel on the tantalum oxide gate of a FET. When
apyrase hydrolyzes ATP, the resulting change in phosphate and proton concentration induced a
sensor response on the FET. However, due to the thick polymer film as well as interferences
with other ionic species, the sensor yet lacked adequate response time, sensitivity and
specificity.
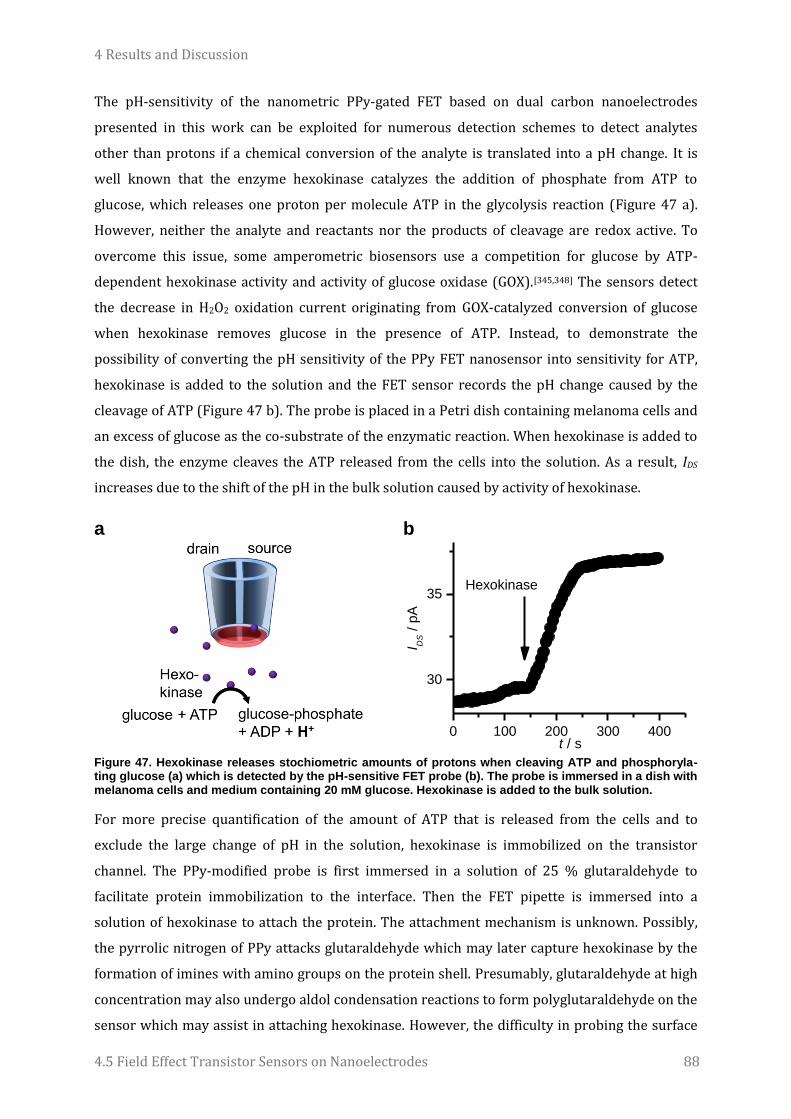
4 Results and Discussion
4.5 Field Effect Transistor Sensors on Nanoelectrodes 88
The pH-sensitivity of the nanometric PPy-gated FET based on dual carbon nanoelectrodes
presented in this work can be exploited for numerous detection schemes to detect analytes
other than protons if a chemical conversion of the analyte is translated into a pH change. It is
well known that the enzyme hexokinase catalyzes the addition of phosphate from ATP to
glucose, which releases one proton per molecule ATP in the glycolysis reaction (Figure 47 a).
However, neither the analyte and reactants nor the products of cleavage are redox active. To
overcome this issue, some amperometric biosensors use a competition for glucose by ATP-
dependent hexokinase activity and activity of glucose oxidase (GOX).[345,348] The sensors detect
the decrease in H2O2 oxidation current originating from GOX-catalyzed conversion of glucose
when hexokinase removes glucose in the presence of ATP. Instead, to demonstrate the
possibility of converting the pH sensitivity of the PPy FET nanosensor into sensitivity for ATP,
hexokinase is added to the solution and the FET sensor records the pH change caused by the
cleavage of ATP (Figure 47 b). The probe is placed in a Petri dish containing melanoma cells and
an excess of glucose as the co-substrate of the enzymatic reaction. When hexokinase is added to
the dish, the enzyme cleaves the ATP released from the cells into the solution. As a result, IDS
increases due to the shift of the pH in the bulk solution caused by activity of hexokinase.
a
b
0 100 200 300 400
30
35
I DS /
pA
t / s
Hexokinase
Figure 47. Hexokinase releases stochiometric amounts of protons when cleaving ATP and phosphoryla-ting glucose (a) which is detected by the pH-sensitive FET probe (b). The probe is immersed in a dish with melanoma cells and medium containing 20 mM glucose. Hexokinase is added to the bulk solution.
For more precise quantification of the amount of ATP that is released from the cells and to
exclude the large change of pH in the solution, hexokinase is immobilized on the transistor
channel. The PPy-modified probe is first immersed in a solution of 25 % glutaraldehyde to
facilitate protein immobilization to the interface. Then the FET pipette is immersed into a
solution of hexokinase to attach the protein. The attachment mechanism is unknown. Possibly,
the pyrrolic nitrogen of PPy attacks glutaraldehyde which may later capture hexokinase by the
formation of imines with amino groups on the protein shell. Presumably, glutaraldehyde at high
concentration may also undergo aldol condensation reactions to form polyglutaraldehyde on the
sensor which may assist in attaching hexokinase. However, the difficulty in probing the surface
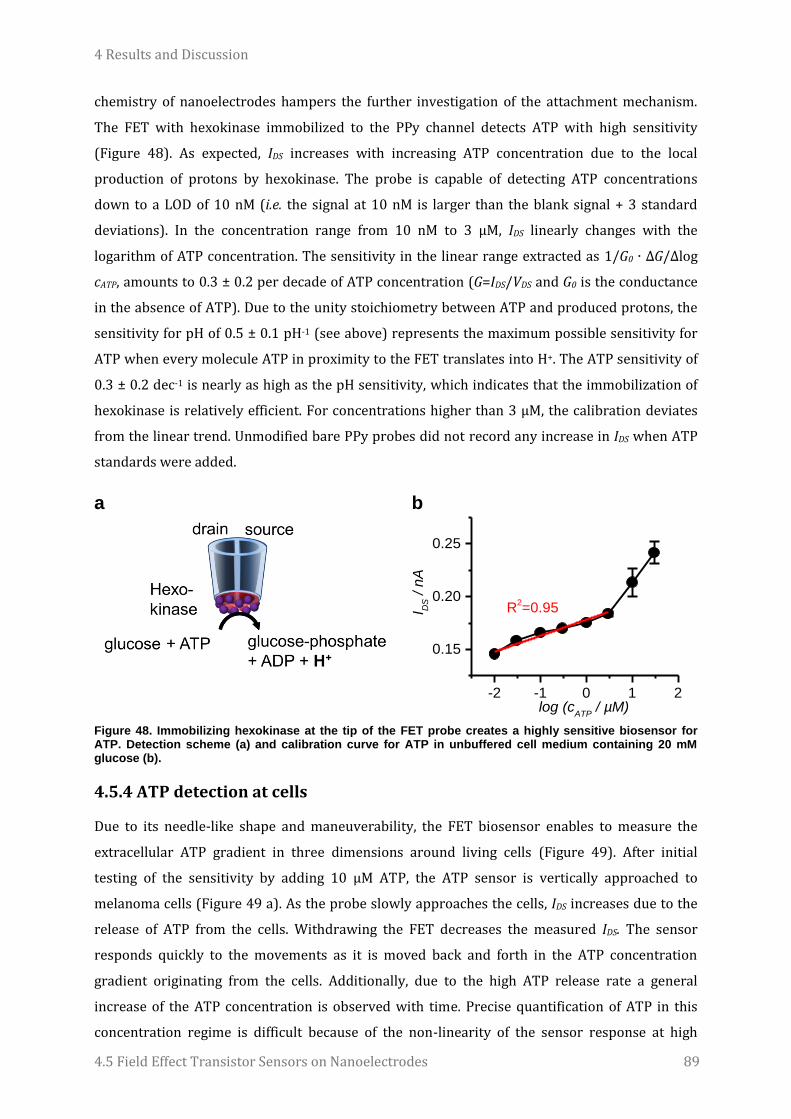
4 Results and Discussion
4.5 Field Effect Transistor Sensors on Nanoelectrodes 89
chemistry of nanoelectrodes hampers the further investigation of the attachment mechanism.
The FET with hexokinase immobilized to the PPy channel detects ATP with high sensitivity
(Figure 48). As expected, IDS increases with increasing ATP concentration due to the local
production of protons by hexokinase. The probe is capable of detecting ATP concentrations
down to a LOD of 10 nM (i.e. the signal at 10 nM is larger than the blank signal + 3 standard
deviations). In the concentration range from 10 nM to 3 µM, IDS linearly changes with the
logarithm of ATP concentration. The sensitivity in the linear range extracted as 1/G0 ∙ ΔG/Δlog
cATP, amounts to 0.3 ± 0.2 per decade of ATP concentration (G=IDS/VDS and G0 is the conductance
in the absence of ATP). Due to the unity stoichiometry between ATP and produced protons, the
sensitivity for pH of 0.5 ± 0.1 pH-1 (see above) represents the maximum possible sensitivity for
ATP when every molecule ATP in proximity to the FET translates into H+. The ATP sensitivity of
0.3 ± 0.2 dec-1 is nearly as high as the pH sensitivity, which indicates that the immobilization of
hexokinase is relatively efficient. For concentrations higher than 3 µM, the calibration deviates
from the linear trend. Unmodified bare PPy probes did not record any increase in IDS when ATP
standards were added.
a
b
-2 -1 0 1 2
0.15
0.20
0.25
I DS /
nA
log (cATP
/ µM)
R2=0.95
Figure 48. Immobilizing hexokinase at the tip of the FET probe creates a highly sensitive biosensor for ATP. Detection scheme (a) and calibration curve for ATP in unbuffered cell medium containing 20 mM glucose (b).
4.5.4 ATP detection at cells
Due to its needle-like shape and maneuverability, the FET biosensor enables to measure the
extracellular ATP gradient in three dimensions around living cells (Figure 49). After initial
testing of the sensitivity by adding 10 µM ATP, the ATP sensor is vertically approached to
melanoma cells (Figure 49 a). As the probe slowly approaches the cells, IDS increases due to the
release of ATP from the cells. Withdrawing the FET decreases the measured IDS. The sensor
responds quickly to the movements as it is moved back and forth in the ATP concentration
gradient originating from the cells. Additionally, due to the high ATP release rate a general
increase of the ATP concentration is observed with time. Precise quantification of ATP in this
concentration regime is difficult because of the non-linearity of the sensor response at high

4 Results and Discussion
4.5 Field Effect Transistor Sensors on Nanoelectrodes 90
concentrations (Figure 48 b). Nevertheless, the magnitude of the concentration gradient can be
estimated. Slow, stepwise vertical approach to the cells reveals that more than 10 µM ATP are
present at a distance of 1 mm away from the cells (Figure 49 b). Even higher concentrations,
between 30 µM and 70 µM are measured in direct proximity to the cells. Because of the non-
linearity of the sensor response, the graph shows the IDS current levels from calibration
experiments as horizontal bars. A bare PPy nano-FET probe not modified with hexokinase on the
other hand does not record any changes in IDS when approached to the cells and thus indicates
that the pH value in the solution is constant (Figure 49 d). This together with the control
experiment presented in Figure 47 demonstrates that the sensor response of the hexokinase-
modified probe is selective to the detection of ATP and no interference by other species in the
complex medium surrounding the cells is observed.
a
3
4
5
I DS /
nA
to melanoma cells
no cells+ 10 µM ATP
cell surface
d = 750 µm
120 s
b
1000 500 0 -500
0.8
0.9
1.0
70 µM
30 µM
I DS /
nA
distance / µm
10 µM
c
d
1000 500 0
7.0
6.5
6.0
pH
distance / µm
3.5
4.0
4.5
5.0
I DS /
nA
Figure 49. Spatial and temporal ATP gradients released by melanoma cells are measured by the PPy FET nanosensor. First, the sensitivity is checked by adding ATP to the cell dish. The signal follows the sensor movement upon repetitive vertical approach and withdrawal from the cell. Additionally, a rise of the ATP level is observed with time. The measured ATP concentrations can reach to several tens of µM (b). Optical micrograph of the sensor positioned close to a melanoma cell. Control approach to cells with a non-modified PPy FET probe (d).
In a similar fashion the FET nanosensor is used to determine the ATP gradient originating
from a single cardiomyocyte (Figure 50 b). Here, submicromolar levels are found in the distance
and several µM are recorded close to the cardiomyocyte. Again, it is important to note that no pH
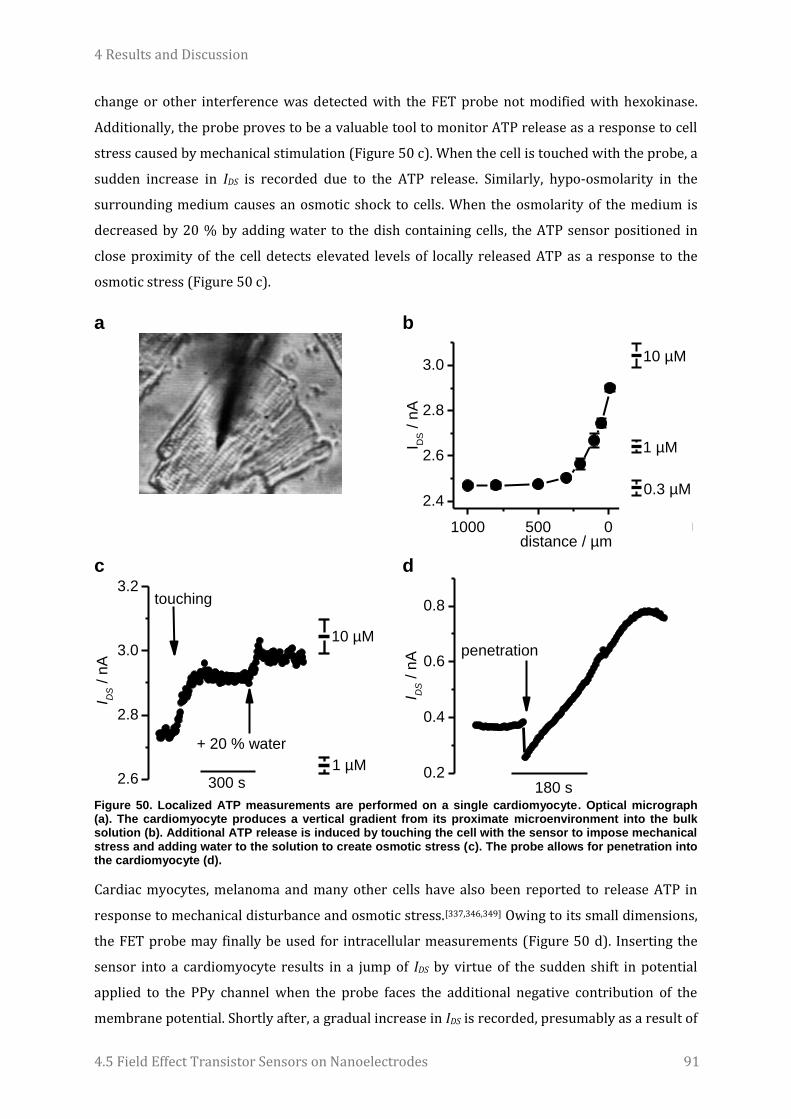
4 Results and Discussion
4.5 Field Effect Transistor Sensors on Nanoelectrodes 91
change or other interference was detected with the FET probe not modified with hexokinase.
Additionally, the probe proves to be a valuable tool to monitor ATP release as a response to cell
stress caused by mechanical stimulation (Figure 50 c). When the cell is touched with the probe, a
sudden increase in IDS is recorded due to the ATP release. Similarly, hypo-osmolarity in the
surrounding medium causes an osmotic shock to cells. When the osmolarity of the medium is
decreased by 20 % by adding water to the dish containing cells, the ATP sensor positioned in
close proximity of the cell detects elevated levels of locally released ATP as a response to the
osmotic stress (Figure 50 c).
a
b
1000 500 0 -500
2.4
2.6
2.8
3.010 µM
1 µMI DS /
nA
distance / µm
0.3 µM
c
2.6
2.8
3.0
3.2
+ 20 % water
10 µM
I DS /
nA
1 µM
touching
300 s
d
0.2
0.4
0.6
0.8
I DS /
nA
180 s
penetration
Figure 50. Localized ATP measurements are performed on a single cardiomyocyte. Optical micrograph (a). The cardiomyocyte produces a vertical gradient from its proximate microenvironment into the bulk solution (b). Additional ATP release is induced by touching the cell with the sensor to impose mechanical stress and adding water to the solution to create osmotic stress (c). The probe allows for penetration into the cardiomyocyte (d).
Cardiac myocytes, melanoma and many other cells have also been reported to release ATP in
response to mechanical disturbance and osmotic stress.[337,346,349] Owing to its small dimensions,
the FET probe may finally be used for intracellular measurements (Figure 50 d). Inserting the
sensor into a cardiomyocyte results in a jump of IDS by virtue of the sudden shift in potential
applied to the PPy channel when the probe faces the additional negative contribution of the
membrane potential. Shortly after, a gradual increase in IDS is recorded, presumably as a result of

4 Results and Discussion
4.5 Field Effect Transistor Sensors on Nanoelectrodes 92
the high intracellular ATP level. However, more thorough investigation of the intracellular
signals will be necessary before quantitative measurements can be made inside cells. In
conclusion, these examples of the applications of PPy-FET sensors based on dual carbon
nanoelectrodes demonstrate that this class of sensors shows excellent perspectives for sensitive
chemical analysis of physiological processes at the level of a single cell. Compared to
amperometric nanoelectrodes, FET nanodevices allow real-time monitoring of physiological
information with higher sensitivity due to their intrinsic amplification capabilities and high
signal-to-noise ratio. However, their fabrication requires complex protocols to place the sensing
nanomaterial between the source and drain contacts. To reduce electrochemical noise, these
contacts then have to be well isolated. Moreover, the large electrode size make their local access
to biological samples such as single cell a continuing challenge.[224,350,351] Nanometric dual carbon
electrodes are fabricated at low cost and provide an effective platform with which to create
novel FET nanobiosensors by generating a semiconductor link between two adjacent electrodes
exposed at the tip of the spear-shaped nanopipette.
The extracellular ATP concentration is a key biochemical constituent of the microenvironment of
both tumours and cardiac cells. For instance, it is well known that hypoxia causes ATP release
acting via purinoceptors.[337,352] Cardiac myocytes, melanoma and many other cells have also
been reported to release ATP in response to mechanical disturbance and osmotic stress.
[337,346,349] The PPy-FET probes can be functionalized to make an ATP nanobiosensor through
binding hexokinase to the PPy channel. The resulting nano-FET probe is capable of detecting
ATP concentrations down to 10 nM. A linear sensor response is observed in the concentration
range from 10 nM to 30 µM, with a sensitivity of 0.3 ± 0.2 dec-1. The sensitivity may be even
further increased by optimizing the binding efficiency and activity of the ATP-detecting
enzyme.[207] Due to its small dimensions and its spear-like design the nanobiosensor can
measure spatial concentration gradients originating from cell and follow changes of these
gradients in time. The measurement is not affected by any interferents in the complex biological
environment. ATP levels released from melanoma cells easily reach tens of µM. Similar
extracellular ATP concentrations have been observed previously from neonatal cardiac
myocytes.[346] Even higher levels, in the hundred micro-molar range, have been found in the
human melanoma microenvironment.[339]
In localized measurements, the distance of the detecting device to the probed cells is closely
related to the measured analyte concentration. In order to achieve absolute measurements,
precise distance control is necessary. The use of multiple-barrel nanopipettes[104] to approach
the nanobiosensor to about 100 nm from the cell surface under the feedback control of SICM or
under shear force control in SECM is envisaged. ATP release can be measured in close proximity
to the cell without disturbance and with sub-cellular resolution enabling high resolution

4 Results and Discussion
4.5 Field Effect Transistor Sensors on Nanoelectrodes 93
chemical imaging. However, yet the response time of a few seconds precludes the use of the
sensors in fast scanning probe protocols and thus needs further optimization. Such real-time
local detection of ATP release and its gradient at the single-cell level could be beneficial in the
understanding of cancer cell metabolism in heterogeneous tumor populations. In this work, the
possibility to insert the nanometric FET device into a cell for performing intracellular
measurements is demonstrated. In the future, after carefully assessing possible interferences in
the complex cytosolic matrix, applications may be expanded to the detection of substances
whose presence is restricted to the intracellular space.
Additionally, dual carbon nanoelectrodes could be used as a platform to construct new FET
sensors by employing others of the myriad of nanomaterials exhibiting semiconducting
properties giving rise to viable FET sensors.[209,212] Not only different materials for the transistor
channel may be tested but also specific functionalization of those materials may widen the scope
of such needle-type FET sensors. For instance, as it was shown previously, DNA[219,353,354] or
PNA[210] capture probes may be bound to the sensitive transistor to achieve selective detection
of DNA or proteins in or around single cells. This will be of high diagnostic value for biomedical
investigation.
4 Results and Discussion
4.6 Single Nanoparticle Electrochemistry 94
4.6 Single Nanoparticle Electrochemistry
Some experiments were performed by Denis Öhl, Ruhr-Universität Bochum, during a student
project. Parts of the following section are published in ref. [355]: “Clausmeyer, J.; Masa, J.; Ventosa,
E.; Öhl, D.; Schuhmann, W.; Chem. Commun. 2016, 52, 2408–2411”.
4.6.1 Electrocatalyst studies
The oxygen evolution reaction (OER) plays an important role in electrolyzers for
electrochemical water splitting. Energy is stored in the form of H2 which is produced at the
cathode and serves as a fuel for later consumption in fuel cells as well as a feedstock for a
number of industrial syntheses.[356] However, the efficiency of the overall water splitting
reaction is limited by the kinetics of the OER in alkaline (4 OH- O2 + 2 H2O + 4 e-) as well as
acidic (2 H2O O2 + 4 H+ + 4 e-) conditions. Hence, while the hydrogen evolution occurs at
relatively low overpotential, the OER still leads to a substantial energy loss during water
splitting. Catalyst materials for the OER need to be optimized to ensure energy storage as H2
with minimal energy losses. Designing new materials requires a deep understanding of the
mechanisms leading to enhanced electrocatalytic activity. Especially the knowledge about the
activity of materials for electrochemical water oxidation in relation to structure and size of
particles is still limited. It is the demand to understand the nature of the enhanced elec-
trocatalytic activity of nanostructured materials that motivates the development of suitable
analytical tools to characterize these challenging samples. For nanomaterials and in particular
catalytically active nanoparticles, the extraordinary (electro)catalytic activity results from a
number of different effects taking place at the nanoscale: The high number of coordination-
unsaturated surface and edge atoms leads to unique properties for the adsorption and
desorption of reactants and products which can affect the overall turnover rate for catalytic
conversion. Additionally, the fact that electrons are confined in a small particle volume results in
special electronic properties that may favor or disfavor catalytic reactions.[228] Finally, the small
particle dimensions result in fast transport of reactants, intermediates and products to and away
from the reactive interface which ensures high reaction rates but may also change the selectivity
of the catalytic reaction.[231] The catalytic activity of nanoparticles is a complex function of these
factors and only the deconvolution of these effects will help to identify the lead concepts for the
development of new highly active materials applied in energy and chemical conversion
devices.[230] However, the investigation of the individual contributions of different effects
governing the catalytic activity is hampered by the polydispersity of nanoparticle samples.
Nanoelectrodes allow to analyze single nanoparticles without averaging over large statistical en-
sembles. Nanoparticles can be directly deposited on or attached to nanoelectrodes. This strategy
ensures to study the catalytic reactions at single particles under high mass transport rates.
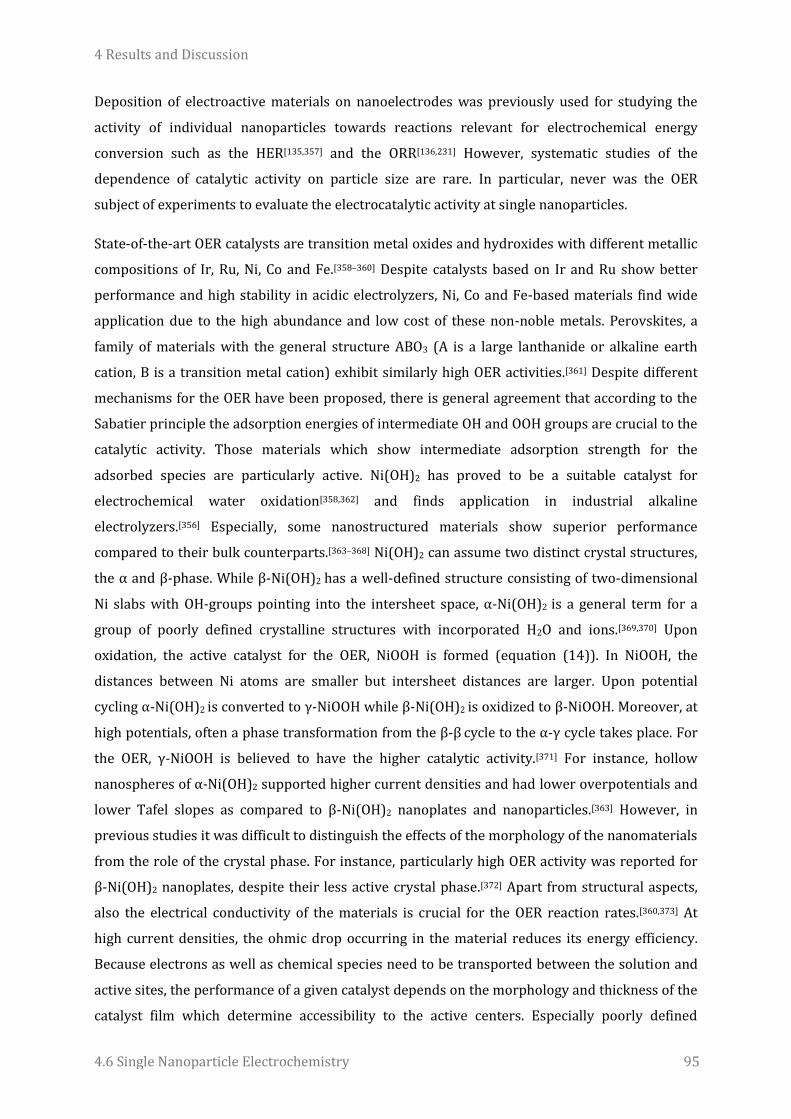
4 Results and Discussion
4.6 Single Nanoparticle Electrochemistry 95
Deposition of electroactive materials on nanoelectrodes was previously used for studying the
activity of individual nanoparticles towards reactions relevant for electrochemical energy
conversion such as the HER[135,357] and the ORR[136,231] However, systematic studies of the
dependence of catalytic activity on particle size are rare. In particular, never was the OER
subject of experiments to evaluate the electrocatalytic activity at single nanoparticles.
State-of-the-art OER catalysts are transition metal oxides and hydroxides with different metallic
compositions of Ir, Ru, Ni, Co and Fe.[358–360] Despite catalysts based on Ir and Ru show better
performance and high stability in acidic electrolyzers, Ni, Co and Fe-based materials find wide
application due to the high abundance and low cost of these non-noble metals. Perovskites, a
family of materials with the general structure ABO3 (A is a large lanthanide or alkaline earth
cation, B is a transition metal cation) exhibit similarly high OER activities.[361] Despite different
mechanisms for the OER have been proposed, there is general agreement that according to the
Sabatier principle the adsorption energies of intermediate OH and OOH groups are crucial to the
catalytic activity. Those materials which show intermediate adsorption strength for the
adsorbed species are particularly active. Ni(OH)2 has proved to be a suitable catalyst for
electrochemical water oxidation[358,362] and finds application in industrial alkaline
electrolyzers.[356] Especially, some nanostructured materials show superior performance
compared to their bulk counterparts.[363–368] Ni(OH)2 can assume two distinct crystal structures,
the α and β-phase. While β-Ni(OH)2 has a well-defined structure consisting of two-dimensional
Ni slabs with OH-groups pointing into the intersheet space, α-Ni(OH)2 is a general term for a
group of poorly defined crystalline structures with incorporated H2O and ions.[369,370] Upon
oxidation, the active catalyst for the OER, NiOOH is formed (equation (14)). In NiOOH, the
distances between Ni atoms are smaller but intersheet distances are larger. Upon potential
cycling α-Ni(OH)2 is converted to γ-NiOOH while β-Ni(OH)2 is oxidized to β-NiOOH. Moreover, at
high potentials, often a phase transformation from the β-β cycle to the α-γ cycle takes place. For
the OER, γ-NiOOH is believed to have the higher catalytic activity.[371] For instance, hollow
nanospheres of α-Ni(OH)2 supported higher current densities and had lower overpotentials and
lower Tafel slopes as compared to β-Ni(OH)2 nanoplates and nanoparticles.[363] However, in
previous studies it was difficult to distinguish the effects of the morphology of the nanomaterials
from the role of the crystal phase. For instance, particularly high OER activity was reported for
β-Ni(OH)2 nanoplates, despite their less active crystal phase.[372] Apart from structural aspects,
also the electrical conductivity of the materials is crucial for the OER reaction rates.[360,373] At
high current densities, the ohmic drop occurring in the material reduces its energy efficiency.
Because electrons as well as chemical species need to be transported between the solution and
active sites, the performance of a given catalyst depends on the morphology and thickness of the
catalyst film which determine accessibility to the active centers. Especially poorly defined

4 Results and Discussion
4.6 Single Nanoparticle Electrochemistry 96
porous architectures complicated the identification of activity trends for OER catalysts because
of the difficulty to compare surface areas, the number of electrochemically active sites, and
electron/mass transport properties.[356]
Carbon nanoelectrodes are suitable to investigate the electrocatalytic activity of individual
Ni(OH)2 particles for the OER. The single particles are good model systems because particle sizes
and mass transfer properties are well defined. Ni(OH)2 is deposited cathodically on the carbon
nanoelectrodes from a solution of 5 mM NiCl2 at potentials between -1 V and -1.2 V vs.
Ag/AgCl/3 M Cl-. Presumably, the material is deposited as metallic nickel but undergoes
spontaneous transformation into NiO and Ni(OH)2.[360] Different electrolysis times are tested to
control the amount of deposited Ni(OH)2 and thus particle sizes. However, only little correlation
was found between the electrolysis time and the Ni(OH)2 amount. However, the amount of
deposited material and thus the particle sizes can be precisely measured by both SEM and an
electrochemical method. SEM images of various single nanoparticle electrodes show nearly
spherical Ni(OH)2 particles located at the tip of carbon nanoelectrodes. Due to the small
dimensions of the carbon nanoelectrode, the particles are larger than the tip diameter (Figure
51). The particle sizes range from 20 nm to 500 nm.
Figure 51. Ni(OH)2 is deposited as spherical nanoparticles on the tip of carbon nanoelectrodes. The particle dimensions are in good agreement with the electrochemically estimated particle radii. Scale bars are 500 nm (first three from left) and 200 nm (small inset on the right). The electrochemically estimated radii are 446, 227, 186 and 55 nm from left to right.
The composition and structure of OER catalysts is crucial for the electrochemical activity.[359,366]
The elemental composition of the particles was tested by energy-dispersive X-ray spectroscopy
(EDX) (Figure 52). The EDX spectrum shows strong signals for the Ni K and L transitions as well
as signals attributed to Si, O and C, the constituents of the SiO2-insulated carbon electrode. Apart
from small signals attributed to Al, which are presumably originating from the aluminum sample
holders and residual K, no other elements are detectable.
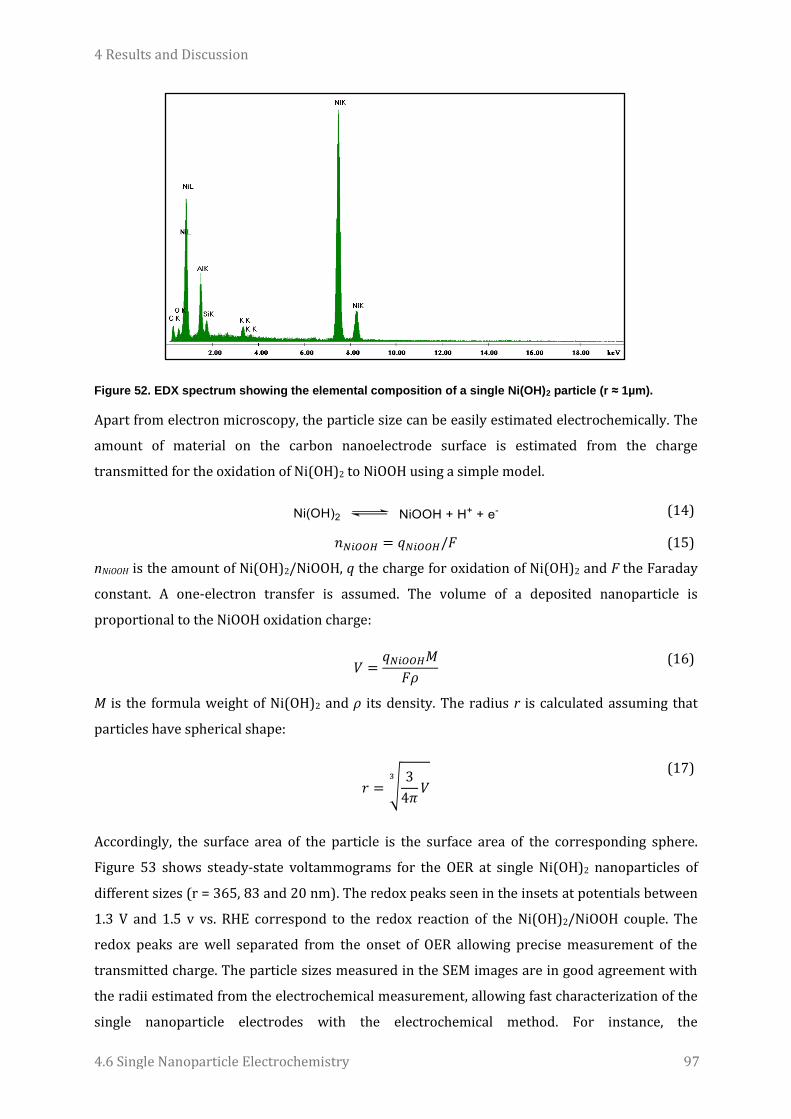
4 Results and Discussion
4.6 Single Nanoparticle Electrochemistry 97
Figure 52. EDX spectrum showing the elemental composition of a single Ni(OH)2 particle (r ≈ 1µm).
Apart from electron microscopy, the particle size can be easily estimated electrochemically. The
amount of material on the carbon nanoelectrode surface is estimated from the charge
transmitted for the oxidation of Ni(OH)2 to NiOOH using a simple model.
(14)
𝑛𝑁𝑖𝑂𝑂𝐻 = 𝑞𝑁𝑖𝑂𝑂𝐻/𝐹 (15)
nNiOOH is the amount of Ni(OH)2/NiOOH, q the charge for oxidation of Ni(OH)2 and F the Faraday
constant. A one-electron transfer is assumed. The volume of a deposited nanoparticle is
proportional to the NiOOH oxidation charge:
𝑉 =
𝑞𝑁𝑖𝑂𝑂𝐻𝑀
𝐹𝜌
(16)
M is the formula weight of Ni(OH)2 and ρ its density. The radius r is calculated assuming that
particles have spherical shape:
𝑟 = √3
4𝜋𝑉
3
(17)
Accordingly, the surface area of the particle is the surface area of the corresponding sphere.
Figure 53 shows steady-state voltammograms for the OER at single Ni(OH)2 nanoparticles of
different sizes (r = 365, 83 and 20 nm). The redox peaks seen in the insets at potentials between
1.3 V and 1.5 v vs. RHE correspond to the redox reaction of the Ni(OH)2/NiOOH couple. The
redox peaks are well separated from the onset of OER allowing precise measurement of the
transmitted charge. The particle sizes measured in the SEM images are in good agreement with
the radii estimated from the electrochemical measurement, allowing fast characterization of the
single nanoparticle electrodes with the electrochemical method. For instance, the
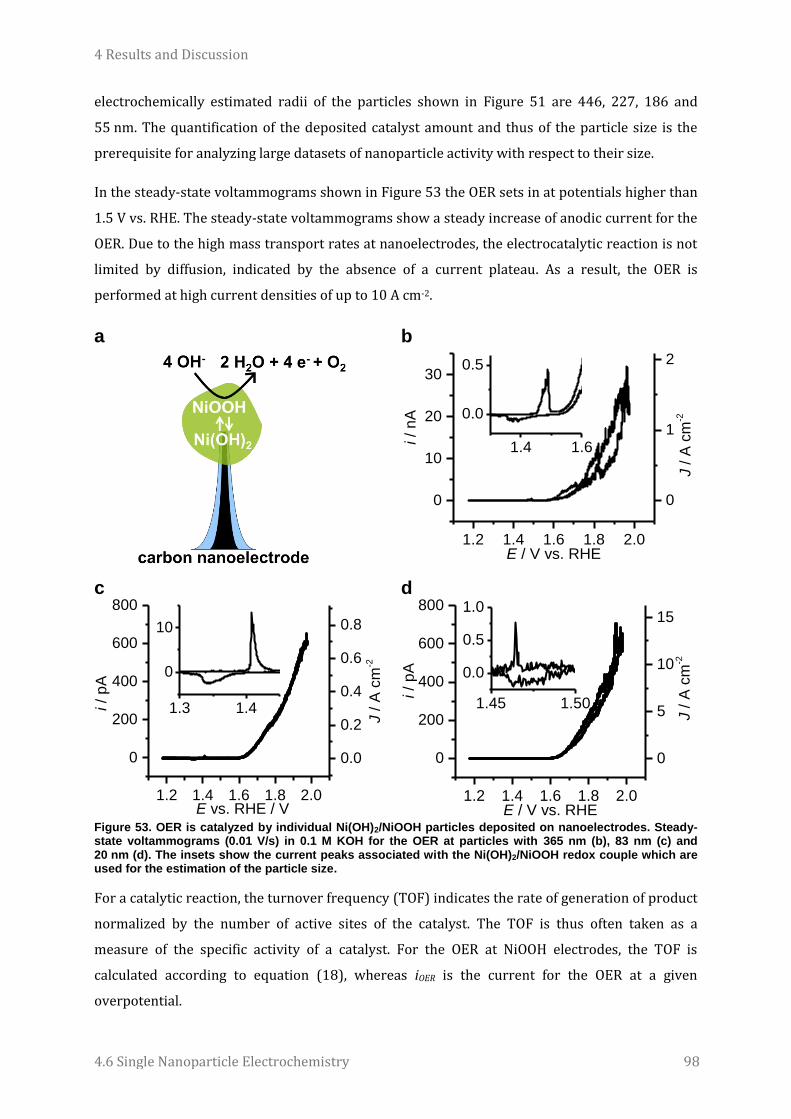
4 Results and Discussion
4.6 Single Nanoparticle Electrochemistry 98
electrochemically estimated radii of the particles shown in Figure 51 are 446, 227, 186 and
55 nm. The quantification of the deposited catalyst amount and thus of the particle size is the
prerequisite for analyzing large datasets of nanoparticle activity with respect to their size.
In the steady-state voltammograms shown in Figure 53 the OER sets in at potentials higher than
1.5 V vs. RHE. The steady-state voltammograms show a steady increase of anodic current for the
OER. Due to the high mass transport rates at nanoelectrodes, the electrocatalytic reaction is not
limited by diffusion, indicated by the absence of a current plateau. As a result, the OER is
performed at high current densities of up to 10 A cm-2.
a
b
1.2 1.4 1.6 1.8 2.0
0
10
20
30
i /
nA
E / V vs. RHE
0
1
2
J /
A c
m-2
1.4 1.6
0.0
0.5
c
1.2 1.4 1.6 1.8 2.0
0
200
400
600
800
i /
pA
E vs. RHE / V
1.3 1.4
0
10
0.0
0.2
0.4
0.6
0.8
J /
A c
m-2
d
1.2 1.4 1.6 1.8 2.0
0
200
400
600
800
i /
pA
E / V vs. RHE
0
5
10
15
J /
A c
m-2
1.45 1.50
0.0
0.5
1.0
Figure 53. OER is catalyzed by individual Ni(OH)2/NiOOH particles deposited on nanoelectrodes. Steady-state voltammograms (0.01 V/s) in 0.1 M KOH for the OER at particles with 365 nm (b), 83 nm (c) and 20 nm (d). The insets show the current peaks associated with the Ni(OH)2/NiOOH redox couple which are used for the estimation of the particle size.
For a catalytic reaction, the turnover frequency (TOF) indicates the rate of generation of product
normalized by the number of active sites of the catalyst. The TOF is thus often taken as a
measure of the specific activity of a catalyst. For the OER at NiOOH electrodes, the TOF is
calculated according to equation (18), whereas iOER is the current for the OER at a given
overpotential.
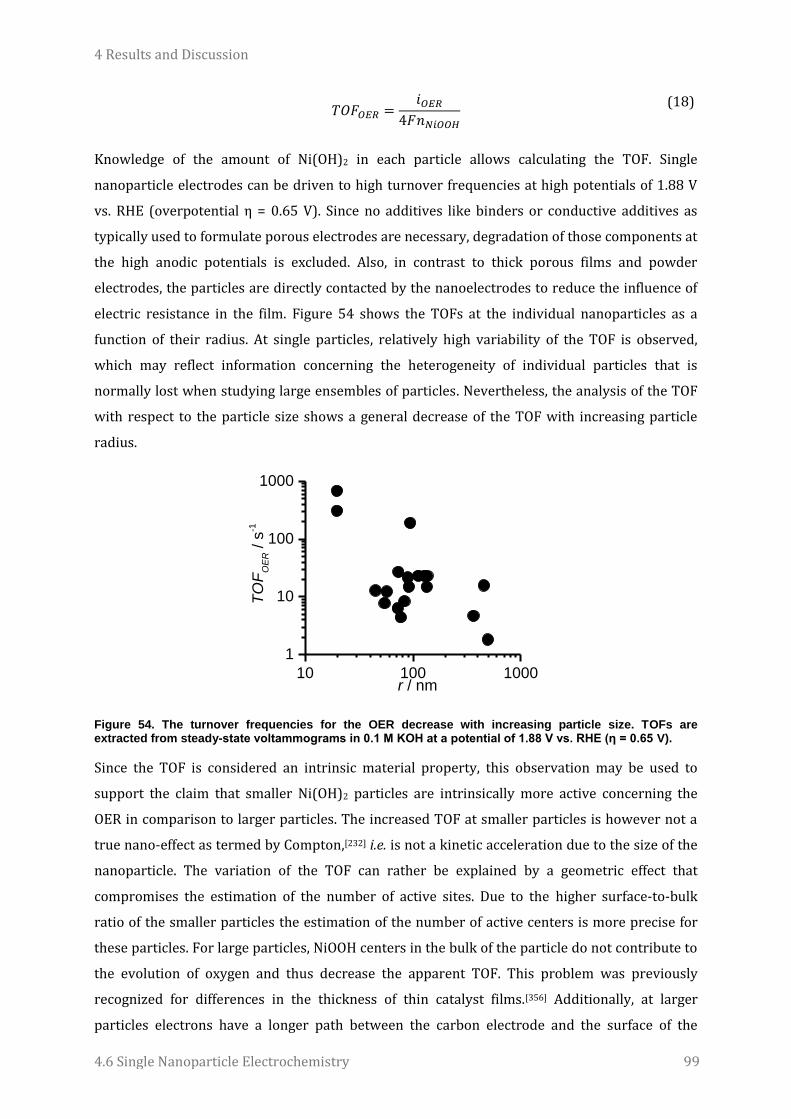
4 Results and Discussion
4.6 Single Nanoparticle Electrochemistry 99
𝑇𝑂𝐹𝑂𝐸𝑅 =
𝑖𝑂𝐸𝑅
4𝐹𝑛𝑁𝑖𝑂𝑂𝐻
(18)
Knowledge of the amount of Ni(OH)2 in each particle allows calculating the TOF. Single
nanoparticle electrodes can be driven to high turnover frequencies at high potentials of 1.88 V
vs. RHE (overpotential η = 0.65 V). Since no additives like binders or conductive additives as
typically used to formulate porous electrodes are necessary, degradation of those components at
the high anodic potentials is excluded. Also, in contrast to thick porous films and powder
electrodes, the particles are directly contacted by the nanoelectrodes to reduce the influence of
electric resistance in the film. Figure 54 shows the TOFs at the individual nanoparticles as a
function of their radius. At single particles, relatively high variability of the TOF is observed,
which may reflect information concerning the heterogeneity of individual particles that is
normally lost when studying large ensembles of particles. Nevertheless, the analysis of the TOF
with respect to the particle size shows a general decrease of the TOF with increasing particle
radius.
10 100 1000
1
10
100
1000
TO
FO
ER /
s-1
r / nm
Figure 54. The turnover frequencies for the OER decrease with increasing particle size. TOFs are extracted from steady-state voltammograms in 0.1 M KOH at a potential of 1.88 V vs. RHE (η = 0.65 V).
Since the TOF is considered an intrinsic material property, this observation may be used to
support the claim that smaller Ni(OH)2 particles are intrinsically more active concerning the
OER in comparison to larger particles. The increased TOF at smaller particles is however not a
true nano-effect as termed by Compton,[232] i.e. is not a kinetic acceleration due to the size of the
nanoparticle. The variation of the TOF can rather be explained by a geometric effect that
compromises the estimation of the number of active sites. Due to the higher surface-to-bulk
ratio of the smaller particles the estimation of the number of active centers is more precise for
these particles. For large particles, NiOOH centers in the bulk of the particle do not contribute to
the evolution of oxygen and thus decrease the apparent TOF. This problem was previously
recognized for differences in the thickness of thin catalyst films.[356] Additionally, at larger
particles electrons have a longer path between the carbon electrode and the surface of the

4 Results and Discussion
4.6 Single Nanoparticle Electrochemistry 100
particles. Because NiOOH has a relatively low electronic conductivity,[361,374,375] a substantial
potential drop may occur in large particles due to the electric resistance. The resulting
overpotential could be an additional explanation for the lower TOFs at large particles. Similar
findings were made by Zou et al. who investigated the TOF for the OER as a function of the film
thickness of Fe(oxy)hydroxide films.[373] The authors observed a decrease of TOFs with
increasing mass loading of the electrodes and ascribed it to the growing influence of the limited
electrical conductivity when the films become thicker.
An increased specific activity at smaller particles can however be excluded by comparing the
electrode kinetics at small and large particles. A common descriptor of electrode kinetics is the
Tafel slope which is extracted from a linear fit of an E vs. log J plot (or log J vs. E) assuming
Butler-Volmer kinetics:
𝐽 = 𝐽0 {exp (
𝛼𝑧𝐹(𝐸 − 𝐸0)
𝑅𝑇) − exp (
(1 − 𝛼)𝑧𝐹(𝐸 − 𝐸0)
𝑅𝑇) }
(19)
J0 is the exchange current density, α the charge transfer coefficient and E0 the equilibrium
potential, all other symbols have their usual significance. When the overpotential for the forward
or backward reaction becomes sufficiently large, the other exponential term becomes negligibly
small and the Butler-Volmer equation assumes Tafel form. The Tafel slope is only dependent on
the reaction mechanism but not on the surface area, mass loading or number of active sites on
the electrode. Hence Tafel slopes are a good descriptor of intrinsic activity of a material.[360]
Tafel analysis in the low overpotential region of the OER at single Ni(OH)2 particles reveals that
the electrode kinetics are largely invariant with the particle size. Figure 55 a shows Tafel plots
for a small and a large nanoparticle. Note that J is plotted against E and thus, the slope observed
in the graph is the reciprocal of the Tafel slope. Both curves exhibit similarly low slopes in the
low overpotential region between 1.57 and 1.66 V vs. RHE (η = 0.34 and η = 0.43 V) followed by
larger values at higher potentials. While the final current densities at high overpotential vary
between particles, the Tafel slopes extracted in the low overpotential region range around the
same values for all analyzed particles (Figure 55 b). Comparing the values for the Tafel slope
over the whole population of individually analyzed particles yields an average slope of 0.05 ±
0.01 V dec-1. This value is in agreement with values reported in the literature for highly active
OER catalysts.[363,365,366] The Tafel slope is a parameter describing the electrode kinetics of the
electrochemical reaction. Thus, these findings indicate that the electron transfer kinetics for the
OER do not depend on the particle size of the Ni(OH)2 particles. The similar Tafel slopes for all
particles do not explain the observed differences in TOF (Figure 54). At small particles the true
number of active sites can be estimated with higher precision because of the increased fraction
of active centers located in direct contact with the electrode and the electrolyte solution. These

4 Results and Discussion
4.6 Single Nanoparticle Electrochemistry 101
findings highlight that the TOF is generally underestimated due to the difficulties in determining
the number of active sites, especially at large particles or thick porous catalyst films on
macroscopic electrodes. Also, in thick film or powder electrodes, electronic conductivity may
have a detrimental influence on the reaction rate, which might be already seen at larger
nanoparticles in this study.
a
1.6 1.8 2.0
-3
-2
-1
0
1
log
10 (
J /
A c
m-2)
E vs. RHE / V
b
10 100 1000
0.04
0.06
0.08
0.10
0.12
Ta
fel slo
pe
/ V
de
c-1
r / nm Figure 55. Electron transfer kinetics for the OER at NiOOH nanoparticles do not depend on particle size. Tafel plots for a large nanoparticle (r = 365 nm) and a small particle (r = 20 nm) (a). Analysis of Tafel slopes in the low overpotential region between 1.57 and 1.66 V vs. RHE as a function of the particle radius.
A strong effect of extensive potential cycling (conditioning) is observed for the activity of
Ni(OH)2 nanoparticles for the OER. Conditioning of Ni(OH)2 is often performed to induce a
change in the crystal phase of the material which alters the electrochemical activity for the
OER.[369] Whereas some authors report a catalytic activation by conditioning,[366,371,375] a
deactivating effect[363,368] is observed for the single nanoparticles in this study. After potential
cycling in 0.1 M KOH in the range 1 V - 1.8 V vs. RHE for at least 500 cycles, the conditioned
particles show a higher onset potential for the OER (Figure 56 a) as compared to as-grown
particles. Also, the measured Tafel slopes in the range between 1.68 and 1.88 V vs. RHE are
significantly higher than for as-grown particles (Figure 56 b). For most particles after
conditioning the Tafel slopes range between 0.15 and 0.2 V dec-1. However, some particles,
predominantly small ones, show very slow electron transfer kinetics with Tafel slopes up to
0.6 V dec-1. Correspondingly, due to the slow electrochemical reaction, the TOF after
electrochemical conditioning are lowered (Figure 56 c). Interestingly, the smaller nanoparticles
with radii below 100 nm seem to be more strongly influenced by this deactivation. Even though
this effect contradicts the common notion that small particles are more active in catalytic
reactions, this observation is a true nano-effect. The specific catalytic activity for the OER,
determined by the reaction kinetics, depends on the particle size, however in an undesired way.
The nature of the change in material properties when the Ni(OH)2 particles are subjected to
potential cycling in alkaline solution still needs to be further investigated.

4 Results and Discussion
4.6 Single Nanoparticle Electrochemistry 102
a
1.6 1.8 2.0
-4
-3
-2
-1
0
log
10 (
J /
A c
m-2)
E vs. RHE / V
b
10 100 1000
0.0
0.2
0.4
0.6
Ta
fel slo
pe
/ V
de
c-1
r / nm
c
10 100 1000
0.1
1
10
100
1000
TO
FO
ER /
s-1
r / nm
Figure 56. Potential cycling in KOH deactivates Ni(OH)2 nanoparticles for the OER. Conditioned particles show a higher OER onset potential (a), larger Tafel slopes (a, b) and lower turnover frequencies (c) than as-deposited particles. Particle radii 111 nm for the as-deposited and 71 nm for the conditioned particle in (a). Tafel slopes for conditioned particles extracted in the range 1.68 V to 1.88 V.
The change of OER activity could be due to a transformation of the crystal phase. Many authors
report that Ni(OH)2 synthesized by cathodic deposition is predominantly α-Ni(OH)2.[369,376] Upon
oxidation, α-Ni(OH)2 forms γ-NiOOH. Upon overcharging in aqueous alkaline solution α-Ni(OH)2
transforms into β-Ni(OH)2 which reacts to β-NiOOH upon oxidation. There is generally little
consent in the literature concerning the most active phase for the OER. Previously β-NiOOH was
believed to be the more active OER catalyst.[365,368] Novel insights show that the α-Ni(OH)2 → γ-
NiOOH couple is responsible for the high catalytic activity.[363,371] Also the role of impurities
incorporated into the Ni(OH)2 lattice has been discussed recently.[377] Trotochaud et al. have
proposed that NiOOH is only active for the OER in the presence of Fe impurities.[375] By potential
cycling in electrolyte solution containing Fe impurities, the activity for OER changed drastically.
Because of their high surface area, nanoparticles are particularly prone to quickly take up or
release ions or water molecules from the electrolyte solution.
However, without the possibility of further structural characterization of the Ni(OH)2 particles,
the observed transformation remains elusive. The most commonly used methods for
characterization of the crystal structure, x-ray diffraction (XRD) techniques, are not applicable to
the analysis of single nanoparticles. Thus, the exploitation of Selected Area Electron Diffraction

4 Results and Discussion
4.6 Single Nanoparticle Electrochemistry 103
(SAED) for single nanoparticles on nanoelectrodes is anticipated. Because the technique is
performed in a Transmission Electron Microscope (TEM), first studies reporting TEM images of
nanoparticles in such a configuration[135,136] may be an indicator of the feasibility of SAED
characterization. As the electrochemical activity of individual particles could not only be
correlated to particle size but also to structure, an additional tool for structure characterization
would largely enhance the scope of the method.
4.6.2 Study of energy storage materials
Despite its utility as a catalyst for the OER, the Ni(OH)2/NiOOH redox couple has been widely
used in highly dispersed materials for energy storage in aqueous batteries and pseudo-
capacitors. While batteries store energy in faradaic redox reactions or intercalation processes in
the bulk of the material, electrochemical capacitors store energy by charging the electrochemical
double layer at the material surface. Pseudo-capacitors are devices that exploit faradaic
reactions which are confined to species only located at the surface or near-surface. This
conceptual difference has important implications for the speed of charge release or uptake. Due
to fast charge transfer at the surface, capacitors and pseudo-capacitors cater for high power
densities. Batteries generally have a higher energy density but are limited in charge/discharge
rate due to slow diffusion in the bulk material.[378] The general paradigm is that surface or near-
surface reactions, i.e. pseudo-capacitive contributions to the charge storage become more
important with decreasing material dimensions. Ni(OH)2 is frequently referred to as a battery
material[369,376,379–383] but also as a pseudo-capacitor material.[364,384–386] Brousse et al. highlighted
the misidentification of the two concepts in the literature for various materials.[387]
Nanoelectrodes are a good tool to investigate the predominant charge storage mechanism at
nanoparticulate energy storage materials. The nanoelectrode is in direct contact with the
nanoparticle which minimizes the detrimental effect of electrical resistance that otherwise
occurs in thick porous film or powder electrodes. In addition, when analyzing the diffusion of
charge carriers in bulk materials, the influence of diffusion in the electrolyte can be excluded
because diffusional mass transport at the small electrode dimensions is fast and non-limiting.
Voltammetric analysis of the Ni(OH)2 → NiOOH + H+ + e- transition reveals a linear dependence
of the corresponding anodic peak currents with respect to the scan rate (Figure 57). The trend
line of the log ipa vs. log v plot shows a slope close to the theoretical value of 0.5 expected for a
diffusion-controlled process, as opposed to a value of 1 for a surface-confined species (i.e. a
pseudo-capacitive process). Hence, it is the diffusion of protons inside the bulk of the Ni(OH)2
nanoparticle that limits the overall oxidation reaction. Due to the analogy to a macroscopic
electrode with diffusion-limitation in the electrolyte, the Randles-Sevcik equation (20) can be

4 Results and Discussion
4.6 Single Nanoparticle Electrochemistry 104
used to describe the voltammetric peak currents at the nanoelectrode with diffusion-limitation
in the particle bulk.[380]
𝑖𝑝 = 0.4463(𝑧𝐹)
32𝐴𝑐𝐷
12(𝑅𝑇)
12 ∙ 𝑣
12
(20)
ip is the voltammetric peak current, A is the surface area of the electrode (in this case of the
particle), v is the scan rate and all other symbols have their usual significance.
a
1.0 1.2 1.4 1.6 1.8
-20
0
20
i /
pA
E / V vs. RHE
b
-2.0 -1.5 -1.0 -0.5 0.0
-12
-11
log
10 (
i pa /
A)
log10
(v / V s-1)
pseudo-capacitive
slope = 1
linear fit
slope = 0.48
diffusion
slope = 0.5
Figure 57. The oxidation of Ni(OH)2 nanoparticles is limited by proton diffusion in the particle bulk. Cyclic voltammograms at a single Ni(OH)2 nanoparticle (r = 75 nm) electrode at varying scan rates from 0.01 to 0.5 Vs
-1 in 0.1 M KOH (a) and analysis of anodic peak currents as a function of the scan rate (b).
The proton diffusion coefficients at single Ni(OH)2 nanoparticles are calculated from the
Randles-Sevcik equation using the electrochemically estimated particle surface area of the
spherical particles assuming stoichiometric proton release. The nominal bulk concentration of
protons in Ni(OH)2 is ρ/M and amounts to 44.7 mol l-1. The calculated diffusion coefficients
range around 2 x 10-11 cm2 s-1 for particles smaller than r = 75 nm. Slower apparent diffusion is
observed for larger particles. This might be due to the contribution of poor electronic
conductivity of Ni(OH)2 which becomes more important for long electron paths inside larger
particles. There is a large variation of values for the proton diffusion coefficient in Ni(OH)2
reported in the literature. The values range from 10-11 to 10-7 cm2 s-1 [374,376,379,380,382] which might
reflect the challenge in finding appropriate models due to the difficulty in investigating thick
porous film electrodes. Also, at macroscopic electrodes the slow diffusion in the electrolyte
solution as well as the internal electric resistance in film or powder electrodes might interfere
with the precise measurement of the diffusion coefficient.
In conclusion, studying the electrochemistry of single nanoparticles deposited on carbon
nanoelectrodes has several advantages: 1) Extremely fast mass transport rates are obtained
which by far exceed those accessible in rotating ring-disk electrode experiments.[231] 2) The
particles are directly contacted with low resistance. In addition, possible degradation of non-
active components at the high potentials necessary for the OER can be excluded. 3)
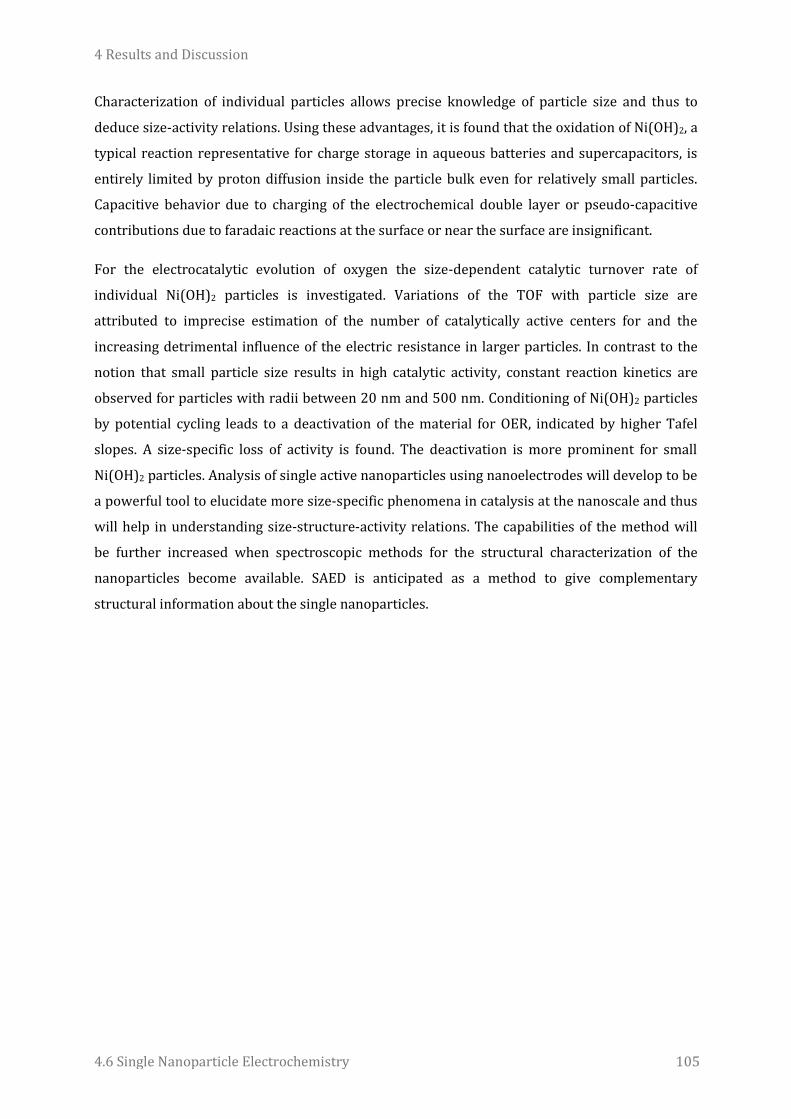
4 Results and Discussion
4.6 Single Nanoparticle Electrochemistry 105
Characterization of individual particles allows precise knowledge of particle size and thus to
deduce size-activity relations. Using these advantages, it is found that the oxidation of Ni(OH)2, a
typical reaction representative for charge storage in aqueous batteries and supercapacitors, is
entirely limited by proton diffusion inside the particle bulk even for relatively small particles.
Capacitive behavior due to charging of the electrochemical double layer or pseudo-capacitive
contributions due to faradaic reactions at the surface or near the surface are insignificant.
For the electrocatalytic evolution of oxygen the size-dependent catalytic turnover rate of
individual Ni(OH)2 particles is investigated. Variations of the TOF with particle size are
attributed to imprecise estimation of the number of catalytically active centers for and the
increasing detrimental influence of the electric resistance in larger particles. In contrast to the
notion that small particle size results in high catalytic activity, constant reaction kinetics are
observed for particles with radii between 20 nm and 500 nm. Conditioning of Ni(OH)2 particles
by potential cycling leads to a deactivation of the material for OER, indicated by higher Tafel
slopes. A size-specific loss of activity is found. The deactivation is more prominent for small
Ni(OH)2 particles. Analysis of single active nanoparticles using nanoelectrodes will develop to be
a powerful tool to elucidate more size-specific phenomena in catalysis at the nanoscale and thus
will help in understanding size-structure-activity relations. The capabilities of the method will
be further increased when spectroscopic methods for the structural characterization of the
nanoparticles become available. SAED is anticipated as a method to give complementary
structural information about the single nanoparticles.

5 Conclusions and Outlook
106
5 Conclusions and Outlook
Sophisticated micro- and nanoelectrochemical tools are required in many fields of research
ranging from biomedicine to electrocatalysis. The present work shows the development and
application of electrochemical methods based on micro- and nanoelectrodes for controlled local
modification of surfaces as well as the electrochemical analysis of micro- and nanoscopic
entities.
Electrochemical methods are attractive alternatives to the established methods for micro- and
nanopatterning. Carbon surfaces modified with different electrochemically addressable surface
functional groups are locally activated toward the immobilization of biomolecules. In the direct
mode of SECM current pulses are applied for the local cleavage of TBDMS protecting groups
from surface-confined p-hydroquinone as well as for the local reduction of NO2 groups to yield
NH2 groups. The locally activated spots on the inert surface are suitable to capture and
immobilize model molecules such as alkaline phosphatase. Moreover, SECM proves useful to
image the generated micropatterns and gives evidence for the anticipated local surface reaction
as well as for the successful immobilization of target proteins. As an alternative strategy, the
scanning droplet cell is proposed for efficient triggering and control of the electrochemical
surface modifications. The technique yields unambiguous proof for the chemoselectivity of the
local activation and has the potential for further improvement of the patterning resolution.
As a versatile platform to build electrochemical nanosensors for various applications, carbon
nanoelectrodes are proposed. The needle-type electrodes are made by pyrolytic decomposition
of carbon precursor gas inside pulled quartz nanopipettes. The fabrication procedure ensures a
high success rate and control of the electrode geometry. The nanoelectrodes are well suited for
the analysis of single living cells as well as for the study of electrochemically active
nanoparticles. Their pointy shape and small overall dimensions allow precise positioning in
three dimensions and highly localized measurements to target single cells. Analytical methods to
probe the physiological state of a single living cell are advantageous to evaluate the influence of
various chemical and physical stimuli on cell function and monitor individual cell fate pathways
in the context of pathological conditions. Moreover, malignant cells may be identified by their
characteristic metabolic fingerprints.
To evaluate oxygen metabolism rates as well as the detrimental effect of reactive oxygen species
on cell viability, amperometric sensors based on modified carbon electrodes are used to probe
cells. Carbon nanoelectrodes modified with Pt black show high sensitivity for oxygen and
reactive oxygen species. The nanosensors’ capability for intracellular measurements is
5 Conclusions and Outlook
107
demonstrated by inserting the electrodes into single neurons in a tissue. The total sum of
reactive oxygen and nitrogen species is detected inside the cells by anodic oxidation at high
potentials.
More elaborated sensor designs are proposed to increase the selectivity of the detection in
complex biological matrices. By deposition of Prussian Blue, the carbon electrodes are sensitized
to the reduction and oxidation of hydrogen peroxide. The mild potential applied for the cathodic
reduction of H2O2 largely excludes interferences by other oxidizable substances. However, to
assure chemical and mechanical stability of the PB film, the electrocatalyst needs to be deposited
and buried into etched nanocavities at the tip of the carbon electrodes. The resulting
nanosensors are capable of detecting H2O2 with a dynamic detection range between micromolar
and millimolar concentration and are sufficiently stable to be used in experiments for single cell
analysis. Extracellular H2O2 is detected after stimulation of ROS production. Upon inserting the
PB-modified nanoelectrodes into dorsal root ganglia neurons and macrophage cells the sensors
record cathodic current spikes corresponding to the reduction of intracellular H2O2. When a
specific inhibitor of catalase is added to the medium, the cells need substantially more time to
recover from the oxidative burst because the cells’ natural protection mechanism against H2O2 is
weakened by inhibition of catalase. These observations highlight the utility of the H2O2-sensitive
probes for the evaluation of the antioxidant capabilities of cells and might help to associate their
dysfunctionality with malignant phenotypes. More experiments involving reagents to
specifically stimulate the production of ROS will help to establish the method and may finally
lead to the application of the technique for the identification of pathogenic conditions at the
single-cell level.
The currents for the faradaic detection reactions of these amperometric nanosensors are below
the pA range. The sensitivity of the sensors is limited by the performance of the potentiostats
and current amplifiers used. As a more sensitive alternative, potentiometric sensors for the
detection of faradaic processes are proposed. A thin but dense film of redox active species
immobilized on the nanoelectrode, for instance the PB films introduced in this work, dictates the
Nernstian potential of the electrode. The analyte undergoes reactions with redox centers in the
film and thus changes the redox state of the sensor, which results in a measurable change of the
electrode open circuit potential. In contrast to amperometric sensors, the sensitivity of this
potentiometric sensor increases with decreasing dimensions of the redox active film on the
electrode. First experiments for PB-modified electrodes in the context of H2O2 detection show
promising results for the enhancement of sensitivity at electrochemical nanosensors.
An additional strategy for improving the analytical performance of nanosensors is proposed:
The intrinsic high sensitivity of field effect transistor sensors is combined with the high spatial
5 Conclusions and Outlook
108
resolution of nanopipette-based methods. A FET sensor is created by depositing polypyrrole on
dual carbon nanoelectrodes. The two carbon electrodes serve as drain and source contacts while
the PPy nanojunction comprises the sensitive transistor channel. The device shows typical
reversible modulation of the drain-source current by changing the redox state of the conducting
polymer. The FET sensors at the tip of the dual nanopipettes are sensitive to pH changes. The
needle-type design of the probe and the small overall dimensions allow to measure the pH value
in microenvironments around cells. First results show that the method could be used to identify
cancerous cells by their characteristic acidification of the environment.
Moreover, the pH sensitivity of the FET nanosensors is converted into sensitivity for ATP. By
attaching hexokinase to the transistor channel, the FET detects protons released from the
enzymatic cleavage of ATP. The FET probe can specifically measure ATP released from
melanoma and cardiomyocyte cells. Due to the high localization the sensor can follow
concentration gradients in space and records dynamic changes in the ATP level. Single cells are
targeted and the ATP release upon mechanical and osmotic stimulation is measured. Finally, the
small dimensions allow puncturing the cell membrane and perform intracellular measurements.
The described nanosensor using PPy as the transistor channel is a first example of the
capabilities of FET sensors based on double barrel pipettes. Other materials could be deposited
on dual carbon electrodes to create FET sensors with different properties and possible analytes.
Moreover, the FET channel could be decorated with biological recognition elements or capture
probes to enlarge the scope of the method for sensing of biomolecules such as DNA or proteins
with high specificity. For chemical imaging and three-dimensional mapping of analyte
concentrations the combination of the proposed FET sensors with Scanning Ion Conductance
Microscopy and Scanning Electrochemical Cicroscopy are envisaged. By using multi-barrel
capillaries additional carbon nanoelectrodes or nanopipettes could be employed for controlling
the tip-to-sample distance using SECM or SICM, respectively.
Another interesting application of nanoelectrodes is in the investigation of the electrochemical
activity of single nanoparticles. Electrochemical reactions at nanoparticles are conducted at high
mass transport rates and without the detrimental influence of electrical resistance in thick
porous films or ionic resistance. Herein, the oxygen evolution reaction is studied for the first
time at individual nanoparticles. The electrode serves as a template for the deposition of
nanoparticles from Ni(OH)2, an efficient catalyst for electrochemical water oxidation. The
electrochemical activity for the OER is correlated with the particle size, which is precisely
estimated from the charge transferred for the oxidation of Ni(OH)2. Turnover frequencies for the
OER decrease with increasing particle size. This is however not a “nano-effect”, i.e. an increase of
the reaction rate due to the small particle size. Intrinsic electron transfer kinetics, as described
by Tafel slopes are invariant with particle size in the investigated range between 20 and 500 nm.
5 Conclusions and Outlook
109
Ni(OH)2 is also investigated regarding its good properties as an energy storage material in
aqueous batteries and supercapacitors. The investigation of the charge storage in the
oxidation/reduction of the Ni(OH)2/NiOOH couple shows that this process is entirely limited by
the diffusion of protons inside the bulk material, even at relatively small nanoparticles. This
observation contradicts some reports that claim Ni(OH)2 is a pseudo-capacitive material, i.e. that
charge is stored in surface or near-surface reactions.
Investigating the electrochemical properties of individual nanoparticles at nanoelectrodes in
non-ensemble measurements is advantageous because the electrochemical behavior can be
directly correlated to particle size. This will help to understand the relationship between
geometry and size of electrocatalytically active particles. Moreover, because the particles are
stably attached to the electrodes, additional structural characterization might be possible. For
instance, selected area electron diffraction in the transmission electron microscope conducted
on the single particles will lead to a deeper understanding of the factors governing the catalytic
activity of nanostructured materials.
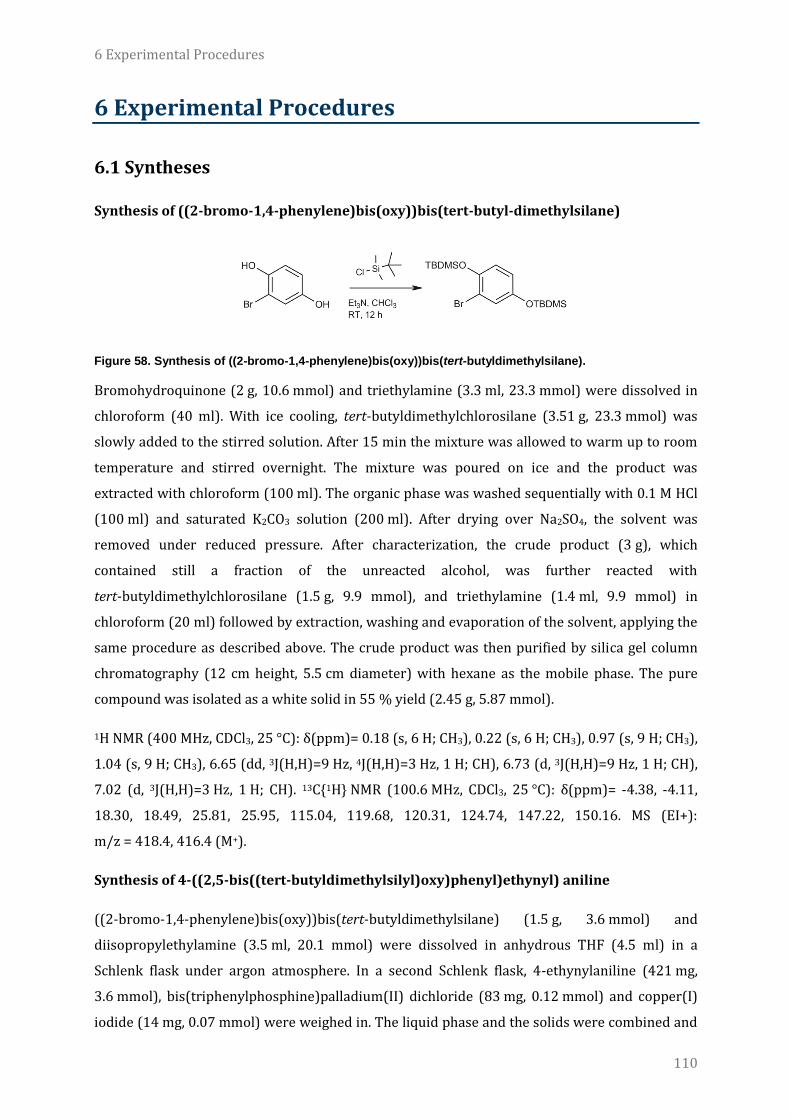
6 Experimental Procedures
110
6 Experimental Procedures
6.1 Syntheses
Synthesis of ((2-bromo-1,4-phenylene)bis(oxy))bis(tert-butyl-dimethylsilane)
Figure 58. Synthesis of ((2-bromo-1,4-phenylene)bis(oxy))bis(tert-butyldimethylsilane).
Bromohydroquinone (2 g, 10.6 mmol) and triethylamine (3.3 ml, 23.3 mmol) were dissolved in
chloroform (40 ml). With ice cooling, tert-butyldimethylchlorosilane (3.51 g, 23.3 mmol) was
slowly added to the stirred solution. After 15 min the mixture was allowed to warm up to room
temperature and stirred overnight. The mixture was poured on ice and the product was
extracted with chloroform (100 ml). The organic phase was washed sequentially with 0.1 M HCl
(100 ml) and saturated K2CO3 solution (200 ml). After drying over Na2SO4, the solvent was
removed under reduced pressure. After characterization, the crude product (3 g), which
contained still a fraction of the unreacted alcohol, was further reacted with
tert-butyldimethylchlorosilane (1.5 g, 9.9 mmol), and triethylamine (1.4 ml, 9.9 mmol) in
chloroform (20 ml) followed by extraction, washing and evaporation of the solvent, applying the
same procedure as described above. The crude product was then purified by silica gel column
chromatography (12 cm height, 5.5 cm diameter) with hexane as the mobile phase. The pure
compound was isolated as a white solid in 55 % yield (2.45 g, 5.87 mmol).
1H NMR (400 MHz, CDCl3, 25 °C): δ(ppm)= 0.18 (s, 6 H; CH3), 0.22 (s, 6 H; CH3), 0.97 (s, 9 H; CH3),
1.04 (s, 9 H; CH3), 6.65 (dd, 3J(H,H)=9 Hz, 4J(H,H)=3 Hz, 1 H; CH), 6.73 (d, 3J(H,H)=9 Hz, 1 H; CH),
7.02 (d, 3J(H,H)=3 Hz, 1 H; CH). 13C{1H} NMR (100.6 MHz, CDCl3, 25 °C): δ(ppm)= -4.38, -4.11,
18.30, 18.49, 25.81, 25.95, 115.04, 119.68, 120.31, 124.74, 147.22, 150.16. MS (EI+):
m/z = 418.4, 416.4 (M+).
Synthesis of 4-((2,5-bis((tert-butyldimethylsilyl)oxy)phenyl)ethynyl) aniline
((2-bromo-1,4-phenylene)bis(oxy))bis(tert-butyldimethylsilane) (1.5 g, 3.6 mmol) and
diisopropylethylamine (3.5 ml, 20.1 mmol) were dissolved in anhydrous THF (4.5 ml) in a
Schlenk flask under argon atmosphere. In a second Schlenk flask, 4-ethynylaniline (421 mg,
3.6 mmol), bis(triphenylphosphine)palladium(II) dichloride (83 mg, 0.12 mmol) and copper(I)
iodide (14 mg, 0.07 mmol) were weighed in. The liquid phase and the solids were combined and

6 Experimental Procedures
111
the mixture was stirred for 2 days at 60 °C. The reaction was monitored by silica gel thin layer
chromatography with 3:1 hexane/ethyl acetate as the mobile phase. After completion of the
reaction, the mixture was diluted with ethyl acetate and decanted so that a black, sticky residue
remained in the reaction vessel. The remainder was triturated and sonicated in
dichloromethane. The remaining solid was filtered off and the dichloromethane and the ethyl
acetate phase were combined. The solvent was removed under reduced pressure. The crude
product was triturated in a small amount of ethyl acetate and purified from the liquid phase by
silica gel chromatography (15 cm height, 5.5 cm diameter) with 3:1 hexane/ethyl acetate as the
mobile phase. The product was isolated as a yellow oil in 17 % yield (275 mg, 0.61 mmol).
1H NMR (400 MHz, CDCl3, 25 °C): δ(ppm)= 0.18 (s, 6 H; CH3), 0.23 (s, 6 H; CH3), 0.98 (s, 9 H; CH3),
1.04 (s, 9 H; CH3), 3.79 (s, 2 H; NH2), 6.62 (d, 3J(H,H)=8 Hz, 2 H; CH), 6.66-6.70 (m, 2 H; CH), 6.91
(d, 4J(H,H)=2 Hz, 1 H; CH), 7.32 (d, 3J(H,H)=9 Hz, 2 H; CH). 13C{1H} NMR (100.6 MHz, CDCl3,
25 °C): δ(ppm): -4.32, -4.17, 18.30, 18.44, 25.85, 25.97, 84.88, 93.49, 113.36, 114.90, 116.84,
120.45, 120.90, 124.02, 132.97, 146.60, 149.43, 150.73. MS (FAB+): m/z = 453.3 (M+).
Figure 59. Synthesis of 4-((2,5-bis((tert-butyldimethylsilyl)oxy)phenyl)-ethynyl)aniline.
Synthesis of nitrophenyldiazonium tetrafluoroborate
5 mmol 4-nintroaniline were dissolved in 4 ml 50 % (v/v) aqueous tetrafluoroboronic acid. At
0 °C 5 mmol sodium nitrite, dissolved in a small volume of water, were slowly added to the
stirred mixture. The yellow precipitate was filtrated and washed with cool methanol and
diethylether and then dissolved in acetonitrile. The solid was precipitated with diethylether,
filtrated and washed with ether again. Yield 71 %. 1H-NMR (200 MHz, CD3CN) δ = 8.76 ppm (m,
part A of an AA’BB‘ system, 2H); 8.63 ppm (m, part B of an AA’BB‘ system, 2H).
6 Experimental Procedures
112
6.2 Global Electrode Modification and Characterization
6.2.1 Surface modification with TBDMS-protected p-hydroquinone groups
Electrode modification with TBDMS-protected p-hydroquinone groups, electrochemical and
chemical deprotection and characterization of the electrode surfaces is described in detail
elsewhere.[245,246] Electrochemical experiments for global modification/characterization of
electrodes using this particular surface chemistry were carried out using a Reference 600
potentiostat (Gamry Instruments). All electrochemical measurements were carried out in a
three-electrode cell with a coiled Pt wire as the counter electrode, a Ag/AgCl (3 M KCl) reference
electrode for aqueous systems and a Haber-Luggin capillary with a Ag/Ag+ (0.01 M AgClO4)
reference electrode for organic solvents. The latter was calibrated with ferrocene as an external
standard. Interconversion of potentials was accomplished according to Pavlishchuk et al.[388] As
working electrodes 20 x 10 x 2 mm Sigradur® G glassy carbon plates (HTW) were employed and
polished on a polishing wheel with 3 µm, 1 µm, 0.3 µm and 0.05 µm alumina slurries and
ultrasonicated in water. Experiments in organic solvent were performed in a custom-made air-
tight cell under dry and oxygen-free conditions. Before transferring into a new solution, all
electrodes were thoroughly rinsed with acetonitrile and ultrapure water.
For electrografting of quinone layers, the diazonium salt precursor 4-((2,5-bis((tert-
butyldimethylsilyl)oxy)phenyl)ethynyl)aniline (4.8 mg, 0.01 mmol) was dissolved in 0.1 M
TBAHFP/acetonitrile (10.5 ml) in the electrochemical cell described above. After adding first
0.1 M TFA/acetonitrile (10.5 µl, 1 µmol) followed by t-butylnitrite (3.7 µl, 0.03 mmol) it was
stirred for 15 min until the electrodes were sequentially functionalized. For electroreduction of
the in situ generated diazonium salt the potential of the glassy carbon electrodes was swept
between 0.7 V and -0.7 V vs. SHE with 0.05 V/s for typically three cycles until the CV displayed
complete passivation of the electrode surface. The electrodes were rinsed with excess amounts
of acetonitrile and water.
6.2.2 Surface modification with nitrophenyl groups
All experiments, except direct mode SECM patterning, were conducted in a three-electrode
configuration with a Pt wire as counter electrode and a Ag/AgCl/3 M KCl reference electrode.
For conventional electrochemistry a PGSTAT12 (Metrohm-Autolab) was employed as
potentiostat. Sigradur® G glassy carbon plates (HTW) were polished on polishing cloth with
3 µm, 1 µm, 0.3 µm and 0.05 µm alumina slurries and ultrasonicated in water and ethanol. For
the electrografting of nitrophenyl groups the glassy carbon plates were immersed in 1 mM
nitrophenyldiazonium tetrafluoroborate, 0.1 M H2SO4 and a cyclic voltammogram from 0.4 V
to -0.3 V (3 cycles, 0.1 V/s) was recorded. The glassy carbon plates were ultrasonicated in water.

6 Experimental Procedures
113
For the global reduction of the nitro groups cyclic voltammograms were recorded between
0.75 V and -0.9 V in 0.1 M H2SO4 (3 cycles, 0.1 V/s).
6.3 SECM Patterning and Imaging
6.3.1 Fabrication of microelectrodes
Borosilicate glass capillaries (length 100 mm, outer diameter 1.5 mm, inner diameter 0.75 mm),
(Hilgenberg) were pulled with a gravity puller equipped with a tungsten coil. A piece of 25 μm
platinum wire (Goodfellow) was inserted into the capillaries until it was stuck in the pulled-out
end of the capillary. The wire was fixed by melting the surrounding glass with the tungsten coil
while applying vacuum to the capillary. The platinum wire was electrically contacted with a
copper wire and conductive epoxy glue, which was then hardened at 120° C for 30 min. The
platinum disk was uncovered by grinding on P 1200 emery paper. The electrodes were then
polished with 3 μm and 1 μm fine emery paper (3M) and rinsed with water. The RG value was
4-5. Prior to use the electrodes were freshly polished and the roughness and cleanliness were
tested by means of cyclic voltammetry in 5 mM [Ru(NH3)6]Cl3, 0.1 M KCl.
6.3.2 Surface modification with TBDMS-protected p-hydroquinone groups
Scanning electrochemical microscopy was conducted on a home-built device consisting of a PG
100 bipotentiostat (Jaissle Elektronik), PS-30 step motors and controller (OWIS) and a
NanoCube® P-611.3S piezo scanner with a E-664 LVPZT amplifier (Physik Instrumente)
connected to a PC via AD/DA cards (Measurement Computing). Experiments for which the
potential of the counter electrode was monitored were performed using a Model 273
potentiostat (Princeton Applied Research). Galvanostatic patterning was conducted using a
PGSTAT 302N potentiostat (Metrohm Autolab). 25 µm glass-shielded Pt disk electrodes with a
ratio of the outer diameter of the glass sheath to the diameter of the Pt disk (RG value) of 4-5
were used as SECM tips. A sample holder exposing a circular area of 0.67 cm2 to the solution was
used. During SECM scans the height of the tip over the sample was held constant at 5 µm using a
tool for automatic tilt correction implemented into the custom-made software. Area scans were
performed in a comb-like manner alongside a defined grid with a mesh width of 25 µm and a tip
velocity of 100 µm/s. The current value at each grid point was recorded after a waiting time of
2 s.
6.3.3 Surface modification with nitrophenyl groups
SECM patterning and imaging experiments were performed using a SECM equipped with a high-
resolution module (Sensolytics) and 25 µm diameter Pt microelectrodes as SECM tips. For
feedback mode experiments a PG100 (Jaissle Elektronik) was employed. Electrode patterning
6 Experimental Procedures
114
was performed in 0.1 M acetic acid. Potentiostatic patterning in the direct mode of SECM was
performed by applying potential pulses of -0.7 V (base potential 0.3 V) to the glassy carbon plate
for 0.5 s using a PG310 potentiostat (HEKA). Galvanostatic patterning was achieved using a
µAutolab II (Metrohm Autolab) by applying current pulses with different magnitude for 0.5 s
with no passage of current before and after the pulse. The tip-to-sample separation during
patterning experiments was 4 µm. Feedback mode SECM imaging was carried out in 1 mM
K3[Fe(CN)6] in either 0.1 M HCl (pH1) or 0.1 M phosphate buffer (pH 7) with potentials of Etip =
0 V and Esample = 0.5 V (pH 1) or Etip = -0.1 V and Esample = 0.4 V (pH 7). For immobilization of the
alkaline phosphatase/avidin conjugate, the patterned glassy carbon electrode was wetted with
10 mM sulfo-NHS-biotin solution (Pierce) in 0.1 M phosphate buffer pH 7 for one hour and
rinsed with 0.1 M glycin, 0.1 M phosphate buffer pH 7. The biotinylated surface was incubated in
0.2 mg/ml alkaline phosphatase/avidin conjugate (Thermo Scientific) in 10 mM phosphate
buffer pH 8, 0.4 M NaCl and 0.5 mg/ml Tween 20 for 40 min. To remove unspecifically adsorbed
enzyme, the sample was extensively rinsed with phosphate buffer/NaCl/Tween solution. The
sample-generation/tip-collection mode measurement to detect locally bound alkaline phos-
phatase was carried out in 0.1 M carbonate buffer pH 9.4 with 2.5 mM p-aminophenylphosphate
at Etip = 0.3 V.
6.4 Scanning Droplet Cell Patterning
The scanning droplet cell was composed of a PTFE capillary, movable by stepper motors, which
was housing a miniaturized reference electrode and the Pt counter electrode. The force at which
the capillary was pressed onto the glassy carbon substrate was controlled using a KD45 2 N
force sensor (ME-Messsysteme). To prevent leakage, the capillary was approached to the
substrate until the force reached 350-450 mN. To determine the electrochemically active surface
area in the SDC, chronoamperometric measurements were performed at a globally deprotected
quinone-modified glassy carbon plate with 5 mM [Ru(NH3)]Cl3 and 0.1 M KCl as the electrolyte.
The potential was set to -0.19 V vs. SHE and the resulting cathodic current was plotted against
the inverse square root of the time. The data was fitted linearly and using the current-time
relation for systems with planar diffusion I = nr2FD1/2cπ1/2t-1/2, the diameter of the droplet was
calculated from the slope of the graph, with n the number of transferred electrons, r the radius of
the electroactive area, F the Faraday constant, D the diffusion coefficient (D = 9.1∙10-6 cm2 ∙ s-1 at
22 °C),[389] c the bulk concentration of [Ru(NH3)]Cl3 and t the time. For the fit, only current values
recorded between 2 s and 20 s after setting the working potential were taken into consideration
to assure complete decay of capacitive current as well as a stable diffusion layer within the
capillary ((D∙t)1/2 = 135 µm for t = 20 s). Coefficients of determination R2 were larger than 0.989

6 Experimental Procedures
115
for all fits. The active surface area amounts to (8.6 ± 0.3) ∙ 10-5 cm2 (n = 3) corresponding to a
diameter of the droplet inside the capillary of (105 ± 2) µm.
6.5 Atomic Force Microscopy
All atomic force microscopy images were recorded on a NanoWizard®3 NanoScience AFM (JPK
Instruments AG) in intermittent contact mode using ACTA cantilevers (Applied NanoStructures,
Inc.). Polynomial line leveling was used to flatten images.
6.6 Fabrication and Handling of Carbon Nanoelectrodes
To fabricate single carbon nanoelectrodes, quartz glass capillaries (inner diameter 0.9 mm, outer
diameter 1.2 mm) (Sutter Instruments) were pulled to fine tips with a P-2000 laser puller (Sutter
Instruments). The instrument uses a CO2 laser to heat the capillaries while simultaneously
pulling the two ends apart with controlled force. The pulling process occurs in two steps: 1.
Initial heating while applying gentle force to test the softness of the glass. 2. Strong pulling when
the capillary has softened and the laser is switched off. The laser puller uses five different
parameters to control the pulling procedure. The parameter HEAT correlates to the power of the
laser and thus to the energy applied to heat the capillary. A higher value corresponds to more
power. The parameter FILAMENT controls the width of the heated area on the capillary. There is
no direct correlation between the parameter value and the width. More details are given in the
instrument manual. The parameter VELOCITY is a measure of the softness of the glass that has to
be reached before the second pulling step is initiated. A higher value corresponds to softer glass,
i.e. lower viscosity. DELAY positively correlates to a delay time between the first and the second
step, whereas the laser remains switched off. PULL controls the force applied to pull the two
ends of the capillary apart, whereas higher values correspond to larger force. For all
experiments presented in this work, the parameters where finely adjusted to the meet the
required specifications of the nanoelectrodes. The laser puller reacts sensitively to slight
variations in the dimensions of the glassware even for nominally identical capillaries and also is
sensitive to fluctuation in air temperature and humidity. These factors require constant small
adjustments to obtain nanoelectrodes with the anticipated dimensions. Also, different individual
instruments of the P-2000 model were used for the experiments presented. Sets of parameters
are generally not interchangeable between different individual instruments. However, on one
particular instrument a basic set of parameters ranged around HEAT 760, FILAMENT 4,
VELOCITY 45, DELAY 130 and PULL 120 and was slightly varied to tune the opening size of the
nanopipettes. Dual carbon nanoelectrodes were fabricated on another instrument with typical
parameters of HEAT 790, FILAMENT 3, VELOCITY 45, DELAY 130 and PULL 90. On a third
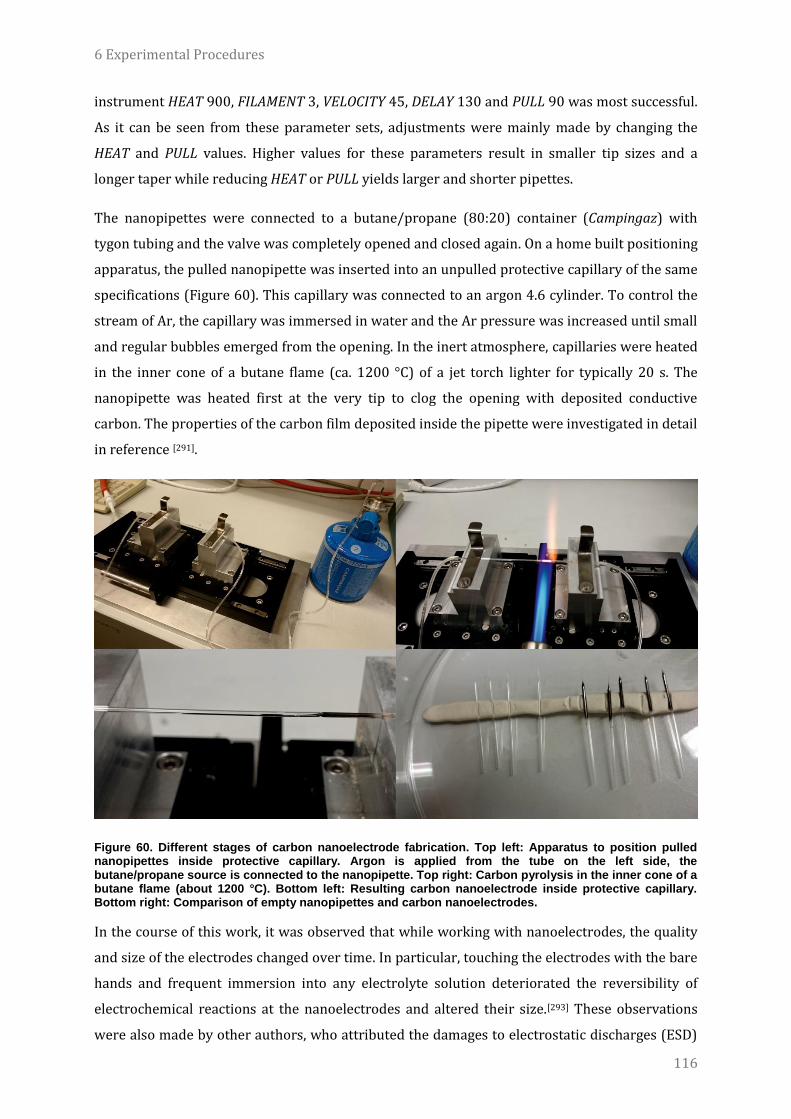
6 Experimental Procedures
116
instrument HEAT 900, FILAMENT 3, VELOCITY 45, DELAY 130 and PULL 90 was most successful.
As it can be seen from these parameter sets, adjustments were mainly made by changing the
HEAT and PULL values. Higher values for these parameters result in smaller tip sizes and a
longer taper while reducing HEAT or PULL yields larger and shorter pipettes.
The nanopipettes were connected to a butane/propane (80:20) container (Campingaz) with
tygon tubing and the valve was completely opened and closed again. On a home built positioning
apparatus, the pulled nanopipette was inserted into an unpulled protective capillary of the same
specifications (Figure 60). This capillary was connected to an argon 4.6 cylinder. To control the
stream of Ar, the capillary was immersed in water and the Ar pressure was increased until small
and regular bubbles emerged from the opening. In the inert atmosphere, capillaries were heated
in the inner cone of a butane flame (ca. 1200 °C) of a jet torch lighter for typically 20 s. The
nanopipette was heated first at the very tip to clog the opening with deposited conductive
carbon. The properties of the carbon film deposited inside the pipette were investigated in detail
in reference [291].
Figure 60. Different stages of carbon nanoelectrode fabrication. Top left: Apparatus to position pulled nanopipettes inside protective capillary. Argon is applied from the tube on the left side, the butane/propane source is connected to the nanopipette. Top right: Carbon pyrolysis in the inner cone of a butane flame (about 1200 °C). Bottom left: Resulting carbon nanoelectrode inside protective capillary. Bottom right: Comparison of empty nanopipettes and carbon nanoelectrodes.
In the course of this work, it was observed that while working with nanoelectrodes, the quality
and size of the electrodes changed over time. In particular, touching the electrodes with the bare
hands and frequent immersion into any electrolyte solution deteriorated the reversibility of
electrochemical reactions at the nanoelectrodes and altered their size.[293] These observations
were also made by other authors, who attributed the damages to electrostatic discharges (ESD)
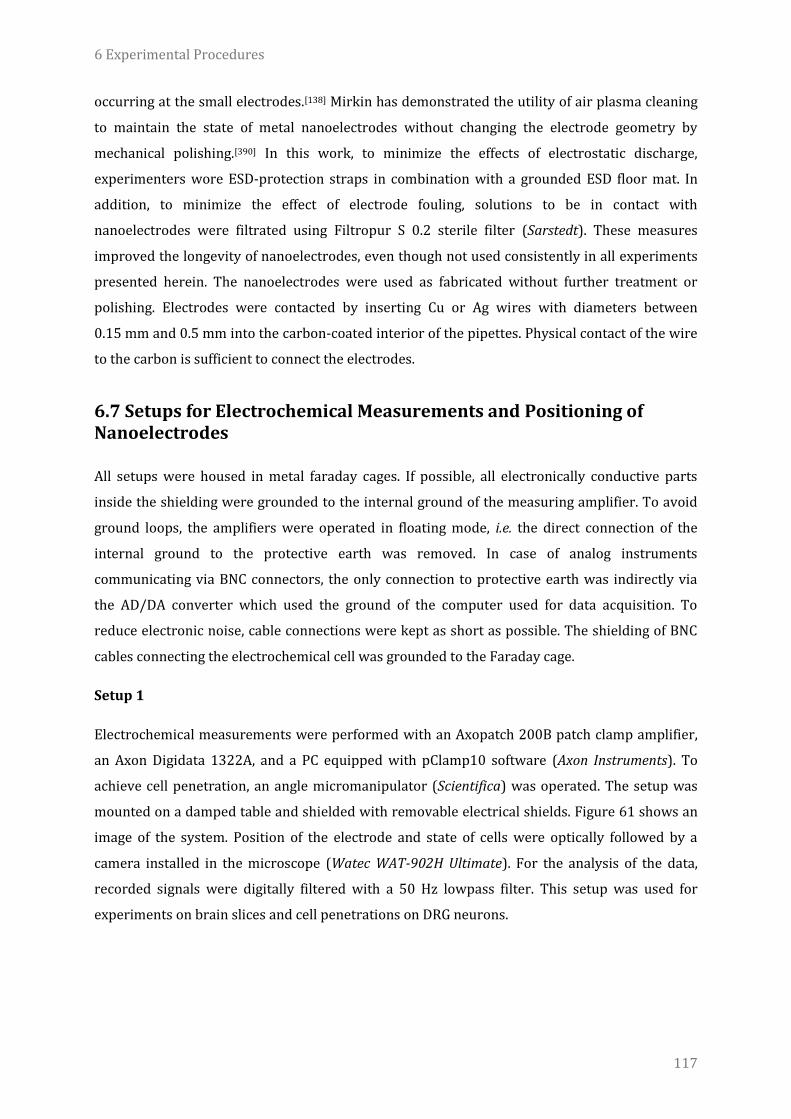
6 Experimental Procedures
117
occurring at the small electrodes.[138] Mirkin has demonstrated the utility of air plasma cleaning
to maintain the state of metal nanoelectrodes without changing the electrode geometry by
mechanical polishing.[390] In this work, to minimize the effects of electrostatic discharge,
experimenters wore ESD-protection straps in combination with a grounded ESD floor mat. In
addition, to minimize the effect of electrode fouling, solutions to be in contact with
nanoelectrodes were filtrated using Filtropur S 0.2 sterile filter (Sarstedt). These measures
improved the longevity of nanoelectrodes, even though not used consistently in all experiments
presented herein. The nanoelectrodes were used as fabricated without further treatment or
polishing. Electrodes were contacted by inserting Cu or Ag wires with diameters between
0.15 mm and 0.5 mm into the carbon-coated interior of the pipettes. Physical contact of the wire
to the carbon is sufficient to connect the electrodes.
6.7 Setups for Electrochemical Measurements and Positioning of Nanoelectrodes
All setups were housed in metal faraday cages. If possible, all electronically conductive parts
inside the shielding were grounded to the internal ground of the measuring amplifier. To avoid
ground loops, the amplifiers were operated in floating mode, i.e. the direct connection of the
internal ground to the protective earth was removed. In case of analog instruments
communicating via BNC connectors, the only connection to protective earth was indirectly via
the AD/DA converter which used the ground of the computer used for data acquisition. To
reduce electronic noise, cable connections were kept as short as possible. The shielding of BNC
cables connecting the electrochemical cell was grounded to the Faraday cage.
Setup 1
Electrochemical measurements were performed with an Axopatch 200B patch clamp amplifier,
an Axon Digidata 1322A, and a PC equipped with pClamp10 software (Axon Instruments). To
achieve cell penetration, an angle micromanipulator (Scientifica) was operated. The setup was
mounted on a damped table and shielded with removable electrical shields. Figure 61 shows an
image of the system. Position of the electrode and state of cells were optically followed by a
camera installed in the microscope (Watec WAT-902H Ultimate). For the analysis of the data,
recorded signals were digitally filtered with a 50 Hz lowpass filter. This setup was used for
experiments on brain slices and cell penetrations on DRG neurons.

6 Experimental Procedures
118
Figure 61. Setup used for experiments in relation to intracellular measurements at DRG neurons and brain slices. Image taken from [391].
Setup 2
Electrochemical measurements were performed with an Axopatch 700B two-channel patch
clamp amplifier, an Axon Digidata 1322A, and a PC equipped with pClamp10 software (Axon
Instruments). The electrodes and samples were housed in a Faraday cage built with conductive
glass windows. The petri dishes containing cultured cells or calibration solution were held by
the positioning stage built on top of an inverted optical microscope. The scan head of the SECM
instrument consisted of a PIHera P-621.2 XY nanopositioning Stage (Physik Instrumente) with
100 x 100 μm travel range that moved the sample and a LISA piezo actuator P-753.21C (Physik
Instrumente) with travel range 25 μm for electrode positioning along the Z-axis. Coarse
positioning was achieved with translation stages M-111.2DG (XY directions) and M-112.1DG (Z-
axis) (Physik Instrumente). Piezo actuators were powered by high voltage amplifiers E-503 and
E-505 (Physik Instrumente) and a servo module E-509 (Physik Instrumente) operating in closed
loop. The setup was controlled using software written in Delphi (Borland) and Code Composer
Studio (Texas Instruments) for a ScanIC controller (Ionscope). A 1 kHz low pass filter was
typically used. All Experiments involving dual carbon electrodes were performed at this setup.
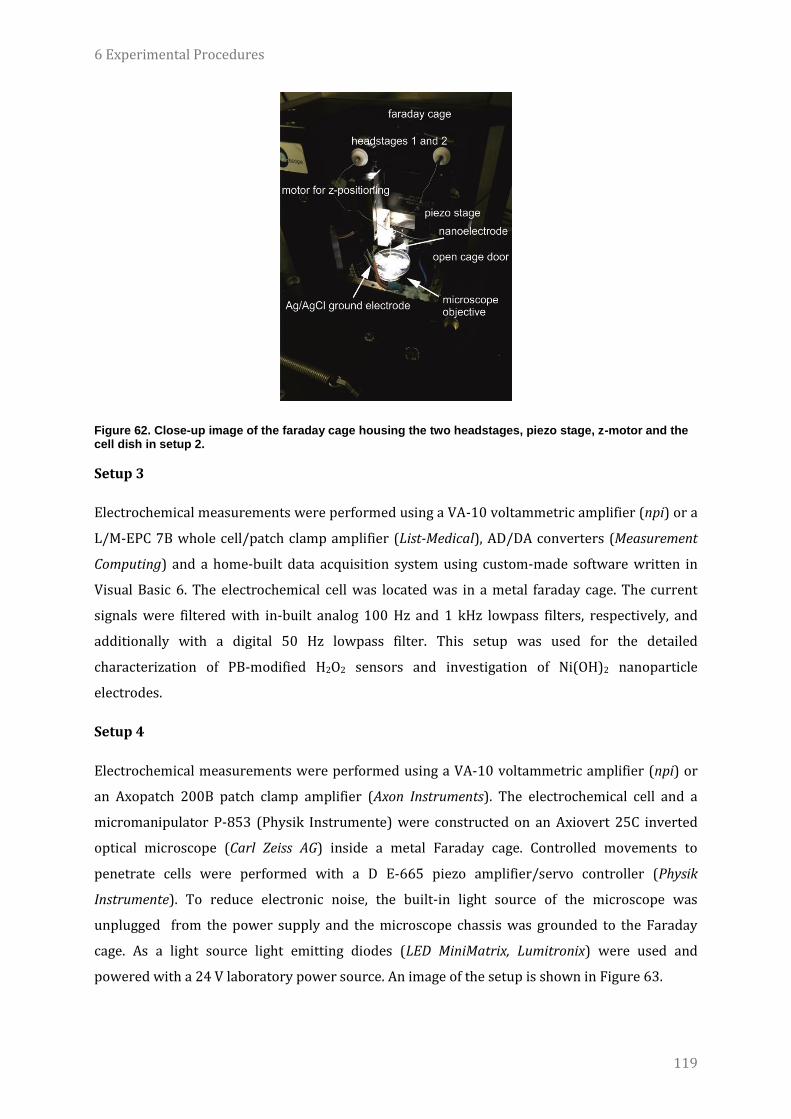
6 Experimental Procedures
119
Figure 62. Close-up image of the faraday cage housing the two headstages, piezo stage, z-motor and the cell dish in setup 2.
Setup 3
Electrochemical measurements were performed using a VA-10 voltammetric amplifier (npi) or a
L/M-EPC 7B whole cell/patch clamp amplifier (List-Medical), AD/DA converters (Measurement
Computing) and a home-built data acquisition system using custom-made software written in
Visual Basic 6. The electrochemical cell was located was in a metal faraday cage. The current
signals were filtered with in-built analog 100 Hz and 1 kHz lowpass filters, respectively, and
additionally with a digital 50 Hz lowpass filter. This setup was used for the detailed
characterization of PB-modified H2O2 sensors and investigation of Ni(OH)2 nanoparticle
electrodes.
Setup 4
Electrochemical measurements were performed using a VA-10 voltammetric amplifier (npi) or
an Axopatch 200B patch clamp amplifier (Axon Instruments). The electrochemical cell and a
micromanipulator P-853 (Physik Instrumente) were constructed on an Axiovert 25C inverted
optical microscope (Carl Zeiss AG) inside a metal Faraday cage. Controlled movements to
penetrate cells were performed with a D E-665 piezo amplifier/servo controller (Physik
Instrumente). To reduce electronic noise, the built-in light source of the microscope was
unplugged from the power supply and the microscope chassis was grounded to the Faraday
cage. As a light source light emitting diodes (LED MiniMatrix, Lumitronix) were used and
powered with a 24 V laboratory power source. An image of the setup is shown in Figure 63.
6 Experimental Procedures
120
Figure 63. Setup used for cell penetrations at macrophage cells. Closeup image of the electrochemical cell in the Petri dish containing cells, the preamplifier and micromanipulator on an inverted optical microscope.
Setup 5
Electrochemical measurements were performed inside a metal Faraday cage using a Modulab
potentiostat (Solartron Analytical) equipped with a femtoammeter module. This setup was used
for characterization of Ni(OH)2 nanoparticle electrodes.
6.8 Protocols for the Modification and Characterization of Carbon Nanoelectrodes
6.8.1 General
All electrodes were characterized by means of cyclic voltammetry in either 5 mM [Ru(NH3)6]Cl3,
0.1 M KCl or 1 mM ferrocenemethanol, 0.1 M KCl. Only electrodes exhibiting a flat current
plateau for diffusion-limited oxidation/reduction of the mediator were further used. The
electrode radii were estimated according to equation (1) assuming diffusion coefficients of 9.1 ∙
10-6 cm2 s-1 or 6.1∙ 10-6 cm2 s-1 for the one-electron reduction of [Ru(NH3)6]3+ or oxidation of
ferrocenemethanol, respectively.
6.8.2 SEM imaging
SEM imaging of nanoelectrodes was conducted either using an EM Quanta 3 D FEG electron
microscope (FEI) without deposition of a metal film or after coating with 10 nm of chromium in
a sputter coater on all sides (Q150T S Quorum) in an FIB-SEM (Cross Beam Work Station Auriga,
Carl Zeiss). The FET tip was milled using a milling current of 200 pA at a working distance of
5 mm. Sections of 10 nm were ion-milled and imaged by SEM with a 5 keV acceleration voltage,

6 Experimental Procedures
121
using a secondary electron in-lens detector. EDX spectra were recorded in the EM Quanta 3 D
FEG electron microscope (FEI).
6.8.3 Platinization
Platinum black was deposited on carbon nanoelectrodes by cyclic voltammetry in 2 mM H2PtCl6,
0.1 M HCl in a potential range from 0.4 V to -0.5 at 0.5 V/s for one or two cycles.
6.8.4 Fabrication and characterization of PB-based H2O2 nanosensors
Electrochemical etching was performed by means of CV from 0 V to 2 V in 0.1 M KOH, 10 mM KCl
for typically 15 cycles until the formation of a cavity occurred. Electrochemical deposition of PB
was achieved by potential cycling from 0.6 V to -0.4 V for 10 cycles in 1 mM FeCl3 and 1 mM
K3[Fe(CN)6] in 0.1 M HCl, 0.1 M KCl. After deposition the PB film was activated by cycling in the
same potential range in only 0.1 M HCl, 0.1 M KCl for at least 100 cycles. Alternatively, PB was
deposited by potential cycling from 0.6 V to 0.3 V with 0.1 V/s (50 cycles), followed by activation
for 20-40 cycles. Standard external K+ solution contained 150 mM NaCl, 6 mM KCl, 1 mM MgCl2,
1.5 mM CaCl2, 5 mM glucose and 10 mM HEPES pH 7.2. For the calibration curves, the
concentration of H2O2 stock solution was verified by titration with KMnO4. Standard internal
potassium solution contained 144 mM KCl, 2 mM MgCl2, 5 mM EGTA (ethylene glycol tetraacetic
acid) and 10 mM HEPES pH 7.2. Different potassium concentrations were achieved by addition
to the external solution of different volumes of 1 M KCl in water. In that case a Ag/AgCl counter-
reference electrode in a compartment filled with 3 M KCl and separated by a frit was used.
Potentiometric measurements were performed using a PG-100 bipotentiostat (Jaissle
Elektronik).
6.8.5 Fabrication and characterization of PPy FET nanosensors
Two wires were inserted into each barrel to make a connection with the carbon and thus
connect the drain and source electrode. A Ag/AgCl electrode was placed in solution acting as a
pseudoreference electrode. All electrochemical potentials and gate voltages are quoted against
this electrode in the corresponding solution. Pyrrole was used as received and stored under
argon atmosphere. Polypyrrole was deposited by sweeping the potential of both carbon
electrodes between -0.3 V and 0.6 V vs. Ag/AgCl/no Cl- in a deaerated solution of 0.5 M pyrrole
0.2 M LiClO4, and 0.1 M HClO4 in water. Electrochemical current was continuously measured
during the electrodeposition in order to monitor the growth of PPy on each electrode. In order to
detect the formation of a bridge between the two carbon electrodes a small drain-source voltage
was already applied and as soon as a significant drain-source current occurred the deposition
was stopped. Before usage all FET sensors were cycled between -0.3 V and 0.3 V in 0.1 M HCl
until a stable I-V curve was obtained. Every sensor was calibrated for pH in phosphate buffered
6 Experimental Procedures
122
solutions. For all measurements on the FET, voltages of a few millivolts, typically 5 mV, were
applied between drain and source. For all measurements on cells and the associated calibrations
the gate voltage was swept between −0.3 and 0.3 V (0.4 V/s) and drain-source current was
continuously measured. To extract single drain-source current values the resulting I−V curves
were averaged and each averaged value represents one cycle. pH calibrations were made by
adding small amounts from a 0.1 M HCl stock to a solution of 120 mM NaCl, 5 mM KCl, 5 mM
MgCl2, and 12 mM phosphate buffer pH 7.4. The maximal concentration of added Cl− did not
exceed 20 mM, which has only a negligible effect on the behavior of the nano-PPy-FET. When
moving from 135 mM to 155 mM Cl−, the shift of the electrode potential of the Ag/AgCl
pseudoreference according to the Nernst equation is less than 4 mV and thus has no significant
effect on the gate voltage.
6.8.6 Immobilization of hexokinase on PPy-FET nanosensors
PPy-FETs were immersed into a solution of 25 % glutaraldehyde in water for at least 30 min
while continuously sweeping the gate voltage between -0.3 V and 0.3 V and monitoring drain-
source current. Afterwards, also monitoring transistor performance, the probe was dipped into a
solution of 500 U/ml hexokinase and glucose-6-phosphate dehydrogenase from S. cerevisiae
(Sigma Aldrich) for at least 30 min.
6.8.7 Deposition and characterization of Ni(OH)2 nanoparticles
For all experiments involving Ni(OH)2 nanoparticles a Ag/AgCl/3 M KCl counter-reference elec-
trode was used in a two-electrode system. Ni(OH)2 was deposited cathodically from 5 mM NiCl2
by applying -1 V vs. Ag/AgCl/3 M Cl- for varying electrolysis times. However, at the nanometric
electrodes only poor correlation between the electrolysis time and the amount of deposited
Ni(OH)2 was observed. CVs for the OER were performed in 0.1 M KOH at 0.01 V/s. Before the
analysis of peak currents as a function of the scan rate in 0.1 M KOH the electrodes were cycled
for at least 500 cycles in the same solution in a potential range between 0 and 0.8 V vs. Ag/AgCl/
3 M Cl-. The CVs for the analysis of Ni(OH)2 oxidation peaks are smoothed using an adjacent-
averaging filter with a width of 5 data points. However, the peak analysis was done before
smoothing by taking the average peak intensities from 3 adjacent cycles.
Particle sizes were estimated from the charge transferred during the anodic peak for the
oxidation of Ni(OH)2 according to Faraday’s law of electrolysis n = q/zF. The charge is
proportional to the amount of deposited catalyst material and thus the volume of individual
Ni(OH)2 particles assuming a density of 4.1 g cm-3.[365] From the particle volume, the particle
radii and surface areas were calculated assuming spherical particle geometry. Only those
electrodes where the calculated particle size was larger than the initial carbon electrode radius

6 Experimental Procedures
123
were used for further analysis. Turnover frequencies were computed according to TOF =
iOER/4FnNi, with iOER the OER current extracted from the steady-state voltammograms at a
potential of 1.88 vs. RHE and nNi the amount of deposited Ni(OH)2.
6.9 Local Measurements at Cells
6.9.1 H2O2 detection in macrophage cells
The penetrations were carried out in PBS pH 7.4 on the stage of an inverted microscope inside of
a Faraday cage. Cells were taken freshly out of the incubator, the medium (Dulbecco's modified
Eagle's medium, DMEM) was removed and the cells were washed two times with PBS. To inhibit
catalase 20 mM 3-amino-1,2,4-triazole were added to the PBS shortly before starting the
measurements. The nanosensor was fixed in a 45° angle with respect to the cell dish. Under
optical control under the microscope, a micromanipulator was used to change the position of the
nanosensor until it touched the cell membrane. For cell penetration, a 2.5 to 5 μm movement of
the nanosensor along the 45° axis with respect to the cell dish was performed with the piezo
positioner. For LPS stimulation, the macrophages were incubated in DMEM containing 5 μg/ml
of LPS for 18 to 24 hours. Before the measurement, the medium was replaced with PBS buffer.
6.9.2 pH and ATP measurements using PPy-FET nanosensors
pH and ATP measurements to investigate cells were performed in unbuffered media containing
120 mM NaCl, 5 mM KCl, 5 mM MgCl2 and 20 mM glucose added in case of ATP measurements.
Prior to cell measurements, each ATP sensor was calibrated using a solution of adenosine
5′-triphosphate disodium salt hydrate (Sigma Aldrich) in the same medium used for ATP
measurements on cells. The pH of these stock solutions was carefully adjusted and matched with
the one of the media. Movements of the sensors with respect to cell specimens were performed
using stepper motors at setup 2. The measured distance from cells is the position of the motor
with respect to the point of closest approach shortly before touching the cell with the probe.
6.10 Cell Culture and Tissue Preparation
6.10.1 Brain slice preparation
Brain slice samples were prepared by Sergiy Tokar, Imperial College London.
Hippocampus slices were isolated from 28-days old rats using standard techniques.[392] After
decapitation of the rats was performed, the rat brain was isolated and placed into ice-cold ringer
solution, where the hippocampus isolation was performed. The hippocampus was sliced into
350-μm-thick transverse slices, using a Leica VT1200S blade microtome. After obtaining the cut

6 Experimental Procedures
124
slices, they were stored in the same solution at 34 °C for 15 min. Then they were stored for at
least 1 h at room temperature. During and after isolation, the solution was constantly bubbled
with a 95% O2 and 5% CO2 gas mixture.
6.10.2 Dorsal root ganglia (DRG) neuronal culture
DRG neurons were prepared by Ainara López Córdoba, Imperial College London.
DRG from all spinal levels were obtained and pooled from freshly sacrificed postnatal day 0 to 2
(P0 to P2) Sprague Dawley rats in DMEM (Life Technologies). They were enzyme-digested in
0.2% collagenase (type I; Sigma-Aldrich) and 0.5% dispase II (Roche) in DMEM for 30 min at
37°C, and dissociated in DMEM supplemented with 10% fetal bovine serum (FBS) (Invitrogen),
penicillin (100 Units/mL; Sigma-Aldrich) and streptomycin (100 μg/ml; Sigma-Aldrich). Neurons
were plated on poly-L-lysine and laminin-coated (20 μg/ml; Sigma-Aldrich) and glass-bottomed
plastic petri dishes (MatTek Corporation) in DMEM supplemented with 10% FBS, penicillin (100
Units/ml), streptomycin (100 μg/ml) and 50 ng/ml Neuron Growth Factor (NGF) (all from
Sigma-Aldrich). The density was 600–1000 cells/dish and the media was renewed every two
days.[391]
6.10.3 Macrophage cell culture
Macrophages were cultured in collaboration with Melanie Mark, Ruhr-Universität Bochum and
Miriam Marquitan, Ruhr-Universität Bochum
Murine macrophages J774A.1 (ATCC LGC Standards) were cultured in DMEM (Sigma-Aldrich)
supplemented with 4500 mg/l glucose, L-glutamine, sodium bicarbonate, sodium pyruvate and
10 % FBS at 37 °C under a humidified atmosphere containing 5 % CO2. For splitting
macrophages, the medium was removed and the cells were washed with 2 - 3 mL of PBS pH 7.4.
Subsequently, they were incubated for three to five minutes in 1 ml of trypsin/EDTA until the
cells detached from the bottom of the dish. To inactivate the trypsin, 10 ml of DMEM/FBS were
added. The macrophages were removed from the Petri dish by mechanical trituration and plated
onto new dishes.
6.10.4 Melanoma and melanocyte culture
Melanoma and melanocytes were prepared by Yanjun Zhang, Imperial College.
The human malignant melanoma cell line A375M and human immortal melanocyte cell line
Hermes 3A were all obtained from the Wellcome Trust Functional Genomics Cell Bank (St.
George's, University of London, UK). Cell culture medium and reagents were purchased from
Sigma Aldrich. Melanoma cells were grown in DMEM with 10% fetal calf serum and
6 Experimental Procedures
125
supplemented with L-glutamine (2 mM), penicillin (100 U per ml), and streptomycin (100 μg per
ml). Melanocytes were grown in RPMI 1640 medium supplemented with fetal calf serum (10%),
12-0-tetradecanoyl phorbol acetate (200 nM), cholera toxin (200 pM), human stem cell factor
(10 ng/ml) and endothelin 1 (10 nM). Cells were kept in a 5% CO2 incubator at 37°C and were
subcultured at 75% confluence.
6.10.5 Isolation of rat ventricular myocytes
Rat cardiac myocytes were prepared by Yanjun Zhang, Imperial College.
The investigation conforms to the Guide for the Care and Use of Laboratory Animals published
by the US National Institutes of Health (NIH Publication No. 85-23, revised 1996). Cardiac
myocytes from adult rats were isolated as previously described.[393] Briefly, male Sprague–
Dawley rats were heparinized, killed by cervical dislocation and the heart was rapidly excised
and placed in ice-cold Krebs–Henseleit (KH) solution of composition (mM): NaCl 119, KCl 4.7,
MgSO4 0.94, KH2PO4 1.2, NaHCO3 25, glucose 11.5, CaCl2 1 and equilibrated to pH 7.4 with 95%
O2/5% CO2. A Langendorff perfusion method was used and the interventricular septum with the
left ventricle was cut and shaken in 100% O2 enzyme-containing solution for 5 min. The
supernatant was centrifuged at 400 g for 1 min at room temperature. Cells were washed and
resuspended in the solution with 200 μmol/l calcium.
7 References
126
7 References
[1] Clausmeyer, J.; Schuhmann, W.; Plumeré, N.; Electrochemical patterning as a tool for fabricating biomolecule microarrays; Trends Anal. Chem. 2014, 58, 23.
[2] Clausmeyer, J.; Schuhmann, W.; Nanoelectrodes: Applications in Electrocatalysis, Single-Cell Analysis and High-Resolution Electrochemical Imaging; Trends Anal. Chem. 2016. In Press, DOI: 10.1016/j.trac.2016.01.018
[3] Murray, R. W.; Nanoelectrochemistry: Metal Nanoparticles, Nanoelectrodes, and Nanopores; Chem. Rev. 2008, 108, 2688.
[4] Oja, S. M.; Wood, M.; Zhang, B.; Nanoscale Electrochemistry; Anal. Chem. 2013, 85, 473.
[5] Arrigan, D. W. M.; Nanoelectrodes, nanoelectrode arrays and their applications; Analyst 2004, 129, 1157.
[6] Cox, J. T.; Zhang, B.; Nanoelectrodes: Recent Advances and New Directions; Annu. Rev. Anal. Chem. 2012, 5, 253.
[7] Zheng, X. T.; Li, C. M.; Single cell analysis at the nanoscale; Chem. Soc. Rev. 2012, 41, 2061.
[8] O'Connell, M. A.; Wain, A. J.; Combined electrochemical-topographical imaging: a critical review; Anal. Methods 2015, 7, 6983.
[9] Kranz, C.; Recent advancements in nanoelectrodes and nanopipettes used in combined scanning electrochemical microscopy techniques; Analyst 2014, 139, 336.
[10] Matsue, T.; Bioimaging with Micro/Nanoelectrode Systems; Anal. Sci. 2013, 29, 171.
[11] Beaulieu, I.; Kuss, S.; Mauzeroll, J.; Geissler, M.; Biological Scanning Electrochemical Microscopy and its Application to Live Cell Studies; Anal. Chem. 2011, 83, 1485.
[12] Ventosa, E.; Schuhmann, W.; Scanning electrochemical microscopy of Li-ion batteries; Phys. Chem. Chem. Phys. 2015, 17, 28441.
[13] Mitchell, P.; A perspective on protein microarrays; Nat. Biotechnol. 2002, 20, 225.
[14] Campàs, M.; Katakis, I.; DNA biochip arraying, detection and amplification strategies; Trends Anal. Chem. 2004, 23, 49.
[15] Wilson, D. S.; Nock, S.; Functional protein microarrays; Curr. Opin. Chem. Biol. 2002, 6, 81.
[16] Barbulovic-Nad, I.; Lucente, M.; Sun, Y.; Zhang, M.; Wheeler, A. R.; Bussmann, M.; Bio-Microarray Fabrication Techniques—A Review; Crit. Rev. Biotechnol. 2006, 26, 237.
[17] Meiners, F.; Plettenberg, I.; Witt, J.; Vaske, B.; Lesch, A.; Brand, I.; Wittstock, G.; Local control of protein binding and cell adhesion by patterned organic thin films; Anal. Bioanal. Chem. 2013, 405, 3673.
[18] MacBeath, G.; Schreiber, S. L.; Printing proteins as microarrays for high-throughput function determination; Science 2000, 289, 1760.
[19] Zhu, H.; Global Analysis of Protein Activities Using Proteome Chips; Science 2001, 293, 2101.
[20] Hirt, L.; Grüter, R. R.; Berthelot, T.; Cornut, R.; Vörös, J.; Zambelli, T.; Local surface modification via confined electrochemical deposition with FluidFM; RSC Adv. 2015, 5, 84517.
[21] Revzin, A.; Russell, R. J.; Yadavalli, V. K.; Koh, W.-G.; Deister, C.; Hile, D. D.; Mellott, M. B.; Pishko, M. V.; Fabrication of Poly(ethylene glycol) Hydrogel Microstructures Using Photolithography; Langmuir 2001, 17, 5440.
[22] Shah, S. S.; Howland, M. C.; Chen, L.-J.; Silangcruz, J.; Verkhoturov, S. V.; Schweikert, E. A.; Parikh, A. N.; Revzin, A.; Micropatterning of Proteins and Mammalian Cells on Indium Tin Oxide; ACS Appl. Mater. Interfaces 2009, 1, 2592.
[23] Corgier, B. P.; Laurent, A.; Perriat, P.; Blum, L. J.; Marquette, C. A.; A Versatile Method for Direct and Covalent Immobilization of DNA and Proteins on Biochips; Angew. Chem. Int. Ed. 2007, 46, 4108.

7 References
127
[24] Harper, J. C.; Polsky, R.; Wheeler, D. R.; Dirk, S. M.; Brozik, S. M.; Selective Immobilization of DNA and Antibody Probes on Electrode Arrays: Simultaneous Electrochemical Detection of DNA and Protein on a Single Platform; Langmuir 2007, 23, 8285.
[25] Chan, E. W. L.; Yousaf, M. N.; Immobilization of Ligands with Precise Control of Density to Electroactive Surfaces; J. Am. Chem. Soc. 2006, 128, 15542.
[26] Bunimovich, Y. L.; Ge, G.; Beverly, K. C.; Ries, R. S.; Hood, L.; Heath, J. R.; Electrochemically Programmed, Spatially Selective Biofunctionalization of Silicon Wires; Langmuir 2004, 20, 10630.
[27] Kim, K.; Yang, H.; Jon, S.; Kim, E.; Kwak, J.; Protein Patterning Based on Electrochemical Activation of Bioinactive Surfaces with Hydroquinone-Caged Biotin; J. Am. Chem. Soc. 2004, 126, 15368.
[28] Kim, K.; Jang, M.; Yang, H.; Kim, E.; Kim, Y. T.; Kwak, J.; Electrochemically Induced and Controlled One-Step Covalent Coupling Reaction on Self-Assembled Monolayers; Langmuir 2004, 20, 3821.
[29] Kurzawa, C.; Hengstenberg, A.; Schuhmann, W.; Immobilization method for the preparation of biosensors based on pH shift-induced deposition of biomolecule-containing polymer films; Anal. Chem. 2002, 74, 355.
[30] Szunerits, S.; Bouffier, L.; Calemczuk, R.; Corso, B.; Demeunynck, M.; Descamps, E.; Defontaine, Y.; Fiche, J.-B.; Fortin, E.; Livache, T.; Mailley, P.; Roget, A.; Vieil, E.; Comparison of Different Strategies on DNA Chip Fabrication and DNA-Sensing: Optical and Electrochemical Approaches; Electroanalysis 2005, 17, 2001.
[31] Cooper, J.; Yazvenko, N.; Peyvan, K.; Maurer, K.; Taitt, C. R.; Lyon, W.; Danley, D. L.; Bereswill, S.; Targeted Deposition of Antibodies on a Multiplex CMOS Microarray and Optimization of a Sensitive Immunoassay Using Electrochemical Detection; PLoS ONE 2010, 5, e9781.
[32] Dill, K.; Montgomery, D.; Ghindilis, A.; Schwarzkopf, K.; Ragsdale, S.; Oleinikov, A.; Immunoassays based on electrochemical detection using microelectrode arrays; Biosens. Bioelectron. 2004, 20, 736.
[33] Ghindilis, A. L.; Smith, M. W.; Schwarzkopf, K. R.; Roth, K. M.; Peyvan, K.; Munro, S. B.; Lodes, M. J.; Stöver, A. G.; Bernards, K.; Dill, K.; McShea, A.; CombiMatrix oligonucleotide arrays: Genotyping and gene expression assays employing electrochemical detection; Biosens. Bioelectron. 2007, 22, 1853.
[34] Egeland, R. D.; Southern, E. M.; Electrochemically directed synthesis of oligonucleotides for DNA microarray fabrication; Nucleic Acids Res. 2005, 33, e125.
[35] Maurer, K.; Cooper, J.; Caraballo, M.; Crye, J.; Suciu, D.; Ghindilis, A.; Leonetti, J. A.; Wang, W.; Rossi, F. M.; Stöver, A. G.; Larson, C.; Gao, H.; Dill, K.; McShea, A.; Hoheisel, J.; Electrochemically Generated Acid and Its Containment to 100 Micron Reaction Areas for the Production of DNA Microarrays; PLoS ONE 2006, 1, e34.
[36] Maurer, K.; McShea, A.; Strathmann, M.; Dill, K.; The Removal of the t -BOC Group by Electrochemically Generated Acid and Use of an Addressable Electrode Array for Peptide Synthesis; J. Comb. Chem. 2005, 7, 637.
[37] Reineke, U.; Volkmer-Engert, R.; Schneider-Mergener, J.; Applications of peptide arrays prepared by the SPOT-technology; Curr. Opin. Biotechnol. 2001, 12, 59.
[38] Fodor, S.; Read, J.; Pirrung, M.; Stryer, L.; Lu, A.; Solas, D.; Light-directed, spatially addressable parallel chemical synthesis; Science 1991, 251, 767.
[39] Gao, X.; Gulari, E.; Zhou, X.; In situ synthesis of oligonucleotide microarrays; Biopolymers 2004, 73, 579.
[40] Chow, B. Y.; Emig, C. J.; Jacobson, J. M.; Photoelectrochemical synthesis of DNA microarrays; Proc. Natl. Acad. Sci. U. S. A. 2009, 106, 15219.
[41] Chen, C.-C.; Zhou, Y.; Baker, L. A.; Scanning Ion Conductance Microscopy; Annu. Rev. Anal. Chem. 2012, 5, 207.

7 References
128
[42] Bruckbauer, A.; Ying, L.; Rothery, A. M.; Zhou, D.; Shevchuk, A. I.; Abell, C.; Korchev, Y. E.; Klenerman, D.; Writing with DNA and Protein Using a Nanopipet for Controlled Delivery; J. Am. Chem. Soc. 2002, 124, 8810.
[43] Bruckbauer, A.; Zhou, D.; Ying, L.; Korchev, Y. E.; Abell, C.; Klenerman, D.; Multicomponent Submicron Features of Biomolecules Created by Voltage Controlled Deposition from a Nanopipet; J. Am. Chem. Soc. 2003, 125, 9834.
[44] Lovsky, Y.; Lewis, A.; Sukenik, C.; Grushka, E.; Atomic-force-controlled capillary electrophoretic nanoprinting of proteins; Anal. Bioanal. Chem. 2010, 396, 133.
[45] Loh, O. Y.; Ho, A. M.; Rim, J. E.; Kohli, P.; Patankar, N. A.; Espinosa, H. D.; Electric field-induced direct delivery of proteins by a nanofountain probe; Proc. Natl. Acad. Sci. U. S. A. 2008, 105, 16438.
[46] Zhou, M.; Yu, Y.; Blanchard, P.-Y.; Mirkin, M. V.; Surface Patterning Using Diazonium Ink Filled Nanopipette; Anal. Chem. 2015, 87, 10956.
[47] Wittstock, G.; Burchardt, M.; Pust, S. E.; Shen, Y.; Zhao, C.; Scanning Electrochemical Microscopy for Direct Imaging of Reaction Rates; Angew. Chem. Int. Ed. 2007, 46, 1584.
[48] Valenti, G.; Bardini, L.; Bonazzi, D.; Rapino, S.; Marcaccio, M.; Paolucci, F.; Creation of Reactive Micro Patterns on Silicon by Scanning Electrochemical Microscopy; J. Phys. Chem. C 2010, 114, 22165.
[49] Stratmann, L.; Gebala, M.; Schuhmann, W.; A Chemical Lift-off Process: Removing Non-Specific Adsorption in an Electrochemical Epstein-Barr Virus Immunoassay; ChemPhysChem 2013, 14, 2198.
[50] Ku, S.-Y.; Wong, K.-T.; Bard, A. J.; Surface Patterning with Fluorescent Molecules Using Click Chemistry Directed by Scanning Electrochemical Microscopy; J. Am. Chem. Soc. 2008, 130, 2392.
[51] Ktari, N.; Poncet, P.; Senechal, H.; Malaquin, L.; Kanoufi, F.; Combellas, C.; Patterning of Polystyrene by Scanning Electrochemical Microscopy. Biological Applications to Cell Adhesion; Langmuir 2010, 26, 17348.
[52] Shiku, H.; Uchida, I.; Matsue, T.; Microfabrication of Alkylsilanized Glass Substrate by Electrogenerated Hydroxyl Radical Using Scanning Electrochemical Microscopy; Langmuir 1997, 13, 7239.
[53] Shiku, H.; Takeda, T.; Yamada, H.; Matsue, T.; Uchida, I.; Microfabrication and Characterization of Diaphorase-Patterned Surfaces by Scanning Electrochemical Microscopy; Anal. Chem. 1995, 67, 312.
[54] Kaji, H.; Kanada, M.; Oyamatsu, D.; Matsue, T.; Nishizawa, M.; Microelectrochemical Approach to Induce Local Cell Adhesion and Growth on Substrates; Langmuir 2004, 20, 16.
[55] Zhao, C.; Witte, I.; Wittstock, G.; Switching On Cell Adhesion with Microelectrodes; Angew. Chem. Int. Ed. 2006, 45, 5469.
[56] Lesch, A.; Vaske, B.; Meiners, F.; Momotenko, D.; Cortés-Salazar, F.; Girault, H. H.; Wittstock, G.; Parallel Imaging and Template-Free Patterning of Self-Assembled Monolayers with Soft Linear Microelectrode Arrays; Angew. Chem. Int. Ed. 2012, 51, 10413.
[57] Pinson, J.; Podvorica, F.; Attachment of organic layers to conductive or semiconductive surfaces by reduction of diazonium salts; Chem. Soc. Rev. 2005, 34, 429.
[58] Bélanger, D.; Pinson, J.; Electrografting: a powerful method for surface modification; Chem. Soc. Rev. 2011, 40, 3995.
[59] Cougnon, C.; Mauzeroll, J.; Bélanger, D.; Patterning of Surfaces by Oxidation of Amine-Containing Compounds Using Scanning Electrochemical Microscopy; Angew. Chem. Int. Ed. 2009, 48, 7395.
[60] Torbensen, K.; Malmos, K.; Kanoufi, F.; Combellas, C.; Pedersen, S. U.; Daasbjerg, K.; Using Time-Resolved Electrochemical Patterning to Gain Fundamental Insight into Aryl-Radical Surface Modification; ChemPhysChem 2012, 13, 3303.

7 References
129
[61] Torbensen, K.; Kongsfelt, M.; Shimizu, K.; Pedersen, E. B.; Skrydstrup, T.; Pedersen, S. U.; Daasbjerg, K.; Patterned Carboxylation of Graphene Using Scanning Electrochemical Microscopy; Langmuir 2015.
[62] Matrab, T.; Combellas, C.; Kanoufi, F.; Scanning electrochemical microscopy for the direct patterning of a gold surface with organic moities derived from iodonium salt; Electrochem. Commun. 2008, 10, 1230.
[63] Coates, M.; Cabet, E.; Griveau, S.; Nyokong, T.; Bedioui, F.; Microelectrochemical patterning of gold surfaces using 4-azidobenzenediazonium and scanning electrochemical microscopy; Electrochem. Commun. 2011, 13, 150.
[64] Hauquier, F.; Matrab, T.; Kanoufi, F.; Combellas, C.; Local direct and indirect reduction of electrografted aryldiazonium/gold surfaces for polymer brushes patterning; Electrochim. Acta 2009, 54, 5127.
[65] Unruh, D. A.; Mauldin, C.; Pastine, S. J.; Rolandi, M.; Fréchet, J. M. J.; Bifunctional Patterning of Mixed Monolayer Surfaces Using Scanning Probe Lithography for Multiplexed Directed Assembly; J. Am. Chem. Soc. 2010, 132, 6890.
[66] Schwamborn, S.; Stoica, L.; Neugebauer, S.; Reda, T.; Schmidt, H.-L.; Schuhmann, W.; Local Modulation of the Redox State of p-Nitrothiophenol Self-Assembled Monolayers Using the Direct Mode of Scanning Electrochemical Microscopy; ChemPhysChem 2009, 10, 1066.
[67] Lee, J. S.; Chi, Y. S.; Choi, I. S.; Kim, J.; Local Scanning Probe Polymerization of an Organic Monolayer Covalently Grafted on Silicon; Langmuir 2012, 28, 14496.
[68] Wittstock, G.; Schuhmann, W.; Formation and imaging of microscopic enzymatically active spots on an alkanethiolate-covered gold electrode by scanning electrochemical microscopy; Anal. Chem. 1997, 69, 5059.
[69] Turyan, I.; Matsue, T.; Mandler, D.; Patterning and Characterization of Surfaces with Organic and Biological Molecules by the Scanning Electrochemical Microscope; Anal. Chem. 2000, 72, 3431.
[70] Fortin, E.; Defontaine, Y.; Mailley, P.; Livache, T.; Szunerits, S.; Micro-Imprinting of Oligonucleotides and Oligonucleotide Gradients on Gold Surfaces: A New Approach Based on the Combination of Scanning Electrochemical Microscopy and Surface Plasmon Resonance Imaging (SECM/ SPR-i); Electroanalysis 2005, 17, 495.
[71] Chen, P.-C.; Chen, R. L. C.; Cheng, T.-J.; Wittstock, G.; Localized Deposition of Chitosan as Matrix for Enzyme Immobilization; Electroanalysis 2009, 21, 804.
[72] Evans, S. A.; Brakha, K.; Billon, M.; Mailley, P.; Denuault, G.; Scanning electrochemical microscopy (SECM): localized glucose oxidase immobilization via the direct electrochemical microspotting of polypyrrole–biotin films; Electrochem. Commun. 2005, 7, 135.
[73] Agarwal, G.; Naik, R. R.; Stone, M. O.; Immobilization of Histidine-Tagged Proteins on Nickel by Electrochemical Dip Pen Nanolithography; J. Am. Chem. Soc. 2003, 125, 7408.
[74] Cai, Y.; Ocko, B. M.; Electro Pen Nanolithography; J. Am. Chem. Soc. 2005, 127, 16287.
[75] Li, T.; Hu, W.; Electrochemistry in nanoscopic volumes; Nanoscale 2011, 3, 166.
[76] Chen, S.; Liu, Y.; Electrochemistry at nanometer-sized electrodes; Phys. Chem. Chem. Phys. 2013, 16, 635.
[77] Amatore, C.; Arbault, S.; Guille, M.; Lemaitre, F.; Electrochemical Monitoring of Single Cell Secretion: Vesicular Exocytosis and Oxidative Stress; Chem. Rev. 2008, 108, 2585.
[78] Schulte, A.; Nebel, M.; Schuhmann, W.; Scanning Electrochemical Microscopy in Neuroscience; Annu. Rev. Anal. Chem. 2010, 3, 299.
[79] Wolbarsht, M. L.; Macnichol, E. F.; Wagner, H. G.; Glass Insulated Platinum Microelectrode; Science 1960, 132, 1309.
[80] Penner, R. M.; Heben, M. J.; Longin, T. L.; Lewis, N. S.; Fabrication and Use of Nanometer-Sized Electrodes in Electrochemistry; Science 1990, 250, 1118.

7 References
130
[81] Nagahara, L. A.; Thundat, T.; Lindsay, S. M.; Preparation and characterization of STM tips for electrochemical studies; Rev. Sci. Instrum. 1989, 60, 3128.
[82] Mirkin, M. V.; Fan, F.-R. F.; Bard, A. J.; Scanning electrochemical microscopy Part 13. Evaluation of the tip shapes of nanometer size microelectrodes; J. Electroanal. Chem. 1992, 328, 47.
[83] Schulte, A.; Chow, R. H.; A Simple Method for Insulating Carbon-Fiber Microelectrodes Using Anodic Electrophoretic Deposition of Paint; Anal. Chem. 1996, 68, 3054.
[84] Watkins, J. J.; Chen, J.; White, H. S.; Abruña, H. D.; Maisonhaute, E.; Amatore, C.; Zeptomole Voltammetric Detection and Electron-Transfer Rate Measurements Using Platinum Electrodes of Nanometer Dimensions; Anal. Chem. 2003, 75, 3962.
[85] Sun, P.; Zhang, Z.; Guo, J.; Shao, Y.; Fabrication of Nanometer-Sized Electrodes and Tips for Scanning Electrochemical Microscopy; Anal. Chem. 2001, 73, 5346.
[86] Bach, C. E.; Nichols, R. J.; Beckmann, W.; Meyer, H.; Schulte, A.; Besenhard, J. O.; Jannakoudakis, P. D.; Effective Insulation of Scanning Tunneling Microscopy Tips for Electrochemical Studies Using an Electropainting Method; J. Electrochem. Soc. 1993, 140, 1281.
[87] Chen, S.; Kucernak, A.; Fabrication of carbon microelectrodes with an effective radius of 1 nm; Electrochem. Commun. 2002, 4, 80.
[88] Li, X.; Majdi, S.; Dunevall, J.; Fathali, H.; Ewing, A. G.; Quantitative Measurement of Transmitters in Individual Vesicles in the Cytoplasm of Single Cells with Nanotip Electrodes; Angew. Chem. Int. Ed. 2015, 54, 11978.
[89] Li, Y.-T.; Zhang, S.-H.; Wang, L.; Xiao, R.-R.; Liu, W.; Zhang, X.-W.; Zhou, Z.; Amatore, C.; Huang, W.-H.; Nanoelectrode for Amperometric Monitoring of Individual Vesicular Exocytosis Inside Single Synapses; Angew. Chem. Int. Ed. 2014, 53, 12456.
[90] Shao, Y.; Mirkin, M. V.; Fish, G.; Kokotov, S.; Palanker, D.; Lewis, A.; Nanometer-Sized Electrochemical Sensors; Anal. Chem. 1997, 69, 1627.
[91] Katemann Ballesteros, B.; Schuhmann, W.; Fabrication and Characterization of Needle-Type Pt-Disk Nanoelectrodes; Electroanalysis 2002, 14, 22.
[92] Velmurugan, J.; Sun, P.; Mirkin, M. V.; Scanning Electrochemical Microscopy with Gold Nanotips: The Effect of Electrode Material on Electron Transfer Rates; J. Phys. Chem. C 2009, 113, 459.
[93] Noël, J.-M.; Velmurugan, J.; Gökmeşe, E.; Mirkin, M. V.; Fabrication, Characterization, and Chemical Etching of Ag Nanoelectrodes; J. Solid State Electrochem. 2013, 17, 385.
[94] Li, Y. X.; Bergman, D.; Zhang, B.; Preparation and Electrochemical Response of 1-3 nm Pt Disk Electrodes; Anal. Chem. 2009, 81, 5496.
[95] Zhang, B.; Galusha, J.; Shiozawa, P. G.; Wang, G. L.; Bergren, A. J.; Jones, R. M.; White, R. J.; Ervin, E. N.; Cauley, C. C.; White, H. S.; Bench-Top Method for Fabricating Glass-Sealed Nanodisk Electrodes, Glass Nanopore Electrodes, and Glass Nanopore Membranes of Controlled Size; Anal. Chem. 2007, 79, 4778.
[96] Ballesteros Katemann, B.; Schulte, A.; Schuhmann, W.; Constant-Distance Mode Scanning Electrochemical Microscopy (SECM)—Part I: Adaptation of a Non-Optical Shear-Force-Based Positioning Mode for SECM Tips; Chem. Eur. J. 2003, 9, 2025.
[97] Ballesteros Katemann, B.; Schulte, A.; Schuhmann, W.; Constant-Distance Mode Scanning Electrochemical Microscopy. Part II: High-Resolution SECM Imaging Employing Pt Nanoelectrodes as Miniaturized Scanning Probes; Electroanalysis 2004, 16, 60.
[98] Etienne, M.; Anderson, E. C.; Evans, S. R.; Schuhmann, W.; Fritsch, I.; Feedback-Independent Pt Nanoelectrodes for Shear Force-Based Constant-Distance Mode Scanning Electrochemical Microscopy; Anal. Chem. 2006, 78, 7317.
[99] Takahashi, Y.; Shevchuk, A. I.; Novak, P.; Zhang, Y.; Ebejer, N.; Macpherson, J. V.; Unwin, P. R.; Pollard, A. J.; Roy, D.; Clifford, C. A.; Shiku, H.; Matsue, T.; Klenerman, D.; Korchev, Y. E.; Multifunctional Nanoprobes for Nanoscale Chemical Imaging and Localized Chemical Delivery at Surfaces and Interfaces; Angew. Chem. Int. Ed. 2011, 50, 9638.

7 References
131
[100] Takahashi, Y.; Shevchuk, A. I.; Novak, P.; Babakinejad, B.; Macpherson, J.; Unwin, P. R.; Shiku, H.; Gorelik, J.; Klenerman, D.; Korchev, Y. E.; Matsue, T.; Topographical and electrochemical nanoscale imaging of living cells using voltage-switching mode scanning electrochemical microscopy; Proc. Natl. Acad. Sci. U. S. A. 2012, 109, 11540.
[101] Kim, Y. T.; Scarnulis, D. M.; Ewing, A. G.; Carbon-Ring Electrodes with 1-µm Tip Diameter; Anal. Chem. 1986, 58, 1782.
[102] Wong, D. K. Y.; Xu, L. Y. F.; Voltammetric Studies of Carbon Disk Electrodes with Submicrometer-Sized Structural Diameters; Anal. Chem. 1995, 67, 4086.
[103] McKelvey, K.; Paulose Nadappuram, B.; Actis, P.; Takahashi, Y.; Korchev, Y. E.; Matsue, T.; Robinson, C.; Unwin, P. R.; Fabrication, Characterization, and Functionalization of Dual Carbon Electrodes as Probes for Scanning Electrochemical Microscopy (SECM); Anal. Chem. 2013, 85, 7519.
[104] Paulose Nadappuram, B.; McKelvey, K.; Byers, J. C.; Güell, A. G.; Colburn, A. W.; Lazenby, R. A.; Unwin, P. R.; Quad-Barrel Multifunctional Electrochemical and Ion Conductance Probe for Voltammetric Analysis and Imaging; Anal. Chem. 2015, 87, 3566.
[105] McNally, M.; Wong, D. K. Y.; An in Vivo Probe Based on Mechanically Strong but Structurally Small Carbon Electrodes with an Appreciable Surface Area; Anal. Chem. 2001, 73, 4793.
[106] Schrlau, M. G.; Falls, E. M.; Ziober, B. L.; Bau, H. H.; Carbon nanopipettes for cell probes and intracellular injection; Nanotechnology 2008, 19, 15101.
[107] Vitol, E. A.; Schrlau, M. G.; Bhattacharyya, S.; Ducheyne, P.; Bau, H. H.; Friedman, G.; Gogotsi, Y.; Effects of Deposition Conditions on the Structure and Chemical Properties of Carbon Nanopipettes; Chem. Vap. Deposition 2009, 15, 204.
[108] Singhal, R.; Bhattacharyya, S.; Orynbayeva, Z.; Vitol, E.; Friedman, G.; Gogotsi, Y.; Small diameter carbon nanopipettes; Nanotechnology 2010, 21, 15304.
[109] Schrlau, M. G.; Brailoiu, E.; Patel, S.; Gogotsi, Y.; Dun, N. J.; Bau, H. H.; Carbon nanopipettes characterize calcium release pathways in breast cancer cells; Nanotechnology 2008, 19, 325102.
[110] Schrlau, M. G.; Dun, N. J.; Bau, H. H.; Cell Electrophysiology with Carbon Nanopipettes; ACS Nano 2009, 3, 563.
[111] Yu, Y.; Noël, J.-M.; Mirkin, M. V.; Gao, Y.; Mashtalir, O.; Friedman, G.; Gogotsi, Y.; Carbon Pipette-Based Electrochemical Nanosampler; Anal. Chem. 2014, 86, 3365.
[112] Yum, K.; Cho, H. N.; Hu, J.; Yu, M.-F.; Individual Nanotube-Based Needle Nanoprobes for Electrochemical Studies in Picoliter Microenvironments; ACS Nano 2007, 1, 440.
[113] Singhal, R.; Orynbayeva, Z.; Kalyana Sundaram, R. V.; Niu, J. J.; Bhattacharyya, S.; Vitol, E. A.; Schrlau, M. G.; Papazoglou, E. S.; Friedman, G.; Gogotsi, Y.; Multifunctional carbon-nanotube cellular endoscopes; Nature Nanotechnol. 2011, 6, 57.
[114] Angle, M. R.; Schaefer, A. T.; Neuronal Recordings with Solid-Conductor Intracellular Nanoelectrodes (SCINEs); PLoS ONE 2012, 7, e43194.
[115] Takahashi, Y.; Shevchuk, A. I.; Novak, P.; Murakami, Y.; Shiku, H.; Korchev, Y. E.; Matsue, T.; Simultaneous Noncontact Topography and Electrochemical Imaging by SECM/SICM Featuring Ion Current Feedback Regulation; J. Am. Chem. Soc. 2010, 132, 10118.
[116] Comstock, D. J.; Elam, J. W.; Pellin, M. J.; Hersam, M. C.; Integrated Ultramicroelectrode−Nanopipet Probe for Concurrent Scanning Electrochemical Microscopy and Scanning Ion Conductance Microscopy; Anal. Chem. 2010, 82, 1270.
[117] Zheng, X. T.; Hu, W.; Wang, H.; Yang, H.; Zhou, W.; Li, C. M.; Bifunctional electro-optical nanoprobe to real-time detect local biochemical processes in single cells; Biosens. Bioelectron. 2011, 26, 4484.
[118] Takahashi, Y.; Hirano, Y.; Yasukawa, T.; Shiku, H.; Yamada, H.; Matsue, T.; Topographic, Electrochemical, and Optical Images Captured Using Standing Approach Mode Scanning Electrochemical/Optical Microscopy; Langmuir 2006, 22, 10299.
7 References
132
[119] Takahashi, Y.; Shiku, H.; Murata, T.; Yasukawa, T.; Matsue, T.; Transfected Single-Cell Imaging by Scanning Electrochemical Optical Microscopy with Shear Force Feedback Regulation; Anal. Chem. 2009, 81, 9674.
[120] Macpherson, J. V.; Unwin, P. R.; Combined Scanning Electrochemical−Atomic Force Microscopy; Anal. Chem. 2000, 72, 276.
[121] Burt, D. P.; Wilson, N. R.; Weaver, J. M. R.; Dobson, P. S.; Macpherson, J. V.; Nanowire Probes for High Resolution Combined Scanning Electrochemical Microscopy - Atomic Force Microscopy; Nano Lett. 2005, 5, 639.
[122] Wilson, N. R.; Macpherson, J. V.; Carbon nanotube tips for atomic force microscopy; Nature Nanotechnol. 2009, 4, 483.
[123] Kranz, C.; Friedbacher, G.; Mizaikoff, B.; Lugstein, A.; Smoliner, J.; Bertagnolli, E.; Integrating an Ultramicroelectrode in an AFM Cantilever: Combined Technology for Enhanced Information; Anal. Chem. 2001, 73, 2491.
[124] Eifert, A.; Mizaikoff, B.; Kranz, C.; Advanced fabrication process for combined atomic force-scanning electrochemical microscopy (AFM-SECM) probes; Micron 2015, 68, 27.
[125] Agyekum, I.; Nimley, C.; Yang, C.; Sun, P.; Combination of Scanning Electron Microscopy in the Characterization of a Nanometer-Sized Electrode and Current Fluctuation Observed at a Nanometer-Sized Electrode; J. Phys. Chem. C 2010, 114, 14970.
[126] Sun, Y.; Liu, Y.; Liang, Z.; Xiong, L.; Wang, A.; Chen, S.; On the Applicability of Conventional Voltammetric Theory to Nanoscale Electrochemical Interfaces; J. Phys. Chem. C 2009, 113, 9878.
[127] Watkins, J. J.; White, H. S.; The Role of the Electrical Double Layer and Ion Pairing on the Electrochemical Oxidation of Hexachloroiridate(III) at Pt Electrodes of Nanometer Dimensions; Langmuir 2004, 20, 5474.
[128] He, R.; Chen, S.; Yang, F.; Wu, B.; Dynamic Diffuse Double-Layer Model for the Electrochemistry of Nanometer-Sized Electrodes; J. Phys. Chem. B 2006, 110, 3262.
[129] Baranski, A. S.; On possible systematic errors in determinations of charge transfer kinetics at very small electrodes; J. Electroanal. Chem. 1991, 307, 287.
[130] Liu, Y.; He, R.; Zhang, Q.; Chen, S.; Theory of Electrochemistry for Nanometer-Sized Disk Electrodes; J. Phys. Chem. C 2010, 114, 10812.
[131] Amatore, C.; Grün, F.; Maisonhaute, E.; Electrochemistry within a Limited Number of Molecules: Delineating the Fringe Between Stochastic and Statistical Behavior; Angew. Chem. Int. Ed. 2003, 42, 4944.
[132] García-Morales, V.; Krischer, K.; Fluctuation enhanced electrochemical reaction rates at the nanoscale; Proc. Natl. Acad. Sci. U. S. A. 2010, 107, 4528.
[133] Sun, P.; Mirkin, M. V.; Kinetics of Electron-Transfer Reactions at Nanoelectrodes; Anal. Chem. 2006, 78, 6526.
[134] Conyers, J. L.; White, H. S.; Electrochemical Characterization of Electrodes with Submicrometer Dimensions; Anal. Chem. 2000, 72, 4441.
[135] Yu, Y.; Gao, Y.; Hu, K.; Blanchard, P.-Y.; Noël, J.-M.; Nareshkumar, T.; Phani, K. L.; Friedman, G.; Gogotsi, Y.; Mirkin, M. V.; Electrochemistry and Electrocatalysis at Single Gold Nanoparticles Attached to Carbon Nanoelectrodes; ChemElectroChem 2015, 2, 58.
[136] Li, Y.; Cox, J. T.; Zhang, B.; Electrochemical Responses and Electrocatalysis at Single Au Nanoparticles; J. Am. Chem. Soc. 2010, 132, 3047.
[137] Nogala, W.; Velmurugan, J.; Mirkin, M. V.; Atomic Force Microscopy of Electrochemical Nanoelectrodes; Anal. Chem. 2012, 84, 5192.
[138] Nioradze, N.; Chen, R.; Kim, J.; Shen, M.; Santhosh, P.; Amemiya, S.; Origins of Nanoscale Damage to Glass-Sealed Platinum Electrodes with Submicrometer and Nanometer Size; Anal. Chem. 2013, 85, 6198.

7 References
133
[139] Pitta Bauermann, L.; Schuhmann, W.; Schulte, A.; An advanced biological scanning electrochemical microscope (Bio-SECM) for studying individual living cells; Phys. Chem. Chem. Phys. 2004, 6, 4003.
[140] Nebel, M.; Eckhard, K.; Erichsen, T.; Schulte, A.; Schuhmann, W.; 4D shearforce-based constant-distance mode scanning electrochemical microscopy; Anal. Chem. 2010, 82, 7842.
[141] Sun, T.; Yu, Y.; Zacher, B. J.; Mirkin, M. V.; Scanning Electrochemical Microscopy of Individual Catalytic Nanoparticles; Angew. Chem. Int. Ed. 2014, 53, 14120.
[142] Paulose Nadappuram, B.; McKelvey, K.; Al Botros, R.; Colburn, A. W.; Unwin, P. R.; Fabrication and Characterization of Dual Function Nanoscale pH-Scanning Ion Conductance Microscopy (SICM) Probes for High Resolution pH Mapping; Anal. Chem. 2013, 85, 8070.
[143] O'Connell, M. A.; Lewis, J. R.; Wain, A. J.; Electrochemical imaging of hydrogen peroxide generation at individual gold nanoparticles; Chem. Commun. 2015, 51, 10314.
[144] Korchev, Y. E.; Bashford, C. L.; Milovanovic, M.; Vodyanoy, I.; Lab, M. J.; Scanning Ion Conductance Microscopy of Living Cells; Biophys. J. 1997, 73, 653.
[145] Şen, M.; Takahashi, Y.; Matsumae, Y.; Horiguchi, Y.; Kumatani, A.; Ino, K.; Shiku, H.; Matsue, T.; Improving the Electrochemical Imaging Sensitivity of Scanning Electrochemical Microscopy-Scanning Ion Conductance Microscopy by Using Electrochemical Pt Deposition; Anal. Chem. 2015, 87, 3484.
[146] O'Connell, M. A.; Wain, A. J.; Mapping Electroactivity at Individual Catalytic Nanostructures Using High-Resolution Scanning Electrochemical-Scanning Ion Conductance Microcopy; Anal. Chem. 2014, 86, 12100.
[147] Eckhard, K.; Chen, X.; Turcu, F.; Schuhmann, W.; Redox competition mode of scanning electrochemical microscopy (RC-SECM) for visualisation of local catalytic activity; Phys. Chem. Chem. Phys. 2006, 8, 5359.
[148] Koepke, J. I.; Wood, C. S.; Terlecky, L. J.; Walton, P. A.; Terlecky, S. R.; Progeric effects of catalase inactivation in human cells; Toxicol. Appl. Pharm. 2008, 232, 99.
[149] Kim, S. Y.; Lee, S. M.; Park, J.-W.; Antioxidant enzyme inhibitors enhance singlet oxygen-induced cell death in HL-60 cells; Free Radical Res. 2006, 40, 1190.
[150] Finkel, T.; Holbrook, N. J.; Oxidants, oxidative stress and the biology of ageing; Nature 2000, 408, 239.
[151] Medzhitov, R.; Origin and physiological roles of inflammation; Nature 2008, 454, 428.
[152] Patten, D. A.; Germain, M.; Kelly, M. A.; Slack, R. S.; Reactive oxygen species: stuck in the middle of neurodegeneration; J. Alzheimers Dis. 2010, 20, S357-S367.
[153] Kim, H. K.; Park, S. K.; Zhou, J.-L.; Taglialatela, G.; Chung, K.; Coggeshall, R. E.; Chung, J. M.; Reactive oxygen species (ROS) play an important role in a rat model of neuropathic pain; Pain 2004, 111, 116.
[154] Kohlhaas, M.; Liu, T.; Knopp, A.; Zeller, T.; Ong, M. F.; Bohm, M.; O'Rourke, B.; Maack, C.; Elevated Cytosolic Na+ Increases Mitochondrial Formation of Reactive Oxygen Species in Failing Cardiac Myocytes; Circulation 2010, 121, 1606.
[155] Waris, G.; Ahsan, H.; Reactive oxygen species: role in the development of cancer and various chronic conditions; J. Carcinog. 2006, 5, 14.
[156] Burns, J. M.; Cooper, W. J.; Ferry, J. L.; King, D. W.; DiMento, B. P.; McNeill, K.; Miller, C. J.; Miller, W. L.; Peake, B. M.; Rusak, S. A.; Rose, A. L.; Waite, T. D.; Methods for reactive oxygen species (ROS) detection in aqueous environments; Aquat. Sci. 2012, 74, 683.
[157] Slauch, J. M.; How does the oxidative burst of macrophages kill bacteria? Still an open question; Mol. Microbiol. 2011, 80, 580.
[158] Dikalov, S.; Griendling, K. K.; Harrison, D. G.; Measurement of reactive oxygen species in cardiovascular studies; Hypertension 2007, 49, 717.
[159] Wilson, G. S.; Johnson, M. A.; In-vivo electrochemistry: what can we learn about living systems?; Chem. Rev. 2008, 108, 2462.

7 References
134
[160] Bernard, A.-S.; Giroud, C.; Ching, H. Y. V.; Meunier, A.; Ambike, V.; Amatore, C.; Collignon, M. G.; Lemaître, F.; Policar, C.; Evaluation of the anti-oxidant properties of a SOD-mimic Mn-complex in activated macrophages; Dalton Trans. 2012, 41, 6399.
[161] Oyama, Y.; Hayashi, A.; Ueha, T.; Maekawa, K.; Characterization of 2′,7′-dichlorofluorescin fluorescence in dissociated mammalian brain neurons; Brain Res. 1994, 635, 113.
[162] Carter, W. O.; Narayanan, P. K.; Robinson, J. P.; Intracellular hydrogen peroxide and superoxide anion detection in endothelial cells; J. Leukoc. Biol. 1994, 55, 253.
[163] Miller, E. W.; Tulyathan, O.; Tulyanthan, O.; Isacoff, E. Y.; Chang, C. J.; Molecular imaging of hydrogen peroxide produced for cell signaling; Nat. Chem. Biol. 2007, 3, 263.
[164] Lippert, A. R.; Van de Bittner, Genevieve C; Chang, C. J.; Boronate oxidation as a bioorthogonal reaction approach for studying the chemistry of hydrogen peroxide in living systems; Acc. Chem. Res. 2011, 44, 793.
[165] Lee, H.; Lee, K.; Kim, I.-K.; Park, T. G.; Fluorescent Gold Nanoprobe Sensitive to Intracellular Reactive Oxygen Species; Adv. Funct. Mater. 2009, 19, 1884.
[166] Chen, T.; Hu, Y.; Cen, Y.; Chu, X.; Lu, Y.; A dual-emission fluorescent nanocomplex of gold-cluster-decorated silica particles for live cell imaging of highly reactive oxygen species; J. Am. Chem. Soc. 2013, 135, 11595.
[167] Uusitalo, L. M.; Hempel, N.; Recent advances in intracellular and in vivo ROS sensing: focus on nanoparticle and nanotube applications; Int. J. Mol. Sci. 2012, 13, 10660.
[168] Belousov, V. V.; Fradkov, A. F.; Lukyanov, K. A.; Staroverov, D. B.; Shakhbazov, K. S.; Terskikh, A. V.; Lukyanov, S.; Genetically encoded fluorescent indicator for intracellular hydrogen peroxide; Nat. Methods 2006, 3, 281.
[169] Stone, J. R.; Yang, S.; Hydrogen peroxide: A signaling messenger; Antioxid. Redox Sign. 2006, 8, 243.
[170] Chen, W.; Cai, S.; Ren, Q.-Q.; Wen, W.; Zhao, Y.-D.; Recent advances in electrochemical sensing for hydrogen peroxide: a review; Analyst 2011, 137, 49.
[171] Kulagina, N. V.; Michael, A. C.; Monitoring Hydrogen Peroxide in the Extracellular Space of the Brain with Amperometric Microsensors; Anal. Chem. 2003, 75, 4875.
[172] Sanford, A. L.; Morton, S. W.; Whitehouse, K. L.; Oara, H. M.; Lugo-Morales, L. Z.; Roberts, J. G.; Sombers, L. A.; Voltammetric detection of hydrogen peroxide at carbon fiber microelectrodes; Anal. Chem. 2010, 82, 5205.
[173] Amatore, C.; Arbault, S.; Bouton, C.; Drapier, J.-C.; Ghandour, H.; Koh, A. C. W.; Real-time amperometric analysis of reactive oxygen and nitrogen species released by single immunostimulated macrophages; ChemBioChem 2008, 9, 1472.
[174] Amatore, C.; Arbault, S.; Bouton, C.; Coffi, K.; Drapier, J.-C.; Ghandour, H.; Tong, Y.; Monitoring in real time with a microelectrode the release of reactive oxygen and nitrogen species by a single macrophage stimulated by its membrane mechanical depolarization; ChemBioChem 2006, 7, 653.
[175] Amatore, C.; Arbault, S.; Koh, A. C. W.; Simultaneous Detection of Reactive Oxygen and Nitrogen Species Released by a Single Macrophage by Triple Potential-Step Chronoamperometry; Anal. Chem. 2010, 82, 1411.
[176] Wang, Y.; Noel, J.-M.; Velmurugan, J.; Nogala, W.; Mirkin, M. V.; Lu, C.; Guille Collignon, M.; Lemaitre, F.; Amatore, C.; Nanoelectrodes for determination of reactive oxygen and nitrogen species inside murine macrophages; Proc. Natl. Acad. Sci. U. S. A. 2012, 109, 11534.
[177] Salamifar, S. E.; Lee, S.; Lai, R. Y.; Electrochemical hydrogen peroxide sensors fabricated using cytochrome c immobilized on macroelectrodes and ultramicroelectrodes; Colloids Surf., B 2014, 123C, 866.
[178] Rui, Q.; Komori, K.; Tian, Y.; Liu, H.; Luo, Y.; Sakai, Y.; Electrochemical biosensor for the detection of H2O2 from living cancer cells based on ZnO nanosheets; Anal. Chim. Acta 2010, 670, 57.

7 References
135
[179] Suraniti, E.; Ben-Amor, S.; Landry, P.; Rigoulet, M.; Fontaine, E.; Bottari, S.; Devin, A.; Sojic, N.; Mano, N.; Arbault, S.; Electrochemical monitoring of the early events of hydrogen peroxide production by mitochondria; Angew. Chem. Int. Ed. 2014, 53, 6655.
[180] Xu, Q.; Liu, S.-Y.; Zou, Q.-J.; Guo, X.-L.; Dong, X.-Y.; Li, P.-W.; Song, D.-Y.; Chen, H.; Zhao, Y.-D.; Microsensor in vivo monitoring of oxidative burst in oilseed rape (Brassica napus L.) leaves infected by Sclerotinia sclerotiorum; Anal. Chim. Acta 2009, 632, 21.
[181] Liu, X.; Zweier, J. L.; A real-time electrochemical technique for measurement of cellular hydrogen peroxide generation and consumption; Free Radic. Biol. Med. 2001, 31, 894.
[182] Ricci, F.; Palleschi, G.; Sensor and biosensor preparation, optimisation and applications of Prussian Blue modified electrodes; Biosens. Bioelectron. 2005, 21, 389.
[183] Komkova, M. A.; Holzinger, A.; Hartmann, A.; Khokhlov, A. R.; Kranz, C.; Karyakin, A. A.; Voronin, O. G.; Ultramicrosensors based on transition metal hexacyanoferrates for scanning electrochemical microscopy; Beilstein J. Nanotechnol. 2013, 4, 649.
[184] Li, J.; Yu, J.; Fabrication of Prussian Blue modified ultramicroelectrode for GOD imaging using scanning electrochemical microscopy; Bioelectrochemistry 2008, 72, 102.
[185] Salazar, P.; Martín, M.; Roche, R.; O’Neill, R.; González-Mora, J.; Prussian Blue-modified microelectrodes for selective transduction in enzyme-based amperometric microbiosensors for in vivo neurochemical monitoring; Electrochim. Acta 2010, 55, 6476.
[186] Leszczyszyn, D. J.; Jankowski, J. A.; Viveros, O. H.; Diliberto, E. J.; Near, J. A.; Wightman, R. M.; Nicotinic Receptor-mediated Catecholamine Secretion from Individual Chromaffin Cells. Chemical Evidence for Exocytosis; J. Biol. Chem. 1990, 265, 14736.
[187] Mosharov, E. V.; Sulzer, D.; Analysis of exocytotic events recorded by amperometry; Nat. Methods 2005, 2, 651.
[188] Troyer, K. P.; Heien, M. L.; Venton, B.; Wightman, R.; Neurochemistry and electroanalytical probes; Curr. Opin. Chem. Biol. 2002, 6, 696.
[189] Majdi, S.; Ren, L.; Fathali, H.; Li, X.; Ewing, A. G.; Selected recent in vivo studies on chemical measurements in invertebrates; Analyst 2015.
[190] Whalen, W. J.; Riley, J.; Nair, P.; A microelectrode for measuring intracellular PO2; J. Appl. Physiol. 1967, 23, 798-&.
[191] Lau, Y. Y.; Abe, T.; Ewing, A. G.; Voltammetric Measurement of Oxygen in Single Neurons Using Platinized Carbon Ring Electrodes; Anal. Chem. 1992, 64, 1702.
[192] Chien, J. B.; Wallingford, R. A.; Ewing, A. G.; Estimation of Free Dopamine in the Cytoplasm of the Giant Dopamine Cell of Planorbis corneus by Voltammetry and Capillary Electrophoresis; J. Neurochem. 1990, 54, 633.
[193] Lau, Y. Y.; Wong, D.; Ewing, A. G.; Intracellular Voltammetry at Ultrasmall Platinum Electrodes; Microchem. J. 1993, 47, 308.
[194] Abe, T.; Lau, Y. Y.; Ewing, A. G.; Intracellular Analysis with an Immobilized-Enzyme Glucose Electrode Having a 2-µm Diameter and Subsecond Response Times; J. Am. Chem. Soc. 1991, 113, 7421.
[195] Malinski, T.; Taha, Z.; Nitric oxide release from a single cell measured in situ by a porphyrinic-based microsensor; Nature 1992, 358, 676.
[196] Nagamine, K.; Takahashi, Y.; Ino, K.; Shiku, H.; Matsue, T.; Influence of Tip Size on Single Yeast Cell Imaging Using Scanning Electrochemical Microscopy; Electroanalysis 2011, 23, 1168.
[197] Schulte, A.; Schuhmann, W.; Single-cell Microelectrochemistry; Angew. Chem. Int. Ed. 2007, 46, 8760.
[198] Liu, Y.; Li, M.; Zhang, F.; Zhu, A.; Shi, G.; Development of Au Disk Nanoelectrode Down to 3 nm in Radius for Detection of Dopamine Release from a Single Cell; Anal. Chem. 2015, 87, 5531.
[199] Rees, H. R.; Anderson, S. E.; Privman, E.; Bau, H. H.; Venton, B. J.; Carbon Nanopipette Electrodes for Dopamine Detection in Drosophila; Anal. Chem. 2015, 87, 3849.

7 References
136
[200] Ino, K.; Ono, K.; Arai, T.; Takahashi, Y.; Shiku, H.; Matsue, T.; Carbon-Ag/AgCl Probes for Detection of Cell Activity in Droplets; Anal. Chem. 2013, 85, 3832.
[201] Sun, P.; Laforge, F. O.; Abeyweera, T. P.; Rotenberg, S. A.; Carpino, J.; Mirkin, M. V.; Nanoelectrochemistry of mammalian cells; Proc. Natl. Acad. Sci. U. S. A. 2008, 105, 443.
[202] Bakker, E.; Pretsch, E.; Nanoscale potentiometry; Trends Anal. Chem. 2008, 27, 612.
[203] Cui, Y.; Wei, Q.; Park, H.; Lieber, C. M.; Nanowire nanosensors for highly sensitive and selective detection of biological and chemical species; Science 2001, 293, 1289.
[204] Qing, Q.; Jiang, Z.; Xu, L.; Gao, R.; Mai, L.; Lieber, C. M.; Free-Standing Kinked Nanowire Transistor Probes for Targeted Intracellular Recording in Three Dimensions; Nature Nanotechnol. 2014, 9, 142.
[205] Tian, B.; Cohen-Karni, T.; Qing, Q.; Duan, X.; Xie, P.; Lieber, C. M.; Three-Dimensional, Flexible Nanoscale Field-Effect Transistors as Localized Bioprobes; Science 2010, 329, 830.
[206] Patolsky, F.; Zheng, G.; Lieber, C. M.; Fabrication of Silicon Nanowire Devices for Ultrasensitive, Label-Free, Real-Time Detection of Biological and Chemical Species; Nat. Protoc. 2006, 1, 1711.
[207] Wang, W. U.; Chen, C.; Lin, K.-h.; Fang, Y.; Lieber, C. M.; Label-free detection of small-molecule-protein interactions by using nanowire nanosensors; Proc. Natl. Acad. Sci. U. S. A. 2005, 102, 3208.
[208] Cui, Y.; Zhong, Z.; Wang, D.; Wang, W. U.; Lieber, C. M.; High Performance Silicon Nanowire Field Effect Transistors; Nano Lett. 2003, 3, 149.
[209] Patolsky, F.; Zheng, G.; Lieber, C. M.; Nanowire-based biosensors; Anal. Chem. 2006, 78, 4260.
[210] Hahm, J.-i.; Lieber, C. M.; Direct Ultrasensitive Electrical Detection of DNA and DNA Sequence Variations Using Nanowire Nanosensors; Nano Lett. 2004, 4, 51.
[211] Goldberger, J.; Sirbuly, D. J.; Law, M.; Yang, P.; ZnO nanowire transistors; J. Phys. Chem. B 2005, 109, 9.
[212] Janata, J.; Josowicz, M.; Conducting Polymers in Electronic Chemical Sensors; Nat. Mater. 2003, 2, 19.
[213] Song, H. S.; Kwon, O. S.; Lee, S. H.; Park, S. J.; Kim, U.-K.; Jang, J.; Park, T. H.; Human Taste Receptor-Functionalized Field Effect Transistor as a Human-Like Nanobioelectronic Tongue; Nano Lett. 2013, 13, 172.
[214] Yoon, H.; Ko, S.; Jang, J.; Field-Effect-Transistor Sensor Based on Enzyme-Functionalized Polypyrrole Nanotubes for Glucose Detection; J. Phys. Chem. B 2008, 112, 9992.
[215] Wanekaya, A. K.; Bangar, M. A.; Yun, M.; Chen, W.; Myung, N. V.; Mulchandani, A.; Field-Effect Transistors Based on Single Nanowires of Conducting Polymers; J. Phys. Chem. C 2007, 111, 5218.
[216] Woodson, M.; Liu, J.; Guided growth of nanoscale conducting polymer structures on surface-functionalized nanopatterns; J. Am. Chem. Soc. 2006, 128, 3760.
[217] Hangarter, C. M.; Bangar, M.; Mulchandani, A.; Myung, N. V.; Conducting polymer nanowires for chemiresistive and FET-based bio/chemical sensors; J. Mater. Chem. 2010, 20, 3131.
[218] Son, D.; Park, S. Y.; Kim, B.; Koh, J. T.; Kim, T. H.; An, S.; Jang, D.; Kim, G. T.; Jhe, W.; Hong, S.; Nanoneedle transistor-based sensors for the selective detection of intracellular calcium ions; ACS Nano 2011, 5, 3888.
[219] So, H.-M.; Won, K.; Kim, Y. H.; Kim, B.-K.; Ryu, B. H.; Na, P. S.; Kim, H.; Lee, J.-O.; Single-walled carbon nanotube biosensors using aptamers as molecular recognition elements; J. Am. Chem. Soc. 2005, 127, 11906.
[220] Schwierz, F.; Graphene transistors; Nature Nanotechnol. 2010, 5, 487.

7 References
137
[221] Kwon, O. S.; Lee, S. H.; Park, S. J.; An, J. H.; Song, H. S.; Kim, T.; Oh, J. H.; Bae, J.; Yoon, H.; Park, T. H.; Jang, J.; Large-scale graphene micropattern nano-biohybrids: high-performance transducers for FET-type flexible fluidic HIV immunoassays; Adv. Mater. 2013, 25, 4177.
[222] Park, S. J.; Kwon, O. S.; Lee, S. H.; Song, H. S.; Park, T. H.; Jang, J.; Ultrasensitive Flexible Graphene Based Field-Effect Transistor (FET)-Type Bioelectronic Nose; Nano Lett. 2012, 12, 5082.
[223] Park, J. W.; Park, S. J.; Kwon, O. S.; Lee, C.; Jang, J.; Polypyrrole nanotube embedded reduced graphene oxide transducer for field-effect transistor-type H2O2 biosensor; Anal. Chem. 2014, 86, 1822.
[224] Poghossian, A.; Ingebrandt, S.; Offenhäusser, A.; Schöning, M. J.; Field-Effect Devices for Detecting Cellular Signals; Semin. Cell Dev. Biol. 2009, 20, 41.
[225] Fromherz, P.; Offenhausser, A.; Vetter, T.; Weis, J.; A Neuron-Silicon Junction: A Retzius Cell of the Leech On an Insulated-Gate Field-Effect Transistor; Science 1991, 252, 1290.
[226] Duan, X.; Gao, R.; Xie, P.; Cohen-Karni, T.; Qing, Q.; Choe, H. S.; Tian, B.; Jiang, X.; Lieber, C. M.; Intracellular Recordings of Action Potentials by an Extracellular Nanoscale Field-Effect Transistor; Nature Nanotechnol. 2012, 7, 174.
[227] Lewis, L. N.; Chemical catalysis by colloids and clusters; Chem. Rev. 1993, 93, 2693.
[228] Burda, C.; Chen, X.; Narayanan, R.; El-Sayed, M. A.; Chemistry and properties of nanocrystals of different shapes; Chem. Rev. 2005, 105, 1025.
[229] A. Wieckowski, E. R. Savinova, C. G. Vayenas (Eds.) Catalysis and Electrocatalysis at Nanoparticle Surfaces, CRC Press, Hoboken, 2003.
[230] Peng, Z.; Yang, H.; Designer platinum nanoparticles; Nano Today 2009, 4, 143.
[231] Chen, S.; Kucernak, A.; Electrocatalysis under Conditions of High Mass Transport Rate: Oxygen Reduction on Single Submicrometer-Sized Pt Particles Supported on Carbon; J. Phys. Chem. B 2004, 108, 3262.
[232] Kahk, J. M.; Rees, N. V.; Pillay, J.; Tshikhudo, R.; Vilakazi, S.; Compton, R. G.; Electron transfer kinetics at single nanoparticles; Nano Today 2012, 7, 174.
[233] Cheng, W.; Compton, R. G.; Electrochemical detection of nanoparticles by ‘nano-impact’ methods; Trends Anal. Chem. 2014, 58, 79.
[234] Quinn, B. M.; van Ho, P. G. 't; Lemay, S. G.; Time-Resolved Electrochemical Detection of Discrete Adsorption Events; J. Am. Chem. Soc. 2004, 126, 8360.
[235] Zhou, Y.-G.; Rees, N. V.; Compton, R. G.; The electrochemical detection and characterization of silver nanoparticles in aqueous solution; Angew. Chem. Int. Ed. 2011, 50, 4219.
[236] Tschulik, K.; Compton, R. G.; Nanoparticle impacts reveal magnetic field induced agglomeration and reduced dissolution rates; Phys. Chem. Chem. Phys. 2014, 16, 13909.
[237] Xiao, X.; Bard, A. J.; Observing Single Nanoparticle Collisions at an Ultramicroelectrode by Electrocatalytic Amplification; J. Am. Chem. Soc. 2007, 129, 9610.
[238] Kwon, S. J.; Fan, F.-R. F.; Bard, A. J.; Observing Iridium Oxide (IrOx) Single Nanoparticle Collisions at Ultramicroelectrodes; J. Am. Chem. Soc. 2010, 132, 13165.
[239] Kim, Y.-R.; Lai, S. C. S.; McKelvey, K.; Zhang, G.; Perry, D.; Miller, T. S.; Unwin, P. R.; Nucleation and Aggregative Growth of Palladium Nanoparticles on Carbon Electrodes; J. Phys. Chem. C 2015, 119, 17389.
[240] Kleijn, S. E. F.; Lai, S. C. S.; Miller, T. S.; Yanson, A. I.; Koper, M. T. M.; Unwin, P. R.; Landing and Catalytic Characterization of Individual Nanoparticles on Electrode Surfaces; J. Am. Chem. Soc. 2012, 134, 18558.
[241] Chen, S.; Kucernak, A.; Electrodeposition of Platinum on Nanometer-Sized Carbon Electrodes; J. Phys. Chem. B 2003, 107, 8392.
[242] Sun, P.; Li, F.; Yang, C.; Sun, T.; Kady, I.; Hunt, B.; Zhuang, J.; Formation of a Single Gold Nanoparticle on a Nanometer-Sized Electrode and Its Electrochemical Behaviors; J. Phys. Chem. C 2013, 117, 6120.

7 References
138
[243] Lakbub, J.; Pouliwe, A.; Kamasah, A.; Yang, C.; Sun, P.; Electrochemical Behaviors of Single Gold Nanoparticles; Electroanalysis 2011, 23, 2270.
[244] Velmurugan, J.; Mirkin, M. V.; Fabrication of Nanoelectrodes and Metal Clusters by Electrodeposition; ChemPhysChem 2010, 11, 3011.
[245] Clausmeyer, J., Master Thesis, Ruhr-Universität Bochum, Bochum, 2012.
[246] Clausmeyer, J.; Henig, J.; Schuhmann, W.; Plumeré, N.; Scanning Droplet Cell for Chemoselective Patterning through Local Electroactivation of Protected Quinone Monolayers; ChemPhysChem 2014, 15, 151.
[247] Stratmann, L.; Clausmeyer, J.; Schuhmann, W.; Non-destructive Patterning of Carbon Electrodes by using the Direct Mode of Scanning Electrochemical Microscopy; ChemPhysChem 2015, 16, 3477.
[248] Yeo, W.-S.; Yousaf, M. N.; Mrksich, M.; Dynamic Interfaces between Cells and Surfaces: Electroactive Substrates that Sequentially Release and Attach Cells; J. Am. Chem. Soc. 2003, 125, 14994.
[249] Jung, H. J.; Hwang, I.; Kim, B. J.; Min, H.; Yu, H.; Lee, T. G.; Chung, T. D.; Selective and Direct Immobilization of Cysteinyl Biomolecules by Electrochemical Cleavage of Azo Linkage; Langmuir 2010, 26, 15087.
[250] Hong, D.; Kang, K.; Hong, S.-P.; Shon, H. K.; Son, J. G.; Lee, T. G.; Choi, I. S.; Electrochemical Release of Amine Molecules from Carbamate-Based, Electroactive Self-Assembled Monolayers; Langmuir 2012, 28, 17.
[251] Yousaf, M. N.; Houseman, B. T.; Mrksich, M.; Turning On Cell Migration with Electroactive Substrates; Angew. Chem. 2001, 113, 1127.
[252] Chan, E. W. L.; Park, S.; Yousaf, M. N.; An Electroactive Catalytic Dynamic Substrate that Immobilizes and Releases Patterned Ligands, Proteins, and Cells; Angew. Chem. Int. Ed. 2008, 47, 6267.
[253] Nguyen, N. H.; Esnault, C.; Gohier, F.; Bélanger, D.; Cougnon, C.; Electrochemistry and Reactivity of Surface-Confined Catechol Groups Derived from Diazonium Reduction. Bias-Assisted Michael Addition at the Solid/Liquid Interface; Langmuir 2009, 25, 3504.
[254] Trammell, S. A.; Moore, M.; Lowy, D.; Lebedev, N.; Surface Reactivity of the Quinone/Hydroquinone Redox Center Tethered to Gold: Comparison of Delocalized and Saturated Bridges; J. Am. Chem. Soc. 2008, 130, 5579.
[255] Curreli, M.; Li, C.; Sun, Y.; Lei, B.; Gundersen, M. A.; Thompson, M. E.; Zhou, C.; Selective Functionalization of In2O3 Nanowire Mat Devices for Biosensing Applications; J. Am. Chem. Soc. 2005, 127, 6922.
[256] Stewart, R. F.; Miller, L. L.; Oxidation of Hydroquinone Silyl Ethers to Quinones; J. Am. Chem. Soc. 1980, 102, 4999.
[257] Choi, I. S.; Chi, Y. S.; Surface Reactions On Demand: Electrochemical Control of SAM-Based Reactions; Angew. Chem. Int. Ed. 2006, 45, 4894.
[258] Polsky, R.; Harper, J. C.; Wheeler, D. R.; Arango, D. C.; Brozik, S. M.; Electrically Addressable Cell Immobilization Using Phenylboronic Acid Diazonium Salts; Angew. Chem. Int. Ed. 2008, 47, 2631.
[259] Yeo, W. S.; Mrksich, M.; Electroactive Substrates that Reveal Aldehyde Groups for Bio-Immobilization; Adv. Mater. 2004, 16, 1352.
[260] Combellas, C.; Kanoufi, F.; Pinson, J.; Podvorica, F. I.; Sterically Hindered Diazonium Salts for the Grafting of a Monolayer on Metals; J. Am. Chem. Soc. 2008, 130, 8576.
[261] Baranton, S.; Bélanger, D.; In situ generation of diazonium cations in organic electrolyte for electrochemical modification of electrode surface; Electrochim. Acta 2008, 53, 6961.
[262] Pognon, G.; Brousse, T.; Demarconnay, L.; Bélanger, D.; Performance and stability of electrochemical capacitor based on anthraquinone modified activated carbon; J. Power Sources 2011, 196, 4117.
7 References
139
[263] Makos, M. A.; Omiatek, D. M.; Ewing, A. G.; Heien, M. L.; Development and Characterization of a Voltammetric Carbon-Fiber Microelectrode pH Sensor; Langmuir 2010, 26, 10386.
[264] March, G.; Reisberg, S.; Piro, B.; Pham, M.-C.; Fave, C.; Noel, V.; Hydroxynaphthoquinone Ultrathin Films Obtained by Diazonium Electroreduction: Toward Design of Biosensitive Electroactive Interfaces; Anal. Chem. 2010, 82, 3523.
[265] Mirkhalaf, F.; Tammeveski, K.; Schiffrin, D. J.; Substituent effects on the electrocatalytic reduction of oxygen on quinone-modified glassy carbon electrodes; Phys. Chem. Chem. Phys. 2004, 6, 1321.
[266] Maleki, A.; Nematollahi, D.; Clausmeyer, J.; Henig, J.; Plumeré, N.; Schuhmann, W.; Electrodeposition of Catechol on Glassy Carbon Electrode and Its Electrocatalytic Activity Toward NADH Oxidation; Electroanalysis 2012, 24, 1932.
[267] Katz, Y. E.; Borovkov, V. V.; Evstigneeva, R. P.; Application of quinone thio derivatives as a basis for assembling complex molecular systems at an electrode surface; J. Electroanal. Chem. 1992, 326, 197.
[268] Downard, A. J.; Prince, M. J.; Barrier Properties of Organic Monolayers on Glassy Carbon Electrodes; Langmuir 2001, 17, 5581.
[269] Lehr, J.; Williamson, B. E.; Flavel, B. S.; Downard, A. J.; Reaction of Gold Substrates with Diazonium Salts in Acidic Solution at Open-Circuit Potential; Langmuir 2009, 25, 13503.
[270] O'Dea, J. J.; Osteryoung, J. G.; Characterization of quasi-reversible surface processes by square-wave voltammetry; Anal. Chem. 1993, 65, 3090.
[271] Mandler, D.; Turyan, I.; Applications of self-assembled monolayers in electroanalytical chemistry; Electroanalysis 1996, 8, 207.
[272] Lohrengel, M. M.; Moehring, A.; Pilaski, M.; Electrochemical surface analysis with the scanning droplet cell; Fresenius J. Anal. Chem. 2000, 367, 334.
[273] Hassel, A. W.; Lohrengel, M. M.; The scanning droplet cell and its application to structured nanometer oxide films on aluminium; Electrochim. Acta 1997, 42, 3327.
[274] Lohrengel, M.; Moehring, A.; Pilaski, M.; Capillary-based droplet cells: limits and new aspects; Electrochim. Acta 2001, 47, 137.
[275] Schäfer, D.; Mardare, C.; Savan, A.; Sanchez, M. D.; Mei, B.; Xia, W.; Muhler, M.; Ludwig, A.; Schuhmann, W.; High-Throughput Characterization of Pt Supported on Thin Film Oxide Material Libraries Applied in the Oxygen Reduction Reaction; Anal. Chem. 2011, 83, 1916.
[276] Schuppert, A. K.; Topalov, A. A.; Katsounaros, I.; Klemm, S. O.; Mayrhofer, K. J. J.; A Scanning Flow Cell System for Fully Automated Screening of Electrocatalyst Materials; J. Electrochem. Soc. 2012, 159, F670-F675.
[277] Sliozberg, K.; Schäfer, D.; Erichsen, T.; Meyer, R.; Khare, C.; Ludwig, A.; Schuhmann, W.; High-throughput screening of thin-film semiconductor material libraries I: system development and case study for Ti-W-O; ChemSusChem 2015, 8, 1270.
[278] Hu, J.; Yu, M.-F.; Meniscus-Confined Three-Dimensional Electrodeposition for Direct Writing of Wire Bonds; Science 2010, 329, 313.
[279] Mardare, A.; Wieck, A.; Hassel, A.; Microelectrochemical lithography: A method for direct writing of surface oxides; Electrochim. Acta 2007, 52, 7865.
[280] Zhan, D.; Yang, D.; Zhu, Y.; Wu, X.; Tian, Z.-Q.; Fabrication and characterization of nanostructured ZnO thin film microdevices by scanning electrochemical cell microscopy; Chem. Commun. 2012, 48, 11449.
[281] Laslau, C.; Williams, D. E.; Kannan, B.; Travas-Sejdic, J.; Scanned Pipette Techniques for the Highly Localized Electrochemical Fabrication and Characterization of Conducting Polymer Thin Films, Microspots, Microribbons, and Nanowires; Adv. Funct. Mater. 2011, 21, 4607.
[282] Patel, A. N.; McKelvey, K.; Unwin, P. R.; Nanoscale Electrochemical Patterning Reveals the Active Sites for Catechol Oxidation at Graphite Surfaces; J. Am. Chem. Soc. 2012, 134, 20246.

7 References
140
[283] McKelvey, K.; O'Connell, M. A.; Unwin, P. R.; Meniscus confined fabrication of multidimensional conducting polymer nanostructures with scanning electrochemical cell microscopy (SECCM); Chem. Commun. 2013, 49, 2986.
[284] Aydemir, N.; Parcell, J.; Laslau, C.; Nieuwoudt, M.; Williams, D. E.; Travas-Sejdic, J.; Direct Writing of Conducting Polymers; Macromol. Rapid Commun. 2013, 34, 1296.
[285] Guedon, P.; Livache, T.; Martin, F.; Lesbre, F.; Roget, A.; Bidan, G.; Levy, Y.; Characterization and Optimization of a Real-Time, Parallel, Label-Free, Polypyrrole-Based DNA Sensor by Surface Plasmon Resonance Imaging; Anal. Chem. 2000, 72, 6003.
[286] Grisotto, F.; Ghorbal, A.; Goyer, C.; Charlier, J.; Palacin, S.; Direct SECM Localized Electrografting of Vinylic Monomers on a Conducting Substrate; Chem. Mater. 2011, 23, 1396.
[287] Noël, J.-M.; Latus, A.; Lagrost, C.; Volanschi, E.; Hapiot, P.; Evidence for OH Radical Production during Electrocatalysis of Oxygen Reduction on Pt Surfaces: Consequences and Application; J. Am. Chem. Soc. 2012, 134, 2835.
[288] Lai, S. C. S.; Patel, A. N.; McKelvey, K.; Unwin, P. R.; Definitive Evidence for Fast Electron Transfer at Pristine Basal Plane Graphite from High-Resolution Electrochemical Imaging; Angew. Chem. 2012, 124, 5501.
[289] Momotenko, D.; Byers, J. C.; McKelvey, K.; Kang, M.; Unwin, P. R.; High-Speed Electrochemical Imaging; ACS Nano 2015.
[290] Jonkheijm, P.; Weinrich, D.; Schröder, H.; Niemeyer, C. M.; Waldmann, H.; Chemical Strategies for Generating Protein Biochips; Angew. Chem. Int. Ed. 2008, 47, 9618.
[291] Actis, P.; Tokar, S.; Clausmeyer, J.; Babakinejad, B.; Mikhaleva, S.; Cornut, R.; Takahashi, Y.; López Córdoba, A.; Novak, P.; Shevchuck, A. I.; Dougan, J. A.; Kazarian, S. G.; Gorelkin, P. V.; Erofeev, A. S.; Yaminsky, I. V.; Unwin, P. R.; Schuhmann, W.; Klenerman, D.; Rusakov, D. A.; Sviderskaya, E. V.; Korchev, Y. E.; Electrochemical Nanoprobes for Single-Cell Analysis; ACS Nano 2014, 8, 875.
[292] Lefrou, C.; Cornut, R.; Analytical Expressions for Quantitative Scanning Electrochemical Microscopy (SECM); ChemPhysChem 2010, 11, 547.
[293] Marquitan, M., Master Thesis, Ruhr-Universität Bochum, Bochum, 2015.
[294] Clausmeyer, J.; Actis, P.; López Córdoba, A.; Korchev, Y.; Schuhmann, W.; Nanosensors for the detection of hydrogen peroxide; Electrochem. Commun. 2014, 40, 28.
[295] Nebel, M.; Grützke, S.; Diab, N.; Schulte, A.; Schuhmann, W.; Visualization of Oxygen Consumption of Single Living Cells by Scanning Electrochemical Microscopy: The Influence of the Faradaic Tip Reaction; Angew. Chem. Int. Ed. 2013, 52, 6335.
[296] Karyakin, A. A.; Gitelmacher, O. V.; Karyakina, E. E.; Prussian Blue-Based First-Generation Biosensor - A Sensitive Amperometric Electrode For Glucose; Anal. Chem. 1995, 67, 2419.
[297] Karyakin, A. A.; Karyakina, E. E.; Gorton, L.; Amperometric Biosensor for Glutamate Using Prussian Blue-Based “Artificial Peroxidase” as a Transducer for Hydrogen Peroxide; Anal. Chem. 2000, 72, 1720.
[298] Karyakin, A. A.; Puganova, E. A.; Budashov, I. A.; Kurochkin, I. N.; Karyakina, E. E.; Levchenko, V. A.; Matveyenko, V. N.; Varfolomeyev, S. D.; Prussian Blue Based Nanoelectrode Arrays for H2O2 Detection; Anal. Chem. 2004, 76, 474.
[299] Ricci, F.; Amine, A.; Palleschi, G.; Moscone, D.; Prussian Blue based screen printed biosensors with improved characteristics of long-term lifetime and pH stability; Biosens. Bioelectron. 2003, 18, 165.
[300] Dong, S.; Che, G.; Electrocatalytic oxidation of ascorbic acid at a Prussian Blue film modified microdisk electrode; J. Electroanal. Chem. 1991, 315, 191.
[301] Voronin, O. G.; Hartmann, A.; Steinbach, C.; Karyakin, A. A.; Khokhlov, A. R.; Kranz, C.; Prussian Blue-modified ultramicroelectrodes for mapping hydrogen peroxide in scanning electrochemical microscopy (SECM); Electrochem. Commun. 2012, 23, 102.

7 References
141
[302] Sun, P.; Mirkin, M. V.; Scanning Electrochemical Microscopy with Slightly Recessed Nanotips; Anal. Chem. 2007, 79, 5809.
[303] Hubbard, A. T.; Anson, F. C.; Linear Potential Sweep Voltammetry in Thin Layers of Solution; Anal. Chem. 1966, 38, 58.
[304] Justino, D. D.; Torres, I. L.; de Cássia Silva Luz, Rita; Damos, F. S.; High Sensitive Microsensor Based on Organic-Inorganic Composite for Two-Dimensional Mapping of H2O2 by SECM; Electroanalysis 2015, 27, 1202.
[305] Kern, D. M. H.; The Polarography and Standard Potential of the Oxygen-Hydrogen Peroxide Couple; J. Am. Chem. Soc. 1954, 76, 4208.
[306] MacMicking, J.; Xie, Q. W.; Nathan, C.; Nitric oxide and macrophage function; Annu. Rev. Immunol. 1997, 15, 323.
[307] Hsu, H.-Y.; Wen, M.-H.; Lipopolysaccharide-mediated reactive oxygen species and signal transduction in the regulation of interleukin-1 gene expression; J. Biol. Chem. 2002, 277, 22131.
[308] Darr, D.; Fridovich, I.; Irreversible inactivation of catalase by 3-amino-1,2,4-triazole; Biochem. Pharmacol. 1986, 35, 3642.
[309] Malon, A.; Vigassy, T.; Bakker, E.; Pretsch, E.; Potentiometry at trace levels in confined samples: ion-selective electrodes with subfemtomole detection limits; J. Am. Chem. Soc. 2006, 128, 8154.
[310] Bakker, E.; Bühlmann, P.; Pretsch, E.; Carrier-Based Ion-Selective Electrodes and Bulk Optodes. 1. General Characteristics; Chem. Rev. 1997, 97, 3083.
[311] Bühlmann, P.; Pretsch, E.; Bakker, E.; Carrier-Based Ion-Selective Electrodes and Bulk Optodes. 2. Ionophores for Potentiometric and Optical Sensors; Chem. Rev. 1998, 98, 1593.
[312] Nicholson, C.; Rice, M. E. in Neuromethods, Vol. 9 (Eds.: A. A. Boulton, G. B. Baker, W. Walz), Humana Press, Clifton, N.J., 1988.
[313] Jones, S. R.; Mickelson, G. E.; Collins, L. B.; Kawagoe, K. T.; Mark Wightman, R.; Interference by pH and Ca2+ ions during measurements of catecholamine release in slices of rat amygdala with fast-scan cyclic voltammetry; J. Neurosci. Meth. 1994, 52, 1.
[314] Charan Reddy, K. R.; Turcu, F.; Schulte, A.; Kayastha, A. M.; Schuhmann, W.; Fabrication of a Potentiometric/Amperometric Bifunctional Enzyme Microbiosensor; Anal. Chem. 2005, 77, 5063.
[315] Kurkdjian, A. C.; Barbier-Brygoo, H.; A hydrogen ion-selective liquid-membrane microelectrode for measurement of the vacuolar pH of plant cells in suspension culture; Anal. Biochem. 1983, 132, 96.
[316] Hinke, J. A. M.; Glass Micro-Electrodes for Measuring Intracellular Activities of Sodium and Potassium; Nature 1959, 184, 1257.
[317] Yamada, H.; Haraguchi, D.; Yasunaga, K.; Fabrication and characterization of a K⁺-selective nanoelectrode and simultaneous imaging of topography and local K⁺ flux using scanning electrochemical microscopy; Anal. Chem. 2014, 86, 8547.
[318] Horrocks, B. R.; Mirkin, M. V.; Pierce, D. T.; Bard, A. J.; Nagy, G.; Toth, K.; Scanning electrochemical microscopy. 19. Ion-selective potentiometric microscopy; Anal. Chem. 1993, 65, 1213.
[319] Hu, K.; Gao, Y.; Wang, Y.; Yu, Y.; Zhao, X.; Rotenberg, S. A.; Gökmeşe, E.; Mirkin, M. V.; Friedman, G.; Gogotsi, Y.; Platinized carbon nanoelectrodes as potentiometric and amperometric SECM probes; J. Solid State Electrochem. 2013, 17, 2971.
[320] Zhang, Y.; Clausmeyer, J.; Babakinejad, B.; López Córdoba, A.; Ali, T.; Shevchuk, A.; Takahashi, Y.; Novak, P.; Edwards, C.; Lab, M.; Gopal, S.; Chiappini, C.; Anand, U.; Magnani, L.; Coombes, R. C.; Gorelik, J.; Matsue, T.; Schuhmann, W.; Klenerman, D.; Sviderskaya, E. V.; Korchev, Y.; Spearhead Nanometric Field-Effect Transistor Sensors for Single-Cell Analysis; ACS Nano 2016. In Press, DOI: 10.1021/acsnano.5b05211

7 References
142
[321] Balint, R.; Cassidy, N. J.; Cartmell, S. H.; Conductive Polymers: Towards a Smart Biomaterial for Tissue Engineering; Acta Biomater. 2014, 10, 2341.
[322] Kranz, C.; Ludwig, M.; Gaub, H. E.; Schuhmann, W.; Lateral deposition of polypyrrole lines over insulating gaps. Towards the development of polymer-based electronic devices; Adv. Mater. 1995, 7, 568.
[323] Shirale, D. J.; Bangar, M. A.; Chen, W.; Myung, N. V.; Mulchandani, A.; Effect of (L:D) Aspect Ratio on Single Polypyrrole Nanowire FET Device; J. Phys. Chem. C 2010, 114, 13375.
[324] Daniel, C.; Bell, C.; Burton, C.; Harguindey, S.; Reshkin, S. J.; Rauch, C.; The Role of Proton Dynamics in the Development and Maintenance of Multidrug Resistance in Cancer; Biochim. Biophys. Acta 2013, 1832, 606.
[325] Warburg, O.; On the Origin of Cancer Cells; Science 1956, 123, 309.
[326] Burd, R.; Wachsberger, P. R.; Biaglow, J. E.; Wahl, M. L.; Lee, I.; Leeper, D. B.; Absence of Crabtree Effect in Human Melanoma Cells Adapted to Growth at Low pH: Reversal by Respiratory Inhibitors; Cancer Res. 2001, 61, 5630.
[327] McCarty, M. F.; Whitaker, J.; Manipulating tumor acidification as a cancer treatment strategy; Altern. Med. Rev. 2010, 15, 264.
[328] Danhier, F.; Feron, O.; Préat, V.; To exploit the tumor microenvironment: Passive and active tumor targeting of nanocarriers for anti-cancer drug delivery; J. Control. Release 2010, 148, 135.
[329] Pucacco, L. R.; Carter, N. W.; A glass-membrane pH microelectrode; Anal. Biochem. 1976, 73, 501.
[330] Imokawa, T.; Williams, K.-J.; Denuault, G.; Fabrication and Characterization of Nanostructured Pd Hydride pH Microelectrodes; Anal. Chem. 2006, 78, 265.
[331] Özel, R. E.; Lohith, A.; Mak, W. H.; Pourmand, N.; Single-cell intracellular nano-pH probes; RSC Adv. 2015, 5, 52436.
[332] Michalak, M.; Kurel, M.; Jedraszko, J.; Toczydlowska, D.; Wittstock, G.; Opallo, M.; Nogala, W.; Voltammetric pH Nanosensor; Anal. Chem. 2015, 87, 11641.
[333] Halaban, R.; Patton, R. S.; Cheng, E.; Svedine, S.; Trombetta, E. S.; Wahl, M. L.; Ariyan, S.; Hebert, D. N.; Abnormal Acidification of Melanoma Cells Induces Tyrosinase Retention in the Early Secretory Pathway; J. Biol. Chem. 2002, 277, 14821.
[334] Thakur, B.; Jayakumar, S.; Sawant, S. N.; Probing extracellular acidity of live cells in real time for cancer detection and monitoring anti-cancer drug activity; Chem. Commun. 2015, 51, 7015.
[335] Parks, S. K.; Chiche, J.; Pouyssegur, J.; pH Control Mechanisms of Tumor Survival and Growth; J. Cell. Physiol. 2011, 226, 299.
[336] Gourine, A. V.; Llaudet, E.; Dale, N.; Spyer, K. M.; ATP is a Mediator of Chemosensory Transduction in the Central Nervous System; Nature 2005, 436, 108.
[337] Burnstock, G.; Purinergic Signalling: From Discovery to Current Developments; Exp. Physiol. 2014, 99, 16.
[338] Gorelik, J.; Zhang, Y.; Sánchez, D.; Shevchuk, A.; Frolenkov, G.; Lab, M.; Klenerman, D.; Edwards, C.; Korchev, Y.; Aldosterone Acts Via an ATP Autocrine/Paracrine System: the Edelman ATP Hypothesis Revisited; Proc. Natl. Acad. Sci. U. S. A. 2005, 102, 15000.
[339] Falzoni, S.; Donvito, G.; Di Virgilio, F.; Detecting Adenosine Triphosphate in the Pericellular Space; Interface Focus 2013, 3, 20120101.
[340] Okada, S. F.; Nicholas, R. A.; Kreda, S. M.; Lazarowski, E. R.; Boucher, R. C.; Physiological Regulation of ATP Release at the Apical Surface of Human Airway Epithelia; J. Biol. Chem. 2006, 281, 22992.
[341] Zhang, Y.; Phillips, G. J.; Li, Q.; Yeung, E. S.; Imaging Localized Astrocyte ATP Release with Firefly Luciferase Beads Attached to the Cell Surface; Anal. Chem. 2008, 80, 9316.

7 References
143
[342] Llaudet, E.; Hatz, S.; Droniou, M.; Dale, N.; Microelectrode biosensor for real-time measurement of ATP in biological tissue; Anal. Chem. 2005, 77, 3267.
[343] Llaudet, E.; Botting, N. P.; Crayston, J. A.; Dale, N.; A three-enzyme microelectrode sensor for detecting purine release from central nervous system; Biosens. Bioelectron. 2003, 18, 43.
[344] Gourine, A. V.; Dale, N.; Llaudet, E.; Poputnikov, D. M.; Spyer, K. M.; Gourine, V. N.; Release of ATP in the Central Nervous System During Systemic Inflammation: Real-Time Measurement in the Hypothalamus of Conscious Rabbits; J. Physiol. 2007, 585, 305.
[345] Patel, B. A.; Rogers, M.; Wieder, T.; O'Hare, D.; Boutelle, M. G.; ATP microelectrode biosensor for stable long-term in vitro monitoring from gastrointestinal tissue; Biosens. Bioelectron. 2011, 26, 2890.
[346] Dutta, A. K.; Sabirov, R. Z.; Uramoto, H.; Okada, Y.; Role of ATP-Conductive Anion Channel in ATP Release From Neonatal Rat Cardiomyocytes in Ischaemic or Hypoxic Conditions; J. Physiol. 2004, 559, 799.
[347] Migita, S.; Ozasa, K.; Tanaka, T.; Haruyama, T.; Enzyme-Based Field-Effect Transistor for Adenosine Triphosphate (ATP) Sensing; Anal. Sci. 2007, 23, 45.
[348] Hecht, E.; Liedert, A.; Ignatius, A.; Mizaikoff, B.; Kranz, C.; Local Detection of Mechanically Induced ATP Release From Bone Cells With ATP Microbiosensors; Biosens. Bioelectron. 2013, 44, 27.
[349] Burnstock, G.; Pathophysiology and Therapeutic Potential of Purinergic Signaling; Pharmacol. Rev. 2006, 58, 58.
[350] Trouillon, R.; Passarelli, M. K.; Wang, J.; Kurczy, M. E.; Ewing, A. G.; Chemical Analysis of Single Cells; Anal. Chem. 2013, 85, 522.
[351] Kwiat, M.; Stein, D.; Patolsky, F.; Nanotechnology meets electrophysiology; Curr. Opin. Biotechnol. 2013, 24, 654.
[352] Gerasimovskaya, E. V.; Ahmad, S.; White, C. W.; Jones, P. L.; Carpenter, T. C.; Stenmark, K. R.; Extracellular ATP is an Autocrine/Paracrine Regulator of Hypoxia-Induced Adventitial Fibroblast Growth. Signaling Through Extracellular Signal-Regulated Kinase-1/2 and the Egr-1 Transcription Factor; J. Biol. Chem. 2002, 277, 44638.
[353] Descamps, E.; Nguyen, K.; Bouchain-Gautier, C.; Filoramo, A.; Goux-Capes, L.; Goffman, M.; Bourgoin, J.-P.; Mailley, P.; Livache, T.; Versatile Functionalization of Nanoelectrodes by Oligonucleotides via Pyrrole Electrochemistry; ChemPhysChem 2010, 11, 3541.
[354] dos Santos Riccardi, C.; Yamanaka, H.; Josowicz, M.; Kowalik, J.; Mizaikoff, B.; Kranz, C.; Label-Free DNA Detection Based on Modified Conducting Polypyrrole Films at Microelectrodes; Anal. Chem. 2006, 78, 1139.
[355] Clausmeyer, J.; Masa, J.; Ventosa, E.; Öhl, D.; Schuhmann, W.; Nanoelectrodes reveal the electrochemistry of single nickelhydroxide nanoparticles; Chem. Commun. 2016, 52, 2408.
[356] Burke, M. S.; Enman, L. J.; Batchellor, A. S.; Zou, S.; Boettcher, S. W.; Oxygen Evolution Reaction Electrocatalysis on Transition Metal Oxides and (Oxy)hydroxides; Chem. Mater. 2015, 27, 7549.
[357] Chen, Q.; Luo, L.; Faraji, H.; Feldberg, S. W.; White, H. S.; Electrochemical Measurements of Single H2 Nanobubble Nucleation and Stability at Pt Nanoelectrodes; J. Phys. Chem. Lett. 2014, 5, 3539.
[358] McCrory, C. C. L.; Jung, S.; Peters, J. C.; Jaramillo, T. F.; Benchmarking heterogeneous electrocatalysts for the oxygen evolution reaction; J. Am. Chem. Soc. 2013, 135, 16977.
[359] Burke, M. S.; Zou, S.; Enman, L. J.; Kellon, J. E.; Gabor, C. A.; Pledger, E.; Boettcher, S. W.; Revised Oxygen Evolution Reaction Activity Trends for First-Row Transition-Metal (Oxy)hydroxides in Alkaline Media; J. Phys. Chem. Lett. 2015, 6, 3737.
[360] Fabbri, E.; Habereder, A.; Waltar, K.; Kötz, R.; Schmidt, T. J.; Developments and perspectives of oxide-based catalysts for the oxygen evolution reaction; Catal. Sci. Technol. 2014, 4, 3800.
7 References
144
[361] Matsumoto, Y.; Sato, E.; Electrocatalytic properties of transition metal oxides for oxygen evolution reaction; Mater. Chem. Phys. 1986, 14, 397.
[362] Smith, R. D. L.; Prévot, M. S.; Fagan, R. D.; Zhang, Z.; Sedach, P. A.; Siu, M. K. J.; Trudel, S.; Berlinguette, C. P.; Photochemical route for accessing amorphous metal oxide materials for water oxidation catalysis; Science 2013, 340, 60.
[363] Gao, M.; Sheng, W.; Zhuang, Z.; Fang, Q.; Gu, S.; Jiang, J.; Yan, Y.; Efficient water oxidation using nanostructured α-nickel-hydroxide as an electrocatalyst; J. Am. Chem. Soc. 2014, 136, 7077.
[364] Li, H. B.; Yu, M. H.; Wang, F. X.; Liu, P.; Liang, Y.; Xiao, J.; Wang, C. X.; Tong, Y. X.; Yang, G. W.; Amorphous nickel hydroxide nanospheres with ultrahigh capacitance and energy density as electrochemical pseudocapacitor materials; Nat. Commun. 2013, 4, 1894.
[365] Cibrev, D.; Jankulovska, M.; Lana-Villarreal, T.; Gómez, R.; Oxygen evolution at ultrathin nanostructured Ni(OH)2 layers deposited on conducting glass; Int. J. Hydrogen Energy 2013, 38, 2746.
[366] Trotochaud, L.; Ranney, J. K.; Williams, K. N.; Boettcher, S. W.; Solution-cast metal oxide thin film electrocatalysts for oxygen evolution; J. Am. Chem. Soc. 2012, 134, 17253.
[367] Chen, S.; Thind, S. S.; Chen, A.; Nanostructured materials for water splitting; Electrochem. Commun. 2016, 63, 10.
[368] Sadiek, I. M.; Mohammad, A. M.; El-Shakre, M. E.; El-Deab, M. S.; Electrocatalytic activity of nickel oxide nanoparticles-modified electrodes: Optimization of the loading level and operating pH towards the oxygen evolution reaction; Int. J. Hydrogen Energy 2012, 37, 68.
[369] Oliva, P.; Leonardi, J.; Laurent, J. F.; Delmas, C.; Braconnier, J. J.; Figlarz, M.; Fievet, F.; Guibert, A.; Review of the structure and the electrochemistry of nickel hydroxides and oxy-hydroxides; J. Power Sources 1982, 8, 229.
[370] Kim, M.-S.; Kim, K.-B.; A Study on the Phase Transformation of Electrochemically Precipitated Nickel Hydroxides Using an Electrochemical Quartz Crystal Microbalance; J. Electrochem. Soc. 1998, 145, 507.
[371] Bediako, D. K.; Lassalle-Kaiser, B.; Surendranath, Y.; Yano, J.; Yachandra, V. K.; Nocera, D. G.; Structure-activity correlations in a nickel-borate oxygen evolution catalyst; J. Am. Chem. Soc. 2012, 134, 6801.
[372] Liang, H.; Li, L.; Meng, F.; Dang, L.; Zhuo, J.; Forticaux, A.; Wang, Z.; Jin, S.; Porous Two-Dimensional Nanosheets Converted from Layered Double Hydroxides and Their Applications in Electrocatalytic Water Splitting; Chem. Mater. 2015, 27, 5702.
[373] Zou, S.; Burke, M. S.; Kast, M. G.; Fan, J.; Danilovic, N.; Boettcher, S. W.; Fe (Oxy)hydroxide Oxygen Evolution Reaction Electrocatalysis; Chem. Mater. 2015, 27, 8011.
[374] Weidner, J. W.; Timmermann, P.; Effect of Proton Diffusion, Electron Conductivity, and Charge-Transfer Resistance on Nickel Hydroxide Discharge Curves; J. Electrochem. Soc. 1994, 141, 346.
[375] Trotochaud, L.; Young, S. L.; Ranney, J. K.; Boettcher, S. W.; Nickel-iron oxyhydroxide oxygen-evolution electrocatalysts: the role of intentional and incidental iron incorporation; J. Am. Chem. Soc. 2014, 136, 6744.
[376] Briggs, G.; Snodin, P. R.; Ageing and the diffusion process at the nickel hydroxide electrode; Electrochim. Acta 1982, 27, 565.
[377] Gong, M.; Dai, H.; A mini review of NiFe-based materials as highly active oxygen evolution reaction electrocatalysts; Nano Res. 2015, 8, 23.
[378] Simon, P.; Gogotsi, Y.; Materials for electrochemical capacitors; Nat. Mater. 2008, 7, 845.
[379] Kim, H.-S.; Itoh, T.; Nishizawa, M.; Mohamedi, M.; Umeda, M.; Uchida, I.; Microvoltammetric study of electrochemical properties of a single spherical nickel hydroxide particle; Int. J. Hydrogen Energy 2002, 27, 295.

7 References
145
[380] Kiani, M. A.; Mousavi, M. F.; Ghasemi, S.; Size effect investigation on battery performance; J. Power Sources 2010, 195, 5794.
[381] van der Ven, A.; Morgan, D.; Meng, Y. S.; Ceder, G.; Phase Stability of Nickel Hydroxides and Oxyhydroxides; J. Electrochem. Soc. 2006, 153, A210.
[382] Watanabe, K.; Kikuoka, T.; Kumagai, N.; Physical and electrochemical characteristics of nickel hydroxide as a positive material for rechargeable alkaline batteries; J. Appl. Electrochem. 1995, 25.
[383] Cao, M.; He, X.; Chen, J.; Hu, C.; Self-Assembled Nickel Hydroxide Three-Dimensional Nanostructures; Cryst. Growth Design 2007, 7, 170.
[384] Patil, U. M.; Gurav, K. V.; Fulari, V. J.; Lokhande, C. D.; Joo, O. S.; Characterization of honeycomb-like “β-Ni(OH)2” thin films synthesized by chemical bath deposition method and their supercapacitor application; J. Power Sources 2009, 188, 338.
[385] Jiang, H.; Zhao, T.; Li, C.; Ma, J.; Hierarchical self-assembly of ultrathin nickel hydroxide nanoflakes for high-performance supercapacitors; J. Mater. Chem. 2011, 21, 3818.
[386] Aghazadeh, M.; Golikand, A. N.; Ghaemi, M.; Synthesis, characterization, and electrochemical properties of ultrafine β-Ni(OH)2 nanoparticles; Int. J. Hydrogen Energy 2011, 36, 8674.
[387] Brousse, T.; Belanger, D.; Long, J. W.; To Be or Not To Be Pseudocapacitive?; J. Electrochem. Soc. 2015, 162, A5185–A5189.
[388] Pavlishchuk, V. V.; Addison, A. W.; Conversion constants for redox potentials measured versus different reference electrodes in acetonitrile solutions at 25°C; Inorg. Chim. Acta 2000, 298, 97.
[389] Marken, F.; Eklund, J. C.; Compton, R. G.; Voltammetry in the presence of ultrasound - can ultrasound modify heterogeneous electron-transfer kinetics?; J. Electroanal. Chem. 1995, 395, 335.
[390] Sun, T.; Blanchard, P.-Y.; Mirkin, M. V.; Cleaning Nanoelectrodes with Air Plasma; Anal. Chem. 2015, 87, 4092.
[391] López Córdoba, A., PhD Thesis, Universidad Miguel Hernández, Elche, 2015.
[392] Teyler, T. J.; Brain slice preparation: Hippocampus; Brain Res. Bulletin 1980, 5, 391.
[393] Gorelik, J.; Yang, L. Q.; Zhang, Y.; Lab, M.; Korchev, Y.; Harding, S. E.; A Novel Z-Groove Index Characterizing Myocardial Surface Structure; Cardiovasc. Res. 2006, 72, 422.

8 Annex
146
8 Annex
8.1 Abbreviation List
3-AT –3-amino-1,2,4-triazole ATP – adenosine triphosphate AC – alternating current AFM – Atomic Force Microscopy BNC – Bayonet Neill–Concelman BQ – benzoquinone CE – counter electrode CNT – carbon nanotube CV – cyclic voltammogram/voltammetry CVD – Chemical Vapor Deposition DCFH-DA - 2′,7′-dichlorofluorescein diacetate DMEM – Dulbecco’s modified Eagle’s medium DNA – deoxyribonucleic acid DPN – dip-pen nanolithography DRG – dorsal root ganglia EDL – electrochemical double layer EDX – Energy-dispersive X-ray spectroscopy ESD – electrostatic discharge ESR – Electron Spin Resonance FB – feedback FBS – fetal bovine serum FET – field effect transistor FIB – Focused Ion Beam GC – glassy carbon GCE – glassy carbon electrode GOX – glucose oxidase HEPES - 4-(2-hydroxyethyl)-1-piperazine- ethanesulfonic acid HER – hydrogen evolution reaction HRP – horseradish peroxidase HOPG – highly oriented pyrolytic graphite HQ – hydroquinone LOD – limit of detection LPS – Lipopolysaccharides MOSFET – metal oxide semiconductor field effect transistor NADPH – nicotinamide adenine dinucleotide phosphate NGF – neuron growth factor NHS – N-hydroxysuccinimide NOS – nitric oxidase synthase NOX – NADPH Oxidase OCP – open circuit potential OER – oxygen evolution reaction ORR – oxygen reduction reaction pAP – p-aminophenol pAPP – p-aminophenolphosphate PB – Prussian Blue
PBS – phosphate-buffered saline PNA – peptide nucleic acid PW – Prussian White PPy – polypyrrole PTFE – polytetrafluoroethylene RDE – rotating disk electrode RE – reference electrode RHE – reversible hydrogen electrode ROS – reactive oxygen species RNS – reactive nitrogen species SAED – Selected-Area Electron Diffraction SAM – self-assembled monolayer SDC – Scanning Droplet Cell SECM – Scanning Electrochemical Microscopy SF – shear force SEM – Scanning Electron Microscopy SHE – standard hydrogen electrode SICM – Scanning Ion Conductance Microscopy SOD – superoxide dismutase STM – Scanning Tunneling Microscopy TBAHFP – tert-butylammonium hexafluoro-phosphate TBDMS – tert-butyldimethylsilyl UME – ultramicroelectrode TEM – Transmission Electron Microscopy TOF – turnover frequency WE – working electrode XPS – X-ray Photoelectron Spectroscopy XRD – X-ray Diffraction
8 Annex
147
8.2 Publications
[12] Zhang, Y.*; Clausmeyer , J.*; Babakinejad, B.*; López Córdoba, A.; Ali, T.; Shevchuk , A.;
Takahashi , Y.; Novak , P. Edward , C.; Lab, M.; Gopal, S.; Chiappini, C.; Anand, U.; Magnani, L.;
Coombes, C.; Gorelik, J.; Matsue, M.; Schuhmann, W.†; Klenerman, D.†; Sviderskaya, E.†; Korchev,
Y.† Spearhead Nanometric Field-Effect Transistor Sensors for Single-Cell Analysis. ACS Nano
2016, in press, DOI: 10.1021/acsnano.5b05211
[11] Clausmeyer, J.†; Schuhmann, W.† Nanoelectrodes: Applications in Electrocatalysis, Single-
Cell Analysis and High-Resolution Electrochemical Imaging. TrAC Trends Anal. Chem. 2016, in
press, DOI: 10.1016/j.trac.2016.01.018
[10] Clausmeyer, J.†; Masa, J.; Ventosa, E.; Öhl, D.; Schuhmann, W.† Nanoelectrodes Reveal
Electrochemistry of Single Nickelhydroxide Nanoparticles. Chem. Commun. 2016, 52, 2408–2411.
[9] Stratmann, L.*; Clausmeyer, J.*; Schuhmann, W.† Non-destructive Patterning of Carbon
Electrodes Using the Direct Mode of Scanning Electrochemical Microscopy. ChemPhysChem
2015, 16, 3477-3482.
[8] Švorc, Ĺ.; Jambrec, D.; Vojs, M.; Barwe, S.; Clausmeyer, J.; Michniak, P.; Marton, M.;
Schuhmann, W.† Doping Level of Boron-Doped Diamond Electrodes Controls the Grafting
Density of Functional Groups for DNA Assays. ACS Appl. Mater. Interfaces 2015, 7, 18949-18956.
[7] Matysiak, E.; Botz, A.; Clausmeyer, J.; Wagner, B.; Schuhmann, W.; Stojek, Z.; Nowicka, A.†
Assembling Paramagnetic Ceruloplasmin at Electrode Surfaces Covered with Ferromagnetic
Nanoparticles. Scanning Electrochemical Microscopy in Presence of Magnetic Fields. Langmuir
2015, 31, 8176-8183.
[6] Clausmeyer, J.; Schäfer, D.; Nebel, M.; Schuhmann, W.† Temperature-Induced Modulation of
the Sample Position in Scanning Electrochemical Microscopy. ChemElectroChem 2015, 2, 946–
948.
[5] Clausmeyer, J.; Actis, P.; López Córdoba, A.; Korchev, Y.; Schuhmann, W.† Nanosensors for
the detection of hydrogen peroxide. Electrochem. Commun. 2014, 40, 28–30.
[4] Actis, P.†; Tokar, S.; Clausmeyer, J.; Babakinejad, B.; Mikhaleva, S.; Cornut, R.; Takahashi, Y.;
López Córdoba, A.; Novak, P.; Shevchuck, A. I.; Dougan, J. A.; Kazarian, S. G.; Gorelkin, P. V.;
Erofeev, A. S.; Yaminsky, I. V.; Unwin, P. R.; Schuhmann, W.; Klenerman, D.; Rusakov, D. A.;
Sviderskaya, E. V.; Korchev, Y. E.† Electrochemical Nanoprobes for Single-Cell Analysis. ACS Nano
2014, 8, 875–884.

8 Annex
148
[3] Clausmeyer, J.; Schuhmann, W.†; Plumeré, N. Electrochemical patterning as a tool for
fabricating biomolecule microarrays. TrAC Trends Anal. Chem. 2014, 58, 23–30.
[2] Clausmeyer, J.; Henig, J.; Schuhmann, W.†; Plumeré, N.† Scanning Droplet Cell for
Chemoselective Patterning through Local Electroactivation of Protected Quinone Monolayers.
ChemPhysChem 2014, 15, 151.
[1] Maleki, A.; Nematollahi, D.; Clausmeyer, J.; Henig, J.; Plumeré, N.†; Schuhmann, W.
Electrodeposition of Catechol on Glassy Carbon Electrode and Its Electrocatalytic Activity
Toward NADH Oxidation. Electroanalysis 2012, 24, 1932–1936.
* These authors contributed equally
† Corresponding authors
8.3 Conference Contributions
8.3.1 Oral presentations
Amperometric Nanosensors and Field-Effect Transistors for Extra- and Intracellular Chemical
Analysis
Clausmeyer, J.; Zhang, Y.; Marquitan, M.; López Córdoba, A.; Korchev, Y. Schuhmann, W.
66th Annual Meeting of the International Society of Electrochemistry, Taipei, Taiwan, 2015
Carbon Nanoelectrodes for Single-Cell Analysis: From Amperometric Sensing to Field-Effect
Transistors
Clausmeyer, J.; Zhang, Y.; Babakinejad, B.; Marquitan, M.; López Córdoba, A.; Actis, P.; Korchev,
Y.; Schuhmann, W.
17th Topical Meeting of the International Society of Electrochemistry, St. Malo, France, 2015
Destruction-Free Surface Patterning Using Electrochemical Scanning Probes and Functionalized
Nanoelectrodes for Single-Cell Analysis
Invited Lecture
Clausmeyer, J.
Aarhus Symposium on Surface Chemistry and Electrochemistry, Aarhus, Denmark, 2014
Functionalized Nanoelectrodes for the Detection of Oxygen Species Inside Single Living Cells
Clausmeyer, J.; Actis, P.; López Córdoba, A.; Korchev, Y.; Schuhmann, W.
Elecnano 6, Paris, France, 2014
8 Annex
149
Electrochemical surface modification and sensing of pH and oxygen species
Invited Lecture
Clausmeyer, J.
Colloquium at the Imperial College London, London, UK, 2013
Scanning Droplet Cell for Chemoselective Patterning via Local Electroactivation of Protected
Quinone Monolayers
Clausmeyer, J.; Henig, J.; Schuhmann, W.; Plumeré, N.
Bioelectrochemistry 2013, Bochum, Germany, 2013
Direct mode SECM revisited: Increased chemoselectivity during local electrochemical cleavage of
a protecting group from electroactive quinone monolayers
Clausmeyer, J.; Plumeré, N.; Henig, J.; Stratmann, L.; Schuhmann, W.
7th Workshop on Scanning Electrochemical Microscopy (SECM) and Related Techniques, Ein Gedi,
Israel, 2013
Electrochemical Deprotection and Activation of Michael Acceptors for Electrode
Microstructuration
Clausmeyer, J.; Plumeré, N.; Henig, J.; Schuhmann, W.
62nd Annual Meeting of the International Society of Electrochemistry, Niigata, Japan, 2011
8.3.2 Poster presentations
Spearhead Field-Effect Transistor Nanosensors for High-Resolution Chemical Analysis
Won 2nd Poster Prize
Clausmeyer, J.; Zhang, Y.; Babakinejad, B.; López Córdoba, A.; Ali, T.; Shevchuk, A.; Edwards, C.;
Gopal, S.; Anand, U.; Korchev, Y.; Schuhmann, W.
8th International Workshop on Scanning Electrochemical Microscopy, Xiamen, China, 2015
Investigation of Single Ni(OH)2 Nanoparticles: Electrocatalysis and Energy Storage at Ultrafast
Mass Transport
Clausmeyer, J.; Masa, J.; Ventosa, E.; Schuhmann, W.
66th Annual Meeting of the International Society of Electrochemistry, Taipei, Taiwan, 2015
Electrocatalysis at the Nanoscale – Oxygen Evolution Reaction (OER) at Single Ni(OH)2
Nanoparticles
Clausmeyer, J.; Masa, J.; Ventosa, E.; Schuhmann, W.
17th Topical Meeting of the International Society of Electrochemistry, St. Malo, France, 2015

8 Annex
150
Patterning of Electroactive Monolayers Using Scanning Droplet Cell
Clausmeyer, J.; Henig, J.; Schuhmann, W.; Plumeré, N.
12th International Fischer Symposium, Lübeck, Germany, 2012
Underscored name: Presenting author


![Surface treatments to modulate bioadhesion: A critical reviewchesterrep.openrepository.com/cdr/bitstream/10034/6036… · Web view[69] who also showed that micro-patterning of poly(dimethylsiloxane)](https://img.dokumen.tips/doc/110x75/5ac26ad97f8b9ae45b8e8586/surface-treatments-to-modulate-bioadhesion-a-critical-web-view69-who-also-showed.jpg)