Embed Size (px)
Citation preview

Michigan Public Service Commission Auditor: Brian Welke DTE Electric Company Audit Request No: BAW-1.1 Case No. U-18122 Date of Request: 8/29/2016 Respondent: T. M. Uzenski Date of Response: 9/2/2016 Page: 1 of 1 Request: 1. Does the Co. need Commission approval to book a reg. asset? Response: From a GAAP perspective, a regulatory asset can be recorded only if recovery is probable. Generally, the best evidence to support probable recovery is a Commission order providing for recovery in rates. However, other evidence including an accounting order or past practice might be sufficient if there is a history of recovery of the same type of expense. The specific facts and circumstances related to each potential regulatory asset must be evaluated on a case by case basis. See also the response to question 6. From a regulatory accounting perspective, the Commission’s March 17, 2011 Order in Case No. U-14811 requires MPSC approval to use account 182.3, Other Regulatory Assets.
Case: U-18122 Witness: BWelke
Exhibit: S-1.0 Date: 9/14/16 Page 1 of 21

Michigan Public Service Commission Auditor: Brian Welke DTE Electric Company Audit Request No: BAW-1.2 Case No. U-18122 Date of Request: 8/29/2016 Respondent: T. M. Uzenski Date of Response: 9/2/2016 Page: 1 of 1 Request: 2. Has the Co. ever booked a reg. asset without explicit Commission approval? Response: Yes.
Case: U-18122 Witness: BWelke
Exhibit: S-1.0 Date: 9/14/16 Page 2 of 21

Michigan Public Service Commission Auditor: Brian Welke DTE Electric Company Audit Request No: BAW-1.3 Case No. U-18122 Date of Request: 8/29/2016 Respondent: T. M. Uzenski Date of Response: 9/2/2016 Page: 1 of 1 Request: 3. If the answer to question 2 is yes, please list the last three that were booked
without prior Commission approval. Response: Deferred City of Detroit Income Taxes, Deferred taxes from Medicare Part D Subsidies, and Deferred Michigan Income Taxes were recorded in account 186, Miscellaneous Deferred Debits. These costs were deferred to account 186 because the Company did not have MPSC authority to record them to account 182.3. However, from a GAAP perspective, they were considered recoverable assets based on a prior history of recovery of the impacts resulting from tax law changes. Deferred Plug-in Electric Vehicle Equipment Costs were recorded in account 186. The Commission’s Order in Case No. U-16406 did not authorize recovery or use of account 182.3, but did provide for deferral of costs to be reviewed in a subsequent rate case. Since the Company believed the Commission was supportive of this experimental program and the dollar amount to be deferred was capped at $6.2 million, the asset was deemed to be probable of recovery for GAAP purposes. The “catch-up” entries for pension and OBEB liability costs that non-utility companies were required to recognize in Other Comprehensive Income (e.g., unfunded service costs) upon adoption of FAS 158 were recognized as a regulatory asset by DTE Electric. This was based on the Commission’s history of providing recovery of pension and OPEB expense and receipt of a letter from the MPSC Staff indicating that regulatory asset treatment was appropriate (December 8, 2006). The asset is reduced as the expense is recognized in net periodic benefit costs included in rates.
Case: U-18122 Witness: BWelke
Exhibit: S-1.0 Date: 9/14/16 Page 3 of 21

Michigan Public Service Commission Auditor: Brian Welke DTE Electric Company Audit Request No: BAW-1.4 Case No. U-18122 Date of Request: 8/29/2016 Respondent: T. M. Uzenski Date of Response: 9/2/2016 Page: 1 of 1 Request: 4. If the answer to question 2 is yes, what is the distinction between those costs
booked without Commission approval and Customer 360 expenses requested in this case?
Response: There is no history of recovery of the C360 costs because it is a new project. The current rate case, U-18014, reflects only the original cost estimate. In addition, the Commission’s September 26, 2014 Order in Case No. U-17666 specifically limited the dollar amount that could be deferred as a regulatory asset to $47 million and said the Company could make another accounting request if additional amounts were required.
Case: U-18122 Witness: BWelke
Exhibit: S-1.0 Date: 9/14/16 Page 4 of 21

Michigan Public Service Commission Auditor: Brian Welke DTE Electric Company Audit Request No: BAW-1.5 Case No. U-18122 Date of Request: 8/29/2016 Respondent: T. M. Uzenski Date of Response: 9/2/2016 Page: 1 of 1 Request: 5. Do reg. asset approvals for projected project expenses either reduce or
eliminate incentive to curtail costs of that project? Response: No. The Company has internal controls in place to manage cash expenditures on all projects, regardless of the accounting treatment.
Case: U-18122 Witness: BWelke
Exhibit: S-1.0 Date: 9/14/16 Page 5 of 21

Michigan Public Service Commission Auditor: Brian Welke DTE Electric Company Audit Request No: BAW-1.6 Case No. U-18122 Date of Request: 8/29/2016 Respondent: T. M. Uzenski Date of Response: 9/2/2016 Page: 1 of 1 Request: 6. What are the GAAP guidelines in which the Company, absent Commission
approval, would book a reg. asset? Response: The Company applies the following guidance when determining whether it is appropriate to record a regulatory asset: ASC 980 (FAS 71) allows for recognition of a regulatory asset if it is probable that future revenue in an amount at least equal to the capitalized (deferred) cost will result from inclusion of that cost in allowable costs for rate-making purposes. Determining whether rate recovery of an incurred cost is probable is a matter of judgment. The PwC Guide to Accounting for Utilities lists examples of forms of evidence to support the recognition of a regulatory asset:
• The regulated utility receives a rate order specifying that the costs will be recovered in the future.
• The incurred cost has been treated by the regulated utility’s regulator as an allowable cost of service item in prior regulatory filings.
• The incurred cost has been treated as an allowable cost by the same regulator in connection with another entity’s filing.
• It is the regulator’s general policy to allow recovery of the incurred cost. • The regulated utility has had discussions with the regulator (as well as its primary
intervener groups) with respect to recovery of the specific incurred cost and has received assurances that the incurred cost will be treated as an allowable cost (and not challenged) for regulatory purposes.
• The specific incurred cost (or similar incurred cost) has been treated as an allowable cost by a majority of other regulators and has not been specifically disallowed by the regulated utility’s regulator.
• The regulated utility has obtained an opinion from outside legal counsel outlining the basis for the incurred cost being probable of being allowed in future rates.
Different forms of evidence will provide varying degrees of support for management’s assertion that a regulatory asset is probable of recovery; not all forms of evidence will be sufficient in isolation or in combination to make such an assertion. Establishing probability of recovery is more difficult absent a rate order, especially when evaluating unusual or nonrecurring costs. The best evidence for a regulatory asset is a rate order, but the timing of the regulatory process sometimes does not enable the regulated utility to obtain one prior to issuing financial statements. As a result, management and independent accountants may look for an accounting order or related precedent within the regulated utility’s jurisdiction, which may indicate that the recovery of such costs in rates is probable. Generally, an accounting order alone will not provide sufficient evidence to support the recognition of a regulatory asset.
Case: U-18122 Witness: BWelke
Exhibit: S-1.0 Date: 9/14/16 Page 6 of 21

Michigan Public Service Commission Auditor: Brian Welke DTE Electric Company Audit Request No: BAW-1.7 Case No. U-18122 Date of Request: 8/29/2016 Respondent: T. M. Uzenski Date of Response: 9/2/2016 Page: 1 of 1 Request: 7. Why could the GAAP rationale for booking a reg. asset without Commission
approval not be applicable in this case? Response: The GAAP rationale allows for recognition only if recovery is probable as outlined in the response to question 6. In this instance, the original regulatory asset was recognized based on the accounting order in Case No. U-17666, coupled with the inclusion of the regulatory asset in the current rate case, No. U-18014. Management determined that these cases provided sufficient evidence that recovery is probable. However, since the additional costs were specifically excluded from the accounting order (due to the cap on the allowable amount), and were not reflected in the rate case, management does not have sufficient evidence to conclude that recovery of the additional costs is probable.
Case: U-18122 Witness: BWelke
Exhibit: S-1.0 Date: 9/14/16 Page 7 of 21
Michigan Public Service Commission Auditor: Brian Welke DTE Electric Company Audit Request No: BAW-1.8 Case No. U-18122 Date of Request: 8/29/2016 Respondent: K. Bridge Date of Response: 9/2/2016 Page: 1 of 1 Request: 8. Why were the increased costs of Customer 360 not requested for in U-18014? Response: At that time, we were uncertain as to the magnitude of the potential increased costs and did not have internal approval for any increases. We concluded our benchmarking around post go live surge costs in early 2016. A Request for Proposal went out to multiple service providers in March of 2016 and the results began to come in during April. Once these costs were known, we obtained internal Board approval for the increased costs in June and filed the accounting application the same week.
Case: U-18122 Witness: BWelke
Exhibit: S-1.0 Date: 9/14/16 Page 8 of 21

Michigan Public Service Commission Auditor: Brian Welke DTE Electric Company Audit Request No: BAW-1.9 Case No. U-18122 Date of Request: 8/29/2016 Respondent: T. M. Uzenski Date of Response: 9/2/2016 Page: 1 of 1 Request: 9. Could the Co., in leiu of a reg. asset, make a normalizing adjustment in its
next full rate case to capture the increased Customer 360 costs? Response: If the Company does not record the costs as a regulatory asset, the costs will be expensed as incurred. If the costs were subsequently included in future rates, the expense would be reversed upon a Commission order and recorded to the balance sheet to be amortized over the approved recovery period. The result is the recognition of approximately $32 million of expense in 2017, a reversal of that $32 million expense upon an order in the next rate case (date TBD), and the recognition of the expense over the approved recovery period (e.g., the following xx number of years). This distorts income in 2017 and in the year the expense is reversed. Furthermore, the uncertainty of recovery of the Customer 360 costs could result in spending on other necessary projects being delayed past 2017.
Case: U-18122 Witness: BWelke
Exhibit: S-1.0 Date: 9/14/16 Page 9 of 21

Michigan Public Service Commission Auditor: Cody Mathews DTE Electric Company Audit Request No: CSM-1.1 Case No. U-18122 Date of Request: 9/2/2016 Respondent: K. Bridge Date of Response: 9/12/16 Page: 1 of 1
Request: 1. Has the Company modified its initial training schedule to increase training
prior to the post go-live period to minimize the impact on customer service handling time post go-live? If so, please explain.
Response:
Yes. We have modified our original schedule in order to train all current
Customer Service Representatives (CSR’s) at DTE on SAP’s Customer
Relationship and Billing System (known as the Customer 360 Project). This
training will take place from November 2016 through March of 2017. The new
system is expected to go live in April of 2017.
We are also modifying our current training schedule to train additional CSR’s
employed by a third party (Exhibit A3 vendor 1), on our legacy billing systems.
This is required to backfill for our employees when they are in training for the new
SAP Customer Relationship and Billing System (CR&B). The training of these
CR’s has begun and will go through November of 2016. These services will be
discontinued at go-live.
We are also training additional CSR’s to support our incremental staffing needs
post go-live (see exhibit A3 vendors 3 & 4.) This training will take place from
November 2016 through March of 2017.
Lastly, we will be training a third party vendor to support the back office billing
exception process (vendor 2 in Exhibit A3). This vendor is SAP proficient and
training will center on specific DTE work practices and the associated SAP
configuration.
Case: U-18122 Witness: BWelke
Exhibit: S-1.0 Date: 9/14/16 Page 10 of 21

Michigan Public Service Commission Auditor: Cody Mathews DTE Electric Company Audit Request No: CSM-1.2 Case No. U-18122 Date of Request: 9/2/2016 Respondent: K. Bridge Date of Response: 9/12/16 Page: 1 of 1
Request: 2. Please provide DTE’s front and back office staffing level numbers by year
for the previous 10 years.
Response:
The DTE front-office support staffing level numbers are provided for the period
2006 through 2015 in Attachment 1, line 10. Note, data for DTE’s outside
vendors are not available for the period 2006 through 2011. The DTE front
office/Contact Center staff includes all support staff, including DTE and contract
leaders, escalation support, Quality & Training, Workforce, all CSRs, Vendor
Management and reporting. The DTE back-office staffing numbers are only
available from 2012 and are provided in Attachment 1, line 12. The total front-
and back-office staffing level numbers are provided for the period 2012 through
2015 in Attachment 1, line 13.
Case: U-18122 Witness: BWelke
Exhibit: S-1.0 Date: 9/14/16 Page 11 of 21

Michigan Public Service Commission Auditor: Cody Mathews DTE Electric Company Audit Request No: CSM-1.3 Case No. U-18122 Date of Request: 9/2/2016 Respondent: K. Bridge Date of Response: 9/12/16 Page: 1 of 1
Request: 3. How many CSR’s has the company employed by year over the previous 10
years?
Response:
The DTE and outsourcer CSR count is provided in Attachment 1, lines 7 & 9. We
have provided the DTE CSR count for the period 2006 through 2015. The DTE
CSR count includes DTE employee and DTE contractor CSR’s located at the
DTE Contact Center. Outsourcer CSR count is only available for the period 2012
through 2015.
Case: U-18122 Witness: BWelke
Exhibit: S-1.0 Date: 9/14/16 Page 12 of 21

Michigan Public Service Commission Auditor: Cody Mathews DTE Electric Company Audit Request No: CSM-1.4 Case No. U-18122 Date of Request: 9/2/2016 Respondent: K. Bridge Date of Response: 9/12/16 Page: 1 of 1
Request: 4. How many customer calls has the company experienced by year over the
past 10 years?
Response:
The combined DTE and outsourcer handled call volume for the period 2006
through 2015 is provided in Attachment 1, line 3.
Case: U-18122 Witness: BWelke
Exhibit: S-1.0 Date: 9/14/16 Page 13 of 21
Michigan Public Service Commission Auditor: Cody Mathews DTE Electric Company Audit Request No: CSM-1.5 Case No. U-18122 Date of Request: 9/2/2016 Respondent: K. Bridge Date of Response: 9/12/16 Page: 1 of 1
Request: 5. What is the average handling time for customer calls? Response:
The combined DTE and outsourcer average handling time for the period 2012
through 2015 is provided in Attachment 1, line 16.
Case: U-18122 Witness: BWelke
Exhibit: S-1.0 Date: 9/14/16 Page 14 of 21

Michigan Public Service Commission Auditor: Cody Mathews DTE Electric Company Audit Request No: CSM-1.6 Case No. U-18122 Date of Request: 9/2/2016 Respondent: K. Bridge Date of Response: 9/12/16 Page: 1 of 1
Request: 6. Since the implementation of AMI, has the Company experienced a
reduction in customer call time or volume?
Response:
Since numerous external and internal factors contribute to customer call volume
and call time, including, but not limited to: electric power outage, changes to
company policies or rates, and system availability, we cannot determine the
impact of the AMI implementation on reduction in customer call volume or call
time.
Case: U-18122 Witness: BWelke
Exhibit: S-1.0 Date: 9/14/16 Page 15 of 21

Michigan Public Service Commission Auditor: Cody Mathews DTE Electric Company Audit Request No: CSM-1.7 Case No. U-18122 Date of Request: 9/2/2016 Respondent: K. Bridge Date of Response: 9/12/16 Page: 1 of 1
Request: 7. What is the Company’s expected average handling time for customer calls
after the CSR’s become better acclimated to the new system?
Response:
DTE anticipates elevated average handle times (AHT) from April thru end of year
2017. Beginning in first quarter of 2018, our estimate is that AHT will return to
within 10% above our pre-implementation level. This equates to an AHT of
approximately 440 seconds.
Case: U-18122 Witness: BWelke
Exhibit: S-1.0 Date: 9/14/16 Page 16 of 21

Michigan Public Service Commission Auditor: Cody Mathews DTE Electric Company Audit Request No: CSM-1.8 Case No. U-18122 Date of Request: 9/2/2016 Respondent: K. Bridge Date of Response: 9/12/16 Page: 1 of 1
Request: 8. Please describe the different functions and costs associated with vendors
three and four on Exhibit A-3 Page 1.
Response:
The functions performed by vendors 3 & 4 include handling customer calls after
Customer 360 go-live. They will provide incremental CR’s to handle expected
increased volumes and off-set the expected temporary increase in average
handling time. Vendor 4 will focus on collection related calls and vendor 3 will
focus on all other call types.
Primary costs include actual CR labor and associated overheads, training, set-up
and facilities costs.
Case: U-18122 Witness: BWelke
Exhibit: S-1.0 Date: 9/14/16 Page 17 of 21

Michigan Public Service Commission Auditor: Cody Mathews DTE Electric Company Audit Request No: CSM-1.9 Case No. U-18122 Date of Request: 9/2/2016 Respondent: K. Bridge Date of Response: 9/12/16 Page: 1 of 1
Request: 9. Please provide the benchmarking study done as described on page 7 lines
19-24 of Kenneth R. Bridge’s direct testimony.
Response:
See attachment 2.
Case: U-18122 Witness: BWelke
Exhibit: S-1.0 Date: 9/14/16 Page 18 of 21

DTE Energy CompanyMPSC Audit Data Request - U18122 (CSM-1.2, 1.3, 1.4, 1.5)Data 2006 - 2015
Line
1 Metric 2006 2007 2008 2009 2010 2011 2012 2013 2014 20152 Handled Call Volume3 *Total Handled 6,214,848 5,766,714 5,672,724 6,057,008 6,493,313 6,516,503 6,094,344 5,956,923 5,502,796 5,205,85645 Number of Staff6 Front-office Staff7 **DTE and Internal Contract CSRs 232 262 282 247 233 218 242 275 249 2758 ***Contact Center Support Staff 108 91 110 111 114 91 112 130 127 1129 Vendor/Outsourcer CSRs 185 175 136 181
10 Front-office Staff Total: 539 580 512 5681112 Back-office Staff (DTE Residential and Commercial Billing Exceptions Team) 36 32 36 3913 Total Front-office & Back-office Staff: 575 612 548 6071415 AHT 16 Combined Weighted Average Handled Time (Seconds) 328 373 384 401171819 Notes:20 * Includes DTE, Internal contractor and Vendor/Outsourcer handled calls21 **DTE CRs includes all DTE call center representatives taking customer calls and Internal Contract CR's handling customer calls22
Data not available
Data not available
*** Data includes all support staff including leaders (Contract and DTE), Escalation support, Quality and Training, Workforce, Vendor Management and reporting
Case: U-18122 Witness: BWelke
Exhibit: S-1.0 Date: 9/14/16 Page 19 of 21

Copyright © 2014 DTE and Accenture All rights reserved. 1
Post go live surge benchmarking results-Customer Service Representatives
Front Office Metric Utility 1 Utility 2 Utility 3 Incremental surge staff 100% 30% 10%
Approach Temps thru Staffing
Agency; Duration: ongoing
Temp Staffing thru Staffing Agency
Moved offline call center employees to the
phones; Duration: 4 months
Temps thru Staffing Agency;
Duration: 90 days
Cost -- -- -- Training by Accenture By Accenture by utility Customer Satisfaction +6% -- -- Average Handle Time (Go Live+1 weekly avg) +37% +12% +15%
Service Level (Go Live+1 weekly avg) 85% 95% 85%
Average Speed of Answer (Go Live+1 weekly avg) -6% -- +30%
Abandonment (Go Live+1 weekly avg) +1.27% +2.10% +3.40
Call Volume (Go Live+1 weekly avg) -- +2% +21%*
*implemented a bill print redesign and rate change at time of go live
MPSC Audit Data Request - U18122 (CSM-1.9) Case: U-18122 Witness: BWelke
Exhibit: S-1.0 Date: 9/14/16 Page 20 of 21

Copyright © 2014 DTE and Accenture All rights reserved. 2
Post go live surge benchmarking results-Back office billing exceptions
Back Office Metric Utility 1 Utility 2 Utility 3 Incremental surge staff +111% +20% 25%
Approach +40 from
Credit/Collections +40 from Accenture
+15 from Credit/Collections
+20 from Accenture
+10 from Credit/Collections
+35 from Accenture
Accenture Cost $2.0m $1.2m $1.8m Training by Accenture By Accenture By Utility Billing Accuracy (Go Live+1 weekly avg) 99.17% 98.86% 99.14%
Exception Volumes (Go Live+1 weekly avg) 330,000 200,000 360,000
Payments Posted (Go Live+1 weekly avg) 99.94% 99.57% 99.40%
MPSC Audit Data Request - U18122 (CSM-1.9) Case: U-18122 Witness: BWelke
Exhibit: S-1.0 Date: 9/14/16 Page 21 of 21

dtebusinessupdatebank22e
Exhibit S-1.html[9/27/2016 1:23:23 PM]
EX-99.1 2 dtebusinessupdatebank22e.htm EXHIBIT 99.1
Business Update September 14, 2016 EXHIBIT 99.1
MPSC Case No. U-18122 Exhibit S-2
Page 1 of 40

dtebusinessupdatebank22e
Exhibit S-1.html[9/27/2016 1:23:23 PM]
Safe Harbor Statement 2 Many factors impact forward-looking statements including, but not limited to, the following: impact of regulation by the EPA, FERC, MPSC, NRC, and CFTC, as well as other applicable governmental proceedings and regulations, including any associated impact on rate structures; the amount and timing of cost recovery allowed as a result of regulatory proceedings, related appeals, or new legislation, including legislative amendments and retail access programs; economic conditions and population changes in our geographic area resulting in changes in demand, customer conservation, and thefts of electricity and, for DTE Energy, natural gas; environmental issues, laws, regulations, and the increasing costs of remediation and compliance, including actual and potential new federal and state requirements; health, safety, financial, environmental, and regulatory risks associated with ownership and operation of nuclear facilities; changes in the cost and availability of coal and other raw materials, purchased power, and natural gas; volatility in the short-term natural gas storage markets impacting third-party storage revenues related to DTE Energy; impact of volatility of prices in the oil and gas markets on DTE Energy's gas storage and pipelines operations; impact of volatility in prices in the international steel markets on DTE Energy's power and industrial projects operations; volatility in commodity markets, deviations in weather, and related risks impacting the results of DTE Energy's energy trading operations; changes in the financial condition of DTE Energy's significant customers and strategic partners; the potential for losses on investments, including nuclear decommissioning and benefit plan assets and the related increases in future expense and contributions; access to capital markets and the results of other financing efforts which can be affected by credit agency ratings; instability in capital markets which could impact availability of short and long-term financing; the timing and extent of changes in interest rates; the level of borrowings; the potential for increased costs or delays in completion of significant capital projects; changes in, and application of, federal, state, and local tax laws and their interpretations, including the Internal Revenue Code, regulations, rulings, court proceedings, and audits; the effects of weather and other natural phenomena on operations and sales to customers, and purchases from suppliers; unplanned outages; the cost of protecting assets against, or damage due to, terrorism or cyber attacks; employee relations and the impact of collective bargaining agreements; the risk of a major safety incident at an electric distribution or generation facility and, for DTE Energy, a gas storage, transmission, or distribution facility; the availability, cost, coverage, and terms of insurance and stability of insurance providers; cost reduction efforts and the maximization of plant and distribution system performance; the effects of competition; changes in and application of accounting standards and financial reporting regulations; changes in federal or state laws and their interpretation with respect to regulation, energy policy, and other business issues; contract disputes, binding arbitration, litigation, and related appeals; and the risks discussed in our public filings with the Securities and Exchange Commission. New factors emerge from time to time. We cannot predict what factors may arise or how such factors may cause results to differ materially from those contained in any forward- looking statement. Any forward-looking statements speak only as of the date on which such statements are made. We undertake no obligation to update any forward-looking statement to reflect events or circumstances after the date on which such statement is made or to reflect the occurrence of unanticipated events. This presentation should also be read in conjunction with the Forward-Looking Statements section of the joint DTE Energy and DTE Electric 2015 Form 10-K and 2016 Forms 10-Q (which sections are incorporated by reference herein), and in conjunction with other SEC reports filed by DTE Energy and DTE Electric.
MPSC Case No. U-18122 Exhibit S-2
Page 2 of 40

dtebusinessupdatebank22e
Exhibit S-1.html[9/27/2016 1:23:23 PM]
• Overview • Long-Term Growth Update • Financial Update • Summary 3
MPSC Case No. U-18122 Exhibit S-2
Page 3 of 40

dtebusinessupdatebank22e
Exhibit S-1.html[9/27/2016 1:23:23 PM]
DTE Energy’s growth is driven by strong, stable utilities and complementary non-utility businesses 4 DTE Electric • Electric generation and distribution • 2.2 million customers DTE Gas • Natural gas transmission, storage and distribution • 1.2 million customers Complementary Non-Utility Businesses Strong, Stable and Growing Utilities Fully Regulated by Michigan Public Service Commission Gas Storage & Pipelines • Transport and store natural gas • 4 pipelines, 2 storage sites Power & Industrial Projects • Own and operate energy related assets • 66 sites, 17 states Energy Trading Generates economic value and provide strategic benefits ~80% of total earnings ~20% of total earnings DTE’s earnings are ~95% regulated or contracted, consisting of electric and gas utilities, FERC regulated pipelines and long-term contracted energy projects
MPSC Case No. U-18122 Exhibit S-2
Page 4 of 40

dtebusinessupdatebank22e
Exhibit S-1.html[9/27/2016 1:23:23 PM]
Our business strategy is fundamental to how we create value for our investors 5 5% - 6% Annual EPS Growth Attractive Dividend Strong Balance Sheet Utility growth plan driven by infrastructure investments Strategic and transparent growth opportunities in non-utility businesses provide diversity in earnings and geography Constructive regulatory structure and continued cost savings enable utilities to earn their authorized returns Operational excellence and customer satisfaction that are distinctive in our industry Strong BBB credit rating; grow dividends with earnings
MPSC Case No. U-18122 Exhibit S-2
Page 5 of 40

dtebusinessupdatebank22e
Exhibit S-1.html[9/27/2016 1:23:23 PM]
6 Financial performance Strong year-to-date financial results 2016 operating EPS* guidance raised 7th consecutive year with a dividend increase Regulatory framework New commissioner appointed to MPSC Regulatory proceedings progressing in a constructive manner, including a supportive position regarding NEXUS Operations DTE Electric ranked 2nd in Midwest for residential customer satisfaction** Year to date safety performance best in company’s history NEXUS project on track for 4th quarter 2017 in-service * Reconciliation to GAAP reported earnings included in the appendix We continue to make progress on many fronts ** J.D. Power 2016 Electric Utility Residential Customer Satisfaction Study(sm)(large providers). Visit jdpower.com
MPSC Case No. U-18122 Exhibit S-2
Page 6 of 40

dtebusinessupdatebank22e
Exhibit S-1.html[9/27/2016 1:23:23 PM]
7 Energy legislation continues to move forward • Key provisions include − Capacity requirements for all electricity providers − Integrated resource planning pre- approval process − Energy efficiency related incentives and revenue decoupling • 2008 law works well and includes − 10% retail open access cap − Certificate of Need for large capital projects − 12 month final order; 6 month rate case self implementation − 10% renewable portfolio standard DTE Energy’s 5% to 6% growth is not dependent on new energy legislation Proposed Legislation 2008 Law ...DTE customers would benefit from new capacity and reliability requirements
MPSC Case No. U-18122 Exhibit S-2
Page 7 of 40

dtebusinessupdatebank22e
Exhibit S-1.html[9/27/2016 1:23:23 PM]
$4.82 $2.35 $2.48 $2.62 $2.76 $2.92 $3.08 2011 2012 2013 2014 2015 2016 2017 2018 2019 2020 Raised 2016 operating EPS* guidance to a midpoint of $5.05 8 * Reconciliation to GAAP reported earnings included in the appendix (dollars per share) Operating EPS Dividend (Annualized) Actuals Forecast Dividend per share 5.6% CAGR 2011 – 2015 $3.75 $5.05 5.5% increase Operating EPS 6.5% CAGR 2011 – 2015 2016 Operating EPS Guidance Midpoint Growth segments $4.97 Total DTE Energy $5.05 Original guidance $4.93 $4.93
MPSC Case No. U-18122 Exhibit S-2
Page 8 of 40

dtebusinessupdatebank22e
Exhibit S-1.html[9/27/2016 1:23:23 PM]
DTE consistently provides value to its shareholders 9 * Source: Bloomberg (as of 6/30/16) 2009 2010 2011 2012 2013 2014 2015 2016 Annualized Dividend per Share $2.12 $3.08 140% 280% 107% 184% DTE Energy S&P 500 Utilities 10-YR 5-YR Total Shareholder Return (TSR)* Top quartile (dollars per share) Over 100 consecutive years of paying dividends Total return in top quartile of S&P Utilities for 5 and 10 years
MPSC Case No. U-18122 Exhibit S-2
Page 9 of 40
dtebusinessupdatebank22e
Exhibit S-1.html[9/27/2016 1:23:23 PM]
• Overview • Long-Term Growth Update • Financial Update • Summary 10
MPSC Case No. U-18122 Exhibit S-2
Page 10 of 40
dtebusinessupdatebank22e
Exhibit S-1.html[9/27/2016 1:23:23 PM]
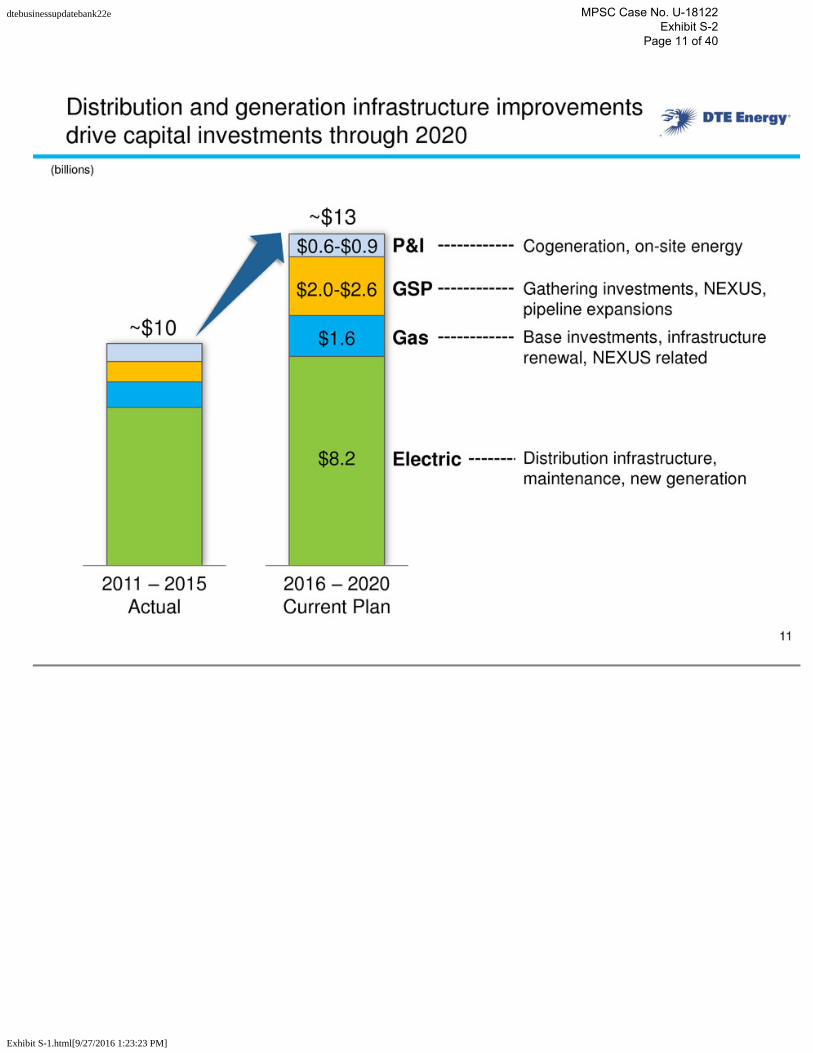
~$13 $8.2 Distribution infrastructure, maintenance, new generation $1.6 Base investments, infrastructure renewal, NEXUS related $2.0-$2.6 Gathering investments, NEXUS, pipeline expansions $0.6-$0.9 Cogeneration, on-site energy 2016 – 2020 Current Plan 11 ~$10 2011 – 2015 Actual P&I GSP Gas Electric Distribution and generation infrastructure improvements drive capital investments through 2020 (billions)
MPSC Case No. U-18122 Exhibit S-2
Page 11 of 40

dtebusinessupdatebank22e
Exhibit S-1.html[9/27/2016 1:23:23 PM]
Electric generation and infrastructure renewal will significantly increase investment in the decade ahead 32% DTE Electric Investment $8.2 $9.7 2016-2020 2021-2025 $7.1 2011-2015 New generation Distribution infrastructure 12 Maintenance and other projects (billions) ~$18 billion next 10 years The electric company started serving its first customers in 1886
MPSC Case No. U-18122 Exhibit S-2
Page 12 of 40

dtebusinessupdatebank22e
Exhibit S-1.html[9/27/2016 1:23:23 PM]
Of the $18 billion investment over the next 10 years, we will invest $6.5 billion on distribution infrastructure 32% 2016-2025 ~$18 Maintenance and other projects New generation Distribution infrastructure DTE Electric Total Investment 13 (billions) • $6.5 billion over next 10 years • Potential to increase to $10.5 billion • Replace aging infrastructure • Address overloaded substations • Enhance technology Customer benefits Reduce restoration time Improve reliability Decrease outages Create and support Michigan jobs
MPSC Case No. U-18122 Exhibit S-2
Page 13 of 40

dtebusinessupdatebank22e
Exhibit S-1.html[9/27/2016 1:23:23 PM]
DTE Electric has already begun to retire its coal-fired generation 14 Note: Estimated amounts. Timing and mix of generation impacted by MISO capacity requirements and Michigan and EPA policies 2030 Scenario 55% 2015 20% 15% 12.4 25% 15%-30% 15% Nuclear/Other Gas Renewables Coal 10% 30%-45% Electric Capacity Shift (GW) 12 - 13 2015 - 2016 2017 - 2020 2021 - 2025 2026 - 2030 Coal-fired Generation Retirement Timeline (MW) Total Retirements • Trenton Channel 7 • Trenton Channel 8 • River Rouge 2 275 375 1,850 1,000 3,500 • Trenton Channel 9 • River Rouge 3 • St. Clair (6 units)
MPSC Case No. U-18122 Exhibit S-2
Page 14 of 40

dtebusinessupdatebank22e
Exhibit S-1.html[9/27/2016 1:23:23 PM]
15 Paving the way for cleaner energy for our customers Generated/contracted enough electricity from renewable sources to power over 400,000 homes in 2015 • Announced retirement of 2.5 GW of less-efficient coal-fired generation – Capacity will be retired by 2023 – Combination of baseload gas and solar/wind renewables replace retired generation – ~$3 billion of expected investment • Will retire additional 1.0 GW by 2030 – Coal generation reduced by more than half • Reducing CO2 and conventional emissions significantly through 2030 • Purchased two natural gas combustion turbine plants in 2015 • Developing largest utility-owned solar array east of the Mississippi in service 1Q17 • Installed nearly 250 wind turbines • Drove over $2 billion in renewable energy investments over the past 5 years
MPSC Case No. U-18122 Exhibit S-2
Page 15 of 40

dtebusinessupdatebank22e
Exhibit S-1.html[9/27/2016 1:23:23 PM]
Significant emissions reductions have already been achieved and we continue on the path to clean energy 32% 16 2005 2015 2030 CO2 Emissions 16% Reduction 2005 2015 2030 2005 2015 2030 NOX Emissions SO2 Emissions • Emissions reductions are largely due to $2 billion in controls installed at Monroe Power Plant, new technology and reduced reliance on coal-fired generation • In addition, mercury emissions have been reduced 42% since 2005 with 75% reduction expected by 2030 67% Reduction 61% Reduction 40% Reduction 85% Reduction 95% Reduction
MPSC Case No. U-18122 Exhibit S-2
Page 16 of 40

dtebusinessupdatebank22e
Exhibit S-1.html[9/27/2016 1:23:23 PM]
Strengthening and expanding our gas infrastructure will reduce leaks and lost gas while creating and supporting Michigan jobs 17 2011-2015 2016-2020 $1.1 $1.6 DTE Gas Investment Base infrastructure Infrastructure renewal NEXUS related (billions) • $200 million through 2017 • Primarily additional compression • Supported by long-term transport agreement with NEXUS • Main renewal • Meter move-out • Pipeline integrity • Transmission • Compression • Distribution • Storage The gas company was formed in 1849 and started lighting the streets of Detroit with gas in 1851
MPSC Case No. U-18122 Exhibit S-2
Page 17 of 40

dtebusinessupdatebank22e
Exhibit S-1.html[9/27/2016 1:23:23 PM]
Average Annual Residential Bill* DTE Electric We remain focused on customer affordability 18 $1,223 $1,225 2012 2013 2014 2015 2016E 2017E Average Annual Residential Bill** DTE Gas $910 2012 2013 2014 2015 2016E 2017E 9% Flat ** Assumes normal weather and implementing $180 million rate increase beginning November 2016 * Assumes average usage per year times the average residential rate per year and implementing $344 million rate increase beginning August 2016 (dollars) $830
MPSC Case No. U-18122 Exhibit S-2
Page 18 of 40

dtebusinessupdatebank22e
Exhibit S-1.html[9/27/2016 1:23:23 PM]
19 Gas Storage & Pipelines has an asset portfolio with multiple growth platforms NEXUS Pipeline DTE Gas DTE Storage Marcellus Shale Utica Shale Bluestone Pipeline Bluestone Gathering System Michigan Gathering Millennium Pipeline Vector Pipeline (40%) • Bi-directional pipe • Firm capacity/demand-based contracts 1.3 Bcf/d Millennium Pipeline (26.25%) • 0.1 Bcf/d lateral expansion 2Q17 • 0.2 Bcf/d expansion 2H18 • Firm capacity/demand-based contracts 1.0 Bcf/d* Bluestone Pipeline & Gathering • Bi-directional pipe • 0.1 Bcf/d expansion 4Q16 • Firm capacity/demand-based contracts • Gathering is minimum volume based 1.0 Bcf/d* NEXUS Pipeline (50%) • 4Q17 in-service • Firm capacity/demand-based contracts 1.5 Bcf/d GSP Gas Storage • Strategically located between Chicago and Dawn trading hubs 91 Bcf * Includes expansions
MPSC Case No. U-18122 Exhibit S-2
Page 19 of 40

dtebusinessupdatebank22e
Exhibit S-1.html[9/27/2016 1:23:23 PM]
20 NEXUS project is progressing and originates in the most economical geology in the country Natural Gas LDC Industrial Customer Power Generation Marcellus / Utica Dry Gas Core DTE Gas Vector • Project on track for 4th quarter 2017 in- service • FERC Notice of Schedule issued 2nd quarter 2016 • Draft Environmental Impact Statement (EIS) received on July 8, 2016 • Final EIS expected by November 30, 2016 • FERC certificate of construction expected within 90 days of final EIS • Right of way acquisitions and detailed engineering progressing • Constructive work with FERC and other regulatory agencies continues
MPSC Case No. U-18122 Exhibit S-2
Page 20 of 40

dtebusinessupdatebank22e
Exhibit S-1.html[9/27/2016 1:23:23 PM]
0 5 10 15 20 25 30 2010 2015 2020 2025 2016 Forecast Utica / SW Marcellus Supply Growth (Bcf/d) Actuals 2012 Forecast 2013 Forecast 2014 Forecast 2015 Forecast Strong results from the Utica and Marcellus region are increasing expectations for the basin 21 Source: IHS CERA US Shale Basin Economics (NYMEX Gas Price Required for 15% After-Tax IRR) $ / MMBtu $2 $4 $5 $0 Marcellus – NE Core Utica – Dry Gas Utica – Wet Gas Marcellus – SW $3 $1 Source: Credit Suisse February 2016 report
MPSC Case No. U-18122 Exhibit S-2
Page 21 of 40

dtebusinessupdatebank22e
Exhibit S-1.html[9/27/2016 1:23:23 PM]
Gas Storage & Pipelines is focused on continued success in pipeline and gathering • Accelerated Marcellus development in 2015 delivered 30% year over year earnings growth • Earnings growth driven by both pipeline and gathering platforms • Assessing investment opportunities given current sector dynamics Near-Term • Current sector dynamics not expected to impact targets • Growth driven by – Further Millennium and Bluestone development – NEXUS project operational and potential expansions – Bolt on acquisitions to complement existing assets Long-Term Operating earnings* 2015 Actual $107 million 2016 Guidance $110-115 million Operating earnings* 2020 Target $170 million Capital investment 2016-2020 $2.0-2.6 billion * Reconciliation to GAAP reported earnings included in the appendix 22
MPSC Case No. U-18122 Exhibit S-2
Page 22 of 40

dtebusinessupdatebank22e
Exhibit S-1.html[9/27/2016 1:23:23 PM]
Power & Industrial Projects operates within three distinct business lines in 17 states DTW Airport, Michigan Gallia Fuels Project, Ohio Mt. Poso Waste Wood Project, California • On-site utility services for industrial and commercial customers • Coke and pulverized coal for steel customers • Wood-fired power plants • Landfill gas to energy projects • Projects reduce emissions from coal- fired plants • Utility contracted Industrial Energy Services Renewable Energy Reduced Emissions Fuel (REF) 23 Current duration* ~6+ years Current duration* ~15 years Current duration ~5 years Typical contract 5-20 years Typical contract 10-25 years * Current duration does not include expected contract extensions
MPSC Case No. U-18122 Exhibit S-2
Page 23 of 40

dtebusinessupdatebank22e
Exhibit S-1.html[9/27/2016 1:23:23 PM]
Power & Industrial Projects is continuing to pursue additional strategic opportunities • 2016 earnings in line with 2015 actuals • Higher REF earnings offset by lower steel related earnings Near-Term • Grow cogeneration portfolio • Pursue strategic asset acquisitions • Maximize REF opportunities Long-Term Operating earnings* 2015 Actual $95 million 2016 Guidance $90-100 million * Reconciliation to GAAP reported earnings included in the appendix 24 Operating earnings* 2020 target $105 million Capital investment 2016-2020 $0.6-0.9 billion
MPSC Case No. U-18122 Exhibit S-2
Page 24 of 40
dtebusinessupdatebank22e
Exhibit S-1.html[9/27/2016 1:23:23 PM]
• Overview • Long-Term Growth Update • Financial Update • Summary 25
MPSC Case No. U-18122 Exhibit S-2
Page 25 of 40

dtebusinessupdatebank22e
Exhibit S-1.html[9/27/2016 1:23:23 PM]
* Reconciliation to GAAP reported earnings included in the appendix ** Total DTE Energy excluding Energy Trading 2016 Original Guidance DTE Electric DTE Gas Gas Storage & Pipelines Power & Industrial Projects Corporate & Other Growth segments** Growth segments operating EPS Energy Trading DTE Energy Operating EPS Avg. Shares Outstanding $4.80 - $5.05 $4.80 - $5.05 $584 - $600 135 - 141 105 - 115 90 - 100 (50) - (46) $864 - $910 0 $864 - $910 180 (millions, except EPS) 26 Increased our 2016 operating EPS* guidance 2016 Revised Guidance $4.85 - $5.08 $4.91 - $5.19 $589 - $605 135 - 141 110 - 115 90 - 100 (50) - (46) $874 - $915 10 - 20 $884 - $935 180
MPSC Case No. U-18122 Exhibit S-2
Page 26 of 40

dtebusinessupdatebank22e
Exhibit S-1.html[9/27/2016 1:23:23 PM]
27 2016 Cash Flow and Capital Guidance Cash Flow Summary 2015 Actual 2016 Guidance Cash From Operations* $1.9 $1.8 Capital Spending (2.3) (2.7) Free Cash Flow ($0.4) ($0.9) Asset Sales & Other 0.1 - Dividends (0.5) (0.5) Net Cash ($0.8) ($1.4) Debt Financing: Issuances $1.1 $1.9 Redemptions (0.3) (0.5) Change in Debt $0.8 $1.4 Capital Expenditures Summary (millions) 2015 Actual 2016 Guidance DTE Electric Distribution Infrastructure $579 $610 New Generation 316 150 Maintenance & Other 892 790 $1,787 $1,550 DTE Gas Base Infrastructure $184 $220 NEXUS Related 2 110 Main Replacement** 87 100 $273 $430 Non-Utility $299 $520 – 720 Total $2,359 $2,500 - 2,700 ** Includes Main Renewal / Meter Move-out / Pipeline Integrity (billions) * Includes ~$0.2b and ~$0.1b of equity issued for employee benefit programs in 2015 actuals and 2016 guidance, respectively
MPSC Case No. U-18122 Exhibit S-2
Page 27 of 40

dtebusinessupdatebank22e
Exhibit S-1.html[9/27/2016 1:23:23 PM]
25% 21% 2014 2015 2016-2018E 51% 52% 2014 2015 2016-2018E Leverage* A strong balance sheet remains a key priority to support growth * Debt excludes securitization, a portion of DTE Gas’ short-term debt, and considers 50% of the Junior Subordinated Notes as equity Funds from Operations** / Debt* Target 50%- 53% Target 20% + • Strong year-to-date cash performance; 2016 financing plan is on track − $100 million equity issuance possible, but may not be necessary • Target $200 to $300 million total equity issuances over the next 3 years • Successfully extended the existing $1.9 billion credit facilities to 2021 − $1.8 billion of available liquidity as of June 30, 2016 • Maintain strong balance sheet metrics 28 ** Funds from Operations (FFO) is calculated using operating earnings
MPSC Case No. U-18122 Exhibit S-2
Page 28 of 40

dtebusinessupdatebank22e
Exhibit S-1.html[9/27/2016 1:23:23 PM]
• Overview • Long-Term Growth Update • Financial Update • Summary 29
MPSC Case No. U-18122 Exhibit S-2
Page 29 of 40

dtebusinessupdatebank22e
Exhibit S-1.html[9/27/2016 1:23:23 PM]
• Raised 2016 operating EPS* guidance by $0.12... ...in light of strong year-to-date performance • Increased dividend for 7th consecutive year... ...as we continue to grow dividends with earnings • Investing in utilities and strategic growth opportunities in our non-utility businesses... ...providing consistent 5% to 6% annual EPS growth • Retiring coal plants and replacing with a combination of gas and renewables... ...paving the way to cleaner energy by significantly reducing emissions • Maintaining strong cash flow and balance sheet... ...supporting our future growth opportunities 30 * Reconciliation to GAAP reported earnings included in the appendix Summary
MPSC Case No. U-18122 Exhibit S-2
Page 30 of 40

dtebusinessupdatebank22e
Exhibit S-1.html[9/27/2016 1:23:23 PM]
DTE Energy Investor Relations www.dteenergy.com/investors (313) 235-8030 31 Contact Us
MPSC Case No. U-18122 Exhibit S-2
Page 31 of 40

dtebusinessupdatebank22e
Exhibit S-1.html[9/27/2016 1:23:23 PM]
Appendix
MPSC Case No. U-18122 Exhibit S-2
Page 32 of 40

dtebusinessupdatebank22e
Exhibit S-1.html[9/27/2016 1:23:23 PM]
DTE Electric plans $8.2 billion of investments over the next 5 years 2015A 2016E 2017E 2018E 2019E 2020E Distribution infrastructure New generation Maintenance and other projects* 2016E - 2020E Total $14.8B ~$19.8B YE Rate Base** $662M ~$886M Depreciation * Includes power reliability, existing generation maintenance, AMI, Ludington expansion and other investments ** Includes working capital and rate base associated with surcharges $1,200 $8,200 $3,800 $3,200 $1,787 $1,550 $1,450 $1,700 $1,700 $1,800 33 Targeting 6% - 7% growth (millions)
MPSC Case No. U-18122 Exhibit S-2
Page 33 of 40

dtebusinessupdatebank22e
Exhibit S-1.html[9/27/2016 1:23:23 PM]
DTE Gas plans $1.6 billion of investments over the next 5 years 2015A 2016E 2017E 2018E 2019E 2020E 2016E - 2020E Total Base infrastructure Main Replacement* NEXUS related $1,600 $200 $600 $800 $3.3B ~$4.6B - $4.7B YE Rate Base** $102M ~$137M Depreciation ** Includes working capital $273 $430 $375 $265 $265 $265 34 * Includes main renewal, meter move-out and pipeline integrity Targeting 7% - 8% growth (millions)
MPSC Case No. U-18122 Exhibit S-2
Page 34 of 40

dtebusinessupdatebank22e
Exhibit S-1.html[9/27/2016 1:23:23 PM]
Interconnect agreements provide strong support on the NEXUS path up to 1.75 Bcf/d 35
MPSC Case No. U-18122 Exhibit S-2
Page 35 of 40

dtebusinessupdatebank22e
Exhibit S-1.html[9/27/2016 1:23:23 PM]
8.5% 7.1% 5.4% 4.8% 4.9% 2013 2014 2015 2016E 2017E Michigan’s economy continues to improve 36 Source: IHS 15.1 15.8 18.6 21.4 22.6 2013 2014 2015 2016E 2017E Unemployment Rate Housing Start Ups (000s) $407 $414 $419 $425 $432 2013 2014 2015 2016E 2017E Gross State Product (billions) Top decile in Gross Domestic Product five year growth*** Unemployment below national rate 7th most competitive state for job creation**** Most new manufacturing jobs since 2009* Ranked Top 10 in pro-business 50 state rankings** **** Source: Site Selection magazine * Source: State of Michigan website ** Source: Pollina Corporate/Aedi Pro-Business 50 State Rankings *** Source: Bureau of Economic Analysis, real GDP 2009 chained dollars (2009-2014)
MPSC Case No. U-18122 Exhibit S-2
Page 36 of 40
dtebusinessupdatebank22e
Exhibit S-1.html[9/27/2016 1:23:23 PM]
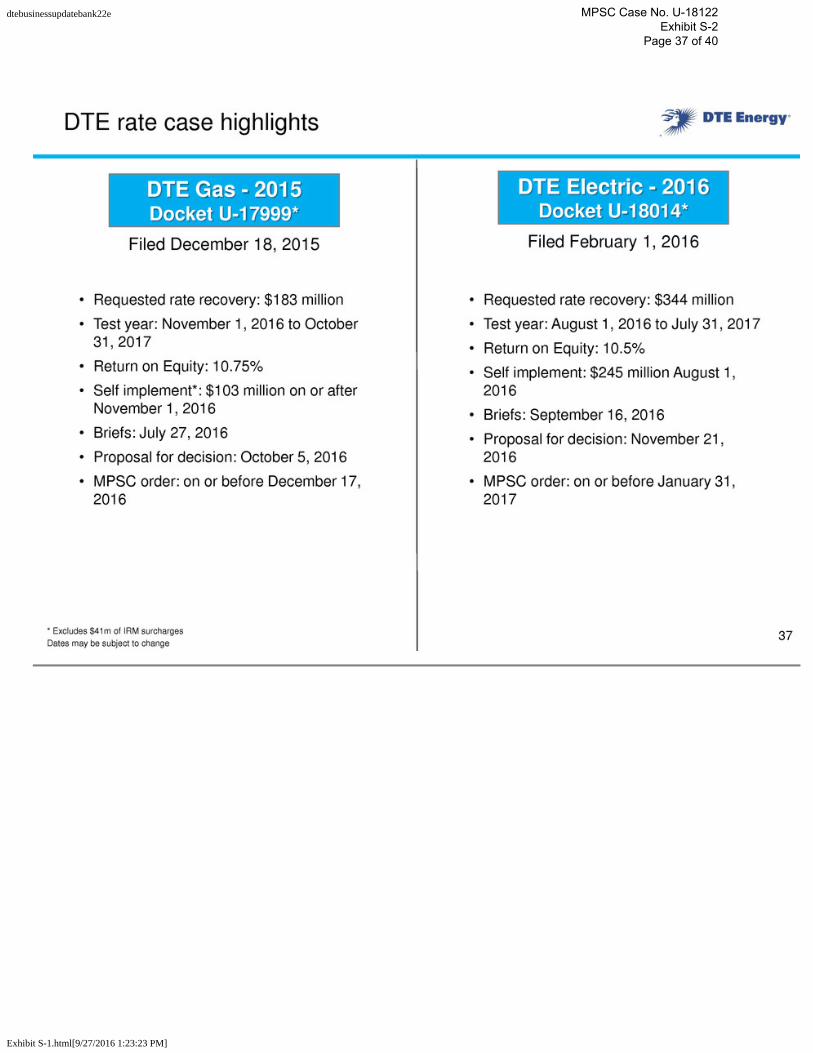
Filed December 18, 2015 Filed February 1, 2016 DTE Gas - 2015 Docket U-17999* DTE Electric - 2016 Docket U-18014* DTE rate case highlights • Requested rate recovery: $183 million • Test year: November 1, 2016 to October 31, 2017 • Return on Equity: 10.75% • Self implement*: $103 million on or after November 1, 2016 • Briefs: July 27, 2016 • Proposal for decision: October 5, 2016 • MPSC order: on or before December 17, 2016 • Requested rate recovery: $344 million • Test year: August 1, 2016 to July 31, 2017 • Return on Equity: 10.5% • Self implement: $245 million August 1, 2016 • Briefs: September 16, 2016 • Proposal for decision: November 21, 2016 • MPSC order: on or before January 31, 2017 37 * Excludes $41m of IRM surcharges Dates may be subject to change
MPSC Case No. U-18122 Exhibit S-2
Page 37 of 40

dtebusinessupdatebank22e
Exhibit S-1.html[9/27/2016 1:23:23 PM]
2011 – 2015 Full Year Reconciliation of Reported to Operating Earnings 38 Use of Operating Earnings Information – DTE Energy management believes that operating earnings provide a more meaningful representation of the company’s earnings from ongoing operations and uses operating earnings as the primary performance measurement for external communications with analysts and investors. Internally, DTE Energy uses operating earnings to measure performance against budget and to report to the Board of Directors. 2011 2012 2013 2014 2015 2011 2012 2013 2014 2015 DTE Energy Reported Earnings 711$ 610$ 661$ 905$ 727$ 4.18$ 3.55$ 3.76$ 5.10$ 4.05$ DTE Electric Fermi 1 asset retirement obligation 9 0.05 2011/2012 PSCR disallowance 12 0.07 Tree trimming disallowance 8 0.05 DTE Gas Gas Storage & Pipelines Power & Industrial Projects Coke oven gas settlement 7 0.04 Chicago Fuels terminal sale 2 0.01 Pet coke mill impairment 1 0.01 Asset impairment 4 0.02 Contract termination 10 0.05 Plant closure 69 0.39 Energy Trading Certain mark-to-market transactions 55 (102) 47 0.31 (0.57) 0.26 Natural gas pipeline refund (10) (0.05) Corporate & Other Michigan corporate income tax adj. (87) (0.50) Investment impairment 5 0.03 NY state tax law change 8 0.04 Unconventional Gas Discontinued operations 3 56 0.02 0.33 DTE Energy Operating Earnings 636$ 676$ 720$ 816$ 863$ 3.75$ 3.94$ 4.09$ 4.60$ 4.82$ Net Income (millions) EPS
MPSC Case No. U-18122 Exhibit S-2
Page 38 of 40

dtebusinessupdatebank22e
Exhibit S-1.html[9/27/2016 1:23:23 PM]
Use of Operating Earnings Information – DTE Energy management believes that operating earnings provide a more meaningful representation of the company’s earnings from ongoing operations and uses operating earnings as the primary performance measurement for external communications with analysts and investors. Internally, DTE Energy uses operating earnings to measure performance against budget and to report to the Board of Directors. In this presentation, DTE Energy provides guidance for future period operating earnings. It is likely that certain items that impact the company’s future period reported results will be excluded from operating results. A reconciliation to the comparable future period reported earnings is not provided because it is not possible to provide a reliable forecast of specific line items. These items may fluctuate significantly from period to period and may have a significant impact on reported earnings. For comparative purposes, 2011 and 2012 operating earnings exclude the Unconventional Gas Production segment that was classified as a discontinued operation on 12/31/2012. Reconciliation of Other Reported to Operating Earnings 39
MPSC Case No. U-18122 Exhibit S-2
Page 39 of 40

dtebusinessupdatebank22e
Exhibit S-1.html[9/27/2016 1:23:23 PM]
MPSC Case No. U-18122 Exhibit S-2
Page 40 of 40