Embed Size (px)
Citation preview

6/11/14 • 1
Michigan 21st Century Community Learning Centers Evaluation
2012-2013 Annual Report
Heng-Chieh Jamie Wu, Ph.D. Laurie A. Van Egeren, Ph.D. Laura V. Bates, M.A. The MSU Evaluation Team
Community Evaluation and Research Collaborative University Outreach and Engagement Michigan State University
June 2014

6/11/14 • 2
Copies of this report are available from:
University Outreach and Engagement
Michigan State University
Kellogg Center
219 S. Harrison Rd., Rm. 93
East Lansing, Michigan 48824-1022
Phone: (517) 353-8977
Fax: (517) 432-9541
E-mail: mailto:[email protected]
Web: http://outreach.msu.edu
© 2014 Michigan State University. All rights
reserved
The views expressed are solely those of the
authors. For more information about this report,
contact Jamie Wu at the above address or
phone number, or email
mailto:[email protected]
Funding
This report was supported in part by a grant
from the Michigan Department of Education and
University Outreach and Engagement, Michigan
State University.
Michigan State University is an affirmative-
action, equal-opportunity employer.

6/11/14 • 3
Contents
Highlights for the 2012-2013 Program Year .......................................................................... 1
Introduction ............................................................................................................... 3
Who Participates in the Program? .................................................................................... 4
Grantees ....................................................................................................................................... 4 Participating Students .................................................................................................................... 5 Parents’ Reasons for Enrolling Their Children....................................................................................7 Sustaining Participation of Students with Low Academic Performance .............................................. 8
What Are Students Doing in the Program? ......................................................................... 9
Academics ..................................................................................................................................... 9 Student Engagement in the Program .............................................................................................. 12
How is the 21st CCLC Program Connected to the School Day? ................................................. 14
What School or Program Factors Affected the Program? ....................................................... 16
How Did Students’ Academic Performance Change? ............................................................ 18
Grades ......................................................................................................................................... 18 Teacher Ratings ............................................................................................................................ 21 Student and Parent Perceptions of Program Impact ....................................................................... 22 Did Students with Greater Participation in the 21stCCLC Program Have Better Academic Outcomes? 23
Tables
1. Characteristics of Grantees Funded, 2009-2013
2. Parents’ Reasons for Enrollment by Grade Level: Percent Who Reported “Very
Important”
3. Percent of Students with Sustained Participation
4. Percent of Students Who Participated in Each Type of Academic Activity
5. Percent of Sites Requiring Various Levels of Participation in Academic Activities
6. Students’ Perceptions of the Quality of the Academic Support Provided by Their 21st
CCLC Program
7. Types of Activities Offered by Program Sites
8. Percent of Students Who Participated in Each Type of Enrichment Activity

6/11/14 • 4
9. Percent of Staff Reporting that Each Area is a Top Program Priority (First or Second
Priority)
10. Opportunities for Choice, Decision-Making, and Governance: Percent of Students Who
Agreed or Strongly Agreed
11. Skill-Building and Mastery Orientation: Percent of Students Who Agreed or Strongly
Agreed
12. Engagement: Percent of Students Who Agreed or Strongly Agreed
13. Formal Policies for Connecting with the School Day: Percent of Sites Selecting Each
Policy Option
14. Staff Stability: Percent of Sites
15. Percent of Sites Reporting School-Related Changes
16. Student and Parent Perceptions of Program Impact: Percent Who Reported the Program
Helped “Some” or “A Lot”
17. Sample Sizes by Academic Outcomes
18. Academic Outcomes Varied by Site and Student Characteristics
19. Total Days of Participation Related to Several Academic Outcomes in 21st CCLC
Programs
20. Participation in Specific Types of 21st CCLC Activities Related to Selected Academic
Outcomes
21. Effect Sizes for Dosage of Activity Types Relating to Academic Outcomes
Figures
1. Percent of New and Returning Students
2. Race/Ethnicity of Student Participants
3. Percent Showing Improvement in Math Grades (2006-2013)
4. Percent Showing Improvement in Math Grades for All Students vs. Students with Room
for Improvement (2006-2013)
5. Percent Showing Improvement in Reading Grades (2006-2013)
6. Percent Showing Improvement in Reading Grades for All Students vs. Those with Room
for Improvement (2006-2013)
7. Percent Showing Improvement in Teacher-Reported Homework Completion and
Classroom Participation (2006-2013)
8. Percent Showing Improvement in Teacher-Reported Classroom Behavior (2006-2013)
9. The Effect of Academic Dosage on Curriculum Connection Varied by Site Types
10. The Effect of Academic Enrichment Dosage on Curriculum Connection Varied by Site
Types
11. The Effect of Physical Activity Dosage on Teacher Ratings Varied by Site Types

6/11/14 • 1
Highlights for the 2012-2013 Program Year
Michigan 21st CCLC programs served diverse groups of primarily low-
income students
In 2012-2013, 34,969 students enrolled in the program, half boys and half
girls. Most of the participants (82%) were from low-income families.
About half were elementary school students, 26% in middle school (6th –
8th grade), and 23% high school students. As in previous years, most were
African American (45%) or White (39%). Programs focused on sustaining
the participation of students with low academic performance, as they are
likely to benefit the most. Participation rates for students with low
academic performance at 30, 60, and 90 days were nearly the same as for
other students.
Programs offered a variety of academic activities
Programs offered a variety of academic activities that focus on academic
support (such as homework help and tutoring) or on academic
enrichment (project-based or embedded learning). Almost all (96%) of
the students participated in some academic activities. Participation in
tutoring, which helps students who are behind, remains low—about half
of the programs reported that they either didn’t offer any tutoring (21%),
or it was not required for any student to participate (28%). However, 58%
of the students did participate in an activity focusing on science,
technology, engineering, or math (STEM). These activities can engage
students’ interest in STEM fields, which will experience job growth in
future years.
Participation in 21st CCLC programs was related to improved
academic performance
Students who participated for more days had greater improvement in
reading and math grades, as well as teacher ratings of homework
completion and school behavior. Students who participated more also
were more likely to report that programs helped them with academic
learning. The positive associations between greater attendance days and
improved academic outcomes held true even after controlling for student
and site characteristics that were relevant to academic outcomes.

6/11/14 • 2
Programs offered enrichment activities to students who might
not have similar opportunities in school
In addition to academics, programs offer enrichment activities known to
foster an environment for positive youth development. Frequently, low-
income students attending low-performing school lack such opportunities
in their school or neighborhood. Most programs (80-90%) offered
activities in recreation, the arts, youth development, and sports; about
half also offered technology (54%) or health (46%). The most students
participated in recreation (57%), and about 40% participated in the arts,
39% in youth development, and 37% in sports.

6/11/14 • 3
Introduction Following the same approach used in the previous 2 years, the 2012-2013 Annual
Report continued the use of the leading indicators (with the symbol ) to
highlight program-level quality characteristics that are known from research and
practice to affect student development. Although these quality measures are
important to creating a context for overall development, they are not necessarily
directly related to academic improvement.
In the outcomes section we also analyze how students’ participation contributed
to their academic outcomes, taking into account the characteristics of programs
and students that might also affect their performance. This is the second year
that we have done this type of analysis.

6/11/14 • 4
Who Participates in the Program?
Who participates in the 21st Community Learning Centers (CCLC) programs
statewide is influenced by both the characteristics of programs that receive grants
(grantees) and the types of students that they recruit into their respective
programs. The Michigan Department of Education (MDE) provides guidelines for
entities applying for 21st CCLC grants, specifying: (1) types of organizations that
may apply (such as public schools, charter schools, community organizations);
(2) characteristics of programs that may receive priority points (such as the
schools eligible for Title I school-wide funding, serving students in 6th-8th
grades, or having a faith-based organization as a partner); and (3) status of
students and families served by the program (such as eligibility for free and/or
reduced price lunches and/or living in poverty). In general, priority is given to
programs serving low-performing schools in high-poverty areas. For details
about priority points relevant to the group of grantees that were participating in
2012-2013, contact: Stacy Ann Sipes at 517-241-7577 or [email protected].
Grantees
The MDE website describes the 21st CCLC program as follows:
The 21st Century Community Learning Centers (21st CCLC)
Grant Program’s focus is to provide expanded academic
enrichment opportunities for children attending low-performing
schools. Tutorial services and academic enrichment activities are
designed to help students meet local and state academic
standards in subjects such as reading and math. In addition, 21st
CCLC programs provide youth development activities, drug and
violence prevention programs, technology education programs,
art, music and recreation programs, counseling and character
education to enhance the academic component of the program.
Table 1 shows an overview of grantees over the past 4 years. In the 2012-2013
program year, 89 grants were awarded to 44 grantees serving students at 292
sites. After 2 years in which no new grantees were added, 14 grants were awarded
to new grantees in 2012-2013. The largest number of grants went to local school
districts (22), followed by nonprofit/community-based organizations (13) and
public school academies (5). Two grants each went to intermediate school
districts and universities. This distribution of grantees has remained quite stable

6/11/14 • 5
over the past four years. As in past years, the majority of the 21st CCLC grantees
served elementary grades. When priority points were awarded in the 2009-2010
year for serving middle and high school students, the number of programs
serving those students increased dramatically and has remained relatively stable
since then.
Table 1. Characteristics of Grantees Funded, 2009-2013
Characteristic 2009-10 Grantees
2010-11 Grantees
2011-12 Grantees
2012-13 Grantees
Overall Number of funded grants 93 91 90 89 Number of grantees 49 (55
a) 48 (54
a) 48 (53
a) 44 (49
a)
Number of new grantees 15 0 0 14 Number of sites reporting on the Annual
Report Form 333 333 332 292
Cohorts C 7 D 92 92 90 89 E 90 93 90 157 F 156 164 160 54 G 30
Grantee’s fiduciary organization Local school district 23 23 23 22 Intermediate school district 2 2 2 2 Public school academy (charter school) 6 6 6 5 Nonprofit/community-based organization 17 16 16 13 University 1 1 1 2
Sites serving students of different grades or grade combinations
b
Elementary 113 154 150 135 Middle school 89 78 75 69 High school 53 55 53 60 Elementary and middle school 51 45 48 53 Middle and high school 16 14 12 11 Elementary, middle and high school 23 3 2 2
a Numbers in parentheses treat the multiple subcontractors that Detroit Public Schools and Grand Rapids Public
Schools used to provide their programs as grantees. b
Calculated based on the grades of students served.
Participating Students
Gender, Grade Level, and Family Income
In the 2012-2013 program year, 34,969 students enrolled in the program. As had
been true in past years, students were almost equally divided between boys
(17,720; 51%) and girls (17,249; 49%). Most participants were in elementary
grades (K-5th grades; 17,741; 51%), with middle school students second (6th-8th
grades; 9,053; 26%). The smallest group were high school students (9th-12th
grades; 8,166; 23%). Among those youth whose school outcome data were

6/11/14 • 6
returned (24, 353), about 82% were low income, which is defined as eligible for
free or reduced price meals.
New vs. Returning Students
Participants were either newly enrolled in this program year or were returning for
a second or third year. Getting students to return multiple years is important
because sustained participation over time can lead to greater benefits. Figure 1
shows the average portion of students being new or returning from the previous
years in 2012-2013. At each grade level, about one-third of participants were
returning for a second or more years. The proportion of elementary and middle
school participants with continuous participation from previous years was higher
than the proportion of high school students returning.
Figure 1. Percent of New and Returning Students
E = elementary school; M = middle school; H = high school
Race/Ethnicity
Figure 2 shows the distribution of participants by race/ethnicity. Almost half
(45%) of the students identified themselves as Black or African American, and
somewhat fewer (39%) identified themselves as White. The large proportion of
African American participants reflects the urban focus of many programs. The
category “Other Groups” included Arab/Middle Eastern and Hispanic/Latino-a.
31%
38%
39%
69%
62%
61%
0% 20% 40% 60% 80% 100%
H
M
E
2012-13 returning students
2012-13 new students

6/11/14 • 7
Figure 2. Race/Ethnicity of Student Participants
Parents’ Reasons for Enrolling Their Children
Parents who completed the parent end-of-year survey rated the importance they
placed on various reasons for enrolling their child in the program. Table 2 shows
the percent of parents who rated each reason as “very important” at each grade
level.
Table 2. Parents’ Reasons for Enrollment by Grade Level: Percent Who Reported “Very Important”
GRADE LEVEL Reason E M H All
It is a safe place for my child after school. 95% 92% 87% 93% I hope it will help my child do better in school. 88% 87% 85% 87% It provides dependable after-school care. 82% 72% 61% 77% It will help my child stay out of trouble. 79% 79% 78% 79% It provides affordable after-school care. 76% 68% 57% 71% School staff suggested that my child enroll. 53% 52% 54% 53% My child has a disability or learning problem that this program can help. 47% 43% 46% 46%
NOTE: E = elementary school; M = middle school; H = high school.
Most parents at all grade levels wanted to obtain a safe place for their child to go
after school (93% overall) and to help the child do better at school (87% overall).
A substantial percent at each grade level also hoped the program would help their
5%
11%
39%
45%
Multi-Racial
Other Groups
White
Black or AfricanAmerican

6/11/14 • 8
child stay out of trouble (79% overall). Dependable and affordable child care was
less important to parents of older children than to parents of younger children. It
is notable that just under half of parents (43-47%) enrolled their children to
obtain help with a disability or learning problem.
Sustaining Participation of Students with Low Academic Performance
Students with lower academic performance at the beginning of the school year
are likely to benefit more from the additional academic support offered by 21st
CCLC programs. For this report, low academic performance was defined as either
having a GPA of 2.5 or below at the beginning of the school year or at the year
average, or having MEAP/MME scores below proficiency level. Table 3 shows the
percent of low-performing students and other students who attended for 30, 60,
and 90 days. Over the past several years, programs have done better at sustaining
the participation of low performing students compared to their counterparts.
This year the percent of low performing students who attended at least 30, 60,
and 90 days remained stable, but it’s slightly lower than those with better
academic performance.
Table 3. Percent of Students with Sustained Participation
Days Retained Low-Performing Students Other Students
30 days 64% 66% 60 days 43% 48% 90 days 28% 33%
NOTE: Total students = 34,969; students with enough data to determine academic performance level = 22,074; low-performing students = 17,940; other students = 4,134.

6/11/14 • 9
What Are Students Doing in the Program?
The primary purpose of the 21st CCLC program is to provide opportunities for
academic enrichment to students attending low-performing schools. To enhance
the academic component of the program, grantees must also offer other
enrichment activities in various areas such as youth development, drug and
violence prevention, technology education, the arts, and recreation.
Academics
Participation in Academics
All 21st CCLC programs were required to offer academics, although Table 4
shows that across the state approximately 4% of the students in all grades did not
participate in any academic activities.
Table 4. Percent of Students Who Participated in Each Type of Academic Activity
GRADE LEVEL
Type of Academic Activity E
N=135 M
N=69 H
N=60 All
N=330
Academic enrichment focused on specific subjects 40% 33% 22% 35% Homework help 60% 57% 43% 56% Embedded learning (academic activities occurring within
non-academic enrichment) 51% 37% 25% 42%
Tutoring (remedial instruction for 1-3 students per adult) 4% 4% 6% 4% Credit recovery N/A N/A 10% 2% STEM (science, technology, engineering, math) 68% 55% 31% 58% Did not participate in any academic activities 2% 5% 9% 4%
NOTE: E = Elementary school; M = Middle school; H = High school
High school students have a higher level of nonparticipation (9%) in academics
than do middle school (5%) and elementary school (2%) students. Most students
received academic instruction in the form of homework help (56%), embedded
learning activities (42%), or academic enrichment focused on specific subjects
(35%). Elementary and middle school students received more homework help
than high school students, and a greater proportion of younger students than
older students received academic enrichment. Science, technology, engineering
and math (STEM) was a new academic category in 2011-2012, and overall only
6% of students participated in STEM activities that year. In 2012-2013, the
proportion of students participating in STEM activities increased greatly, with
58% of participants receiving STEM-related enrichment. Elementary students

6/11/14 • 10
(68%) were more likely to participate in STEM than middle (55%) or high school
(31%) students; however, at all grade levels participation increased substantially.
Program Policies for Academics
Table 5 shows program policies regarding participation in academics. Program
sites were much more likely to require homework help for all of their students
than any other type of academic activity. However, about half of the programs
reported that they either didn’t offer tutoring at all (21%), or tutoring activity was
not required for any student (28%). When it was available, tutoring was much
more likely to be required of students with academically low performing students
than of other students.
Table 5. Percent of Sites Requiring Various Levels of Participation in Academic Activities
Type of Academic Activity
Required for All
Students
Required for Students with Low
Academic Performance
Required for Some Other
Group of Students But
Not All
Not Required for Any Student
Did Not Offer Activities of
This Type
Homework help 77% 8% 6% 8% 1% Tutoring (remedial help for
specific academic subjects with no more than 1-3 students/staff)
15% 25% 10% 28% 21%
Other activities where academic learning is the main emphasis
65% 8% 9% 16% 1%
NOTE: Rows may not sum to 100% due to rounding.
Student Perceptions of Academic Support
Table 6 shows students’ responses to statements related to how their
participation in academics in the after-school program affected their in-school
performance.
Table 6. Students’ Perceptions of the Quality of the Academic Support Provided by Their 21st CCLC Program
GRADE LEVEL Item E M H All
This program helps me get my homework done. 88% 85% 88% 87% This program helps me understand what we are doing in class. 81% 77% 81% 79% At this program, I learn school subjects in fun ways. 80% 76% 76% 78% My grades have gotten better because of this program. 75% 72% 81% 76% The school work I do matches the school work we do in regular class. 67% 68% 75% 69%
NOTE: E = elementary school; M = middle school; H = high school.
A majority of students at all grade levels thought their programs helped them
complete homework, understand classroom material, and learn in fun ways. High

6/11/14 • 11
school students were more likely than the elementary or middle school students
to say the work they did in the program matched their school work and that
participation helped them improve their grades. However, a majority of students
at all grade levels agreed with these statements.
Other Enrichment Activities Offered
Program sites varied in the types of activities they offered to students in addition
to academic activities. Table 7 shows the distribution of types of activities offered
by grade level. Most program sites offered youth development, recreation, art,
sports, and special event programming. More middle school sites than
elementary or high school sites offered technology, and only about half of sites at
any grade level offered health-related activities. It should be noted that in this
table, those schools crossing elementary, middle, and/or high school boundaries,
such as a K-8 school, were omitted from both the elementary and the middle
school categories but do appear in the All Sites category.
Table 7. Types of Activities Offered by Program Sites
GRADE LEVEL E
N=135 M
N=69 H
N=60 All
N=330
Recreation 90% 93% 88% 90% Sport 86% 87% 77% 86% Art 85% 94% 88% 89% Youth development 82% 86% 95% 86% Special events 81% 77% 90% 80% Health 53% 44% 42% 46% Technology 45% 70% 50% 54%
Participation in Other Enrichment Activities
Table 8 shows the percent of students at each grade level who participated in
different types of enrichment activities.
Table 8. Percent of Students Who Participated in Each Type of Enrichment Activity
GRADE LEVEL Type of Activity E M H All
Recreation (social events, games, free play, etc.) 67% 54% 33% 57% Sports 43% 36% 23% 37% Arts 48% 34% 26% 40% Youth development (character education, conflict
resolution, life skills, resistance skills, etc.) 39% 40% 39% 39%
Technology 12% 13% 5% 11% Health/nutrition 13% 4% 3% 9%
NOTE: E = elementary school; M = middle school; H = high school
More students participated in recreation than any other type of activity, followed
by arts, youth development and sports. This is not surprising, as these activities

6/11/14 • 12
are offered by the most programs. With the exception of youth development,
fewer high school students than elementary or middle school students
participated in any type of enrichment activity.
Staff Priorities for Programming
Staff priorities for programming are important because they tell us where staff
are likely to focus their efforts. In Table 9 we see that improving the academic
achievement of students was the top priority as reported by over 2/3 of the 21st
CCLC program staff. Almost half of the staff said that helping low-performing
students achieve grade-level proficiency was a top priority.
Table 9. Percent of Staff Reporting That Each Area Is a Top Program Priority (First or Second Priority)
Program Area Percent of Staff
Improve the academic achievement of youth 67% Enable the lowest-performing students to achieve grade-level proficiency 46% Improve the social and emotional development of youth 35% Help youth keep up with homework 25% Allow youth to relax, play, and socialize 10% Develop the artistic abilities of youth 8% Develop the sports skills of youth 2%
Student Engagement in the Program
Participation in Decision Making
For students to continue to participate in programs, it is important for them to
have opportunities to make developmentally appropriate decisions about their
activities (Akiva, Cortina, Eccles & Smith, 2013)1. Table 10 shows the percent of
participants who said the program offered them various opportunities for choice
and decision making.
Table 10. Opportunities for Choice, Decision-Making, and Governance: Percent of Students Who Agreed or Strongly Agreed
Survey Item: At This Program… Percent of Students
I get to decide how to complete some projects or activities. 67% My opinions matter when decisions are made about the program. 67% I get to choose my activities. 65% I help decide what kinds of activities are offered. 61% I am involved in important decisions about this program. 59% I have participated in a youth advisory committee. 49%
1 Akiva, T., Cortina, K. S., Eccles, J. S. (2012). Youth Experience of Program Involvement: Belonging and Cognitive Engagement in
Organized Activities. Applied Developmental Psychology, 34, 208-218.

6/11/14 • 13
About 2/3 of students said that the program allowed them to make choices about
their own and program activities and that their opinions matter. However, only
half have participated in a youth advisory committee.
Skill Building
It is important to recognize that skill building and mastery are gradual processes
for students, as very few people are good at doing things well the first time. Staff
need to be accomplished at creating an environment where students know it’s OK
to make mistakes as they are learning and that staff will recognize both
perseverance and proficiency. Table 11 suggests that the program created an
atmosphere in which students could feel free to build mastery of new skills.
Table 11. Skill-Building and Mastery Orientation: Percent of Students Who Agreed or Strongly Agreed
Survey Item: At This Program… Percent of Students
It’s ok to make mistakes as long as you’re learning. 90% Trying hard is very important. 88% How much you improve is really important. 88% It’s important that we really understand the activities that we do. 86% Learning new ideas and concepts is very important. 86% Staff notice when I have done something well. 84%
Sustaining Participation
Finally, being engaged helps sustain student participation (Akiva et. al., 2013).
Table 12 suggests that students may have been engaged with the program
through learning new skills, thinking new thoughts, and doing things that they
didn’t get to do anywhere else.
Table 12. Engagement: Percent of Students Who Agreed or Strongly Agreed
Survey Item: At This Program… Percent of Students
I get to do things I like to do. 81% The activities challenge me to learn new skills. 79% The activities we do really make me think. 74% I do things that I don’t get to do anywhere else. 65%

6/11/14 • 14
How is the 21st CCLC Program Connected to the
School Day? In order to improve students’ school-day performance, the 21st CCLC program
must be formally connected to their school-day classes. Table 13 lists various
ways that the after-school programs connect to the school day.
Table 13. Formal Policies for Connecting with the School Day: Percent of Sites Selecting Each Policy Option
Policy Percent of
Sites
School-day staff (teachers, principal, counselors) identified and recommended students to come to the after-school program for academic support.
98%
Site coordinator responsibilities included communicating regularly with school-day staff about student needs.
98%
The objectives for the after-school activities were intentionally influenced by grade-level content standards.
86%
The curricula used during the school day were used as part of the after-school program’s academic activities.
82%
Someone was responsible for attending teacher staff meetings at least monthly and reporting back to the after-school program.
79%
Program staff:
Corresponded with school-day teachers at least once per week about individual students’ academic progress and needs
83%
Had access to and reviewed students’ grades for each marking period and standardized test scores throughout the year
81%
Had a process for identifying low-achieving students within one week of their enrollment in the after-school program
71%
Had access to and use of school data systems (one example is Powerschool) that display students’ progress and grades on school-day class work
70%
Used written progress reports to correspond with school-day teachers about individual students’ academic progress and needs
63%
Had written policies and procedures about connecting with school-day teachers to support students’ academic learning
62%
Conducted any assessments to monitor students’ academic learning 51%
Almost all (98%) of the sites reported that it was the site coordinator’s role to
communicate regularly with the school, and that school staff recommended
students to the program for academic support. Most (86%) reported that their
after-school activities were intentionally influenced by grade-level content
standards. Most program staff communicated regularly with school-day teachers
about individual students’ needs and assigned someone to attend teacher staff
meetings. Staff in about 70% programs had access to student school data and
were able to identify low-achieving students early in the year. Fewer sites
reported having written policies for connecting with school day teachers to

6/11/14 • 15
support their students’ learning or using written progress reports to connect with
school day teachers about individual students’ academic progress and needs.

6/11/14 • 16
What School or Program Factors Affected the
Program? The context in which the 21st CCLC program operates has an impact on its
success. For example, when there are many changes, such as program
administrators or school leaders leaving or excessive turnover among the staff, it
is hard for the program to provide the continuity that creates a positive learning
environment. In addition, staff job satisfaction and opportunities for professional
development contribute to staff capacity to create a positive learning
environment.
Program Director and Site Coordinator Stability
Seven programs out of 46 (15%) grantees changed program directors in 2012-13
(). Among the eight single-site grantees, three used the same person as project
director and site coordinator; the others did not. (Both options are allowed by
MDE.) Six (13%) grantees reported having part-time program directors. Having a
full-time program director is important because frequently the program director
needs to make contact with school personnel and thus needs to be there during
the school day.
Seventeen percent of the site coordinators left during the 2012-2013 program
year (), and 38% did not return for the 2012-2013 program year.
Staff Stability
Table 14 shows site reports of staff stability. Sites reported on the percent of staff
who stayed for the program year and the percent of staff who returned from the
previous year.
Table 14. Staff Stability: Percent of Sites
STAFF RETENTION RATES 0-25% 26-50% 51-75% 76-100%
Staff Changes PERCENT OF SITES
What percent of your paid REGULAR STAFF who provided activities STAYED for most or all of the 2012-2013 school year?
56% 9% 16% 69%
What percent of this year’s REGULAR STAFF also provided activities last year? (Omits the sites that did not continue)
13% 13% 20% 54%

6/11/14 • 17
Sixty-nine percent of sites reported that at least three quarters of activity staff
stayed for most or all of the program year. About half also reported that most of
their staff returned from the previous year.
Sites Reporting School-Related Changes
Changes in the host school can affect awareness of and support for the 21st CCLC
program. As seen in Table 15, the most frequent school change reported by
program sites was a change in school leadership; 20% reported a new school
principal and 14% reported a different superintendent. About 11% reported cuts
in school budgets that affected the 21st CCLC program.
Table 15. Percent of Sites Reporting School-Related Changes
Changes Number of Sites
Percent of Sites
Principal of the school changed 59 20% Superintendent changed or established 41 14% Host school was faced with budget cuts that affected your site 31 11% School reorganized 16 6% Program moved to a new school 11 4% Other major changes at the school or district that affected your program 10 3%

6/11/14 • 18
How Did Students’ Academic Performance Change?
We report on students’ academic performance for 21st CCLC programs in the
following categories:
Percent of students showing improvement in mathematics and
English/language arts/reading grades of at least ½ grade (e.g., 2.5 to 3.0)
from fall to spring
Percent of students whose teachers reported any improvement in
homework completion and class participation
Percent of students whose teachers reported any improvement in student
classroom behavior
We also present the students’ and parents’ perceptions of how the 21st CCLC
program helped the students improve in various aspects of their academic and
non-academic performance and behavior.
Data for this section were collected through the EZReports program reporting
system, Excel files through which sites provided school grades from school
records, and teacher surveys collected by 21st CCLC program staff.
Grades
Math Grades
Overall. Figure 3 shows the percent of participants whose math grades
improved in each year in Michigan (2006-2013). The percent showing
improvement in Michigan has been stable, with almost a third of students
improving in math each year.

6/11/14 • 19
Figure 3. Percent Showing Improvement in Math Grades (2006-2013)
NOTE: Improvement is defined as ½ grade increase from fall to spring within a year. Includes only students who participated at least 30 days.
Students with room for improvement. Students who had lower grades
when they entered the program have more opportunity to improve during the
program year. Figure 3, above, includes all regularly attending students, both
those who started with the highest grades as well as those who had room to
improve (having a GPA in math of less than 3.0 at the beginning of the year). As
shown in Figure 4, when Michigan students with room for improvement were
compared with all Michigan students, a substantially higher percentage of those
with room for improvement showed gains (15%). Over the past 7 years, the
difference in improvement between all students and those with gradepoints
below 3.0 has been stable.
Figure 4. Percent Showing Improvement in Math Grades for All Students vs. Students with Room for Improvement (2006-2013)
NOTE: Improvement is defined as ½ grade increase from fall to spring within a year. Includes only students who participated at least 30 days. Room for improvement is defined as having a fall grade below 3.0.
33% 33% 33% 32.0% 29%
32% 31%
0%
10%
20%
30%
40%
50%
2006-07 2007-08 2008-09 2009-10 2010-11 2011-12 2012-13
Pe
rce
nt
stu
de
nts
47% 46% 48% 47% 43%
47% 45%
33% 33% 33% 32% 29%
32% 31%
-10%
0%
10%
20%
30%
40%
50%
60%
2006-07 2007-08 2008-09 2009-10 2010-11 2011-12 2012-13
Per
cen
t st
ud
ents
MI studentswith initialmath GPAbelow 3.0All MIstudents

6/11/14 • 20
Reading Grades
Overall. Figure 5 shows the percent of participants who improved in reading
grades each year in Michigan (2006-2013). The percent who improved has
remained stable during this period.
Figure 5. Percent Showing Improvement in Reading Grades (2006-2013)
NOTE: Improvement is defined as ½ grade increase from fall to spring within a year. Includes only students who participated at least 30 days.
Students with room for improvement. When we compare the performance
of Michigan regular participants with room for improvement to that of all regular
Michigan participants (Figure 6), a substantially higher percentage of students
with room for improvement showed at least a half grade gain in reading
compared to all students. This has been true over the past 7 years of the program.
Figure 6. Percent Showing Improvement in Reading Grades for All Students vs. Those with Room for Improvement (2006-2013)
NOTE: Improvement is defined as ½ grade increase from fall to spring within a year. Includes only students who participated at least 30 days. Room for improvement is defined as having a fall grade below 3.0.
34% 35% 33%
31% 31% 30% 31%
0%
10%
20%
30%
40%
50%
60%
2006-07 2007-08 2008-09 2009-10 2010-11 2011-12 2012-13
Pe
rce
nt stu
de
nts
49% 50% 46% 45% 45%
44% 45%
34% 35% 33% 31% 31% 30% 31%
-10%
0%
10%
20%
30%
40%
50%
60%
2006-07 2007-08 2008-09 2009-10 2010-11 2011-12 2012-13Perc
ent
stu
dents
MI studentswith initialreading GPAbelow 3.0
All MIstudents
6/11/14 • 21
Teacher Ratings
Each year, teachers rate students attending the 21st CCLC program on the extent
to which their performance changed over the year in homework
completion/classroom participation and classroom behavior. Teachers may rate
student performance or behavior as improved, unchanged, declined, or did not
need to improve.
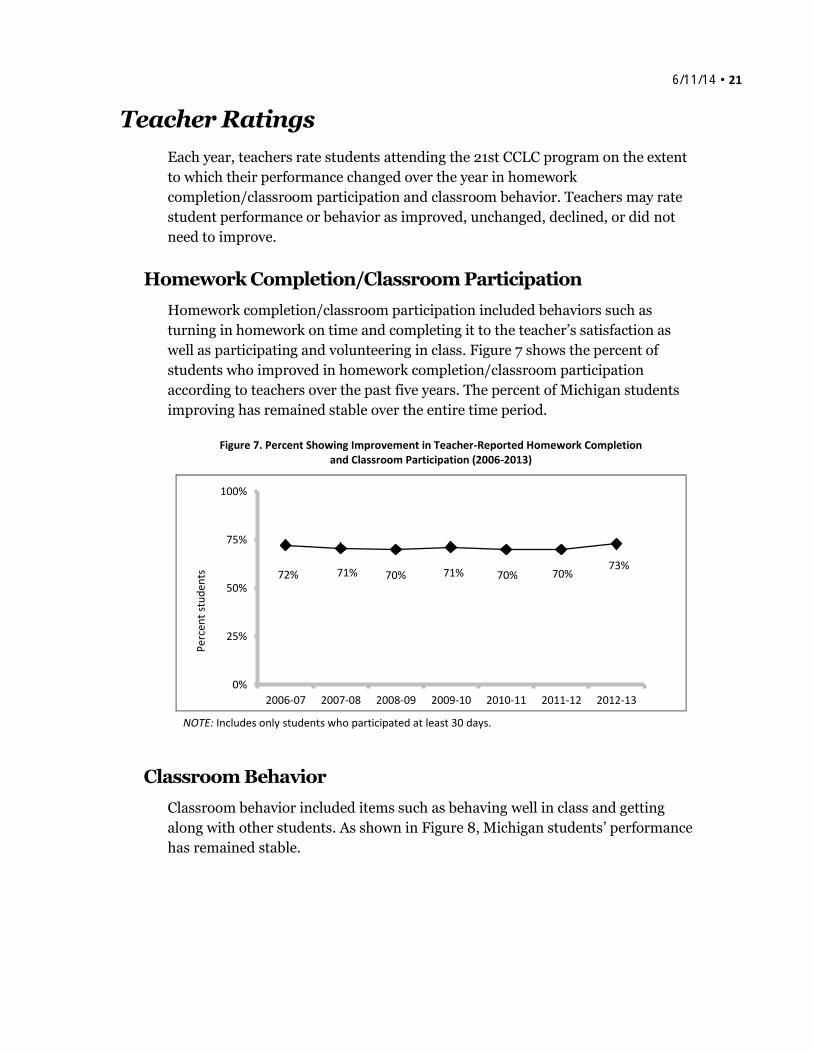
Homework Completion/Classroom Participation
Homework completion/classroom participation included behaviors such as
turning in homework on time and completing it to the teacher’s satisfaction as
well as participating and volunteering in class. Figure 7 shows the percent of
students who improved in homework completion/classroom participation
according to teachers over the past five years. The percent of Michigan students
improving has remained stable over the entire time period.
Figure 7. Percent Showing Improvement in Teacher-Reported Homework Completion and Classroom Participation (2006-2013)
NOTE: Includes only students who participated at least 30 days.
Classroom Behavior
Classroom behavior included items such as behaving well in class and getting
along with other students. As shown in Figure 8, Michigan students’ performance
has remained stable.
72% 71% 70% 71% 70% 70% 73%
0%
25%
50%
75%
100%
2006-07 2007-08 2008-09 2009-10 2010-11 2011-12 2012-13
Per
cen
t st
ud
ents

6/11/14 • 22
Figure 8. Percent Showing Improvement in Teacher-Reported Classroom Behavior (2006-2013)
NOTE: Includes only students who participated at least 30 days.
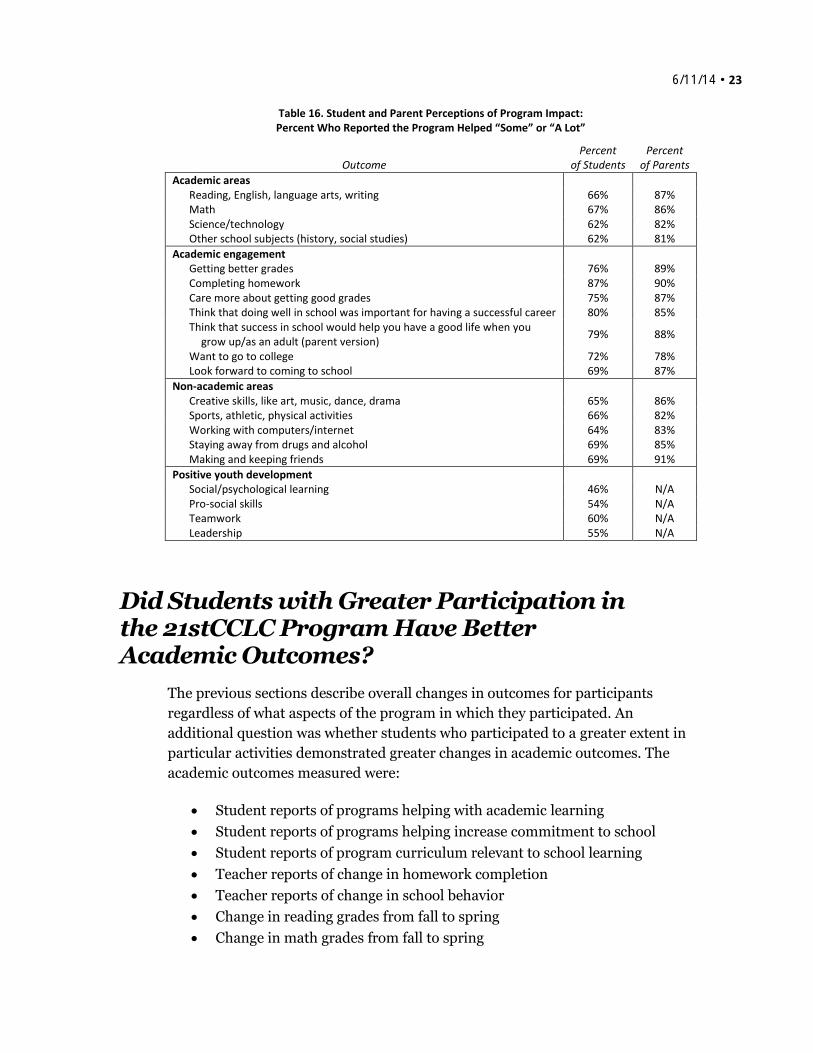
Student and Parent Perceptions of Program Impact
Students and parents reported on their perceptions of whether the 21st CCLC
program helped them/their children improve in various aspects of their academic
and non-academic performance and behavior. Note that Table 16 includes only
results from those students with room for academic improvement. About two-
thirds of students said the program helped them improve in academic areas,
especially in reading and math. Large majorities said the program helped engage
them in academics, and somewhat fewer, but still a majority, said the program
was helpful with other types of skills, such as creativity, physical fitness,
technology, or resistance skills. However, note that these results do not take into
account whether students actually participated in activities designed to improve
the specific outcomes listed.
Parent perceptions of their student’s improvement were generally higher than the
student’s perception of her/his improvement in most categories.
74% 72% 71% 72% 71% 72% 74%
0%
25%
50%
75%
100%
2006-07 2007-08 2008-09 2009-10 2010-11 2011-12 2012-13
Per
cen
t st
ud
ents
6/11/14 • 23
Table 16. Student and Parent Perceptions of Program Impact: Percent Who Reported the Program Helped “Some” or “A Lot”
Outcome Percent
of Students Percent
of Parents
Academic areas Reading, English, language arts, writing 66% 87% Math 67% 86% Science/technology 62% 82% Other school subjects (history, social studies) 62% 81%
Academic engagement Getting better grades 76% 89% Completing homework 87% 90% Care more about getting good grades 75% 87% Think that doing well in school was important for having a successful career 80% 85% Think that success in school would help you have a good life when you
grow up/as an adult (parent version) 79% 88%
Want to go to college 72% 78% Look forward to coming to school 69% 87%
Non-academic areas Creative skills, like art, music, dance, drama 65% 86% Sports, athletic, physical activities 66% 82% Working with computers/internet 64% 83% Staying away from drugs and alcohol 69% 85% Making and keeping friends 69% 91%
Positive youth development Social/psychological learning 46% N/A Pro-social skills 54% N/A Teamwork 60% N/A Leadership 55% N/A
Did Students with Greater Participation in the 21stCCLC Program Have Better Academic Outcomes?
The previous sections describe overall changes in outcomes for participants
regardless of what aspects of the program in which they participated. An
additional question was whether students who participated to a greater extent in
particular activities demonstrated greater changes in academic outcomes. The
academic outcomes measured were:
Student reports of programs helping with academic learning
Student reports of programs helping increase commitment to school
Student reports of program curriculum relevant to school learning
Teacher reports of change in homework completion
Teacher reports of change in school behavior
Change in reading grades from fall to spring
Change in math grades from fall to spring

6/11/14 • 24
Analytical Approach
To address this question, we used a series of multilevel models that test whether
change occurs while taking into account differences among sites. This is done
because outcomes may be similar for students within different programs if they
have somewhat similar experiences. Factors that vary among sites include the
number of days of operation, whether the program was operated by schools or
other entities, such as community-based (CBOs) or faith-based organizations,
years of experience in operating 21st CCLC programs, and the characteristics of
the students who attend. For these analyses we included regularly offered
activities (not special events or field trips) during the 2012-13 regular school year
(spring and fall semesters; not summer). Attendance was also calculated by days
of participation in certain types of activities. The analyses included the following
steps.
The first step was to identify the contribution of the differences among
sites to differences in student outcomes. For the academic outcomes measured
here, results indicated that about 8% to 17% of the differences among student
outcomes were associated with site-level characteristics.
The second step was to get a baseline understanding of how students from
different demographic groups, or grade levels or sites with different
characteristics, could have shown different average scores on
academic performance regardless of the activities they participated/offered.
This step was important in order to separate academic changes linked to greater
participation in certain activities from effects that might be due to, for example,
some sites having more years of programming experience or some grade levels
generally having greater academic improvement. The analyses took into account
a number of differences among sites: number of years of experience in operating
21st CCLC programs, total programming days in the year, type of organization
operating the program (school or community-based organization), total number
of students attending, and the grade levels served. Analyses also took into
account different demographic characteristics among individual students: grade
level, gender, race/ethnicity, and whether the student was academically low-
performing, receiving free/reduced price lunch, identified as Limited English
Proficiency or English as a Second Language (LEP/ESL) or special education.
Also, because students’ perceptions of the extent to which program helped them
with academic learning is presumably highly dependent on their overall program
experience, a program satisfaction score was calculated for each student and
statistically controlled in student-survey related analysis. Thus, whether or not
students felt programs were helpful with their academic learning was not
dependent on their overall program satisfaction.

6/11/14 • 25
During the third step, we examined the effects of total days of participation
as well as total days of participation in specific types of activities. Each
activity was entered into EZreports by site staff with a description and objectives.
MSU evaluation team staff then reviewed each activity and coded them into the
following categories:
Academic activity: Academic-focused activities, including:
− Traditional academics: Homework help, tutoring, lessons, exam
preparations, credit recovery
− Academic enrichment: Project-based learning or embedded
learning (e.g., math instruction embedded within cooking)
Physical activity: Sports, dance and physical recreation
Free play and social events: Non-physical games (e.g., checkers or card
games) and social events
Arts: Music, painting, and crafts
Youth development: Character development and leadership
Health: Nutrition, food, wellness and substance use prevention
Technology: Computer programs (Excel, PowerPoint, programming),
engineering, media and video production
Study Sample
The sample for the analyses was drawn from 26,032 K-12 students enrolled in
Michigan 21st CCLC programs during the 2012-13 regular school year. The
sample was evenly distributed between males and females. The majority of
students were racial/ethnic minorities (61%), academically low performing
(81%), and received free/reduced price lunch (82%). A small proportion of them
were identified as LEP/ESL (9%) or special education (10%). Among all the 292
sites, the majority of fiduciary agents was school-based (70%) grantees, but
programs were operated by non-school-based agencies (60%) such as CBOs or
parks and recreation departments. On average, sites served 36 students in a day,
operated about 134 days during the regular school year (not including summer),
and had almost 5 years of experience operating 21st CCLC programs. About 40%
of the sites were elementary school sites, with about 20% of the sites serving
either middle schools, high schools, or middle and high school levels combined.
The data included 7,846 student surveys from 272 sites, 9,705 teacher surveys
from 285 sites reporting on students who attended at least 30 days, and 18,508
sets of reading and math grades from 265 sites for students who attended the
program at least once during the school year. The statistical program employed in
this analysis, HLM 6.02, eliminates cases that do not have complete data across
variables in the equation. Although most student have complete demographic
information such as gender, grade level, race/ethnicity as entered in EZReports,

6/11/14 • 26
including additional student information such as their participation in
free/reduced price lunch, LEP/ESL and special education resulted in about 15%
reduction of sample size. We decided to include these characteristics in the
analyses because we think they are important indicators of student backgrounds
(lower income status, LEP/ESL learners and special education needs). Also,
sample sizes were further dropped by an additional 18% when testing the effects
of participation in major activities (academic, youth development, physical
activity, free play and social events and arts), as some of the sites didn’t offer all
these five types of activities and therefore the dosage was missing. Also given the
limited availability in program offerings, two less frequently offered activities
were tested respectively with a subset of the sample: health and nutrition (about
44% of complete sample) and technology (about 26% of complete sample). A
detailed display of the sample sizes of students and sites included in the analyses
by each outcome can be found in Table 17 below.
Table 17. Sample Sizes by Academic Outcomes
STUDENT REPORTS TEACHER REPORTS GRADES
Curriculum Connection
Help with Academic Learning
School Commitment
Homework Completion
School Behavior Reading Math
Sample Size (N) Youth Sites Youth Sites Youth Sites Youth Sites Youth Sites Youth Sites Youth Sites
Complete sample 7,747 272 6082 272 5,272 272 9,705 285 9,399 285 18,508 265 18,190 264
Sample A* 6,835 262 5,361 262 4,649 262 7,774 274 7,464 274 16,558 255 16,259 254
Sample B** Academics Youth development Physical activity Free play and
social events Arts
5,012 181 3,881 181 3,351 181 5,521 188 5,260 188 12,254 179 11,996 179
Sample C*** Health and
nutrition 3,579 123 2,772 123 2,364 123 3,677 128 3,516 128 8,802 127 8,606 127
Sample D*** Technology
2,538 91 1,974 91 1,673 91 2,832 98 2,708 98 2,349 87 2,293 96
*A = Sample with complete demographic information **B = Sample A + major activity dosages ***C and D = Sample B + less frequent dosage listed in the column
Results
What Characteristics of Sites and Students Are Associated with
Differences in Students’ Academic Outcomes?
Table 18 shows which site and student characteristics were significantly related to
different academic outcomes. Asterisks indicate those site and student
characteristics that are significantly related to the outcomes. We found significant

6/11/14 • 27
differences, although the effect sizes (the size of the differences) were small. In
analyzing the relation between participation in program activities and academic
outcomes, we controlled for these differences.
Table 18. Academic Outcomes Varied by Site and Student Characteristics
STUDENT REPORTS TEACHER REPORTS GRADES
Effect Size (r) Curriculum Connection
Help with Academic Learning
School Commitment
Homework Completion
School Behaviors Reading Math
Site characteristics
Years of operation 0.02 0.09 0.02 0.08 0.10 0.07 0.03 Operated by public
school 0.11 0.03 0.07 0.01 0.01 -0.14* -0.11
Size 0.01 0.06 0.11 0.05 0.05 0.17** 0.18** % of regular
attendees 0.12* 0.18** 0.10 0.07 0.04 0.21*** 0.17***
Elementary sites 0.06 0.05 0.17** -0.03 -0.02 0.31*** 0.19**
Student characteristics
Male 0.02 0.02 -0.01 -0.05*** -0.05*** -0.01 0.00 Grade -0.03* -0.01 -0.01 0.00 0.01 -0.04*** -0.04*** Racial minority -0.01 0.02 0.04** -0.02 -0.01 -0.02* -0.02* Academically low
performing 0.03** 0.01 0.02 -0.02 -0.03* 0.09*** 0.08***
Lunch 0.02 0.02 0.02 0.00 0.01 -0.03*** -0.02** LEP 0.03* 0.04** 0.04** 0.03** 0.04** 0.01 0.01 SpEd 0.04** 0.02 0.01 0.00 0.00 0.00 0.01
Total days 0.01 0.03* 0.02 0.07*** 0.06*** 0.03*** 0.04***
Cut-off days for effect
-- 50 days -- N/A N/A 10 days 20 days
NOTE: Effect size r interpretation: .10 - .29 = small effect; .30 - .49 = medium effect; ≥ .50 = large effect. Effect sizes cannot be negative; sign (-) shows direction of relationship for interpretation purposes. *p < .05, **p < .01, ***p < .001.
Site characteristics:
Site management. Programs operated by non-school based
organizations showed greater average improvement in reading grade than
school-based programs.
Size. Larger programs (programs serving more students in a day) showed
greater average improvement in reading and math grades than programs
serving fewer students in a day.
Regular attendance. Compared to programs constantly serving new
faces, programs keeping more regular attendees (defined by having 30
days or more attendance) showed greater average improvement in
reading and math grades, and had more students reporting that programs

6/11/14 • 28
helped them with academic learning and the curriculum matched or
improved school learning.
Grade level. Elementary school sites had more students reporting that
programs helped increase their school commitment, and showed greater
average improvement scores in reading and math grades than middle and
high school sites.
Student characteristics:
Gender. Girls tended to receive higher ratings by teachers than boys on
their improvement in homework completion and school behaviors.
Age. Younger students tended to report the program curriculum matched
or improved their school learning more than older students; younger
students also had higher average improvement scores in reading and
math grades than older peers.
Race/ethnicity. Racial/ethnic minority students were more likely to
report programs helped develop their school commitment than White
students.
Low-performing students. Academically low-performing students
showed greater improvement scores in reading and math grades, and
were more likely to report that program curriculum matched or improved
their school learning. However, teacher ratings on the improvement of
their school behaviors tended to be lower than for non-at-risk students.
Income. Students with low incomes (students who received free/reduced
lunch) showed smaller improvement in reading and math grades than
students from higher income families.
English language learners. Students who received LEP/ESL
education showed greater gains in all self-reported aspects of programs
helping them with academics (curriculum connection, academic learning
and school commitment); their teacher ratings on improvement in
homework completion and school behaviors were also higher than for
native students.
Special education. Students with special education needs were more
likely to report that the program curriculum matched or improved their
school learning than regular students.

6/11/14 • 29
Did More Days of Attendance Overall Relate to Better Academic
Outcomes?
Yes. Results (Table 19) suggest that:
Students who participated for more days had greater improvement in
reading and math grades, teacher ratings on homework completion, and
school behavior.
They were also more likely to report that programs helped them with
academic learning than students who participated fewer days.
Table 19. Total days of Participation Related to Several Academic Outcomes in 21st CCLC Programs
STUDENT REPORTS TEACHER REPORTS GRADES
Curriculum Connection
Help with Academic Learning
School Commitment
Homework Completion
School Behaviors Reading Math
Total days of participation
Additionally, we found that:
The effects are small but significant, and hold true even after accounting
for site and student characteristics (See Table 18 for effect sizes).
There is a threshold effect for some outcomes, that is, students meeting
certain days of attendance showed better outcomes than those who didn’t:
− For student reports of the program helping with academic
learning, students with more than 50 days of attendance showed
statistically higher ratings than students who attended fewer than
50 days.
− The same pattern could be found in students’ improvement in
reading grades (10 days) and math grades (20 days), in which
students with attendance lower than the threshold had lower
average scores than students with attendance above the threshold.
− Because teacher ratings were only conducted on students
participating more than 30 days, we could not identify a specific
threshold below 30 days; however, the data suggested that the
more days students attended, the better the teacher ratings were
without any specific threshold.
These results are promising but should be interpreted cautiously. It is possible
that students who participated for more days had other factors such as stability or

6/11/14 • 30
investment in the program that contributed both to attending more days and to
improving academically. Furthermore, the purpose of examining differences
across site and student characteristics was to provide a baseline understanding of
how academic outcomes may have differed, regardless of students’ participation
in different activities.
In the next step in the analysis, we further explored whether participation in
specific types of activities made a difference in outcomes.
Did Participation in Specific Types of Activities Relate to Increases
in Academic Outcomes?
In this section, we determined how the total number of days participating in
different types activities was related to the different academic outcomes.
Programs offered activities that fell into the following categories:
Academic activity: Academic-focused activities, including:
− Traditional academics: Homework help, tutoring, lessons, exam
preparations, credit recovery
− Academic enrichment: Project-based learning or embedded
learning (e.g., math instruction embedded within cooking)
Physical activity: Sports, dance and physical recreation
Free play and social events: Non-physical games (e.g., checkers or
card games) and social events
Arts: Music, painting, and crafts
Youth development: Character development and leadership
Health: Nutrition, food, wellness and substance use prevention
Technology: Computer programs (Excel, PowerPoint, programming),
engineering, media and video production
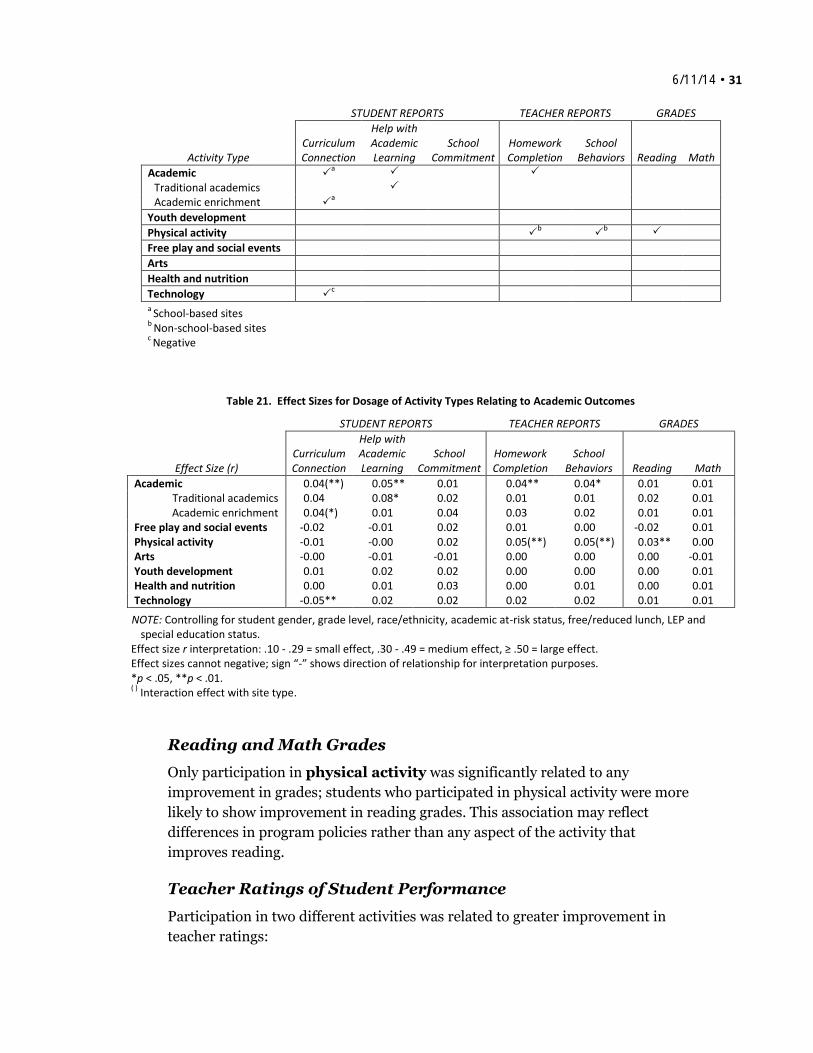
Table 20 summarizes the results of these analyses; Table 21 shows the specific
effect sizes for significant relations. Effects were small but significant in all cases.
Table 20. Participation in Specific Types of 21st CCLC Activities Related to Selected Academic Outcomes
6/11/14 • 31
STUDENT REPORTS TEACHER REPORTS GRADES
Activity Type Curriculum Connection
Help with Academic Learning
School Commitment
Homework Completion
School Behaviors Reading Math
Academic a
Traditional academics Academic enrichment
a
Youth development
Physical activity b
b
Free play and social events
Arts
Health and nutrition
Technology c
a
School-based sites
b Non-school-based sites
c Negative
Table 21. Effect Sizes for Dosage of Activity Types Relating to Academic Outcomes
STUDENT REPORTS TEACHER REPORTS GRADES
Effect Size (r) Curriculum Connection
Help with Academic Learning
School Commitment
Homework Completion
School Behaviors Reading Math
Academic 0.04(**) 0.05** 0.01 0.04** 0.04* 0.01 0.01 Traditional academics 0.04 0.08* 0.02 0.01 0.01 0.02 0.01 Academic enrichment 0.04(*) 0.01 0.04 0.03 0.02 0.01 0.01
Free play and social events -0.02 -0.01 0.02 0.01 0.00 -0.02 0.01 Physical activity -0.01 -0.00 0.02 0.05(**) 0.05(**) 0.03** 0.00 Arts -0.00 -0.01 -0.01 0.00 0.00 0.00 -0.01 Youth development 0.01 0.02 0.02 0.00 0.00 0.00 0.01 Health and nutrition 0.00 0.01 0.03 0.00 0.01 0.00 0.01 Technology -0.05** 0.02 0.02 0.02 0.02 0.01 0.01
NOTE: Controlling for student gender, grade level, race/ethnicity, academic at-risk status, free/reduced lunch, LEP and special education status.
Effect size r interpretation: .10 - .29 = small effect, .30 - .49 = medium effect, ≥ .50 = large effect. Effect sizes cannot negative; sign “-” shows direction of relationship for interpretation purposes. *p < .05, **p < .01. ( )
Interaction effect with site type.
Reading and Math Grades
Only participation in physical activity was significantly related to any
improvement in grades; students who participated in physical activity were more
likely to show improvement in reading grades. This association may reflect
differences in program policies rather than any aspect of the activity that
improves reading.
Teacher Ratings of Student Performance
Participation in two different activities was related to greater improvement in
teacher ratings:

6/11/14 • 32
Students with greater participation in academics were more likely to be
rated as having improved in homework completion.
Students at non-school based sites who participated in physical
activity were more likely to be rated as having improved in both
homework completion and school behavior; this did not hold true for
students at school-based sites.
These differences in the association between participating in physical activity and
teacher ratings may reflect different programming strategies for these two types
of sites, such as requiring that homework be completed before sports
participation, or different instructional approaches, such as connecting sports
participation with behavioral improvement plans.
Help with Academic Learning
Students who had greater participation in any academic activities or
traditional academic activities were more likely to report that the program
helped them with academic learning.
Connection to School Curriculum
Students who participated in two different types of activities were more likely to
report that the program was connected to the school-day curriculum.
Students at school-based sites who participated in any academics or
academic enrichment were more likely to report that the program was
connected to the school-day curriculum.
Students who participated more in technology activities reported a lower
connection between program activities and the school-day curriculum.
It makes sense that more students in school-based sites than nonschool-based
sites who participated in academics reported a connection to school-day
curriculum, as many programs use school-day teachers to lead academic
activities.
As to technology, only about one quarter of 21st CCLC students participated in
these types of activities, since they are offered less frequently than many other
types of activities. Students who participated in a lot of technology activities
indicated that this was not something that they did at schools and was not related
to homework or helping them get better grades. The finding is interesting in the
sense that this negative association suggests that out-of-school programs are
offering unique opportunities by exposing students to more technology-related
learning less available at schools.

6/11/14 • 33
Other Types of Activities and Academic Outcomes
Most Michigan 21st CCLC program sites also offer activities in youth
development, arts, and free play/social events; about half offer activities in health
and nutrition. Participation in any of these activities was not related to greater
improvements in academic outcomes. However, outcomes in this report are
specifically academic in nature; there are other important developmental
outcomes, such as better health and socio-emotional development. Thus, these
activities are important to a well-rounded program in positive youth development
and may also help sustain participation by engaging youth’s interest.
Figure 9. The Effect of Academic Dosage on Curriculum Connection Varied by Site Types
1
1.5
2
2.5
3
3.5
4
Low Academic Dosage High Academic Dosage
Cu
rric
ulu
m C
on
nec
tion
Non-School-based
School-based

6/11/14 • 34
Figure 10. The Effect of Academic Enrichment Dosage on Curriculum Connection Varied by Site Types
Figure 11. The Effect of Physical Activity Dosage on Teacher Ratings Varied by Site Types
1
1.5
2
2.5
3
3.5
4
Low Academic
ENRICHMENT Dosage
High Academic
ENRICHMENT Dosage
Cu
rric
ulu
m C
on
nec
tion
Non-School-based
School-based
1
2
3
4
5
6
7
Low Physical Dosage High Physical Dosage
Tea
cher
Rati
ngs:
Beh
avio
rs &
Hom
ework
Com
ple
tion
Non-School-based
School-based