Embed Size (px)
Citation preview

Michelle Dynes, PhD, MPH, MSN, CNM, RN
EIS Officer, Emergency Response and Recovery Branch
Prepared for IAWG Meeting 2015
Jordan, February 2015
Evaluation of Handheld Solar Lights among Internally Displaced
Populations in Two Camps in Haiti — August 2013-April 2014
Center for Global Health
Emergency Response and Recovery Branch

LESSONS LEARNEDBACKGROUND
December 2011, USNAP Women, Peace and Security
Focus on Gender Based Violence (GBV) in humanitarian settings
Collaboration between the United States government (USG) and IRC
Build the evidence needed to validate use of handheld solar lights
US National Action Plan (USNAP)

Evaluation Goal
To document the use and benefits of handheld solar lights among females ≥14 years and older living in Toto and
Sinai Camps, Port-au-Prince, Haiti

Evaluation Objectives

Evaluation Objectives
To assess the physical environments of camps Sinai & Toto.

Evaluation Objectives
To assess the physical environments of camps Sinai & Toto.
To document the utility of handheld solar lights.

Evaluation Objectives
To assess the physical environments of camps Sinai & Toto.
To document the utility of handheld solar lights.
To determine the durability and retention of the handheld solar light.

Evaluation Objectives
To assess the physical environments of camps Sinai & Toto.
To document the utility of handheld solar lights.
To determine the durability and retention of the handheld solar light.
To measure sense of safety.

LESSONS LEARNEDMETHODS

Evaluation Design - Methods
Direct observation to assess environmental conditions

Evaluation Design - Methods
Direct observation to assess environmental conditions
Focus group discussions (FGD) to assess perceptions, attitudes, risks
Participatory Mapping

Evaluation Design - Methods
Direct observation to assess environmental conditions
Focus group discussions (FGD) to assess perceptions, attitudes, risks
Monitoring surveys to assess use, retention and durability
Participatory Mapping

Evaluation Design - Methods
Direct observation to assess environmental conditions
Focus group discussions (FGD) to assess perceptions, attitudes, risks
Monitoring surveys to assess use, retention and durability
Household surveys to assess use, durability, activities, and safety Participatory
Mapping

Sample Size
FGDHousehold
Surveys

Sample Size
FGDHousehold
Surveys
Purposive sampling of 14-19 and 25-45
Sample Sizes Baseline: N=8
(n=80) Endline: N=8
(n=82)

Sample Size
2013 IOM Camp Registration Database
Sampling parameters 20% non-response rate 95% CI and a precision of 0.05 10% change in safety
Purposive sampling of 14-19 and 25-45
Sample Sizes Baseline: N=8
(n=80) Endline: N=8
(n=82)
FGDHousehold
Surveys

Final Sample Sizes and Percent Completed
Attempted
Final Sample Size
% Completed
Baseline 895 754 84.3 MV1 801 650 81.2 MV2 754 579 76.8 MV3 721 572 79.3 Endline 720 634 88.1

Final Sample Sizes and Percent Completed
Attempted
Final Sample Size
% Completed
Baseline 895 754 84.3 MV1 801 650 81.2 MV2 754 579 76.8 MV3 721 572 79.3 Endline 720 634 88.1
** 29% loss to follow-up from initiation of the baseline survey to completion of the endline survey

Analysis
Direct observations - description analysis
FGD - Content analysis and coding of themes
Household Surveys Descriptive statistics using SAS 9.3 Chi-square/t-tests for differences between camps & age
groups GEE models to test baseline/endline differences A Life-Table survival analysis to estimate light retention

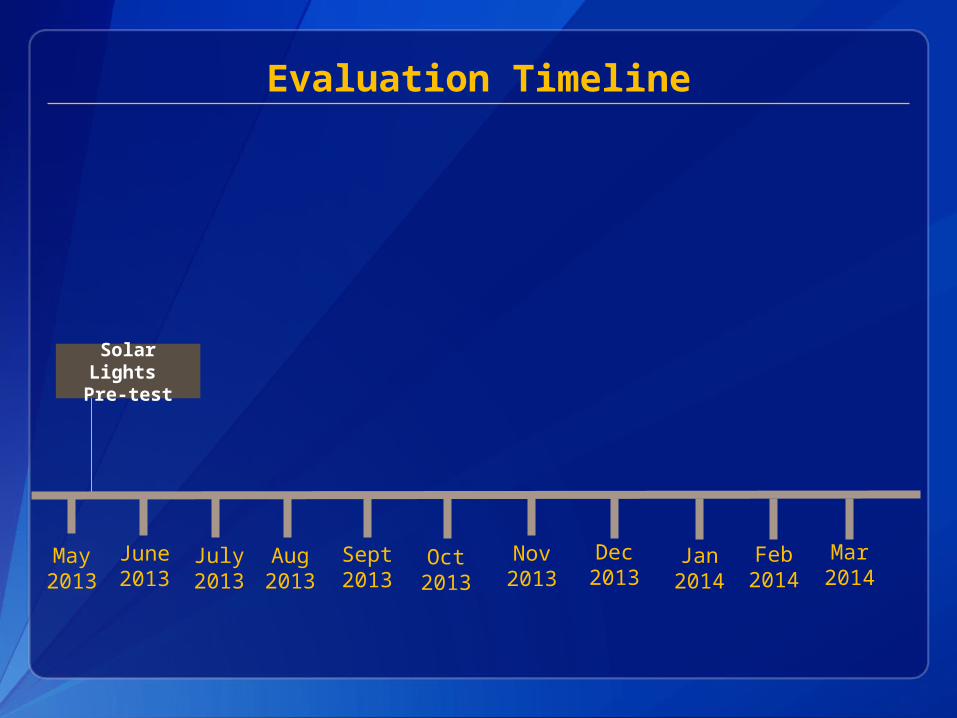
Evaluation Timeline
Aug2013
Sept2013
Oct2013
Nov2013
Dec2013
Jan2014
Feb2014
Mar2014
July2013
June2013
May2013
Evaluation Timeline
Aug2013
Sept2013
Oct2013
Nov2013
Dec2013
Jan2014
Feb2014
July2013
June2013
May2013
Solar Lights
Pre-test
Mar2014

Evaluation Timeline
Aug2013
Sept2013
Oct2013
Nov2013
Dec2013
Jan2014
Feb2014
July2013
June2013
May2013
Solar Lights
Pre-test
Baseline FGD
Baseline Survey
DirectObservati
on
Mar2014

Evaluation Timeline
Aug2013
Sept2013
Oct2013
Nov2013
Dec2013
Jan2014
Feb2014
July2013
June2013
May2013
Solar Lights
Pre-test
Baseline FGD
Baseline Survey
DirectObservati
on
Solar Lights
Distribution
Mar2014

Evaluation Timeline
Aug2013
Sept2013
Oct2013
Nov2013
Dec2013
Jan2014
Feb2014
July2013
June2013
May2013
Solar Lights
Pre-test
Baseline FGD
Baseline Survey
DirectObservati
on
Solar Lights
Distribution
Monitoring Visit 1
Monitoring Visit 2
Monitoring Visit 3
Mar2014

Evaluation Timeline
Aug2013
Sept2013
Oct2013
Nov2013
Dec2013
Jan2014
Feb2014
July2013
June2013
May2013
Solar Lights
Pre-test
Baseline FGD
Baseline Survey
DirectObservati
on
Solar Lights
Distribution
Monitoring Visit 1
Monitoring Visit 2
Monitoring Visit 3
DirectObservati
on
Endline
Survey
Endline FGD
Mar2014

LESSONS LEARNEDFINDINGS

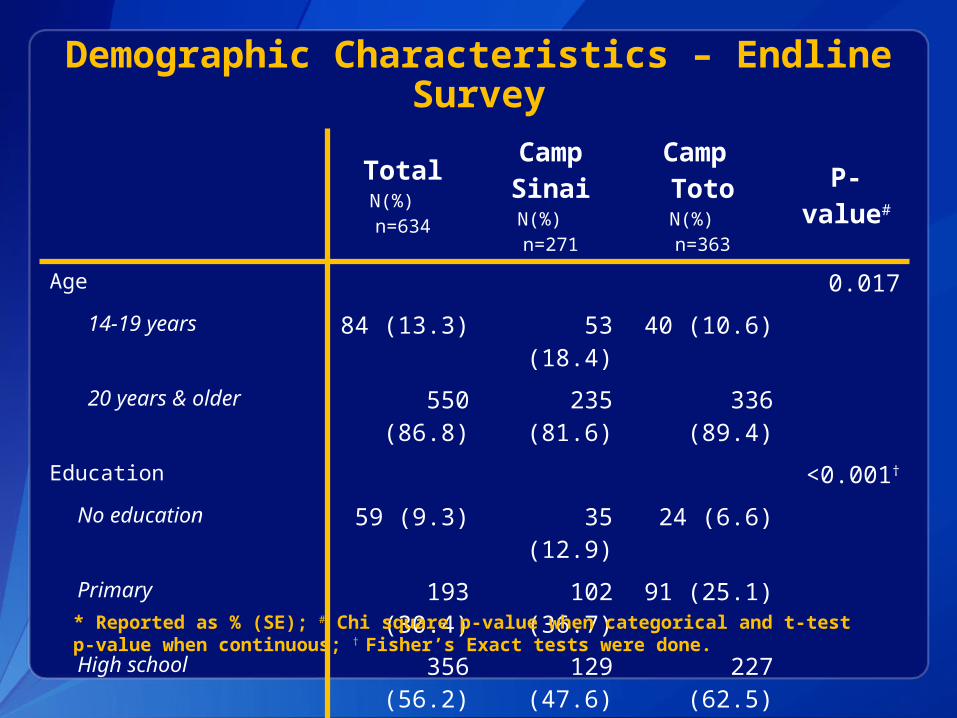
Demographic Characteristics – Endline Survey
Demographic Characteristics – Endline Survey
TotalN(%) n=634
Camp SinaiN(%) n=271
Camp TotoN(%) n=363
P-value#
Age 0.017
14-19 years 84 (13.3) 53 (18.4) 40 (10.6)
20 years & older 550 (86.8) 235 (81.6)
336 (89.4)
Education <0.001†
No education 59 (9.3) 35 (12.9) 24 (6.6)
Primary 193 (30.4) 102 (36.7)
91 (25.1)
High school 356 (56.2) 129 (47.6)
227 (62.5)
* Reported as % (SE); # Chi square p-value when categorical and t-test p-value when continuous; † Fisher’s Exact tests were done.

Nighttime Activities among Women:Baseline/Endline Comparison

Nighttime Activities among Women:Baseline/Endline Comparison
Camp Sinai (N=237)
Baseline (% yes)
Endline (% yes)
Odd Ratio (95% CI)
P-value
Personal 66.7 90.4 4.5 (2.1, 10.0)
<0.001
Religious 50.0 53.0 1.1 (0.6, 1.9) 0.839
Buy goods 27.9 71.1 5.3 (3.4, 8.5) <0.001
Social 24.2 25.3 1.0 (0.5, 2.1) 0.924
Work 16.7 9.64 0.6 (0.2, 1.4) 0.203
Camp Toto (N=316) Personal 68.2 77.4 1.6 (0.9, 2.9) 0.144
Religious 41.4 50.9 1.4 (0.8, 2.5) 0.195
Buy goods 28.5 70.8 5.5 (3.5, 8.6) <0.001
Social 36.8 27.4 0.7 (0.4, 1.3) 0.259
Work 20.5 20.8 1.0 (0.5, 2.0) 0.991

Objective 1: Physical
Environment
Environmental Characteristics - Observation

Environmental Characteristics - Observation
Camp Sinai
Camp Toto
Shelters Tents Wood Shelters

Environmental Characteristics - Observation
Camp Sinai
Camp Toto
Shelters Tents Wood Shelters
Lighting Electricity No
Large Solar Panels No
Lighting at public places No

Environmental Characteristics - Observation
Camp Sinai
Camp Toto
Shelters Tents Wood Shelters
Lighting Electricity No
Large Solar Panels No
Lighting at public places No
Presence of actors MINUSTAH No
PNH No
Camp Committee No

Objective 2: Utility of the lights
Frequency of Handheld Solar Light Use - Survey

Frequency of Handheld Solar Light Use - Survey
TotalN (%)
n=634
Camp SinaiN (%)
n=271
Camp TotoN (%)
n=363
Solar light use
At least once per day 606 (95.6)
255 (94.1) 351 (96.7)
No other working flashlights
536 (84.7)
236 (87.4) 300 (82.6)

Frequency of Handheld Solar Light Use - Survey
TotalN (%)
n=634
Camp SinaiN (%)
n=271
Camp TotoN (%)
n=363
Solar light use
At least once per day 606 (95.6)
255 (94.1) 351 (96.7)
No other working flashlights
536 (84.7)
236 (87.4) 300 (82.6)
96% of females reported at least daily use

Frequency of Handheld Solar Light Use - Survey
TotalN (%)
n=634
Camp SinaiN (%)
n=271
Camp TotoN (%)
n=363
Solar light use
At least once per day 606 (95.6)
255 (94.1) 351 (96.7)
No other working flashlights
536 (84.7)
236 (87.4) 300 (82.6)
85% of households had no other working flashlights

Use of Lighting Sources: Baseline/Endline Comparison

Use of Lighting Sources: Baseline/Endline Comparison
Camp Sinai (N=237)
Baseline (% yes)
Endline (% yes)
Odd Ratio (95% CI)
P-value
Inside Candle 88.0 31.1 0.1 (0.0, 0.1) <0.001
Inside Gas Lamp 18.0 7.7 0.4 (0.2, 0.7) <0.001
Outside Candle 23.9 13.6 0.5 (0.3, 0.8) 0.005
Outside Gas Lamp 6.0 4.7 0.8 (0.3, 1.7) 0.515
Camp Toto (N=316) Inside Candle 56.6 20.3 0.2 (0.1, 0.3) <0.001
Inside Gas Lamp 47.9 25.0 0.4 (0.3, 0.5) <0.001
Outside Candle 22.8 9.8 0.4 (0.2, 0.6) <0.001
Outside Gas Lamp 19.5 7.9 0.4 (0.2, 0.6) <0.001
Perceptions of Handheld Solar Lights - FGD
Durable, light-weight, easy to carry and held charge

Perceptions of Handheld Solar Lights - FGD
Durable, light-weight, easy to carry and held charge
Used most often by women and girls

Perceptions of Handheld Solar Lights - FGD
Durable, light-weight, easy to carry and held charge
Used most often by women and girls
Generally available when needed

Perceptions of Handheld Solar Lights - FGD
Durable, light-weight, easy to carry and held charge
Used most often by women and girls
Generally available when needed
Sense of improved protection

Perceptions of Handheld Solar Lights - FGD
Durable, light-weight, easy to carry and held charge
Used most often by women and girls
Generally available when needed
Sense of improved protection
Economic benefit

Perceptions of Handheld Solar Lights - FGD
Durable, light-weight, easy to carry and held charge
Used most often by women and girls
Generally available when needed
Sense of improved protection
Economic benefit
Some concerns
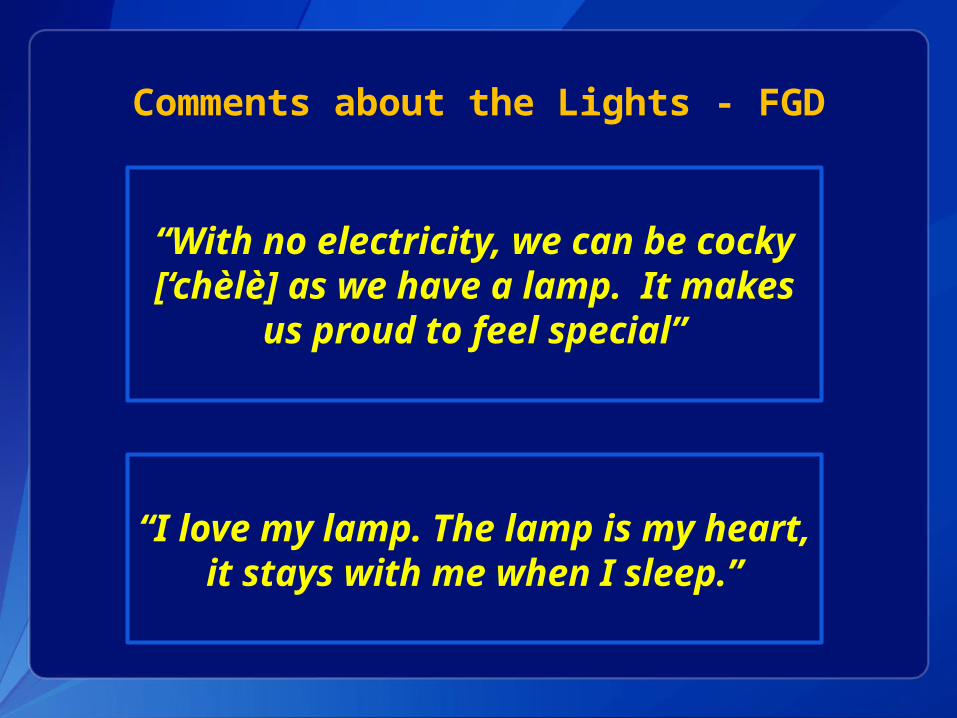
Comments about the Lights - FGD
“With no electricity, we can be cocky [‘chèlè] as we have a lamp. It makes us
proud to feel special”
“I love my lamp. The lamp is my heart, it stays with me when I sleep.”

Comments about the Lights - FGD
“I am scared to go to some places for fear that people will take the lamp.”
“I sleep with one eye open and one eye closed so that they won’t steal my solar
panel.”

Objective 3: Light Durability &
Retention
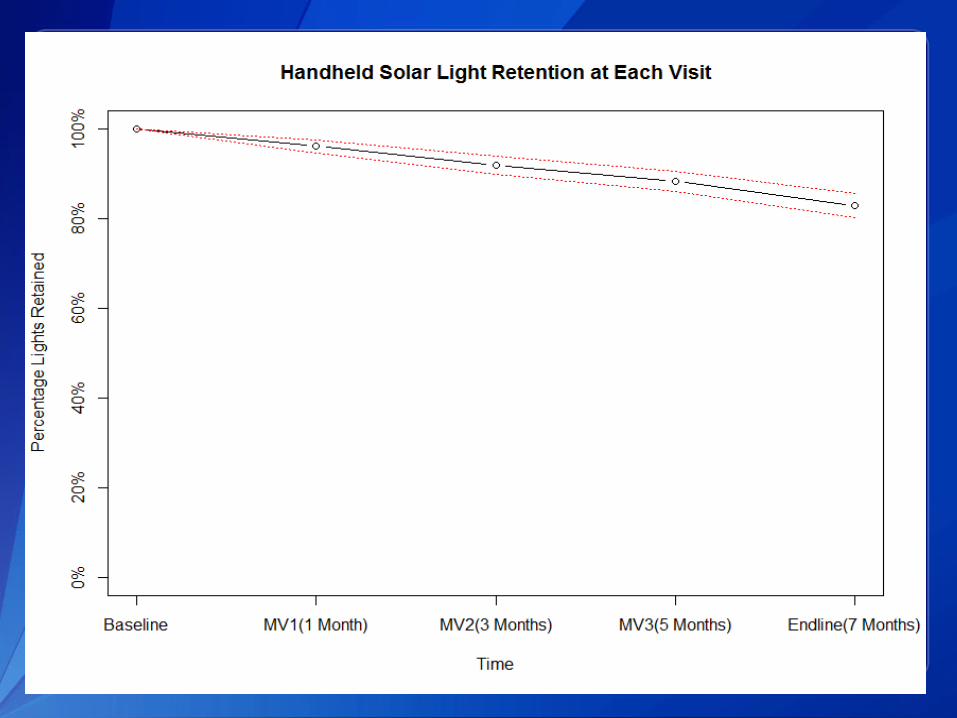

29 lost lights
28 lost to follow-up
96%
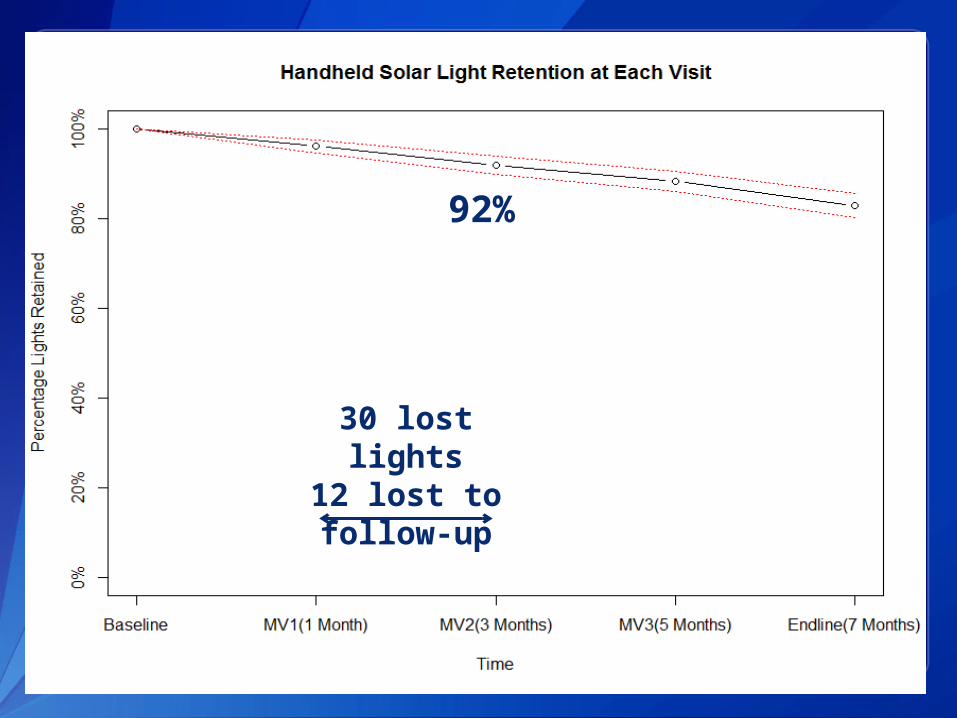
30 lost lights
12 lost to follow-up
92%
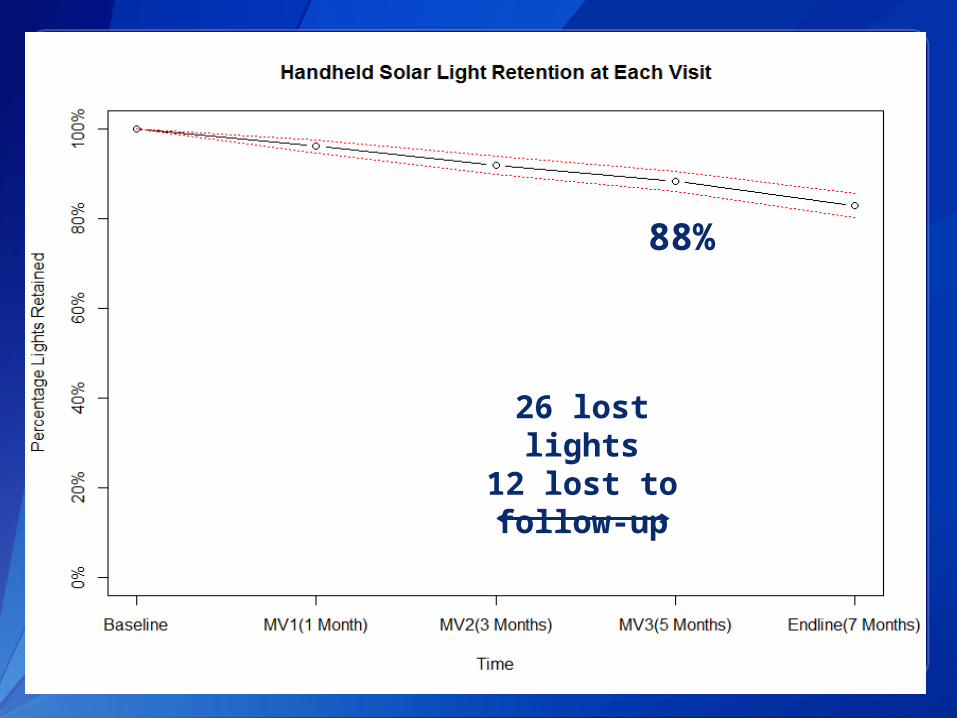
26 lost lights12 lost to follow-up
88%

36 lost lights
52 lost to follow-up
83%

533 lights retained
121 lights lost
Objective 4: Measuring safety

Camp Sinai Camp Toto0
20
40
60
80
100
BaselineEndline
(N=237)
(N=316)
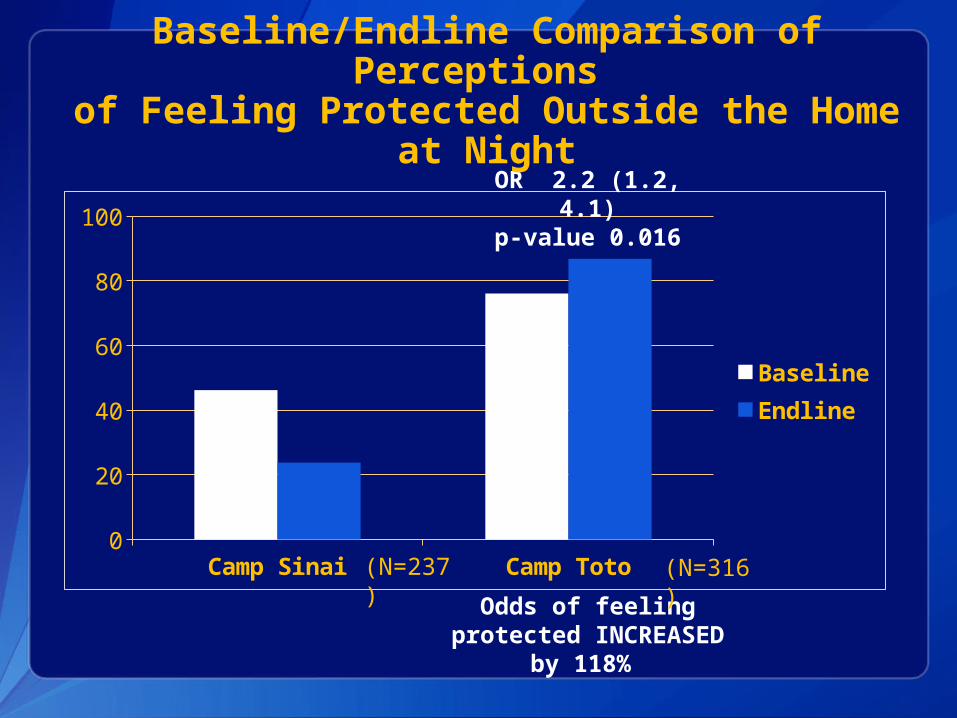
Baseline/Endline Comparison of Perceptions
of Feeling Protected Outside the Home at Night

Camp Sinai Camp Toto0
20
40
60
80
100
BaselineEndline
Odds of feeling protected
DECREASED by 63%
OR 0.4 (0.2, 0.6)p-value <0.001
(N=237)
(N=316)
Baseline/Endline Comparison of Perceptions
of Feeling Protected Outside the Home at Night
Camp Sinai Camp Toto0
20
40
60
80
100
BaselineEndline
Odds of feeling protected INCREASED
by 118%
OR 2.2 (1.2, 4.1)p-value 0.016
(N=237)
(N=316)
Baseline/Endline Comparison of Perceptions
of Feeling Protected Outside the Home at Night

Reasons for Feeling Unprotected Outside the Home at Night - Survey
TotalN (%)
n=97
Camp SinaiN (%)
n=76
Camp TotoN (%)
n=21
P-value
Thugs 57 (58.8) 47 (61.8) 10 (47.6) 0.244
Loud noise/cursing
37 (38.1) 32 (42.1) 5 (23.8) 0.129
Hearing gun shots
34 (35.1) 33 (43.4) 1 (4.8) 0.001
Physical violence 28 (28.9) 27 (35.5) 1 (4.8) 0.006
Rock/bottle throwing
22 (22.7) 19 (25.0) 3 (14.3) 0.387
Sexual violence 19 (19.6) 17 (22.4) 2 (9.5) 0.231

Reasons for Feeling Unprotected Outside the Home at Night - Survey
TotalN (%)
n=97
Camp SinaiN (%)
n=76
Camp TotoN (%)
n=21
P-value
Thugs 57 (58.8) 47 (61.8) 10 (47.6) 0.244
Loud noise/cursing
37 (38.1) 32 (42.1) 5 (23.8) 0.129
Hearing gun shots
34 (35.1) 33 (43.4) 1 (4.8) 0.001
Physical violence 28 (28.9) 27 (35.5) 1 (4.8) 0.006
Rock/bottle throwing
22 (22.7) 19 (25.0) 3 (14.3) 0.387
Sexual violence 19 (19.6) 17 (22.4) 2 (9.5) 0.231Thugs and loud noise most common reasons for feeling unprotected; 1 in 5 feared sexual violence

Reasons for Feeling Unprotected Outside the Home at Night - Survey
TotalN (%)
n=97
Camp SinaiN (%)
n=76
Camp TotoN (%)
n=21
P-value
Thugs 57 (58.8) 47 (61.8) 10 (47.6) 0.244
Loud noise/cursing
37 (38.1) 32 (42.1) 5 (23.8) 0.129
Hearing gun shots
34 (35.1) 33 (43.4) 1 (4.8) 0.001
Physical violence 28 (28.9) 27 (35.5) 1 (4.8) 0.006
Rock/bottle throwing
22 (22.7) 19 (25.0) 3 (14.3) 0.387
Sexual violence 19 (19.6) 17 (22.4) 2 (9.5) 0.231Women in Sinai were more likely to feel unprotected from hearing guns shots and physical violence

LESSONS LEARNELIMITATIONS

Limitations
No control group, so unable to draw causal conclusions about the impact of lights
Intervention did not take place in an acute emergency setting, so findings may be different in other contexts
Difficult to translate and measure complex concepts such as safety
Social desirability bias many have impacted responses

Recommendations
Improve the physical camp
environment in IDP camps in order to affect the security
and safety of women and girls.

Recommendations
Improve the physical camp
environment in IDP camps in order to affect the security
and safety of women and girls.
Closer monitoring of protection
issues to allow identification and
response to changes over time.

Recommendations
Improve the physical camp
environment in IDP camps in order to affect the security
and safety of women and girls.
Closer monitoring of protection
issues to allow identification and
response to changes over time.
Support distribution of handheld solar
lights for individual use to improve the quality of daily life.

Recommendations
Increase of security presence and community
patrols inside the IDP camps

Recommendations
Increase of security presence and community
patrols inside the IDP camps
Handheld solar lamps as one aspect of an
overall package offered to women
and girls in emergencies.

Recommendations
Increase of security presence and community
patrols inside the IDP camps
Handheld solar lamps as one aspect of an
overall package offered to women
and girls in emergencies.
Future studies should assess the
utility and durability of lights in other settings
and across emergency phases.

For more information please contact Centers for Disease Control and Prevention1600 Clifton Road NE, Atlanta, GA 30333Telephone, 1-800-CDC-INFO (232-4636)/TTY: 1-888-232-6348E-mail: [email protected] Web: www.cdc.gov
The findings and conclusions in this report are those of the authors and do not necessarily represent the official position of the Centers for Disease Control and Prevention.
Acknowledgements
Center for Global Health
Emergency Response and Recovery Branch
IRC staff-NYC and Haiti, IRC Contractors Anjuli Shivshanker Fedna Edourd Francesca Rivelli Jennifer Miquel Leora Ward Miriam Castanedo Nicole Klaesener-Metzner Reginald Bazile Virginia Zuco
FGD facilitators, survey enumerators, data entry clerks, and drivers
Women and families of Camp Toto & Sinai
CDC staff-Atlanta and Haiti Anna Gajewski Erica Kantor Barbara Marston Holly Williams Basia Tomczyk Jennifer Whitmill Brian Wheeler Mariana Rosenthal Colleen Hardy Roodly Archer Curtis Blanton Samira Sami
USAID OFDA staff-DC and Haiti Anjelica Fleischer Carolyne Siganda Courtney Blake Jonathon Anderson

Questions?