Embed Size (px)
Citation preview


Ethanol Storyline May 30, 2007 2
Michael Jackson TIAX LLC
May 30, 2007
Ethanol Implementation Storyline
I. Executive Summary a. Low Level Blends
0
500,000,000
1,000,000,000
1,500,000,000
2,000,000,000
2,500,000,000
2000 2010 2020 2030 2040 2050 2060
Etha
nol G
allo
ns
5.7% Ethanol10% Ethanol15% Ethanol
Figure 1-1: Low Level Blend Penetration Scenarios
Table 1-1 Low Level Ethanol Blends Performance Metrics
2012 2017 2022 Scenario—Blend % 5.7% 10% 15% 5.7% 10% 15% 5.7% 10% 15%
Gasoline Consumption (million gals)
16,046
16,281
16,554
15,589
15,816
16,081
15,285
15,508
15,768
Ethanol (million gals) 915
1,628
2,483 889
1,582
2,412 871
1,551
2,365 Gasoline Displaced (million gal.) 915
1,394
1,976
889
1,354
2,147
871
1,327
1,882
GHG Reduction (tons/day) MW Corn NG
11,434
15,896
11,107
15,442
10,891
15,141 Lo
w L
evel
B
lend
s
GHG Reduction (tons/day) Cellulosic CA Poplar
33,334
49,296
32,383
47,889
31,751
46,955

Ethanol Storyline May 30, 2007 3
E85 Blends
-
5,000,000,000
10,000,000,000
15,000,000,000
20,000,000,000
25,000,000,000
2000 2010 2020 2030 2040 2050 2060
Fuel
Con
sum
ed (g
allo
ns)
BAUBig 3 at 50%All OEMs at 100%RFG3
BAU Low FFV Population
Big 3 Produce 50% FFVs
All OEMs Produce 100% FFVs
RFG3 Demand
Figure 1-2. E85 Volume Estimates
-
10,000,000
20,000,000
30,000,000
40,000,000
50,000,000
60,000,000
2000 2005 2010 2015 2020 2025 2030 2035 2040 2045 2050 2055
Popu
latio
n Ve
hicl
es P
eopl
e
BAUBig 3 at 50%All OEM at 100%Vehicle PopulationPopulationPoly. (Population)Linear (Vehicle Population)
Population
Vehicles in Fleet
All OEMs Produced FFVs starting in 2012
Only Big 3 Produced50% FFVs starting in 2012
Figure 1-3. E85 People and Vehicle Population Estimates

Ethanol Storyline May 30, 2007 4
Table 1-2. E85 Performance Metrics
2012 2017 2022
RFG3 E85 RFG3 E85 RFG3 E85
Scenario* 5.70% BAU 50% 100% 5.70% BAU 50% 100% 5.70% BAU 50% 100% Number Vehicles gasoline/FFVs (million)
29
0.53
1.00
2.13
32
0.54
3.32
10.13
34
0.55
5.64
18.13
Gasoline-Ethanol Consumption (million gals)
16,046
33
153
328
15,589
26
805
4,922
15,285
27
1,369
8,808
Ethanol (million gals) 915
26
122
260 889
21
639
3,903 871
21
1,085
6,985
Gasoline Displaced (million gal.) 915
18
82.61
177
889
14
434
2,652
871
14
738
4,746
GHG Reduction (tons/day) MW Corn NG
129
600
1,285
103
3,153
19,270
104
5,359
34,486
GHG Reduction (tons/day) Cellulosic CA Poplar
480
2,236
4,787
385
11,742
71,768
389
19,960
128,439
E85
Fue
l
Vehicle Costs (Million $/year)
53.4
99.5
213.1
54.3
331.5
1,013.1
54.9
563.5
1,813.1

Ethanol Storyline May 30, 2007 5
b. Mid Level Blend 30% Ethanol and 70% Gasoline
0
2,000,000,000
4,000,000,000
6,000,000,000
8,000,000,000
10,000,000,000
12,000,000,000
14,000,000,000
16,000,000,000
18,000,000,000
20,000,000,000
2000 2010 2020 2030 2040 2050 2060
Fuel
Con
sum
ed (g
allo
ns)
BAU50% Big 3100% FFVRFG3
BAU Low FFV Population
Big 3 Produce 50% FFVs
All OEMs Produce 100% FFVs
RFG3 Demand
Figure 1-4. Mid Level E30 Blend Volume Estimates
0
10,000,000
20,000,000
30,000,000
40,000,000
50,000,000
60,000,000
2000 2010 2020 2030 2040 2050 2060
Popu
latio
n/N
umbe
r of V
ehic
les
BAUDomestic FFVs100% FFVsVehicle PopulationPopulationPoly. (Population)Linear (Vehicle Population)
All OEMs Produced FFVs starting in 2012
Only Big 3 Produced50% FFVs starting in 2012
Population
Vehicles in Fleet
Figure 1-5. Mid Level E30 People and Vehicle Population Estimates
(note same as Figure 1-3)

Ethanol Storyline May 30, 2007 6
Table 1-3. Mid Level E30 Performance Metrics
2012 2017 2022
RFG3 E30 RFG3 E30 RFG3 E30
Scenario* 5.70% BAU 50% 100% 5.70% BAU 50% 100% 5.70% BAU 50% 100% Number Vehicles gasoline/FFVs (million)
29
0.53
1.00
2.13
32
0.54
3.32
10.13
34
0.55
5.64
18.13
Gasoline-Ethanol Consumption (million gals)
16,046
66
124
265
15,589
53
1,300
3,974
15,285
54
2,210
7,112
Ethanol (million gals) 915
20
37
80 889
16
390
1,192 871
16
663
2,134
Gasoline Displaced (million gal.) 915
15
28
59
889
12
291
889
871
12
494
1,591
GHG Reduction (tons/day) MW Corn NG
121
226
484
97
2,372
7,250
98
4,032
12,974
GHG Reduction (tons/day) Cellulosic CA Poplar
389
725
1,553
312
7,620
23,286
315
12,952
41,673
Mid
Lev
el B
lend
s
Vehicle Costs (Million $/year)
53.4
99.5
213.1
54.3
331.5
1,013.1
54.9
563.5
1,813.1

Ethanol Storyline May 30, 2007 7
II. Present Technology and Deployment:
a. Include present technology status from 2006 Market Assessment Report b. There are three market segments for light duty vehicles
i. Low level blends 5.7% (current use), 10%, and 15% by vol ii. Mid level blend (>10% and < 85%; E30)
iii. Neat or E85 market c. One market segment for ethanol blended with diesel (E-Diesel)
III. Scenario 1: Low Level Blends: Business-As-Usual (5.7%), 10%, and 15%
a. Characteristics of current market
i. No changes required to vehicles. OEM manufacture vehicles which are compatible with up to 10% vol ethanol blends in gasoline
• Will need testing program to check 15% blend or higher ii. No changes needed in fueling infrastructure up to 15%
• Current fueling station equipment UL certified to 15% (ref. Dennis Smith, DOE at SAE Govt and Industry Meeting, May 15, 2007)
• Underground storage tank (UST) compatibility needs checking
iii. Currently blending about 1 billion gallons in gasoline; 10% will bring demand to 1.4 billion gallons (a sizeable percentage of current US supply of about 6 billion gallons)
iv. Ethanol can be priced at blend market values (wholesale CARBOB + $0.51/gal)
v. Causes some refinery modifications since RVP has to be adjusted to meet RFG3 standards. This requires removing pentanes in summer which can be used in other gasoline products or stored and used in the winter grade.
• Higher level blends should reduce RVP constraints somewhat
b. Permeation is currently a problem but being mitigated on the on road sector by changes in the predictive model and how to reformulate gasoline
i. ARB RFG3 will set limits on RVP, reduce sulfur content, and allow higher ethanol blends (up to 10 percent)
ii. It is expected that increase ethanol content will reduce HC and CO; and reduced sulfur will reduce NOx offsetting the increased HC emissions due to permeation
iii. May need additional testing to understand 10% or 15% permeation effects (CRC Rpt No E-65-3)
c. How will LCFS affect the blend market if at all i. Appears that credit will be given to blends greater than 5.7%
baseline

Ethanol Storyline May 30, 2007 8
d. GHG percent reduction small: 2.5% with corn based ethanol and 7.6% for cellulosic or sugar cane based ethanol. Although small in percentages the reductions are large since ethanol is blended into the entire California gasoline pool. Table 2-1 shows the level of reductions for both corn and cellulosic/sugar cane based ethanol
Table 3-1. CO2 equivalent Emission Reductions in tpd for low level blends
2012 2017 2022 Blend Level Corn
Based Cellulosic
Sugar Based
Corn Based
Cellulosic Sugar Based
Corn Based
Cellulosic Sugar Based
E10 (10%) 11,343 33,334 11,107 32,383 10,891 31,751E15 (15%) 15,896 49,296 5,442 47,889 15,141 46,955
e. Gasoline displacement some what less than ethanol added due to lower
energy content of higher ethanol blends. On energy basis fuel economy of the higher blends should be reduced by:
i. E10 effect is 1.015 or 1.5% ii. E15 effect is 1.032 or 3.2%
iii. Table 2-2 shows the gasoline displaced with these two blends (it is assumed that E5.7 blends have no affect on fuel economy so there is a 1:1 relationship between ethanol blended and gasoline displaced)
Table 3-2. Gasoline displaced for low level blends in million gasoline gallons
Blend Level 2012 2017 2022 2050
E10 (10%) 1,394 1,354 1,327 1,597E15 (15%) 1,976 2,147 1,882 2,263
iv. The amount displaced is relatively constant since the RFG demand is also relatively constant over the analysis period. This is a result of Pavley regulations being implemented starting in 2009.
v. Figure 2-1 shows the ethanol needed for these low level blends for the RFG case with Pavley regulations in placed. As shown the Pavley regulations substantially reduce the RFG demand.

Ethanol Storyline May 30, 2007 9
0
2,000,000,000
4,000,000,000
6,000,000,000
8,000,000,000
10,000,000,000
12,000,000,000
14,000,000,000
16,000,000,000
18,000,000,000
20,000,000,000
22,000,000,000
24,000,000,000
2000 2010 2020 2030 2040 2050 2060
Gas
olin
e G
allo
ns
Pavleyw/o Pavley5.7% vol Ethanol10% vol Ethanol 15% vol Ethanol
Figure 3-1. Total RFG consumption levels compared to ethanol required for
low level blends
f. Costs are mostly on the fuel suppliers/energy companies. With current pricing ethanol is cheaper than CARBOB and other blending components and therefore reasonably cost effective as a blend component to the refiners and fuel distributors. Figure 2-2 shows the most recent ethanol vs. CARBOB and alkylate component pricing on the west coast.
i. Low level blend scenario has no costs to automakers (unless higher levels require material changes)
ii. Consumers should benefit when ethanol pricing with $0.51 per gallon credit is less than CARBOB
iii. UST replacements may be required

Ethanol Storyline May 30, 2007 10
Figure 3-2. Blend component prices in California (source CEC-- http://www.energy.ca.gov/gasoline/graphs/component_prices.html)
g. Key Stakeholders
i. Oil companies—terminals where ethanol is blended ii. Ethanol producers—corn, cellulosic, imported sugar cane
• Limit of corn production for fuel iii. Auto’s
h. Incentives i. Current $0.51 per gallon blenders credit and 30% tax credits up to
$30,000 for ethanol plants • 2005 EPAct • Sunsets in 2008
ii. It is a high priority for the ethanol producers to get the current blenders credit and tax credits continued
• Producers also want the current tariff of $0.52 per gallon continued; especially those producers on the West Coast who have to deal with feedstock transportation costs and higher California labor costs and in general higher plant operating costs
iii. Renewable fuel standard was pivotal in developing ethanol demand which the industry has more than met. President’s announcement to move the RFS to 35 billion gallons will continue to provide motivation for supply expansion
a. Ethanol seen as additive to gasoline and not as competitor to gasoline
i. Supply for low level blends i. Current consensus of corn based ethanol production is estimated at
about 14 billion gallons or about 10% of current U.S. gasoline demand
Ethanol Storyline May 30, 2007 11
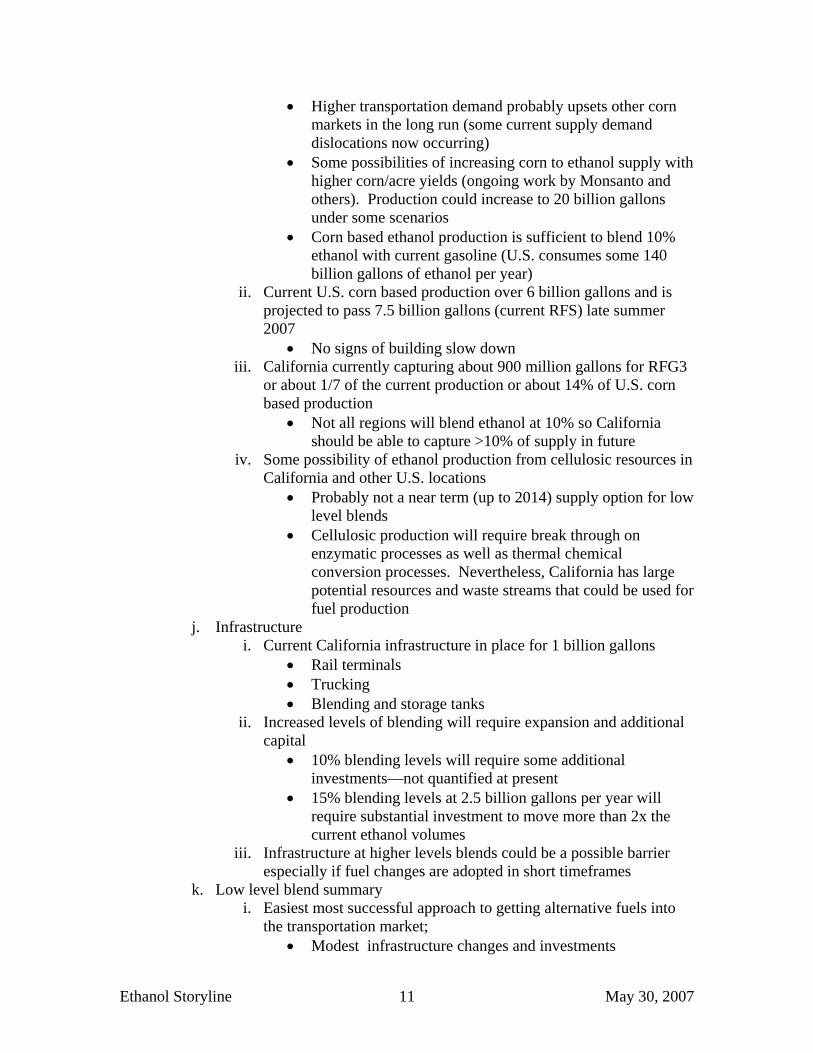
• Higher transportation demand probably upsets other corn markets in the long run (some current supply demand dislocations now occurring)
• Some possibilities of increasing corn to ethanol supply with higher corn/acre yields (ongoing work by Monsanto and others). Production could increase to 20 billion gallons under some scenarios
• Corn based ethanol production is sufficient to blend 10% ethanol with current gasoline (U.S. consumes some 140 billion gallons of ethanol per year)
ii. Current U.S. corn based production over 6 billion gallons and is projected to pass 7.5 billion gallons (current RFS) late summer 2007
• No signs of building slow down iii. California currently capturing about 900 million gallons for RFG3
or about 1/7 of the current production or about 14% of U.S. corn based production
• Not all regions will blend ethanol at 10% so California should be able to capture >10% of supply in future
iv. Some possibility of ethanol production from cellulosic resources in California and other U.S. locations
• Probably not a near term (up to 2014) supply option for low level blends
• Cellulosic production will require break through on enzymatic processes as well as thermal chemical conversion processes. Nevertheless, California has large potential resources and waste streams that could be used for fuel production
j. Infrastructure i. Current California infrastructure in place for 1 billion gallons
• Rail terminals • Trucking • Blending and storage tanks
ii. Increased levels of blending will require expansion and additional capital
• 10% blending levels will require some additional investments—not quantified at present
• 15% blending levels at 2.5 billion gallons per year will require substantial investment to move more than 2x the current ethanol volumes
iii. Infrastructure at higher levels blends could be a possible barrier especially if fuel changes are adopted in short timeframes
k. Low level blend summary i. Easiest most successful approach to getting alternative fuels into
the transportation market; • Modest infrastructure changes and investments

Ethanol Storyline May 30, 2007 12
• Can use in all gasoline fuel cars not just new cars (incorporates so called legacy fleet of older vehicles that using the most fuel)
• Displaces billion of gallons of gasoline depending on blend level—1 billion at 5.7%, 1.5 to 1.8 billion at 10% , and 2.5 to 2.8 billion at 15%
• GHG emission benefits small on a percentage basis but large overall and like gasoline displacement occur immediately throughout fleet
• GHG emission benefit depends on ethanol production pathway—corn as possible lower bound and cellulosic/sugar cane production as upper bound
a. Corn based GHG reductions (equiv CO2 emissions) compared to E5.7
i. E10 (2012-2050) range from 11,400 tpd to 13,400 tpd
ii. E15 (2012-2050) range from 15,900 tpd to 18,800 tpd
b. Cellulosic based GHG reductions compared to E5.7 i. E10 (2012-2050) range from 33,300 tpd to
41,000 tpd ii. E15 (2012-2050) range from 49,300 tpd to
63,000 tpd • Other pathways of ethanol production will most like fall
between these two estimates like corn shipped to California and wet mill fed to nearby cattle
ii. Current and future barriers • Need research on how to optimize low level ethanol blends
with gasoline feedstocks a. Driveability and environment effects b. Need coordinated “auto oil” research projects
• Need some infrastructure investment especially at terminals but also at fueling stations if USTs not compatible
• Supply adequate to 1.5 billion gallons will need additional sources beyond corn at higher demands
IV. Scenario 2, E85 used in FFVs a. Introduction (use write up in market assessment report)
i. Some 6 million FFVs in US with about 260,000 in California ii. Nearly all FFVs in California use gasoline
iii. Only 3 stations in CA but expanding in LA Basin and Sacramento • Calstep in Southern California • SMAQMD in Sacramento (AB1811) • Chevron, Caltrans, Pacific Ethanol demonstration

Ethanol Storyline May 30, 2007 13
iv. FFV technology can use gasoline or E85 or any combination of gasoline and E85.
• Vehicle modifications relatively straight forward – changing materials and modifying computer logic.
• Low costs ~ $100 per vehicle • Some issues with emission certification
a. 50oF cold start tailpipe + evap tests b. Evap issues with blends down to PZEV levels c. Impact on vehicle costs?
b. E85 FFV Scenarios i. Incentives currently in place for OEMs to produce FFVS
• AMFA 1988 and renewed to 2010 and could be expanded to 2013
ii. Domestic OEMs have suggested (committed) that 50% of their production will be FFVs by 2012. This will greatly increase the number of FFVs in the LDV fleet.
iii. Low costs to manufacturers indicates possibility of all new vehicles being FFVs starting in 2012
• Brazil experience shows this is possible at least given the success of FFVs in the market place
iv. Figure 4-1 shows a comparison of the above three possible scenarios
-
10,000,000
20,000,000
30,000,000
40,000,000
50,000,000
60,000,000
2000 2005 2010 2015 2020 2025 2030 2035 2040 2045 2050 2055
Popu
latio
n Ve
hicl
es P
eopl
e
BAUBig 3 at 50%All OEM at 100%Vehicle PopulationPopulationPoly. (Population)Linear (Vehicle Population)
Population
Vehicles in Fleet
All OEMs Produced FFVs starting in 2012
Only Big 3 Produced50% FFVs starting in 2012
Figure 4-1. FFV Population Estimates Compared to Future Number of Vehicles
and California Population
Ethanol Storyline May 30, 2007 14
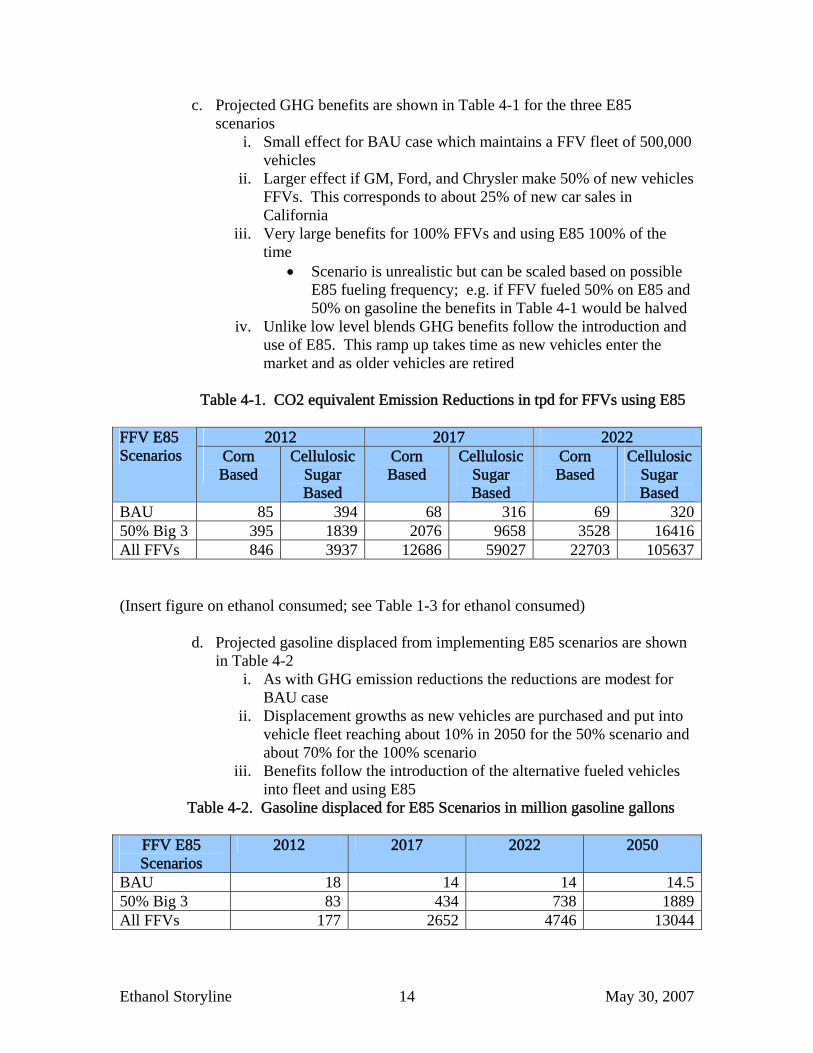
c. Projected GHG benefits are shown in Table 4-1 for the three E85 scenarios
i. Small effect for BAU case which maintains a FFV fleet of 500,000 vehicles
ii. Larger effect if GM, Ford, and Chrysler make 50% of new vehicles FFVs. This corresponds to about 25% of new car sales in California
iii. Very large benefits for 100% FFVs and using E85 100% of the time
• Scenario is unrealistic but can be scaled based on possible E85 fueling frequency; e.g. if FFV fueled 50% on E85 and 50% on gasoline the benefits in Table 4-1 would be halved
iv. Unlike low level blends GHG benefits follow the introduction and use of E85. This ramp up takes time as new vehicles enter the market and as older vehicles are retired
Table 4-1. CO2 equivalent Emission Reductions in tpd for FFVs using E85
2012 2017 2022 FFV E85
Scenarios Corn Based
Cellulosic Sugar Based
Corn Based
Cellulosic Sugar Based
Corn Based
Cellulosic Sugar Based
BAU 85 394 68 316 69 32050% Big 3 395 1839 2076 9658 3528 16416All FFVs 846 3937 12686 59027 22703 105637
(Insert figure on ethanol consumed; see Table 1-3 for ethanol consumed)
d. Projected gasoline displaced from implementing E85 scenarios are shown in Table 4-2
i. As with GHG emission reductions the reductions are modest for BAU case
ii. Displacement growths as new vehicles are purchased and put into vehicle fleet reaching about 10% in 2050 for the 50% scenario and about 70% for the 100% scenario
iii. Benefits follow the introduction of the alternative fueled vehicles into fleet and using E85
Table 4-2. Gasoline displaced for E85 Scenarios in million gasoline gallons
FFV E85 Scenarios
2012 2017 2022 2050
BAU 18 14 14 14.550% Big 3 83 434 738 1889All FFVs 177 2652 4746 13044

Ethanol Storyline May 30, 2007 15
e. Barriers to introducing FFVs in California i. OEMs have suggested there are some technical hurdles in
certifying FFVs to PZEV standards. Current FFVs are certified in California but at less stringent standards.
ii. Customer needs to have a value proposition for using E85 • Financial • Vehicle performance (i.e. premium fuel) • Green thing to do • Other
iii. Manufactures have the technology to introduce FFVs but infrastructure will be required—so called chicken and egg
• FFVs solve this issue but E85 still needs to be available to and customers need to purchase
f. Distribution and Fueling Infrastructure i. Need fueling stations modifications to use E85. Extend of
modifications will range from retrofits of piping and dispensers to ground up installations including UST, piping and dispensers.
ii. Need to modify gasoline terminals to blend E85 • Have to adjust CARBOB RVP – probably by adding
pentanes iii. Need tanker trucks to distribute fuel. Gasoline tankers will work
but eventually will need to increase fleet due to less volumetric energy content
iv. Substantial costs of adding infrastructure • $100K to 250K per station • This investment has to be recovered by E85 sales so
important to have adequate sales as early as possible. • Might be able to use some of the existing gasoline
equipment if alcohol compatible. For example, stations with 3 underground tanks for regular, midgrade, and premium could use one of these tanks for E85 and then use blend pump/dispenser to provide midgrade (not many stations are configured this way any more)
• Add cost spreadsheet on station costs and recovery of investment
v. Number of E85 stations and distribution • Need at least 10% coverage is the old wisdom for
introducing alternative fuels. With FFV where the customer can choose either gasoline or E85 suggests that the coverage should be increased to 20% of the gasoline stations
• Could concentrate in areas of high FFV populations like SF, Sacramento, LA, San Diego
vi. Need oil companies to back strategy and remove barriers currently imposed on station owners
Ethanol Storyline May 30, 2007 16
• For example, add dispensers under canopy (WSJ article April 2, front page)
vii. Equipment Issues: a. UL certification of dispensers (currently cert to 15%
alcohol blends) b. Certification of stage II vapor recovery on fueling
nozzles/dispensers viii. Key stakeholders
• Major oil companies, branded stations, independents a. Majors: Chevron, BP, Shell, etc. b. Branded: privately owned but with Chevron, Arco,
etc. c. Independents: Rotten Robby, big box—Wal-Mart
• Fuel station equipment suppliers: tanks, dispensers, pumps etc
• Others: construction companies, A&E, etc. g. Price of E85
i. Price on energy equivalent basis 72% of RUL. • Pricing is tricky since E85 always needs to compete with
gasoline (RUL or octane adjusted?) ii. Question on RUL: E85 has higher octane can this be capture in
pricing of fuel? May require engine modifications like turbocharging or variable valve to get customer benefit
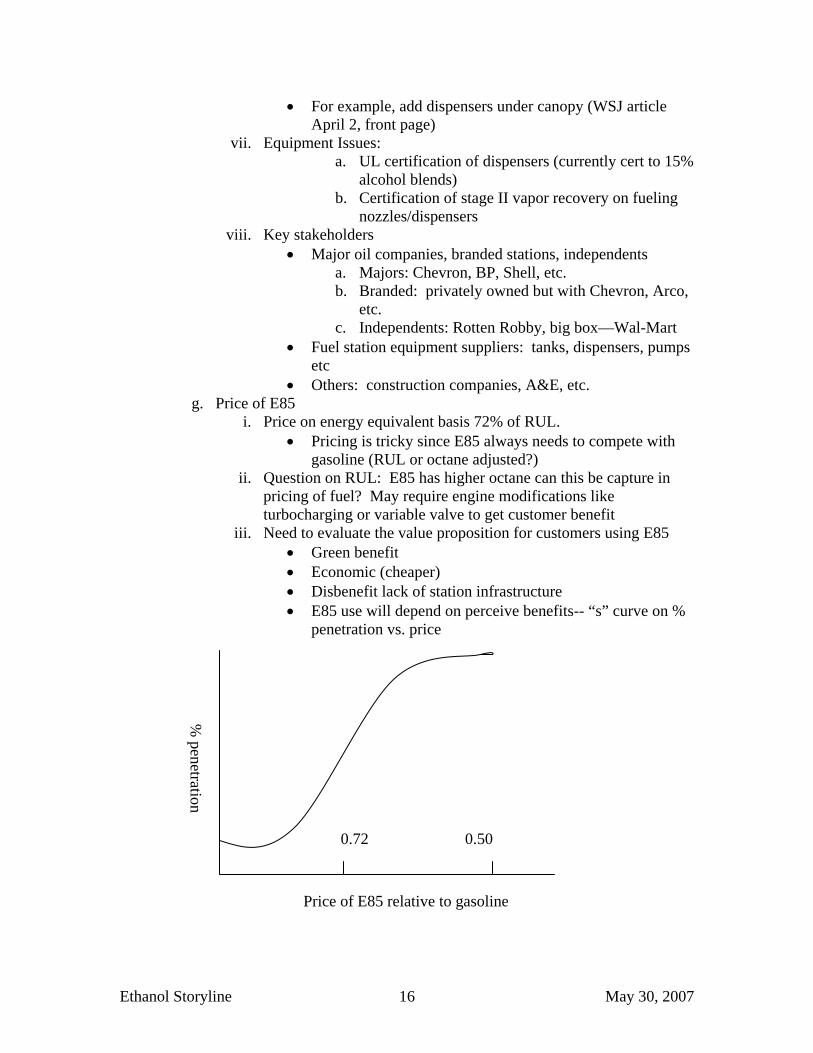
iii. Need to evaluate the value proposition for customers using E85 • Green benefit • Economic (cheaper) • Disbenefit lack of station infrastructure • E85 use will depend on perceive benefits-- “s” curve on %
penetration vs. price
% penetration
Price of E85 relative to gasoline
0.72 0.50

Ethanol Storyline May 30, 2007 17
h. Incentives
i. EPACT 2005 • Blenders credit of $0.51 per gallon • Tax credit for infrastructure (30% capital costs)
ii. Sales tax, or excise tax treatment iii. Use as compliance with LCFS (what’s the value) iv. FFV user education
• Yellow fuel caps v. Free fuel
vi. More station incentives—grants, fuel pricing etc i. E85 Scenario Summary
i. Success of this strategy depends on building the E85 infrastructure. Justifying this investment is the major reason dedicated alternative fuel use has not been successful in California.
• Have to match fuel use to infrastructure changes to recover investments
• Displaces billion of gallons of gasoline depending number of FFVs introduced into the market place and how much E85 fuel is used by these vehicles; but is probably limited by supply of ethanol
• GHG emission benefits also depend on number of FFVs and their use of E85. Also GHG benefit will be limited by supply of ethanol
• GHG emission benefit depends on ethanol production pathway—corn as possible lower bound and cellulosic/sugar cane production as upper bound
• Other pathways of ethanol production will most like fall between these two estimates
ii. Current and future barriers • Need to solve FFV certification to PZEV
a. Change of materials for fuel wetted system components
• Need large infrastructure investments a. Estimated at $2.4 billion if all stations in California
have E85 capability • Not enough ethanol supply to completely convert to E85
a. Demand price relationship may not favor high volume use in California
b. Need production break through to provide competitive cost ethanol at very high volumes (>10 billion gallons/yr)
• Not clear competition with gasoline will provide consistent GHG reductions and gasoline displacement

Ethanol Storyline May 30, 2007 18
V. Scenario 3 – Medium Level Blends--30% Ethanol or other Bio-derived Molecules
a. Pick fuel to minimize fuel infrastructure changes and costs
i. This concept would attempt to cost effectively reduce the number of fuels in the market place
• Current infrastructure is a 3 tank system (RUL, PUL, and diesel) mid grade is blended from regular and premium
• Mid level blend strategy might be able to replicate this 3 tank system
a. Regular unleaded (octane level unclear but may need higher than 86 R+M/2
b. Mid level ethanol blend at octane in mid 90’s c. Blend mid or premium by mixing RUL and mid
level ii. Assume underground tanks alcohol compatible in California so
may not have to change out; this needs to be verified iii. At E30 may only need to change materials in pumps, dispenser,
etc. Equipment change out. No construction iv. Estimate costs about $10,000 per station. 9600 stations in Ca
implies with 8% discount investment of $237 million or about 1/10 the costs of a full E85 infrastructure
b. Mid Level FFV Scenarios (same as E85) i. BAU no growth
ii. 50% by Big 3 in 2012 iii. 100 % FFV by all manufacturers in 2012 iv. Figure 5-1 shows a comparison of the above three possible
scenarios (same as Figure 4-1) v. All FFVs would have to use the E30 Mid Level blend
• E30 priced at its market value a. Might have higher octane so could get higher
efficiency from vehicles • Unleaded priced probably more than E30 (ethanol cheaper
than gasoline) • Introduced like unleaded in the 1970’s • Maintains two tank system
vi. Need to decide at what level ethanol is blended into unleaded gasoline (sold at 10% or 15% or what?)

Ethanol Storyline May 30, 2007 19
-
10,000,000
20,000,000
30,000,000
40,000,000
50,000,000
60,000,000
2000 2005 2010 2015 2020 2025 2030 2035 2040 2045 2050 2055
Popu
latio
n Ve
hicl
es P
eopl
e
BAUBig 3 at 50%All OEM at 100%Vehicle PopulationPopulationPoly. (Population)Linear (Vehicle Population)
Population
Vehicles in Fleet
All OEMs Produced FFVs starting in 2012
Only Big 3 Produced50% FFVs starting in 2012
Figure 5-1 FFV Population Estimates Compared to Future Number of Vehicles
and California Population
c. Projected GHG benefits are shown in Table 5-1 for the three Mid Level E30 scenarios
i. Small effect for BAU case which maintains a FFV fleet of 500,000 vehicles
ii. Larger effect if GM, Ford, and Chrysler make 50% of new vehicles FFVs.
iii. Large benefits for 100% FFV case with 100% use of E85 iv. Unlike low level blends GHG benefits follow the introduction and
use of E85. This ramp up takes time as new vehicles enter the market and as older vehicles are retired
Table 5-1. CO2 equivalent Emission Reductions in tpd for FFVs using Mid
Level E30 Blend
2012 2017 2022 FFV Mid Level E30 Scenarios
Corn Based
Cellulosic Sugar Based
Corn Based
Cellulosic Sugar Based
Corn Based
Cellulosic Sugar Based
BAU 121 389 97 312 98 31550% Big 3 226 725 2372 7620 4032 12952All FFVs 484 1553 7250 23286 12974 41673

Ethanol Storyline May 30, 2007 20
(Insert figure on ethanol consumed; see Table 1-3 for ethanol consumed)
d. Projected gasoline displaced from implementing Mid Level E30 scenarios
are shown in Table 4-2 i. As with GHG emission reductions the reductions are modest for
BAU case ii. Displacement grows as new vehicles are purchased and put into
fleet iii. Benefits follow the introduction of the alternative fueled vehicles
into fleet and using E85 Table 5-2. Gasoline displaced for E85 Scenarios in million gasoline gallons
FFV E85 Scenarios
2012 2017 2022 2050
BAU 15 12 12 1250% Big 3 28 291 494 1271All FFVs 59 889 1591 4389
e. Mid Level Scenario Summary i. Point of strategy is that infrastructure costs are minimized and
existing infrastructure can be leveraged • If underground tanks have to be changed out then
infrastructure costs similar to E85 ii. Marketing of fuels is easier with this strategy
• No competition between Mid Level and gasoline iii. Get comparable albeit lower GHG and gasoline displacement as
E85 iv. Vehicle FFV costs assumed to be about $100 per vehicle
• Might want to optimize to E30 v. Even this strategy will be limited by ethanol or other sources of
biofuels vi. Current and future barriers
• Need to solve FFV certification to PZEV a. Change of materials for fuel wetted system
components • May need to change out USTs which might result in
infrastructure investments comparable to E85 a. Costs to be determined
• Not enough ethanol supply to completely meet total E30 demands
VI. Scenario 4– EDiesel:
a. Option is to blend ethanol in diesel fuels
i. Up to maximum 15% vol

Ethanol Storyline May 30, 2007 21
ii. O2 Diesel in market place with 7.7% vol blend with proprietary additives in the 0.6 to 1% vol range
iii. O2 Diesel has received interim verification from ARB b. Key assumptions affecting use
i. Continuation of $0.51 blenders tax credit ii. Moderate growth case assumes market penetration <10%
• Engine manufacturer problems but not show stopper iii. Higher growth case has broader customer and engine manufacturer
acceptance building to 25% acceptance in targeted fleets iv. EPA Tier II health effects testing funded and outcome positive v. Engine durability no different than diesel
vi. ASTM standard developed vii. Verification retained and ethanol diesel blends continue to show
emission benefits c. Table 6-1 shows possible results for O2 Diesel for the above two cases Table 6-1 Projections of Market Potential of O2 Diesel
Fleet Application
2010 2025
On-Road Centrally Fueled
Diesel Gal Displaced (1)
Ethanol Volume
Diesel Gal Displaced
Ethanol Volume
Moderate 1.8 3.0 6.6 11.0 Higher Growth 2.7 4.5 10.2 17.0 Off-Road Centrally Fueled
Moderate 2.4 4.0 6.6 11.0 Higher Growth 6.0 10.0 21.0 35.0
(1) Millions of gallons of diesel displaced and ethanol