Embed Size (px)
Citation preview

AnalyticalMethods
PAPER
Publ
ishe
d on
16
July
201
3. D
ownl
oade
d by
Uni
vers
ity o
f W
arsa
w o
n 22
/10/
2014
11:
22:3
0.
View Article OnlineView Journal | View Issue
aBeijing National Laboratory for Molecular
University, Beijing, 100871, China. E-mail:bSchool of Materials Science and Engineerin
100081, China. E-mail: [email protected]
† Electronic supplementary informationTHG and DHG. See DOI: 10.1039/c3ay406
Cite this: Anal. Methods, 2013, 5, 5019
Received 11th April 2013Accepted 16th July 2013
DOI: 10.1039/c3ay40610e
www.rsc.org/methods
This journal is ª The Royal Society of
Micellar electrokinetic chromatography analysis oftetrahydrogestrinone and related anabolic androgenicsteroids†
Hong-Xu Chen,a Mu-Hua Huang*b and Xin-Xiang Zhang*a
Tetrahydrogestrinone and related anabolic androgenic steroids (AASs) have been used extensively for
performance enhancement (doping) in sports due to their ability to accelerate protein synthesis and
improve physical performance (F. C. W. Wu, Clin. Chem., 1997, 43, 1289–1292). The separation of these
AASs was performed by micellar electrokinetic chromatography (MEKC) using borate/borax buffer (200/
50 mM, pH 8.6), with sodium cholate (40 mM) as a chiral additive. The analytes included two
endogenous steroid hormones (testosterone and epitestosterone) and five synthetic anabolic steroids
(methyltestosterone, nandrolone, gestrinone, dihydrogestrinone and tetrahydrogestrinone). Capillary
electrophoresis parameters such as the concentration of additives, injection time, temperature, and
applied voltage were investigated to improve the separation efficiency. A complete separation was
achieved in less than 16 min under the optimized conditions. The RSDs of peak area and migration time
were below 3.9% and 0.34%, respectively. The limit of detection (LOD) between 240 and 570 ng mL�1
was obtained for each of the pure standards with a photodiode array (PDA) detector. Lower LODs could
be reached when combining with preconcentration. After liquid–liquid extraction, the recoveries of
spiked urine samples were in the range from 88% to 99%.
1 Introduction
Testosterone (T) and its synthetic derivatives have anabolic andandrogenic effects, and were dened to be anabolic andandrogenic steroids (AASs). According to the InternationalOlympic Committee (IOC),1 more than 50% of all positive casesinvolving anabolic agents were related to T in the past fewyears. As the 17-a epimer of T, epitestosterone (E) exists in thehuman body at a concentration similar to T. The T/E ratio of 4was adopted as a threshold because the administration of Tcould increase this ratio. Methyltestosterone (MT) and nan-drolone (N) were synthetic AASs. They had similar structureand bioactivity to T. Tetrahydrogestrinone (THG) was a deriv-ative of gestrinone (G), a drug marketed for the treatment ofendometriosis. THG differed from G by reducing the 17-ethynylgroup to an ethyl group while keeping the main ring structureunmodied. As the second “designer steroid”, THG has beenbanned by the World Anti-Doping Agency (WADA) since 2003as many athletes were attested to be involved the doping of it.2
Dihydrogestrinone (DHG) was another analogue derived from
Sciences, College of Chemistry, Peking
g, Beijing Institute of Technology, Beijing,
n
(ESI) available: 1H-NMR and EI-MS of10e
Chemistry 2013
G, with a 17-ethenyl group. Although there has been no reporton its doping, it might be a potentially related AAS. A rapid andreliable method for detecting THG and related steroids is ofgreat importance and urgently required for doping control.The structures of the AASs mentioned above were shownin Fig. 1.
GC-MS was a conventional analytical method for the detec-tion of AASs,3–9 with a limit of detection (LOD) of about5 ng mL�1.7 Analyses of these AASs by HPLC with PDA or MSdetectors have also been applied during the past few years.9–17
The limit of quantication (LOQ) was 20 ng mL�1 for T and30 ng mL�1 for E by HPLC-UV.13 Although THG has frequentlybeen used as a doping drug in sports, only very few studies onits detection and metabolism research are available, focusing
Fig. 1 Chemical structures of investigated steroids.
Anal. Methods, 2013, 5, 5019–5023 | 5019
Analytical Methods Paper
Publ
ishe
d on
16
July
201
3. D
ownl
oade
d by
Uni
vers
ity o
f W
arsa
w o
n 22
/10/
2014
11:
22:3
0.
View Article Online
on GC-MS,18 HPLC-MS19,20 and immunoassay21 methods. Thereare obvious disadvantages for those methods: laborious andtime-consuming derivation was needed for GC-MS; using largeamounts of organic mobile phase and samples in HPLC-MSresulted in high cost and pollution; the poor resolution due tothe parabolic ow prole would inuence the throughput ofscreening; and cross-reactivities from immunoassays brought arisk of false positive results. Hence, an efficient detectiontechnique for THG and related AASs is in high demand.
Capillary electrophoresis (CE) is a rapid and highly efficientseparation method with small reagent/sample consumption.MEKC is one of the CE modes for uncharged analytes. Therehave been some reports using MEKC for the detection oftestosterone abuse.22–33 However, the simultaneous analysis ofTHG and related AASs by CE has never been reported. Based onthese previous works, it is envisioned that CE could be a goodalternative to current chromatography and immunoassaymethods for THG-related analysis.
Herein, we report an efficient separation of THG and otherabused AASs based on MEKC analysis. Detection on a spikedurine sample of 300 ng mL�1 analytes was achieved with satis-factory recovery aer simple clean-up and concentration byliquid–liquid extraction.
2 Experimental2.1 Materials
Testosterone (T), methyltestosterone (MT), and 10% Pd/C wereproducts of Acros (New Jersey, USA). Nandrolone (N) waspurchased from Yumei Biological Health-Care Co. Ltd. (Hang-zhou, China). Epitestosterone (E) and sodium cholate (SC) werepurchased from Sigma (St Louis, MO, USA). Gestrinone (G) wasa product of Zizhu Pharmaceutical Co., Ltd. (Beijing, China).Lindlar catalyst (palladium, 5% on calcium carbonate poisonedwith lead) was obtained from Aldrich (USA). Methanol anddichloromethane were from Beijing Chemicals (Beijing, China).Other chemicals were of analytical grade. The urine sample wasprovided by a healthy female volunteer.
Fig. 2 Synthesis of DHG and THG.
2.2 Apparatus and procedures
All separation experiments were performed on an MDQ capillaryelectrophoresis system equipped with a photodiode array (PDA)detector (Beckman, Brea, CA, USA). Separations were carried outon a 62 cm (effect length 50 cm) � 50 mm i.d. uncoated fused-silica capillary (Sino Sumtech, Hebei, China). A GS-15R multi-purpose refrigerated centrifuge used was from Beckman. The C18cartridge (3mL) and the Visiprep� vacuummanifold systemwerefrom Supelco (Bellefonte, PA, USA). pH was measured using amicroprocessor pH Meter (pH 211, HANNA, Italy).
The capillary was treated prior to its rst use by washing with1.0 M sodium hydroxide (20 min), distilled water (10 min) andbackground electrolyte (BGE) (5 min) in turn. Between consecu-tive analyses, the capillary was ushed with BGE for 1 min toguarantee good reproducibility. Pressure injection was performedby applying 0.5 psi at the cathode end for 10 s. The applied voltage
5020 | Anal. Methods, 2013, 5, 5019–5023
was 30 kV and the temperature was set at 15 �C. Samples weredetected by PDA at 254 and 340 nm at the anode end.
2.3 Synthesis of DHG and THG
DHG and THG were synthesized by catalytic hydrogenation of G,with partial hydrogenation of the alkynyl functional group givingDHG, and full hydrogenation of the alkynyl functionality givingTHG (Fig. 2). The hydrogenation reaction was controlled by usingdifferent catalysts, solvents and reaction times. DHG wasprepared as follows: a solution of G (500 mg, 1.62 mmol) intoluene (30 mL) was treated with Lindlar catalyst (palladium, 5%on calcium carbonate poisoned with lead) (15 mg). Aer themixture was stirred at room temperature for 36 h under a balloonof hydrogen gas, DHG was obtained in 68% isolated yield withoutany further chromatography purication. As for THG, a solutionof G (300 mg, 0.97 mmol) in methanol (20 mL) was treated with10% Pd/C catalyst (20 mg) under H2. The reaction mixture wasstirred at room temperature for 60 min, and THG was isolated in50% yield.2 The products of DHG and THG were characterized byMS (Finnigan LCQ) and NMR spectroscopy (Bruker AV300).
1H-NMR of DHG (CDCl3, 300 MHz): d (ppm) 6.55 (d, 1H, J ¼10.1 Hz), 6.29 (d, 1H, J ¼ 10.1 Hz), 6.05 (dd, J ¼ 10.4, 17.2 Hz1H), 5.77 (s, 1H), 5.26 (d, J ¼ 17.2 Hz, 1H), 5.26 (d, J ¼ 10.8 Hz,1H), 2.92–2.65 (m, 2H), 2.61–2.40 (m, 5H), 2.21–1.41 (m, 9H),1.39–1.21 (m, 1H), 1.04 (t, J ¼ 7.4 Hz, 3H).
EI-MS of DHG: m/z, calc. for C21H26O2 [M]+, 310, found 310.1H-NMR of THG (CDCl3, 300 MHz): d (ppm) 6.57 (d, 1H, J ¼
10.1 Hz), 6.37 (d, 1H, J ¼ 10.1 Hz), 5.77 (s, 1H), 2.92–2.70 (m,2H), 2.65–2.40 (m, 5H), 2.21–1.10 (m, 12H), 1.04 (t, J ¼ 7.6 Hz,3H), 0.97 (t, J ¼ 7.4 Hz, 3H).
EI-MS of THG: m/z, calc. for C21H28O2 [M]+, 312, found 312.
2.4 Preparation of buffer and standard solutions
Borate/borax buffer (200/50 mM, pH 8.6) was prepared by dis-solving the reagent in distilled water. Sodium cholate was addedto the buffer above to form the BGE for CE, which was lteredthrough a 0.22 mm Nylon lter and degassed by ultrasonicationbefore use.
Stock solutions of testosterone, epitestosterone, nandrolone,methyltestosterone, gestrinone, dihydrogestrinone, and tetra-hydrogestrinone were prepared in methanol (2 mg mL�1) and
This journal is ª The Royal Society of Chemistry 2013

Paper Analytical Methods
Publ
ishe
d on
16
July
201
3. D
ownl
oade
d by
Uni
vers
ity o
f W
arsa
w o
n 22
/10/
2014
11:
22:3
0.
View Article Online
stored at �21 �C. Then each stock solution was mixed anddiluted with borate/borax buffer to give different concentrationsfor calibration. The concentrations of each analyte were rangedfrom 1 to 100 mg mL�1.
2.5 Preparation and pretreatment of spiked urine samples
2.5.1 Preparation of steroids-free urine sample (SFUS). Thesolid phase extraction (SPE) column was preconditioned with 5mL of methanol and 10 mL of distilled water. The SFUS wasinitially prepared by percolating urine from a healthy femalevolunteer through a C18 cartridge.11,34 The eluent was collectedand used as the matrix for steroid spiking. All experiments wereperformed in compliance with the relevant laws and institu-tional guidelines, and the institutional committee haveapproved the experiments.
2.5.2 Liquid–liquid extraction (LLE). Sample (100 mg mL�1)was added to the SFUS (3 mL) to give a nal concentration of300 ng mL�1 for each analyte. NaCl (0.35 g) was added to thisspiked urine sample in order to avoid the formation of anemulsion. The pH was then adjusted to 9.0 by adding Na2HPO4
(0.5 g). Aer CH2Cl2 (4 mL) was added, the tube was vortex-mixed for 1 min and centrifuged for 3 min at 3750 g. Theorganic layer was collected, and the aqueous layer was extractedwith CH2Cl2 (2� 3 mL). The combined organics were dried overanhydrous Na2SO4 for 2 h. Aer the drying reagent had beenltered off, the ltrate was concentrated under vacuum. Theresidue was redissolved with 300 mL of borate/borax buffer.
3 Results and discussion3.1 Detection modes and separation mechanism
The seven AASs could be divided into the testosterone group(including testosterone, epitestosterone, nandrolone andmethyltestosterone) and the gestrinone group (including ges-trinone, dihydrogestrinone and tetrahydrogestrinone). Theabsorption spectra of these two groups were different. Themaximal absorption of the testosterone group was at 254 nm,
Fig. 3 Typical electropherograms under optimized conditions: BGE, borate/borax (200/50 mM) with sodium cholate (40 mM) as an additive, pH 8.6; appliedvoltage, 30 kV; temperature, 15.0 �C � 0.1 �C; pressure injection, 0.5 psi for 10 s;PDA detector, (a) 254 and (b) 340 nm. Peak 1: nandrolone (N); 2: epitestosterone(E), 3: testosterone (T), 4: gestrinone (G), 5: methyltestosterone (MT), 6: dihy-drogestrinone (DHG), and 7: tetrahydrogestrinone (THG).
This journal is ª The Royal Society of Chemistry 2013
while the maximal absorption of the gestrinone group wasshied to 340 nm due to their widely conjugated structures.Both groups could be separated and detected in one run using aPDA detector. The typical electropherograms of both wave-lengths were shown in Fig. 3.
Most AASs are neutral in the solution of pH 2–12, and shouldbe separated by MEKC. Micelles formed when the surfactantsexisted at a concentration higher than their critical micelleconcentration (CMC). The neutral analytes with differentmicelle–water partition coefficients went into the micelle toform different charged complexes which could be separated byCE. Chiral surfactants were necessary when neutral stereoiso-mers needed to be separated, such as testosterone and epi-testosterone. Sodium cholate, a chiral micelle, was chosen as anadditive. The results revealed that this simple buffer systemcould give complete separation of the seven analytes easily.
The migration order depended on the interaction betweenthe analytes and micelles. The more hydrophobic analyte had astronger interaction with micelles. When anionic micelles wereused in normal electro-osmotic ow (EOF) (from inlet to outlet),the anionic complex migrated towards the inlet end. This led tothe result that analytes with stronger hydrophobicity wouldmigrate relatively slower. Testosterone/epitestosterone had onemore methyl (hydrophobic) group than nandrolone, and oneless than methyltestosterone. The hydrophobicity order fromhigh to low was methyltestosterone, testosterone/epitestoster-one, and nandrolone. As for the gestrinone group, the hydro-phobicity of the alkyne, alkene, and alkane functionalities wasalkyne > alkene > alkane. The corresponding hydrophobicityorder from high to low was tetrahydrogestrinone, dihy-drogestrinone, and gestrinone. The migration order of theinvestigated AASs was accordant with their hydrophobicity.
3.2 Optimization of CE separation
The CMC of sodium cholate was around 13 mM.35 However, dueto the complexity of the analytes and the inuence frommethanol to form micelles, more sodium cholate must be usedto obtain better separation efficiency. When the concentrationof sodium cholate was up to 40 mM, baseline separation of
Fig. 4 Electropherograms of different concentrations of sodium cholate (5, 10,20, 30, 40, 50, 75, 100 mM) in borate/borax (200/50 mM) buffer. Other CEconditions were as for Fig. 3. Electropherograms of 340 nm were not shown.
Anal. Methods, 2013, 5, 5019–5023 | 5021
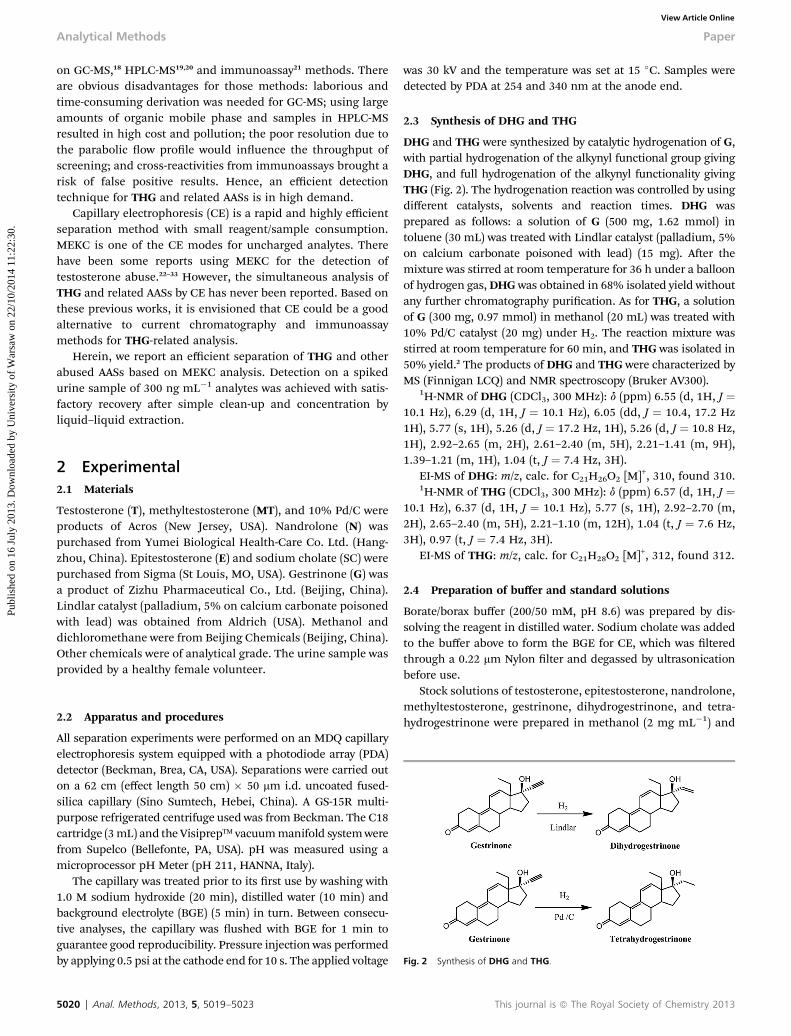
Fig. 5 Electropherograms of SFUS ((a) 254 nm, (b) 340 nm), spiked urine sample(300 ngmL�1) after liquid–liquid extraction ((c) 254 nm, (d) 340 nm) and standardsample (1 mg mL�1) without liquid–liquid extraction ((e) 254 nm, (f) 340 nm). CEconditions were as for Fig. 3.
Analytical Methods Paper
Publ
ishe
d on
16
July
201
3. D
ownl
oade
d by
Uni
vers
ity o
f W
arsa
w o
n 22
/10/
2014
11:
22:3
0.
View Article Online
these seven AASs could be achieved. However, when theconcentration increased above 50 mM, the resolution was lostagain (Fig. 4). The best concentration of sodium cholate forseparation was 40 mM.
The peak response as well as the sensitivity increased withthe increase of injection time. However, overload and peakbroadening must be considered with long injection times.There was no obvious overload observed with a 10 injectioncompared with 3 s. A pressure injection of 0.5 psi for 10 s waschosen for further study.
The capillary temperature and applied voltage for the sepa-ration were also studied. 15 �C and 30 kV were nally chosen asthe operation temperature and voltage in order to balance theresolution and migration time.
3.3 Method evaluation
3.3.1 Repeatability. The repeatabilities of migration timeand peak area were determined at the concentration of50 mg mL�1 for all analytes. The repeatabilities (RSD, n ¼ 3) ofmigration time (RSD(t)) ranged from 0.04% (E) to 0.34% (THG),whereas the repeatabilities (RSD, n ¼ 3) of peak area (RSD(A))ranged from 1.2% (G) to 3.9% (THG). Data were shown inTable 1.
3.3.2 Calibration curves of seven AASs. The linear correla-tion between the concentration (0.5–100 mg mL�1 for eachanalyte) and peak area was investigated at seven concentrationlevels. Each sample was injected twice. LODs were determinedaccording to a signal-to-noise ratio (S/N) of three. The valueranged from 240 ng mL�1 (DHG) to 570 ng mL�1 (E). The LODand linear range of each analyte were shown in Table 1. Sampleswith lower concentrations could be detected aer preconcen-tration, which could satisfy the requirement for dopingdetection.
3.4 Analysis of spiked urine sample
The spiked sample was tested in order to evaluate the applica-bility of this MEKC method. 300 ng mL�1 of each steroid werespiked to the steroid-free urine. Aer that, the spiked urinesample was pretreated by liquid–liquid extraction. Evaporationand redissolution led to concentration by 10 times. Recoverywas calculated by an external standard method in the spikedurine samples (Table 1). The average recoveries were shown inTable 1. Fig. 5 showed the comparison of electropherogramsbetween the SFUS, spiked urine sample and standard sample.
Table 1 MEKC validation data
RSD(t)RSD(A) Linearity, r LO(%, n ¼ 3)
N 0.16 2.5 0.998 0.0E 0.04 2.8 0.999 0.0T 0.12 3.1 0.992 0.0G 0.24 1.3 0.995 0.0MT 0.13 2.7 0.992 0.0DHG 0.26 2.2 0.996 0.0THG 0.34 3.9 0.998 0.0
5022 | Anal. Methods, 2013, 5, 5019–5023
4 Conclusion
A MEKC method was used to separate seven AASs, including tet-rahydrogestrinone and its analogues, the diastereomer of testos-terone/epitestosterone, and testosterone analogues with a PDAdetector. Using sodium cholate as an additive, all analytes could beseparated and detected within 16 min. An AASs spiked urinesamples of low concentration level (300 ng mL�1) could be deter-mined aer liquid–liquid extraction and concentration, withoutinterference by the matrix. The concentration of this spiked urinewas within the range of doping detection. This work explored thepossibility of analyzing THG-related AASs by CE. CE has the greatadvantages of simplicity, speed and high efficiency. If combinedwith MS detection, CE-MS would be a promising alternative toGC-MS and HPLC-MS for the detection of AASs doping.
Acknowledgements
Supported by National Natural Science Foundation of China(no. 90713013, 30890142, 20975007) and the National ScienticSupport Project (no. 2009CB320305, MOST, China).
References
1 F. Hartgens and H. Kuipers, Sports Med., 2004, 34, 513–554.2 D. H. Catlin, M. H. Sekera, B. D. Ahrens, B. Starcevic,Y. Chang and C. K. Hatton, Rapid Commun. Mass Spectrom.,2004, 18, 1049–1245.
D/mg mL�1 Linear range/mg mL�1 Recovery (%, n ¼ 3)
43 1.4–25.0 95.0 � 2.657 1.9–25.0 92.8 � 3.056 1.8–50.0 98.0 � 3.027 0.9–50.0 88.0 � 4.053 1.8–50.0 97.0 � 2.024 0.8–50.0 94.5 � 4.527 0.9–50.0 88.5 � 5.0
This journal is ª The Royal Society of Chemistry 2013
Paper Analytical Methods
Publ
ishe
d on
16
July
201
3. D
ownl
oade
d by
Uni
vers
ity o
f W
arsa
w o
n 22
/10/
2014
11:
22:3
0.
View Article Online
3 R. Aguilera, C. K. Hatton and D. H. Catlin, Clin. Chem., 2002,48, 629–636.
4 B. G. Wolthers and G. P. B. Kraan, J. Chromatogr., A, 1999,843, 247–274.
5 R. Aguilera, D. H. Catlin, M. Becchi, A. Phillips, C. Wang,R. S. Swerdloff, H. G. Pope and C. K. Hatton, J.Chromatogr., Biomed. Appl., 1999, 727, 95–105.
6 P. Marchand, B. le Bizec, C. Gade, F. Monteau and F. Andre,J. Chromatogr., A, 2000, 867, 219–233.
7 L. D. Bowers and D. J. Borts, J. Chromatogr., Biomed. Appl.,1996, 687, 69–78.
8 A. Huenerbein, M. A. S. Marques, A. D. Pereira andF. R. D. Neto, J. Chromatogr., A, 2003, 985, 375–386.
9 F. Buiarelli, F. Coccioli, M. Merolle, B. Neri andA. Terracciano, Anal. Chim. Acta, 2004, 526, 113–120.
10 R. Gonzalo-Lumbreras and R. Izquierdo-Hornillos,J. Chromatogr., Biomed. Appl., 2000, 742, 47–57.
11 R. Gonzalo-Lumbreras, D. Pimentel-Trapero and R. Izqierdo-Hornillos, J. Chromatogr., Biomed. Appl., 2001, 754, 419–425.
12 K. A. Bean and J. D. Henion, J. Chromatogr., Biomed. Appl.,1997, 690, 65–75.
13 R. Navajas, C. Imaz, D. Carreras, M. Garcıa, M. Perez,C. Rodrıguez, A. F. Rodrıguez and R. Cortes, J.Chromatogr., Biomed. Appl., 1995, 673, 159–164.
14 N. H. Yu, E. N. M. Ho, D. K. K. Leung and T. S. M. Wan, J.Pharm. Biomed. Anal., 2005, 37, 1031–1038.
15 R. Gonzalo-Lumbreras and R. Izquierdo-Hornillos, J.Chromatogr., B: Anal. Technol. Biomed. Life Sci., 2003, 794,215–225.
16 C. He, S. Li, H. Liu, K. Li and F. Liu, J. Chromatogr., A, 2005,1082, 143–149.
17 Y. C. Ma and H. Y. Kim, J. Am. Soc. Mass Spectrom., 1997, 8,1010–1020.
18 M. A. S. Marques, H. M. G. Pereira, M. C. Padilha and F. R. deAquino Neto, J. Chromatogr., A, 2007, 1150, 215–225.
This journal is ª The Royal Society of Chemistry 2013
19 J. P. Scarth, A. D. Clarke, P. Teale and C. M. Pearce, Steroids,2010, 75, 643–652.
20 M. Machnik, M. Gerlach, M. Kietzmann, F. Niedorf,M. Thevis, I. Schenk, S. Guddat, M. Duee andW. Schaenzer, J. Vet. Pharmacol. Ther., 2009, 32, 197–202.
21 J. P. Salvador, F. Sanchez-Baeza and M. P. Marco, Anal.Chem., 2007, 79, 3734–3740.
22 L. K. Amundsen, J. T. Kokkonen, S. Rovio and H. Siren,J. Chromatogr., A, 2004, 1040, 123–131.
23 M. A. Abubaker, J. R. Petersen and M. G. Bissell,J. Chromatogr., Biomed. Appl., 1995, 674, 31–38.
24 G. A. Valbuena, L. V. Rao, J. R. Petersen, A. O. Okorodudu,M. G. Bissell and A. A. Mohammad, J. Chromatogr., A,1997, 781, 467–474.
25 C. Fernandez, G. Egginger, I. W. Wainer and D. K. Lloyd,J. Chromatogr., Biomed. Appl., 1996, 677, 363–368.
26 P. L. Urban, C. Garcıa-Ruiz, M. A. Garcıa and M. L. Marina,J. Sep. Sci., 2005, 28, 2200–2209.
27 L. K. Amundsen and H. Siren, J. Chromatogr., A, 2006, 1131,267–274.
28 P. Appelblad and K. Irgum, J. Chromatogr., A, 2002, 955, 151–182.
29 S. K. Poole and C. F. Poole, J. Chromatogr., A, 1996, 749, 247–255.
30 Z. K. Shihabi and M. A. Friedberg, Electrophoresis, 1997, 18,1724–1732.
31 H. J. Issaq, Electrophoresis, 1997, 18, 2438–2452.32 M. Silva, Electrophoresis, 2007, 28, 174–192.33 H. Chen, Q. Deng, L. Zhang and X. Zhang, Talanta, 2009, 78,
464–470.34 A. Santos-Montes, R. Gonzalo-Lumbreras, A. I. Gasco-Lopez
and R. Izquierdo-Hornillos, J. Chromatogr., Biomed. Appl.,1994, 652, 83–89.
35 E. Fuguet, C. Rafols, M. Roses and E. Bosch, Anal. Chim. Acta,2005, 548, 95–100.
Anal. Methods, 2013, 5, 5019–5023 | 5023


![High Performance Liquid Chromatography Incorporating to ...liquid chromatography [1-5, 7, 9, 15-20], gas chromatography [12, 21], micellar electrokinetic capillary chromatography [22],](https://img.dokumen.tips/doc/110x75/609dca3350c83715332046f7/high-performance-liquid-chromatography-incorporating-to-liquid-chromatography.jpg)