Embed Size (px)
Citation preview

Cost Savings Student Access Policy Research
MIDWESTERN HIGHEREDUCATION COMPACT
MHEC in WisconsinOctober 5, 2006
1

MHEC in Wisconsin
Advancing Midwestern higher education through interstate cooperation and resource sharing
Core Functions
Cost SavingsStudent AccessPolicy Research
MHEC’S MISSION
2

MHEC in Wisconsin
WICHE1953
SREB1948
NEBHE1955MHEC
1991
INTERSTATE COMPACTS
3

MHEC in Wisconsin
22.4% of the nation’s population (Census Bureau, 2004)
20.8% of the nation’s two-year college enrollments (IPEDS, 2003)
23.4% of the nation’s four-year college enrollments (IPEDS, 2003)
22.9% of the nation’s Associates degrees awarded (IPEDS, 2002-03)
25.6% of the nation’s Bachelors degrees awarded (IPEDS, 2002-03)
THE MIDWEST
4
MHEC in Wisconsin
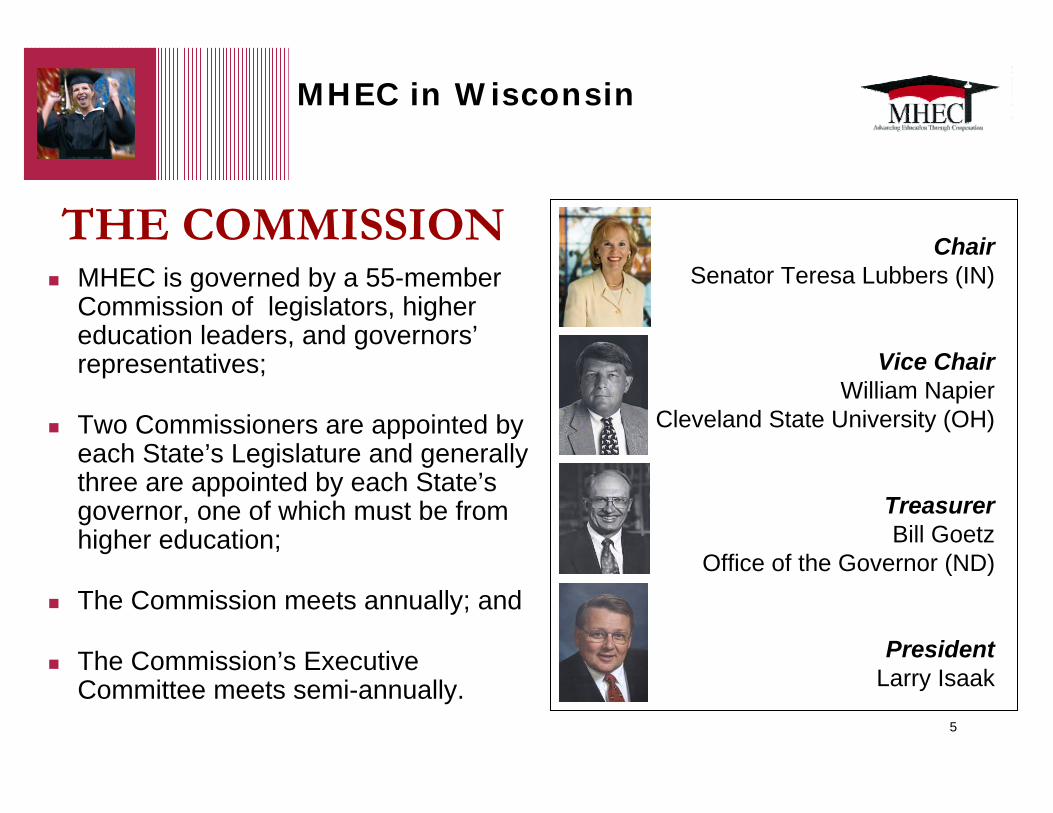
MHEC is governed by a 55-member Commission of legislators, higher education leaders, and governors’representatives;
Two Commissioners are appointed by each State’s Legislature and generally three are appointed by each State’s governor, one of which must be from higher education;
The Commission meets annually; and
The Commission’s Executive Committee meets semi-annually.
ChairSenator Teresa Lubbers (IN)
Vice ChairWilliam Napier
Cleveland State University (OH)
TreasurerBill Goetz
Office of the Governor (ND)
PresidentLarry Isaak
5
THE COMMISSION

MHEC in Wisconsin
Commissioners Serving Your StateSheila Harsdorf, State Senator
John Kerrigan, Chancellor Emeritus, UW Oshkosh
Rob Kreibich, State Representative
Jesus Salas, Regent, University of Wisconsin System
Rolf Wegenke, WI Assn of Independent Colleges & Universities (WAICU)
Dan Clancy, Commissioner
Alternate, President, Wisconsin Technical College System
Don Mash, Commissioner Alternate, Executive Senior Vice President University of Wisconsin System
6

MHEC in Wisconsin
Computing Hardware Programs
NOVELL/MHEC Higher Education Collaborative
MHEC/Office Depot Program
MHEC ATAlliance Programs and Services
Insurance Programs
Other Initiatives
COST SAVINGS
7

MHEC in Wisconsin
$1,263$1,263Office Products Program
Cumulative04-05 Savings
$695,000$82,500Member State Obligations$6,260,248$894,125Net Savings
$6,955,248$976,625Total Savings
NPNPMidwest Student Exchange ProgramStudent Access
$620,887NPOther Initiatives$5,825,330$561,725Telecom & Technology
NPNPProperty Insurance Program$39,159$24,911Software Program
$468,609$388,726Hardware ProgramCost Savings Programs
8

MHEC in Wisconsin
$222,006,781$7,690,905$229,697,686$60,559,700$18,136,333$97,775,390$211,778$26,508,787$4,086,929$22,418,769TOTAL
6,260,248695,0006,955,248N/A620,8875,825,3301,263N/A39,159468,609WisconsinApril 18, 1994
31,637,618835,50032,473,118N/A3,151,53126,429,33492,30045,000723,9092,031,044OhioJan. 9, 1991
878,826487,5001,366,326252,90028,800971,326192N/A57,57955,529N. DakotaApril 22, 1999
22,036,030835,50022,871,53016,915,600115,1321,834,5961173,279,75981,591644,735NebraskaJune 5, 1991
22,487,709835,50023,323,2099,028,0001,399,4633,661,2735,7286,685,521291,8092,251,415MissouriMay 9, 1990
19,168,033835,50020,003,5332,712,8003,743,5657,033,74212,5335,674,999290,515535,379MinnesotaApril 26, 1990
55,530,733835,50056,366,2337,308,5002,457,16836,906,40811,2835,073,064711,8723,897,938MichiganJuly 24, 1990
26,780,598835,50027,616,09824,341,900291,2642,497,263607190,316186,608108,140KansasApril 25, 1990
N/AN/AN/AN/AN/AN/AN/AN/AN/AN/AIowa1
June 6, 2005
9,310,672661,5009,972,172N/A273,3084,192,51536,439N/A477,6364,992,274IndianaMar. 14, 1996
27,916,315 833,90528,750,220N/A6,055,2158,423,60351,3165,560,1281,226,2527,433,706IllinoisAug. 20, 1991
Cumulative State Net Savings
Cumulative Dues Paid Through 11/1/05
Cumulative State Gross
Savings
Midwest Student
Exchange Program8
Other Initiatives7
Telecom & TechnologyATAlliance6
Office Products Program5
Master Property Program4
Computing Software Program3
Computing Hardware Program2
Cumulative Savings for MHEC Members through June 2005
Student Access
Cost Savings ProgramsMember States
1Iowa became a member of MHEC on June 6, 2005.2Hardware program savings include those from Dell, Gateway, IBM & Xerox.3Software program savings are from the Novell/MHEC Collaborative Program.4Based on premium & loss information as of June 30, 2005.
5Includes the first two quarters of the Office Products Program6ATAlliance estimated savings for joint programs with the other regional higher education compacts & MiCTA.7Sunsetted Programs: Academic Position Network, Academic Scheduling, Equipment Maintenance, Management, Natural Gas, and MHEC Interactive Video.8Student tuition savings through the academic year 2004-05. 9
Cumulative Savings for MHEC Members through June 2005

MHEC in Wisconsin
What States Save
$9,807,600$7,028,160$211,778$3,931,229$1,531,787$12,851,348$34,536,901$35,361,901$825,000TOTAL
NP8561,7251,263NP824,911388,726894,125976,62582,500Wisconsin
NP81,405,70092,300NP8241,2061,411,8943,068,6003,151,10082,500Ohio
111,200118,800192NP825,51520,867194,074276,57482,500N. Dakota
3,131,100134,800117428,44332,734117,1293,761,8233,844,32382,500Nebraska
1,973,300385,7005,728988,93293,9831,475,7964,840,9394,923,43982,500Missouri
573,500637,60012,5331,043,679100,553235,4342,520,7992,603,29982,500Minnesota
1,294,7002,379,50011,283486,026324,1772,099,3816,512,5676,595,06782,500Michigan
2,723,800198,50060740,09086,90849,9563,017,3613,099,86182,500Kansas
N/AN/AN/AN/AN/AN/AN/AN/AN/AIowa1
NP8431,60036,439NP8144,4462,847,8773,377,8623,460,36282,500Indiana
NP8774,23551,316944,059457,3544,204,2876,348,7516,431,25182,500Illinois
Midwest Student
Exchange Program7
Telecom & TechnologyATAlliance6
Office Products Program5
Master Property Program
(Insurance)4
Computing Software Program3
Computing Hardware Program2
Net Annual Savings
Total Annual Savings
Member State Annual Commitment to MHEC
Where States and Citizens SaveMHEC Program Savings for 12 months
What States Pay2004-2005
Member States
1Iowa became a member of MHEC on June 6, 2005.2Hardware program savings include those from Dell, Gateway, IBM & Xerox.3Software program savings are from the Novell/MHEC Collaborative Program.4Based on premium & loss information as of June 30, 2005.
5Includes the first two quarters of the Office Products Program6ATAlliance estimated savings for joint programs with the other regional higher education compacts & MiCTA.7Student tuition savings through the academic year 2004-05.8Non-participating state for 2004-2005. 10
MHEC Program Savings for 12 Months

MHEC in Wisconsin
Midwest Student Exchange Program
Electronic Transcript Initiative
Student Access Advisory Committee
STUDENT ACCESS
11

MHEC in Wisconsin
Provides reduced tuition for students from KS, MI, MN, MO, NE, ND & WI
State approval required for institutions to participate
Institutions’ participation voluntary
140 campuses open their doors to MSEP students
Since 1994, 17,000+ students have participated and those students & families have saved $49+ M
MIDWEST STUDENTEXCHANGE PROGRAM
12

MHEC in Wisconsin
MSEP 2004-05 School Year Campus Participation
2,346Total
146North Dakota107Nebraska
1,124Missouri422Minnesota272Michigan275Kansas
Total MSEP Enrollment for all
Institutions
State
13

MHEC in Wisconsin
The MHEC ETI is a comprehensive intraregional electronic transcript initiative available to all secondary and postsecondary schools, both public and private. Docufide was selected as the providing vendor through a full RFP process.
Core ServicesHS transcripts from member high schools to member collegesHS transcripts between member high schoolscollege transcripts between member colleges 14

MHEC in Wisconsin
BENEFITSTransfer between ETI members at reduced or no cost
Participation in ETI Project Advisory Committee (PAC)
Access to product upgrades and enhancements
Standardized transcript format and data possible across all ETI member school
Best negotiated discount available without the need for separate state-by-state RFP’s
15

MHEC in Wisconsin
Midwest Policy Summit – November 2006, on U.S. Secretary of Education’s Report on the Future of Higher Education
The Midwestern Higher Education to Workforce Policy Initiative: Seamless Development of Talent for the 21st
Century, October, 2005
Wisconsin State Roundtable on Education to Workforce Initiative – Planning team
Annual Midwest State Higher Education Executive Officers (SHEEO) Workshop
ROUNDTABLES & FORUMS
16

MHEC in Wisconsin
The Midwest PERL http://perl.mhec.org
(Postsecondary Education Resource Library)Two user-friendly and complementary online databasesState-level data searchable by statePolicy resources database searchable by issue, sector & institutional type
POLICY RESOURCES
17

MHEC in Wisconsin
1Information in this table is from the National Center for Public Policy in Higher Education, Measuring Up 2004, with data from Thomas Mortenson and Postsecondary Education OPPORTUNITY, U.S. Census Bureau, ACT, and the National Center for Education Statistics2”Chance for college” is defined as the relative probability that a student entering ninth grade will finish high school in four years and proceed directly to college.3The average of the five states nationally with the highest scores in a given area.4The sample size for this measure was too small to provide an accurate percentage figure.
N/A27.0%16.1%11.1%0.6%11.9%19.1%U.S.
-4.4%24.6%13.1%3.9%-11.8%-4.2%1.4%MI-4.1%28.3%10.6%1.1%1.5%2.2%15.6%KS
-10.5%24.1%12.9%-4.2%-8.0%-4.3%9.4%WI
Net migration rate of 22-29 year-olds with a bachelor’s degree or more, 1995-20001
% of adult population with a bachelor’s degree
or higher (2004)3
% of adult population with less than a high
school diploma or equivalent
(2004)3
Projected change in number of high school graduates
2002-20182
Projected changein 25-44 age
group, 2000-20251
Projected change in 18-24
age group, 2000-20251
Projected change in total population
2000-20251
State
-4.0%23.3%13.4%0.5%-10.5%-3.0%3.4%OH-9.7%26.6%10.6%-1.1%-2.9%-1.9%12.8%NE-45.5%24.0%12.1%-30.2%-1.4%-4.5%13.6%ND-0.2%24.3%13.7%-0.4%-4.9%0.2%11.7%MO9.2%29.7%9.3%0.7%-6.0%-0.5%12.0%MN
-13.4%21.5%15.6%25.7%-7.8%-5.6%7.6%IN11.1%29.1%14.8%5.8%-5.1%3.3%8.2%IL-24.3%23.9%10.5%-7.4%-10.6%-13.8%3.9%IA
Leading Demographic Indicators:Wisconsin Compared to other MHEC states and the National Average
18

MHEC in Wisconsin
*State Higher Education Executive Officers, State Higher Education Finance, FY 2004. Tax revenue per capita includes revenue generated through taxation by both state and local governments. The Effective Tax Rate is equal to a state’s actual tax revenue divided by its total taxable resources.
9.2%7.9%13.93138U.S.10.4%8.8%16.73421WI
9.7%8.8%11.23051MI8.7%7.8%18.92941KS
8.7%8.5%29.13170OH8.8%7.9%20.93077NE8.3%7.9%27.02727ND7.6%7.2%26.92667MO10.1%8.5%17.53673MN
8.6%7.5%17.02759IN8.6%7.8%18.93303IL9.5%7.6%10.42837IA
Effective Tax Rate, 1992*
Effective Tax Rate, 2002*
Percent increase in tax revenue, 1992 to 2002 (adjusted for inflation)*
Tax revenue per capita (2002)*
State
Leading Financial Indicators:Wisconsin Compared to other MHEC states and the National Average
19

MHEC in Wisconsin
1All data in the table are from the National Center for Public Policy and Higher Education, Measuring Up 2004.2The average of the five states nationally with the highest scores in a given area.
81%66%41%59%94%Top performing states2
81%56%36%58%89%WI
66%36%27%40%89%MI
61%54%23%47%87%OH
80%n/a38%61%90%NE73%54%35%53%97%ND66%n/a34%55%91%MO92%n/a30%49%93%MN
70%n/an/an/a88%KS79%29%30%46%89%IN70%n/an/an/a87%IL80%n/a39%50%94%IA
7th to 12th graders taught by teachers with a major in their
field (1999-2000)
12th graders taking at least one upper-level
math course (2001-02)
9th to 12th graders taking at least one
upper-level science course
(2001-02)
9th to 12th graders taking at least one upper-level math course (2001-02)
18-24 year-olds with a high school credential
(2002)State
Postsecondary Preparation:Wisconsin Compared to other MHEC states
& “Top Performing” States in the Nation1
20

MHEC in Wisconsin
1Information in this table is from the National Center for Public Policy in Higher Education, Measuring Up 2004, with data from Thomas Mortenson and Postsecondary Education OPPORTUNITY, U.S. Census Bureau, ACT, and the National Center for Education Statistics2”Chance for college” is defined as the relative probability that a student entering ninth grade will finish high school in four years and proceed directly to college.3The average of the five states nationally with the highest scores in a given area.4The sample size for this measure was too small to provide an accurate percentage figure.
2164%84%63%5.4%40%52%Top performing states3
1554%79%47%4.1%38%40%MI1850%74%51%4.4%37%50%KS
2057%81%49%3.7%31%45%WI
Certificates, degrees, and diplomas awarded
at all institutions per 100 undergraduates
(2001-02)
First-time, full-time students earning a bachelors within 6 years of enrollment
(2001-02)
First to second year persistence of full-time students at
four-year institutions (2000-01)
First to second year persistence of full-time students at
two-year institutions (2000-01)
25-49 year-olds enrolled part-time in
any type of postsecondary education 2001
18-24 year-olds enrolled in college
(2002)
Chance for college by age 19 (2000)2
State
1754%75%55%3.2%34%39%OH1850%76%52%4.2%38%50%NE1944%72%n/a42.3%42%58%ND1853%76%52%3.9%32%39%MO1955%80%56%3.7%36%53%MN
1754%77%53%3.2%30%41%IN1758%79%53%4.9%33%42%IL2162%79%50%3.0%36%52%IA
Postsecondary Participation, Persistence, and Completion:Wisconsin Compared to other MHEC statesand “Top Performing” States in the Nation1
21

MHEC in Wisconsin
1National Center for Public Policy in Higher Education, Measuring Up 2004. (Data from U.S. Census Bureau).2Institute for Higher Education Policy, The Investment Payoff (Data from Current Population Survey, 2004 or 2000).*U.S. Census Bureau, Current Population Survey, 2002.
67%70%25%WI
71%96%27%MI
44%89%26%OH83%75%29%NE80%70%27%ND65%73%28%MO47%84%31%MN
68%71%32%KS61%89%24%IN37%89%29%IL76%61%28%IA48%93%26%*U.S.
Difference in unemployment rates, bachelors degree vs. high school diploma (2004)2
Difference in personal income, bachelors degree vs. high
school diploma (2004)2
Population 25-64 years old with a BA or higher (2000-
2002 average)1
State
Benefits of Higher Education:Wisconsin Compared to other MHEC States and the National Average
22

MHEC in Wisconsin
1National Center for Public Policy in Higher Education, Measuring Up 2004. Data from National Center for Higher Education Management Systems, National Center for Education Statistics, U.S. Office of Postsecondary Education, and the U.S. Census Bureau.2State Higher Education Executive Officers, State Higher Education Finance, FY 2004.3Figures include both student and parent loans, but do not include loans originating from state sources or private loans (including credit card debt). The figure is therefore not an accurate measure of total student borrowing, which would be higher than the figures listed.
$2,96315%44%50%45%32%22%MI
$3,07617%28%38%54%22%18%WI
Average federal undergraduate student
loan, 20031,3
Percentage of average income needed for the poorest 20% of families to pay
tuition at the states lowest-priced
colleges, 2003-041
Family share of public higher
education operating revenues (1994)2
Family share of public higher
education operating revenues (2004)2
Percentage of average annual family income
needed to pay for private 4-year
college expenses minus financial aid,
2003-041
Percentage of average annual family income
needed to pay for public 4-year
college expenses minus financial aid, 2003-041
Percentage of average annual family income
needed to pay for public 2-year
college expenses minus financial aid,
2003-041
State
$3,38022%45%49%62%36%27%OH$3,09613%27%38%48%24%18%NE$2,79322%34%40%34%25%22%ND$3,24015%39%38%50%28%20%MO$3,05020%31%42%50%23%19%MN
$3,20414%30%36%46%23%19%KS$3,23118%40%49%61%29%24%IN$3,61514%21%27%62%30%21%IL$2,96119%34%47%54%28%24%IA
$3,34414%31%36%68%29%22%U.S.
Affordability of Higher Education: Wisconsin Compared to Other MHEC States and the National Average
23

MHEC in Wisconsin
1State Higher Education Executive Officers, State Higher Education Finance, FY 2004. Data is adjusted for regional cost of living, the relative mix of enrollments by institutional type, and 2004 dollars1State Higher Education Executive Officers, State Higher Education Finance, FY 2004. Adjusted to 2003 or 2004 dollars3National Association of State Student Grant and Aid Programs4Data by sector not available. Total need-based student aid awarded in Nebraska in 2003-04 was $8.74 million.
24.2648.59.18.1-9.5266-17.7560995.9%6.8%WI
66.6130.728.28.3-0.8244-7.5542558.0%8.5%MI
37.6183.486.55.95.5192-7.5427772%9.7%OHn/a4n/a412.311.0-2.9330-4.55256100%1,8%NE
0.2681.0814.311.8-2.2316-17.2446476.7%0.9%ND15.379.747.47.16.4183-13.0718560.9%4.9%MO39.3862.348.67.1-9.9254-13.0531499.9%9.4%MN
7.536.4711.510.1-2.53072.35586100%2.1%KS62.1685.878.37.73.8220-11.6460461.3%18.1%IN147.50175.237.78.010.52628.2648791.3%13.8%IL40.963.2610.49.7-11.1265-30.1495399.1%6.7%IA1481.92358.87.67.63.5239-4.4572173.8%10.2%U.S.
PrivateNot-for-Profit
In-State
PublicIn-State
199320031994-2004change
20041994-2004 change
2004
State Need-Based Grant Aid Awarded by Sector, 2003-04
(in millions)3
State and Local Appropriations for Higher
Education as a Percentage of Tax Revenue and Lottery
Proceeds (2003)2
State and Local Appropriations for Public
Higher Education Operating Expenses per capita2
State and Local Appropriations for Public
Higher Education Operating Expenses per FTE1
Percentage of Total Grant
Aid Awarded Solely on the Basis of Need
(2003-04)
Total State Grant Expenditures (Need and Merit Based) as
a %age of Higher Education
Operating Expenses (2003-04)
State
Higher Education Funding: Wisconsin Compared to Other MHEC States and the National Average
24

MHEC in Wisconsin
Good Work & Improving –
Preparation
9-12 grade course-taking in math and science increasing
Scores on advanced placement tests improving but still relatively low
Increasing percentage of secondary schools taught by qualified teachers
MEASURING UP-2006 REPORT CARD
25

MHEC in Wisconsin
MEASURING UP-2006 REPORT CARDGood Work & Improving –
Participation
Chance for college by age 19 is high
Completion
Good college retention and completion rates
Ethnic completion rate differences are comparatively low
Percent of population with bachelor’s degree increased substantially in past 12 years
26

MHEC in Wisconsin
Warning Signs -
Preparation & ParticipationSmall percentage of 8th graders taking algebraPercent of adults enrolled in college work is decliningContinued significant gap in ethnic participation rates
AffordabilityInvestment in need-based aid is comparatively low but improved since 1992Percent of family income needed to pay for college is rising
MEASURING UP-2006 REPORT CARD
27

MHEC in Wisconsin
Larry A. Isaak, President612-626-8292 [email protected]
Midwestern Higher Education Compact1300 South Second Street, Suite 130Minneapolis, MN 55454-1079612-626-8288 Fax: 612-626-8290
CONTACT MHEC
28