Embed Size (px)
Citation preview

January 2020 Ministry of Housing, Communities and Local Government
Gender pay gap report Report as of 31 March 2019

© Crown copyright, 2020
Copyright in the typographical arrangement rests with the Crown.
You may re-use this information (not including logos) free of charge in any format or medium, under the terms of the Open Government Licence. To view this licence visit http://www.nationalarchives.gov.uk/doc/open-government-licence/version/3/
This document/publication is also available on our website at www.gov.uk/mhclg
If you have any enquiries regarding this document/publication, complete the form at http://forms.communities.gov.uk/ or write to us at:
Ministry of Housing, Communities and Local Government Fry Building 2 Marsham Street London SW1P 4DF Telephone: 030 3444 0000
For all our latest news and updates follow us on Twitter: https://twitter.com/mhclg
January 2020

3
Contents
Background 4
Gender pay gap for the MHCLG Group 5
Pay quartile distribution for the MHCLG Group 6
Bonus pay for the MHCLG Group 7
Data methodology and approach 8
Tackling the MHCLG Group gender pay gap 9
MHCLG: Core Department gender pay gaps 9
Annex A: Group structure and gender balance 16
Annex B: The Planning Inspectorate – gender pay gap analysis 17
Annex C: Queen Elizabeth II Conference Centre – gender pay gap analysis 23

4
Background In 2017, the Government introduced world-leading legislation that made it statutory for organisations with 250 or more employees to report annually on their gender pay gap. Government departments are covered by the Equality Act 2010 (Specific Duties and Public Authorities) Regulations 2017 which came into force on 31 March 2017. These regulations underpin the Public Sector Equality Duty and require the relevant organisations to publish their gender pay gap data by March annually, including mean and median gender pay gaps; the mean and median gender bonus gaps; the proportion of men and women who received bonuses; and the proportions of male and female employees in each pay quartile.
The gender pay gap shows the difference in the average pay between all men and women in a workforce. If a workforce has a particularly high gender pay gap, this can indicate there may be a number of issues to deal with, and the individual calculations may help to identify what those issues are.
The gender pay gap is different to equal pay. Equal pay deals with the pay differences between men and women who carry out the same jobs, similar jobs or work of equal value. It is unlawful to pay people unequally because they are a man or a woman. MHCLG supports the fair treatment and reward of all staff irrespective of gender.
This report fulfils the gender pay gap reporting requirements, analyses the figures in more detail and sets out what we are doing to close the gender pay gap in the organisation.
Organisational context for gender pay gap reporting
For the Ministry of Housing, Communities and Local Government Group, our overall gender pay gap figures incorporate data for The Planning Inspectorate and the Queen Elizabeth II Conference Centre as well as the core Department. A total of 2,877 people are included in the dataset, with women making up 50%. This compares to a figure of 49% for women in 2018.
This is the third annual report on gender pay gaps in the MHCLG Group and we remain committed to analysing and investigating any gender pay gaps and ensuring that we put in place the correct action plans to address them. Gender pay gaps in the core Department are modest, in part because of the even distribution of men and women throughout the organisation. However, for the Planning Inspectorate the gender pay gaps are more structural, and it is our priority to find the best possible interventions to deal with these issues without introducing new biases in recruitment.

5
Gender pay gap for the MHCLG Group The Group (MHCLG core department and agencies) shows a mean pay gap of 4.3% and a median pay gap of 6.0%. Whilst the mean gap has widened slightly from 3.1% since the reporting exercise for 2018, the median gap has narrowed from 7.7%.
Gender pay gap results vary in different parts of the Group:
Mean Gender Pay Gap Median Gender Pay Gap
2019 2018 2019 2018 MHCLG core 1.3% 0.9% 0.4% 0.3% PINS 15.3% 11.4% 26.2% 25.8% QEII* -8.0% -9.9% -1.9% -14.7%
Female, 50.0% Male, 50.0%
Proportion of male and female full-pay relevant staff-in-post as of 31st March 2019
4.3%6.0%
1.3% 0.4%
15.3%
26.2%
-8.0%
-1.9%
-10.0%
-5.0%
0.0%
5.0%
10.0%
15.0%
20.0%
25.0%
30.0%
Mean Median Mean Median Mean Median Mean Median
MHCLG Group MHCLG CoreDepartment
PINS QEII
Mean and Median Pay Gap by Organisation - 31st March 2019
6
*In the case of the Queen Elizabeth II Conference centre the negative pay gap indicates that women are paid more than men at both the average and median positions.
MHCLG has demonstrated its wholehearted commitment to equality of opportunity over a sustained period of several years, taking concrete steps to help us build a more inclusive and diverse organisation. We have an ambitious diversity and inclusion strategy, targeted at bringing in and advancing a diverse workforce, at all levels, including at our most senior levels. The objective of our strategy is that MHCLG should be one of the most diverse employers by 2020.
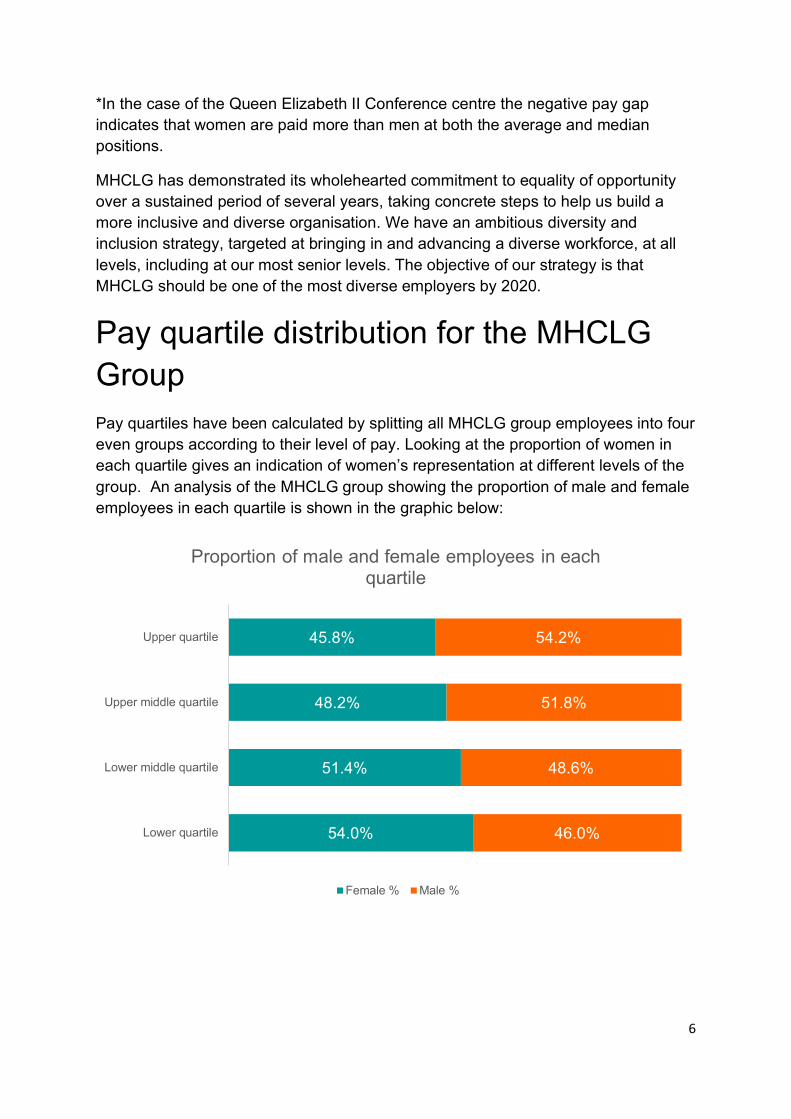
Pay quartile distribution for the MHCLG Group Pay quartiles have been calculated by splitting all MHCLG group employees into four even groups according to their level of pay. Looking at the proportion of women in each quartile gives an indication of women’s representation at different levels of the group. An analysis of the MHCLG group showing the proportion of male and female employees in each quartile is shown in the graphic below:
54.0%
51.4%
48.2%
45.8%
46.0%
48.6%
51.8%
54.2%
Lower quartile
Lower middle quartile
Upper middle quartile
Upper quartile
Proportion of male and female employees in each quartile
Female % Male %

7
Bonus pay for the MHCLG Group Bonus pay is included in all gender pay gap calculations. This included in-year Exceptional Performance schemes (cash awards and vouchers); end of year bonuses for a defined proportion of staff and specific profit-related incentive arrangements at the Queen Elizabeth II Conference Centre. More women (50.3%) received a bonus in the 12 months ending 31 March 2019 than men (47.2%), and similarly the average bonus paid to women (£264) was higher than the average bonus amount received by men (£227).
50.3%
47.2%
% of FemalePopulation
% of Male Population
Proportion of Men and Women paid a bonus during 2019

8
3-Year Comparison Table for MHCLG Group
Gender pay gap mandatory figures and comparison with previous years
2016/17 2017/18 2018/19
Mean gender pay gap - Ordinary pay 5.9% 3.1% 4.3%
Median gender pay gap - Ordinary pay 9.8% 7.7% 6.0% Mean gender pay gap - Bonus pay in the 12 months ending 31 March
19.4% -5.1% -16.5%
Median gender pay gap - Bonus pay in the 12 months ending 31 March
-33.3% 0.0% 0.0%
The proportion of male and female employees paid a bonus in the 12 months ending 31 March:
Male 44.0% 49.0% 47.2%
Female 47.0% 55.0% 50.3%
Data methodology and approach This year our gender pay gap data has been aligned with Annual Civil Service Employment Statistics (ACSES) supplied to the Cabinet Office for the period ending 31st March 2019. As part of this approach, each full-pay relevant employee’s hourly rate of pay has been determined using full-time equivalent salaries and contracted weekly hours. Permanent and pensionable allowances, non-consolidated performance payments, and salary sacrifice deductions are all incorporated to ensure that the methodology is consistent with reports produced in previous years. The department is satisfied that this complete and comprehensive approach is wholly consistent with the actual salary, hours and earnings (ASHE) approach applied in each of the last two years.

9
Tackling the MHCLG Group gender pay gap MHCLG is committed to closing our gender pay gap, as a key part of our overarching ambition to have skilled, talented, committed, diverse and high performing people, supported by effective leaders. Evidence suggests that our actions over the last year have contributed towards closing the gender pay gaps at the median, whilst the position at the mean has marginally regressed.
Each of our organisations has been directed to formulate a plan to address their gender pay gaps. The action plan for the core Department is set out below. Annex B and Annex C set out detailed action plans for The Planning Inspectorate Queen Elizabeth II Conference centre.
MHCLG: Core Department gender pay gaps While the gender pay gaps reported for the MHCLG core department last year were 0.9% at the mean and 0.3% at the median, our gender pay gaps have increased marginally this year. The gender pay gap for the core department as at 31 March 2019 is 1.3% at the mean and 0.4% at the median. Whilst this change is disappointing, it is worth noting that the change in the mean gap amounts to just a 9 pence increase in the difference in the hourly rate of pay – so whereas in 2018 there was a 21 pence difference between the average female hourly rate and the average male hourly rate, this has increased to a 30 pence difference between the average female hourly rate and the average male hourly rate. MHCLG has employed 732 new staff between 31 March 2018 and 31 March 2019, and so our dataset is substantially changed from that on which previous analysis was based. To further add to that point, 266 of the staff included in last year’s report have left the Department in the time since.
An analysis of the gender pay gaps by grade for the core department shows the following:

10
Gender pay gaps at the mean have narrowed for half of grades, namely SCS2, SCS1, G6 and SEO.
Within the Senior Civil Service (SCS) the gap at Director level has continued to narrow from 8.7% last year to 8.3% this year as a result of a number of female Director appointments above the pay range minimum. However the gender pay gap for this grade continues to be impacted by outliers. At Deputy Director level the gap has closed from 3.9% last year to 3.2% this year following a number of external appointments at pay above the pay range minimum. For SCS recruitment, we scrutinise all new appointments to ensure that we benchmark appropriately and that any differentials in pay offer are justified in terms of skills and experience. At G6 level we have appointed a number of female specialists which has contributed to a close in the mean gap from 2.6% to 1.6%.
At AO level the gender pay gap has widened from 2.9% in 2018 to 4.0% in 2019. Gender pay gap calculations do not differentiate on region – whilst we have 78 AOs in total (43 female, 35 male), 80% of male AOs are based in London where the AO starting pay is £25,847pa and the spot rate is £26,344pa. This increase in the gender pay gap is caused by new female appointments in the regions, where the starting pay is £22,194pa and the spot rate is £22,621pa. This year as part of the annual pay

11
remit we are moving all AOs below the spot rate onto the spot rate, but the geographical differences in the spot rates will remain.
The EO gender pay gap, which closed in 2018 impacted by the volume of new male EO appointments, has remained exactly the same at 1.3% at the mean.
An analysis of the quartile distribution for the core department by grade shows a relatively even distribution of men and women in all quartiles which plays a large part in explaining our modest gender pay gaps.
MHCLG Core Department Pay Quartiles Female Female % Male Male %
Upper quartile 268 51.2% 255 48.8%
Upper middle quartile 267 51.2% 254 48.8% Lower middle quartile 269 51.6% 252 48.4%
Lower quartile 271 52.0% 250 48.0% MHCLG Core Department Total 1075 51.5% 1011 48.5%
Closing the gender pay gap
Whilst there have been marginal changes in our overall position since last year, MHCLG is encouraged by progress towards closing the gender pay gap in the department, especially in senior management grades. We will continue to work closely with our arms lengths bodies to address the gender pay gap across the Group. Our pay policy ensures that men and women in equivalent roles receive the same pay.
We go above and beyond our legislative responsibilities, ensuring that equality is an integral part of all our activities, including people management processes and procedures. We are acting to close the gender pay gap through a number of interventions:
Diversity, inclusion and equality in MHCLG
MHCLG is fully committed to equality of opportunity for all its people. Our Permanent Secretary Melanie Dawes takes pride in her role as Civil Service D&I Champion, having previously held the role of Gender Champion. We have taken concrete steps within our diversity and inclusion strategy to improve representation and inclusion for different demographic groups, including a focus on gender. MHCLG published a new
12
diversity and inclusion action plan in January 2019 under the three strategic aims of ‘Bring In’, ‘Bring On’, and ‘Inclusive’.
The department offers a range of support and development opportunities for women. We have an active MHCLG’s Women’s Network who share regular blogs, support policy development and run events to promote gender equality. The network is sponsored by a departmental Gender Champion who is part of the Executive Team.
Celebrating gender equality and intersectionality
We will continue to support, fund and encourage the Women’s Network to celebrate and champion gender equality. In addition, we have started to encourage opportunities for cross-network collaboration in order to support intersections between gender and other demographic groups.
• Throughout 2019 we ran a campaign called “We are for everyone”, which through posters and personal blogs, shared the stories and experiences of our people. This had a focus on intersectionality, with women sharing their personal stories from their perspective of part-time worker, EU National, ethnic minority and first generation to attend university. The intention was to promote the message that everyone has the opportunity to have a successful career in MHCLG and that “we are open, inclusive and we listen”, one of our departmental principles.
• In 2019 we started to facilitate staff networks working together through regular departmental meetings and a Network Leadership Summit, and this work will continue in the future. There are several staff networks that interconnect with gender equality; Flexible Working; Parents; Carers; LGBT+; BAMEnet, Social Mobility and Faith networks to name some.
• In 2019 we ran a Network Leadership Summit with an external partner, bringing staff network leaders together to explore opportunities for collaboration and to share best practice. We have funded places for individuals to attend a leadership programme specifically developed for leaders of staff networks, including a place for the Women’s Network Co-chair.
We plan to build on this work and continue promoting opportunities for the Women’s network to interconnect with other groups in order to promote gender equality in the broadest sense.

13
Family Friendly HR policy:
MHCLG has a culture of supporting and encouraging flexibility, and will challenge assumptions about traditional ways of working, taking account of the needs of our work, customers and employees. We will continue to:
• Promote the sharing of parental leave so that women can best manage their maternity provision where at least one partner works for the department.
• Provide additional resources to support families and working parents, including the Employee Assistance Program (EAP), which provides individual support for carers and managers; special leave, which provided carers with additional leave for important events or emergencies involving a dependent; and a carers passport, to identify problems in the workplace related to their responsibilities and solutions to alleviate these issues.
Accountability and transparency:
MHCLG has focused on greater accountability and transparency to demonstrate, and fulfil, our commitment to equality. To support this, we will continue the work introduced in 2018:
• Conduct an annual analysis of a comprehensive diversity and inclusion data set to measure the impact of our action plan, including reviewing data on reward, development, engagement and promotion by gender. We will use the data to identify any inequalities in experience by gender. Our data set is published internally on the staff intranet to improve transparency. In 2019 we plan to develop greater intersectionality within this analysis to better understand the experiences of different female groups.
• All Senior Civil Servants have committed to at least one personal objective relating to Diversity and Inclusion and at MHCLG these were published for staff to view, with several supporting women to progress or promoting gender equality within the department.
Recruitment, retaining and developing a diverse workforce:
MHCLG’s external recruitment is carried out under Civil Service Commission Principles. All our recruitment must be based on fair and open competition and successful candidates selected on merit. We commit to continue to:
• Ensure all our roles are advertised on the external market by default, which has allowed us to recruit in a more inclusive, open and transparent manner,

14
while creating exceptions for when internal recruitment enables the promotion of diverse mobility and the full utilisation of our talent pool.
• Extend our candidate reach by expanding our use of social media, alternative recruitment, career platforms and network events to attract a wider and more diverse range of candidates.
• Exploit our recruitment platform to the fullest to remove bias and create a more inclusive recruitment experience.
• Adopt the Success Profiles approach by default for all MHCLG recruitment campaigns, encouraging managers to utilise the most appropriate assessment techniques including the use of strength-based questioning at interview.
• Mandate gender-mixed panels for all levels of recruitment including at our most senior roles.
• Encourage recruitment and selection training for hiring managers, colleagues who sift, and those who sit on interview panels to promote diversity and inclusion. Managers are specifically encouraged to attend the “success profiles” training course, which works to provide a comprehensive view of “how to recruit”, including inclusive recruitment and the value of diversity in the workforce. So far we have trained over 800 recruiting managers in this approach to recruitment. We are now rolling out support to candidates too.
Progression:
We aim to help women progress in their careers and achieve their full potential through improving the diversity of our participants in cross-government and internal talent management schemes such as:
• Crossing Thresholds: a 12-month career mentoring programme for women to develop their career aimed at entry level to senior manager grades (AO to G6).
• Positive Action Pathways: a scheme for staff in under-represented groups, aimed at staff in all grades from entry (AA) to senior management (G6). MHCLG has funded significantly more places on this scheme in 2019 than previous years.
• Women’s Leadership Summit: a programme that helps to create a sustainable pipeline of female talent ready to move into Senior Civil Service roles. In 2019 we are also introducing a new leadership summit specifically for women from an ethnic minority background.
• Advance: an internal talent scheme which provides the opportunity for talented staff to apply for positions above their current Grade, with the aim of increasing diversity among HEO-G7 staff.

15
• These programmes aim to overcome barriers and help women compete on equal footing for progression or other Civil Service talent schemes. MHCLG promotes, and will continue to support female applicants, in all cross-government talent schemes across the department.
We will also continue to:
Offer internships to people from under-represented backgrounds through a Summer Diversity Internship Programme and the Early Diversity Internship Programme to provide people with an opportunity to learn about a career in the Civil Service and to prepare them for a place on the central Fast Stream graduate programme.
Declaration
Our calculations followed the legislative requirements as set out in the Equality Act 2010 (Specific Duties and Public Authorities) Regulations 2017. Data has been verified by an analyst and signed off by the Permanent Secretary.
All staff who were deemed to be full paid relevant employees at 31 March 2019 were included. Our data ,includes that of our Executive Agencies. The data set reflects a total workforce of 2877 individuals – MHCLG Core: 2086; Planning Inspectorate: 742 and Queen Elizabeth II Conference Centre: 49

16
Annex A: Group structure and gender balance Women make up more than half of employees at all grades in the MHCLG Group, except for at EO level. A large number of men were recruited at EO level during 2017/18 and women are now underrepresented at this grade. Women are well represented at SCS level, with 5.5% of all female staff working at this level compared with 4.8% of men. This representation for SCS compares favourably with the rest of the Civil Service.
Grade balance for the MHCLG Group as of 31st March 2019
(unrounded)
Number of men (% of men who work at
this grade)
Number of women (% of women who work at this
grade)
% Female
AA/AO 32 3.1% 38 3.5% 54.3% EO 176 17.0% 157 14.3% 47.1%
HEO/SEO 421 40.8% 472 42.9% 52.9% Grade 7/6 354 34.3% 372 33.8% 51.2%
SCS 50 4.8% 61 5.5% 55.0% Total 1,033 100.0% 1,100 100.0% 51.6%
In comparison, this table shows the proportion of men and women at each grade in the Civil Service overall.
Grade balance for the Civil Service as of 31st March 2019
(rounded)
Number of men (% of men who work at
this grade)
Number of women (% of
women who work at this grade)
% Female
AA/AO 6,1770 31.0% 82,680 35.8% 57.2% EO 50,820 25.5% 65,070 28.2% 56.1% HEO/SEO 56,760 28.5% 56,830 24.6% 50.0% Grade 7/6 26,710 13.4% 23,580 10.2% 46.9% SCS 3,300 1.7% 2,670 1.2% 44.7% Total 199,360 100.0% 230,830 100.0% 53.7%
Grade balance information above is taken from the Cabinet Office Civil Service Statistical Release for 2019. These figures include all paid employees in the MHCLG Group and wider Civil Service as of 31st March 2019 and do not bear any correlation to the number of full-pay relevant staff in scope for Gender Pay Gap reporting purposes.
Please note that some non-CS standard roles are mapped to an equivalent Civil Service grade for the purpose of the Cabinet Office collection.

17
Annex B: The Planning Inspectorate – gender pay gap analysis Context
The pay gap reported as at 31st March 2018 was 11.4% at the mean, the current gender pay gap has increased by 3.9 percentage points to 15.3%. We are disappointed that there has been an increase in our gender pay gap in the year and the Chief Executive of PINS remains committed to implementing plans and initiatives to address current pay gaps, and this is a priority for the PINS Executive team. We have undertaken thorough analysis of our workforce and structure to understand the reasons and are confident that we have robust plans and actions in place to address the gap. Like other professions and industries, we are working hard to improve our gender balance and reward but will have a long lead time in correcting the gender imbalances of the past.
Organisation structure and gender balance
The Planning Inspectorate has two distinct groups of staff: office-based staff and home-based Inspectors who determine Planning Appeals throughout England and Wales. Office-based staff follow the traditional Civil Service grading structure. Inspectors are graded into three bands according to the complexity of the casework: Band 1 being the least complex and Band 3 the most complex.
Table 1 shows the salary scales and the number of staff in each grade.
Male Female Total Male Female Minima MaximaSCSPB2 1 1 100.0%SCSPB1 4 1 5 80.0% 20.0%Professional Lead 2 1 3 66.7% 33.3% £78,887 £78,887G6 3 4 7 42.9% 57.1% £62,938 £71,423G7 6 9 15 40.0% 60.0% £52,057 £58,166SEO 18 20 38 47.4% 52.6% £38,835 £42,523HEO 36 30 66 54.5% 45.5% £31,184 £33,890EO 51 48 99 51.5% 48.5% £24,882 £26,761AO 59 95 154 38.3% 61.7% £20,306 £21,931AA 5 8 13 38.5% 61.5% £17,233 £18,429APP EO 1 1 100.0%APP AO 2 13 15 13.3% 86.7% £17,260 £17,260Professional Staff 187 230 417 44.8% 55.2%
BAND 3 36 25 61 59.0% 41.0% £69,121 £75,254BAND 2 81 31 112 72.3% 27.7% £56,345 £63,450BAND 1 98 59 157 62.4% 37.6% £41,015 £49,679Inspectors 215 115 330 65.2% 34.8%
PINS 402 345 747 53.8% 46.2%
Percentage

18
The gender pay gap at the Planning Inspectorate is structural - the overall gender pay gap of 15.3% is directly attributable to the large proportion of our senior Inspectors being male and a large portion of our AO and APP AO (apprentice) population in our casework and corporate services teams being female.
This structural imbalance was further accentuated this year when we launched a recruitment campaign for administration apprentices. This campaign attracted a large volume of female applicants and the most meritorious, all female, were hired. Likewise in our AO roles a large campaign to recruit fixed term AO resource to aid performance recovery resulted in 59% of accepted offers being females.
Inspectors on the other hand, are recruited from Architects, Town Planners, Surveyors, Legal Profession and Civil Engineers which are all male dominated. The Royal Town Planning Institute (RTPI) has this year launched studies into diversity in the sector and more specifically into the attraction and progression of females in the planning profession. The RTPI estimates that around two fifths of planners are female which is reflected by the RTPI’s UK Planning Profession 2019 study which shows membership is 39% female. The study has shown though that across planning schools and new entrants to the profession there is generally a 50:50 split between men and women which informs our focus on outreach and developing new entry points to the profession.
Our analysis illustrates that the equal pay gap within most of our grades is quite narrow, further supporting the structural explanation for the imbalance. In Table 2 below, the mean equal pay gap is shown for each CS equivalent grade level, and with the exception of SCS2 and SCS1, most equal pay gaps are small or advantage women providing evidence of a gender-neutral pay approach for equivalent roles and no overt underlying Equal Pay issues. The SCS population is very small (6 people) including Sarah Richards, CEO and her leadership team.

19
Table 2
Mean Average Equal Pay Gap by CS Equivalent Grade
Grade Mean Equal Pay Gap Female Incumbents Male Incumbents
SCS2 -100.0% 1 0
SCS1 12.3% 1 4
G6 -1.2% 60 118
G7 -1.7% 68 104
SEO 2.6% 20 18
HEO 0.2% 30 36
EO -1.0% 48 52
AO 2.2% 108 61
AA 0.1% 8 5
Overall 15.3% 344 398
Table 2 shows that more than a third of all women at PINS are either AOs or AAs. On the other hand, more than half of the men in the organisation are G7 and above.
This uneven distribution of genders through the grades has a significant impact on gender pay gaps, more easily understood by looking at the quartile distribution of pay – which shows that the upper and upper middle pay quartiles are predominantly filled by men and the lowest pay quartile is predominantly filled by women.
PINS Pay Quartiles Female Female % Male Male %
Upper quartile 64 34.6% 121 65.4% Upper middle quartile 71 38.2% 115 61.8%
Lower middle quartile 92 49.5% 94 50.5% Lower quartile 117 63.2% 68 36.8%
PINS TOTAL 344 46.4% 398 53.6%

20
Progress and action plan
For the Planning Inspectorate it has been a year of change which has seen us moving through organisational design, digital upgrades, process review and performance recovery. This programme of activity has resulted in a new business strategy, a people strategy, and mass recruitment campaigns, all of which have had or will influence the gender pay gap. Included in our people strategy is a core strand of diversity and inclusion, we are in the process of finalising our diversity and inclusion strategy and procuring an independent expert to assure the robustness of this strategy and its resultant plan. Currently we are in a period of organisation development and we are designing and implementing a new structure and reward plans working with Trade Unions that will be complete in April 2020. In this period the organisation has grown from 644 to 747, 742 of whom meet the definition of full-pay relevant for gender pay gap reporting.
As part of our recruitment campaign we partnered with the Government Recruitment Service and used the services of occupational psychologists to ensure the advertising pack would appear to both men and women. We were also active in focusing our marketing to ensure women were represented, including using female senior leaders from the Inspectorate.
This year we introduced a new level of inspector, the Appeals Planning Officers (APOs), as a training route to the role of B1 Inspector. We have been encouraged by the high number of female applicants to this role and to inspector roles in recent campaigns but disappointed that this does not translate into a proportionate number of hires this year. This is an important element of our longer term strategy to reduce the gender pay gap by growing our own pipeline for Inspector roles.
We are undertaking a lessons learnt on the campaign to reduce the drop-out rates for female applicants between application and appointment. This conversion is reinforced by research from the RPTI which shows that in planning education and at entry point to the profession there is a 50:50 split of males and females which drops to a 40:60 split as they progress. This work will become part of our wider talent and progression strategy and so in the long term this role and its progression routes form part of our strategy to address the gender pay gap and encourage more women to become Inspectors.
Table 3 gives a breakdown by gender of the number of people who applied for all Inspector roles and APOs and the percentage who were successful for each. It shows that the 37% of successful applicants were female, similarly females only represented 39% of applicants. These figures mirror the RTPI research into the planning sector. This highlights one of the challenges PINS faces in addressing the gender pay gap.

21
Applicants Breakdown by Grade
Applicants -Male
Applicants - Female
Total Applicants
% Male Applicants
% Female Applicants
B1 89 58 147 61% 39% B2 90 38 128 70% 30% B3 18 6 24 75% 25% APO 34 46 80 43% 58% Total 231 148 379 61% 39%
Hired Breakdown by Grade
Hired - Male Hired -Female Total Hired % males hired of total applicants
% females hired of total applicants
B1 39 25 64 61% 39% B2 31 17 48 65% 35% B3 4 1 5 80% 20% APO 12 8 20 60% 40% Total 86 51 137 63% 37%
Table 3a shows the conversion rates from application to hire:
Applicants Breakdown by Grade
% Male Applicants
% males hired of total applicants
% Female Applicants
% females hired of total applicants
B1 61% 61% 39% 39%
B2 70% 65% 30% 35%
B3 75% 80% 25% 20%
APO 43% 60% 58% 40%
Total 61% 63% 39% 37%
Highlighted in teal are the conversion rates which advantaged females, in yellow the rates which advantaged males. The Band 1 Inspector recruitment process did not advantage either gender and the Band 2 Inspector recruitment process advantaged females. B3 and APO processes advantaged men; making up 75% and 43% of the applicants respectively but translating as 80% and 60% of the recruits. We are initiating a full review of the Band 3 recruitment process. In October Diversity & Inclusion consultants will be delivering a review into all recruitment processes in particular the bulk campaigns to ensure there are no hidden biases in our processes.
In the 2018 pay remit, we revalorised the minimum pay ranges to 30% of the pay range; 35% for the Inspector cohort to shorten the pay ranges. There are now 322 staff at the bottom of the salary scales and this splits evenly 52% male and 48% female. The top of the salary scale also shows an even split 51% male and 49%

22
female. However when you look at Inspector grades (Band 1 to Band 3) there are more men (74%) than women (26%) at the top of the salary scale. Further data can be referenced in Table 1. Future pay strategy to continue to consolidate salary at the bottom of the salary scale and limit increases at the top of the scale will support narrowing the gender pay gap.
To further our understanding of the cultural and organisational factors that affect the gender pay gap, two members of the HR team have received specific training from a national authority on the subject. This has built the capability in the team to help address it.
Diversity, inclusion and equality in the Planning Inspectorate This year we will finalise our Diversity and Inclusion strategy to create an inclusive organisation that reflects the people who use our services. The strategy aim is to bring about inclusive behaviours as well as get some of the hard measures right. In addition to the initiative noted above such as reviews of our plans, organisational design, pay and reward with diversity and inclusion central to these we are also undertaking the following:
• The terms and conditions for Inspectors are to be changed to make it easier for those with caring responsibilities to fulfil their potential as an Inspector. To date we have updated the Inspector working patterns to attract candidates with childcare or caring responsibilities.
• Our Chief Executive is championing an outreach programme including student, graduate and apprenticeship opportunities. We are developing this in partnership with the UWE, local schools and diversity networks in our community.
• We are conducting Diversity analysis from the recruitment campaigns to develop strategies to target more female candidates. Initial analysis has been carried out on all volume recruitment. In October External consultants will be engaged to review all recruitment processes from a D&I perspective. This information will be used to better understand attraction rates and fall out rates at the different stages. Improvements to future campaigns are planned to include reviewing the essential criteria requirements for different roles to ensure fair and robust processes.
• We are creating the role of ‘Gender champion’ to provide leadership. Provide a strong voice around senior leadership teams and decision-making groups. Encourage staff to create a Women’s Network to gain better understanding of the barriers to female progression and to provide coaching and mentoring to female staff who wish to progress their career within or outside PINS.
23
Annex C: Queen Elizabeth II Conference Centre – gender pay gap analysis Context
QEII Centre is a small Executive Agency of MHCLG. On 31 March 2019 the Centre employed 49 staff in 37 different roles, many of which are specialist and therefore unique to the work of the Centre (venue operation and technical delivery) rather than the Civil Service. The Centre employs a spot salary system, determining pay on a role-by-role basis rather than through a centralised pay and grading structure. Taken together, the size of the organisation and absence of a clear civil service grading system make comparative analysis of pay and gender difficult and removes any ability to generalise findings.
As at 31 March 2019 the Centre employed 19 women and 30 men, compared with 19 women and 29 men in the previous year. There was very little change in the distribution of men and women across the different grades from last year.
Gender pay gap
The total gender pay gap for the Centre as of 31 March 2019 was -8.0% at the mean (-1.9% median) in favour of women.
Gender pay gaps are impacted by length of service, as those with longer service benefited from the period where pay progression was still in force. In terms of AO to HEO equivalent roles, women on average have longer service than men, contributing to the positive gender pay gap.
However, other factors have contributed to gender pay gaps at senior management levels. Despite the fact that women have longer service here, market forces have impacted the pay of different individuals and as there are only a few employees at senior levels, this has had a disproportionate impact on gender pay gaps.
Bonus pay gap
The Centre operates an annual non-contractual discretionary bonus scheme. The award is calculated based on the performance of the Centre as a whole, determined through the audited accounts. The award is split into corporate performance and individual performance, the latter of which is determined by end-of-year performance assessment, for which a percentage of the individual’s salary is awarded.
The mean average bonus pay for 2018-19 was 42.0% (median 3.6%) higher for women than for men, which is perhaps unsurprising as the bonus is calculated as a

24
proportion of salary which, as discussed above, is on average higher for women than men. Though there are fewer women in the organisation as a whole, three of the four highest-paid individuals who received bonuses (three G6 and one SCS1) are women, compared with six of the 17 lowest-paid individuals (five AOs and 12 EOs). This skews the mean average pay for women upwards when compared with men.
Bonus payments are also pro-rated for new starters in the previous financial year (2017-18) (five males, one female), and are not paid to those starting within the financial year the bonus is paid (2018-19) more of whom were male (five) than female (two) in the last reporting year.
Comparison with previous year
As at 31 March 2018 the Centre’s mean gender pay gap was 9.9% in favour of women (-14.7% at the median). The mean gap has closed moderately to 8.0% in favour of women as at 31 March 2019, whilst the median gap has decreased significantly to -1.9%. In real terms, median female hourly pay increased by just £1.25 from 31 March 2018 to 31 March 2019, while median male hourly pay increased by £3.25 in the same period.
The change in median is likely to be the result of an influx of male new-starters (ten in the last two years compared with just three females) at lower and middle-level grades who have been able to command greater salaries due to market pressures, whilst years of restrictive pay awards have limited the salary increases of incumbent staff. Due to the high proportion of women in the highest paying roles however, this has not impacted the mean average in the same way.
It should also be noted that as a small organisation, differences in the pay of only one or two individuals can have a disproportionate impact to the overall picture.
Progress and action plan
As demonstrated, gender pay gaps at the Queen Elizabeth II Centre are in favour of women. There is little to suggest that gender constitutes a significant factor in salary differentials at the QEII Centre, with market forces and length of service appearing to produce a more reliable impact on pay.
If recruitment trends continue in 2019-20 as they have in the previous two years it is likely that the median average will swing in favour of males next year, even if there were a considerable influx of female new starters: these new starters would not qualify for a bonus in 2019-20 whilst the five men who joined in 2018-19 will, one of them being the new G6 Finance Director, whose salary bonus is likely to have a significant impact. Currently the recruitment processes in place at the Centre do not allow for ready examination of recruitment statistics, and whilst adoption of the

25
Government Recruitment Service-backed VX applicant tracking system will remedy this when implemented in early 2020, work is required before then to determine where the Centre is failing to attract and recruit female candidates, and efforts made to remedy this.
It is also becoming increasingly clear that the pay constraints shown over the last eight years have had a real impact, an impact which, as shown by the comparatively slow growth in median female pay, adversely affects women as they are more likely to remain in role longer than men. The Centre will be putting forward a case for greater flexibility for the 2019-20 pay award and this data further supports the need for doing so.