Embed Size (px)
Citation preview

Resource Planning
MGS4700 Operations Management
Lecture 11
___________________________________
___________________________________
___________________________________
___________________________________
___________________________________
___________________________________
___________________________________
2
Lecture Outline
Material Requirements Planning (MRP)
Capacity Requirements Planning (CRP)
___________________________________
___________________________________
___________________________________
___________________________________
___________________________________
___________________________________
___________________________________
3
Resource Planning for Manufacturing
___________________________________
___________________________________
___________________________________
___________________________________
___________________________________
___________________________________
___________________________________
4
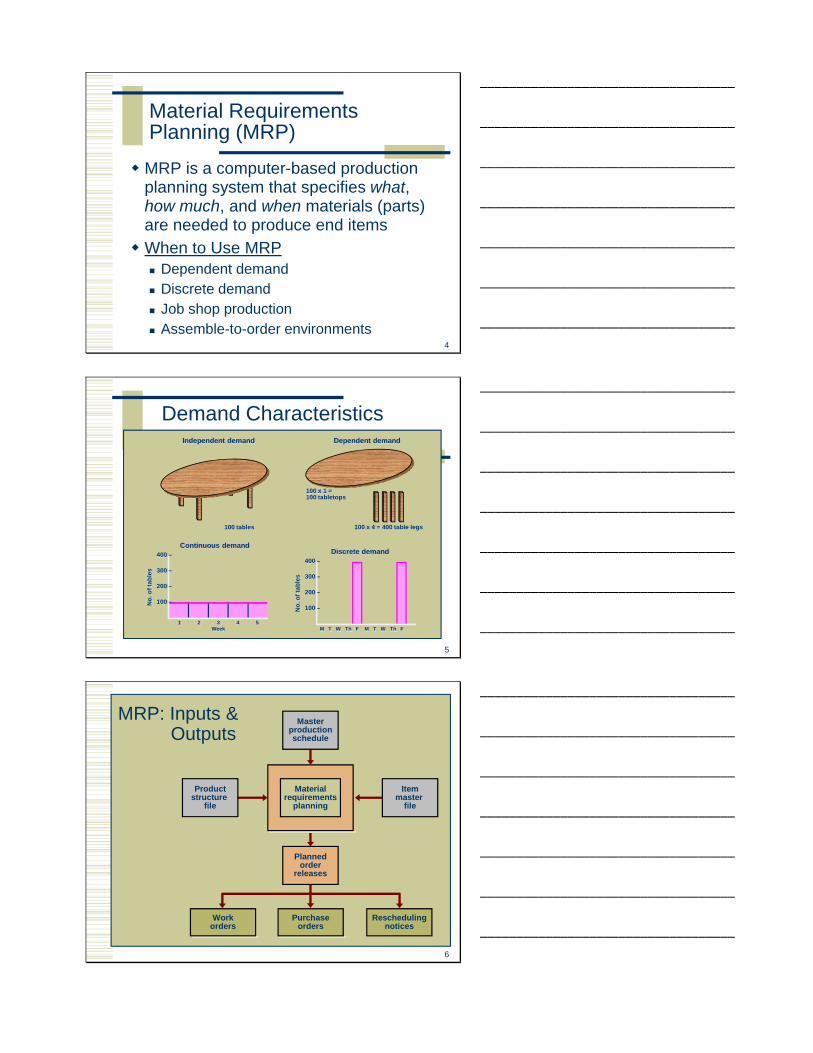
Material RequirementsPlanning (MRP)
MRP is a computer-based production planning system that specifies what, how much, and when materials (parts) are needed to produce end itemsWhen to Use MRP
Dependent demandDiscrete demandJob shop productionAssemble-to-order environments
___________________________________
___________________________________
___________________________________
___________________________________
___________________________________
___________________________________
___________________________________
5
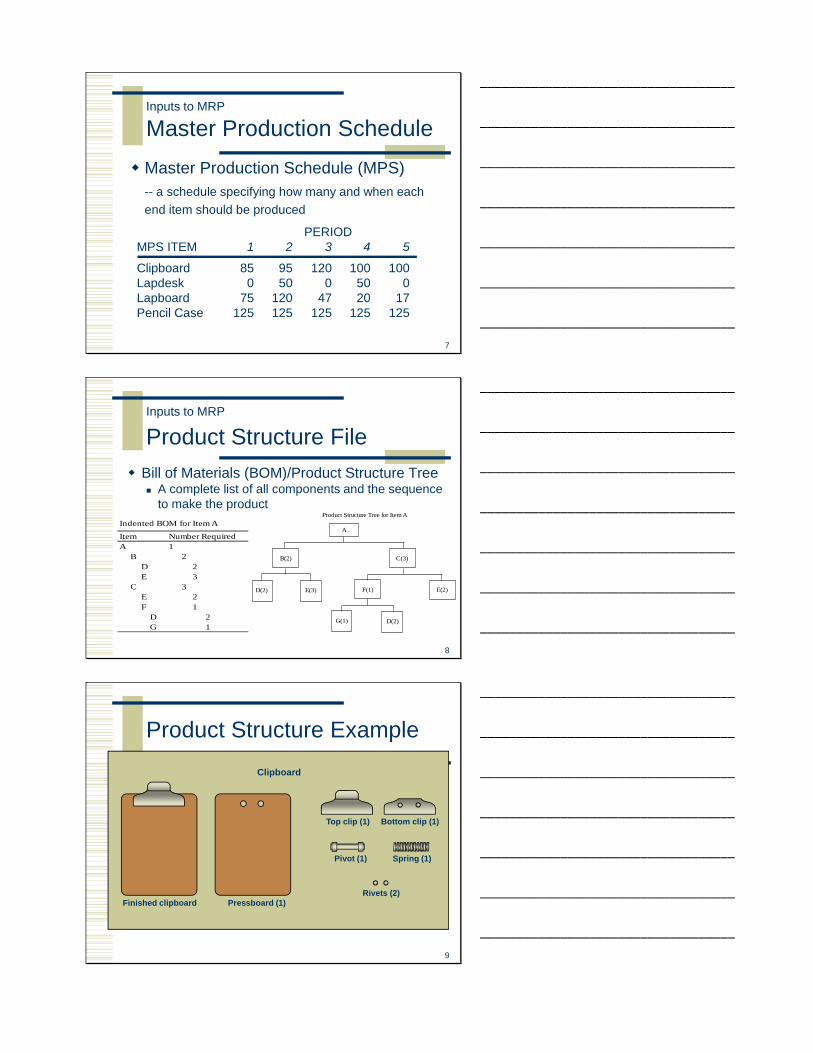
Demand Characteristics
1 2 3 4 5Week
400 –
300 –
200 –
100 –No.
of t
able
s
Continuous demand
M T W Th F M T W Th F
400 –
300 –
200 –
100 –No.
of t
able
s
Discrete demand
Independent demand
100 tables
Dependent demand
100 x 1 = 100 tabletops
100 x 4 = 400 table legs
___________________________________
___________________________________
___________________________________
___________________________________
___________________________________
___________________________________
___________________________________
6
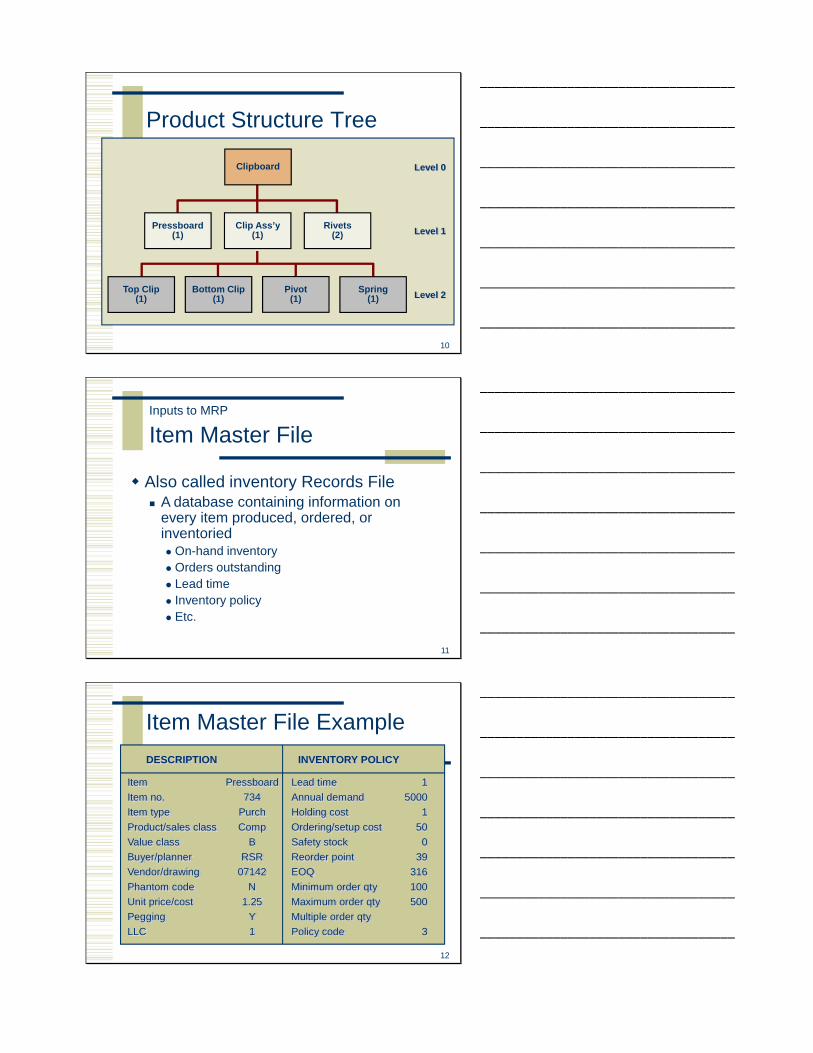
MRP: Inputs & Outputs
Materialrequirements
planning
Planned order
releases
Work orders
Purchase orders
Rescheduling notices
Itemmaster
file
Productstructure
file
Master production schedule
___________________________________
___________________________________
___________________________________
___________________________________
___________________________________
___________________________________
___________________________________
7
Inputs to MRP
Master Production ScheduleMaster Production Schedule (MPS)-- a schedule specifying how many and when each end item should be produced
PERIODMPS ITEM 1 2 3 4 5
Clipboard 85 95 120 100 100Lapdesk 0 50 0 50 0Lapboard 75 120 47 20 17Pencil Case 125 125 125 125 125
___________________________________
___________________________________
___________________________________
___________________________________
___________________________________
___________________________________
___________________________________
8
Inputs to MRP
Product Structure FileBill of Materials (BOM)/Product Structure Tree
A complete list of all components and the sequence to make the product
Indented BOM for Item A
Item Number RequiredA 1 B 2 D 2 E 3 C 3 E 2 F 1 D 2 G 1
Product Structure Tree for Item A
A
B(2) C(3)
D(2) E(3)
G(1) D(2)
E(2)F(1)
___________________________________
___________________________________
___________________________________
___________________________________
___________________________________
___________________________________
___________________________________
9
Product Structure Example
Top clip (1) Bottom clip (1)
Pivot (1) Spring (1)
Rivets (2)Finished clipboard Pressboard (1)
Clipboard
___________________________________
___________________________________
___________________________________
___________________________________
___________________________________
___________________________________
___________________________________
10
Product Structure Tree
Clipboard Level 0
Level 1
Level 2Spring (1)
Bottom Clip (1)
Top Clip (1)
Pivot (1)
Rivets (2)
Clip Ass’y (1)
Pressboard (1)
___________________________________
___________________________________
___________________________________
___________________________________
___________________________________
___________________________________
___________________________________
11
Inputs to MRP
Item Master File
Also called inventory Records FileA database containing information on every item produced, ordered, or inventoried
On-hand inventoryOrders outstandingLead timeInventory policyEtc.
___________________________________
___________________________________
___________________________________
___________________________________
___________________________________
___________________________________
___________________________________
12
Item Master File ExampleDESCRIPTION INVENTORY POLICY
Item Pressboard Lead time 1Item no. 734 Annual demand 5000Item type Purch Holding cost 1Product/sales class Comp Ordering/setup cost 50Value class B Safety stock 0Buyer/planner RSR Reorder point 39Vendor/drawing 07142 EOQ 316Phantom code N Minimum order qty 100Unit price/cost 1.25 Maximum order qty 500Pegging Y Multiple order qtyLLC 1 Policy code 3
___________________________________
___________________________________
___________________________________
___________________________________
___________________________________
___________________________________
___________________________________

13
Item Master File (cont.)PHYSICAL INVENTORY USAGE/SALES
CODES
On hand 100 YTD usage/sales 1100Location W142 MTD usage/sales 75On order 100 YTD receipts 1200Allocated 75 MTD receipts 0Cycle 3 Last receipt 8/25Last count 9/5 Last issue 10/5Difference -2
Cost acct. 00754Routing 00326Engr 07142
___________________________________
___________________________________
___________________________________
___________________________________
___________________________________
___________________________________
___________________________________
14
The MRP Matrix
___________________________________
___________________________________
___________________________________
___________________________________
___________________________________
___________________________________
___________________________________
15
MRP: Example 1
Master Production Schedule
1 2 3 4 5
Clipboard 85 95 120 100 100Lapdesk 0 60 0 60 0
Item Master File
CLIPBOARD LAPDESK PRESSBOARDOn hand 25 20 150On order 175 (Period 1) 0 0(sch receipt)LLC 0 0 1Lot size L4L Mult 50 Min 100Lead time 1 1 1
___________________________________
___________________________________
___________________________________
___________________________________
___________________________________
___________________________________
___________________________________

16
MRP: Example 1 (cont.)Product Structure Diagrams
Clipboard
Lapdesk
Pressboard(2)
Trim(3’)
Beanbag(1)
Glue(4 oz)
Level 0
Level 0
Pressboard(1)
Clip Ass’y(1)
Rivets(2) Level 1
Level 1
___________________________________
___________________________________
___________________________________
___________________________________
___________________________________
___________________________________
___________________________________
17
ITEM: CLIPBOARD LLC: 0 PERIOD
LOT SIZE: L4L LT: 1 1 2 3 4 5
Gross Requirements 85 95 120 100 100Scheduled Receipts 175Projected on Hand 25Net RequirementsPlanned Order ReceiptsPlanned Order Releases
MRP: Example 1 (cont.)
___________________________________
___________________________________
___________________________________
___________________________________
___________________________________
___________________________________
___________________________________
18
MRP: Example 1 (cont.)
ITEM: CLIPBOARD LLC: 0 PERIOD
LOT SIZE: L4L LT: 1 1 2 3 4 5
Gross Requirements 85 95 120 100 100Scheduled Receipts 175Projected on Hand 25 115Net Requirements 0Planned Order ReceiptsPlanned Order Releases
(25 + 175) = 200 units available(200 - 85) = 115 on hand at the end of Period 1
___________________________________
___________________________________
___________________________________
___________________________________
___________________________________
___________________________________
___________________________________

19
ITEM: CLIPBOARD LLC: 0 PERIOD
LOT SIZE: L4L LT: 1 1 2 3 4 5
Gross Requirements 85 95 120 100 100Scheduled Receipts 175Projected on Hand 25 115 20Net Requirements 0 0Planned Order ReceiptsPlanned Order Releases
115 units available(115 - 95) = 20 on hand at the end of Period 2
MRP: Example 1 (cont.)
___________________________________
___________________________________
___________________________________
___________________________________
___________________________________
___________________________________
___________________________________
20
ITEM: CLIPBOARD LLC: 0 PERIOD
LOT SIZE: L4L LT: 1 1 2 3 4 5
Gross Requirements 85 95 120 100 100Scheduled Receipts 175Projected on Hand 25 115 20 0Net Requirements 0 0 100Planned Order Receipts 100Planned Order Releases 100
20 units available(20 - 120) = -100 — 100 additional Clipboards are requiredOrder must be placed in Period 2 to be received in Period 3
MRP: Example 1 (cont.)
___________________________________
___________________________________
___________________________________
___________________________________
___________________________________
___________________________________
___________________________________
21
ITEM: CLIPBOARD LLC: 0 PERIOD
LOT SIZE: L4L LT: 1 1 2 3 4 5
Gross Requirements 85 95 120 100 100Scheduled Receipts 175Projected on Hand 25 115 20 0 0 0Net Requirements 0 0 100 100 100Planned Order Receipts 100 100 100Planned Order Releases 100 100 100
Following the same logic Gross Requirements in Periods 4 and 5 develop Net Requirements, Planned Order Receipts, and Planned Order Releases
MRP: Example 1 (cont.)
___________________________________
___________________________________
___________________________________
___________________________________
___________________________________
___________________________________
___________________________________
22
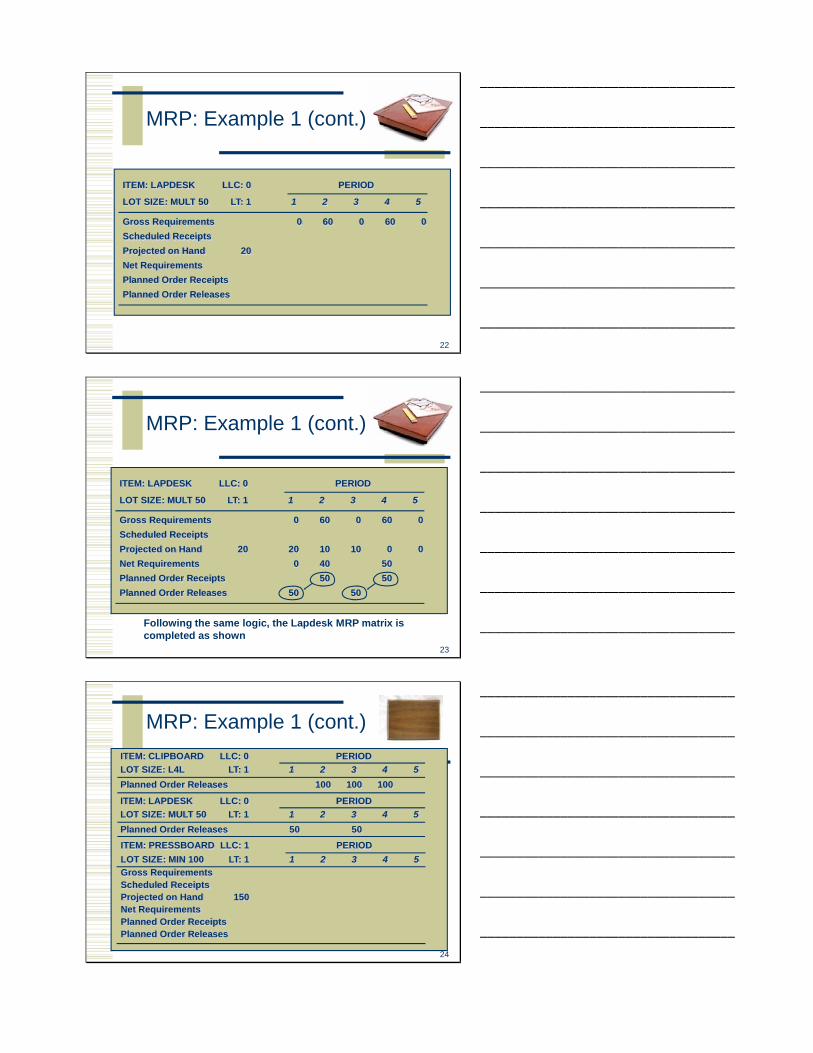
ITEM: LAPDESK LLC: 0 PERIOD
LOT SIZE: MULT 50 LT: 1 1 2 3 4 5
Gross Requirements 0 60 0 60 0Scheduled ReceiptsProjected on Hand 20Net RequirementsPlanned Order ReceiptsPlanned Order Releases
MRP: Example 1 (cont.)
___________________________________
___________________________________
___________________________________
___________________________________
___________________________________
___________________________________
___________________________________
23
ITEM: LAPDESK LLC: 0 PERIOD
LOT SIZE: MULT 50 LT: 1 1 2 3 4 5
Gross Requirements 0 60 0 60 0Scheduled ReceiptsProjected on Hand 20 20 10 10 0 0Net Requirements 0 40 50Planned Order Receipts 50 50Planned Order Releases 50 50
Following the same logic, the Lapdesk MRP matrix is completed as shown
MRP: Example 1 (cont.)
___________________________________
___________________________________
___________________________________
___________________________________
___________________________________
___________________________________
___________________________________
24
ITEM: PRESSBOARD LLC: 1 PERIODLOT SIZE: MIN 100 LT: 1 1 2 3 4 5Gross RequirementsScheduled ReceiptsProjected on Hand 150Net RequirementsPlanned Order ReceiptsPlanned Order Releases
ITEM: CLIPBOARD LLC: 0 PERIODLOT SIZE: L4L LT: 1 1 2 3 4 5Planned Order Releases 100 100 100
ITEM: LAPDESK LLC: 0 PERIODLOT SIZE: MULT 50 LT: 1 1 2 3 4 5Planned Order Releases 50 50
MRP: Example 1 (cont.)
___________________________________
___________________________________
___________________________________
___________________________________
___________________________________
___________________________________
___________________________________

25
ITEM: PRESSBOARD LLC: 1 PERIODLOT SIZE: MIN 100 LT: 1 1 2 3 4 5Gross Requirements 100 100 200 100 0Scheduled ReceiptsProjected on Hand 150Net RequirementsPlanned Order ReceiptsPlanned Order Releases
ITEM: CLIPBOARD LLC: 0 PERIODLOT SIZE: L4L LT: 1 1 2 3 4 5Planned Order Releases 100 100 100
ITEM: LAPDESK LLC: 0 PERIODLOT SIZE: MULT 50 LT: 1 1 2 3 4 5Planned Order Releases 50 50
×2 ×2
×1 ×1×1
MRP: Example 1 (cont.)
___________________________________
___________________________________
___________________________________
___________________________________
___________________________________
___________________________________
___________________________________
26
ITEM: PRESSBOARD LLC: 1 PERIODLOT SIZE: MIN 100 LT: 1 1 2 3 4 5Gross Requirements 100 100 200 100 0Scheduled ReceiptsProjected on Hand 150 50 50 0 0 0Net Requirements 50 150 100Planned Order Receipts 100 150 100Planned Order Releases 100 150 100
ITEM: CLIPBOARD LLC: 0 PERIODLOT SIZE: L4L LT: 1 1 2 3 4 5Planned Order Releases 100 100 100
ITEM: LAPDESK LLC: 0 PERIODLOT SIZE: MULT 50 LT: 1 1 2 3 4 5Planned Order Releases 50 50
MRP: Example 1 (cont.)
___________________________________
___________________________________
___________________________________
___________________________________
___________________________________
___________________________________
___________________________________
27
Planned Order Report
PERIOD
ITEM 1 2 3 4 5
Clipboard 100 100 100Lapdesk 50 50Pressboard 100 150 100
MRP: Example 1 (cont.)
___________________________________
___________________________________
___________________________________
___________________________________
___________________________________
___________________________________
___________________________________
28
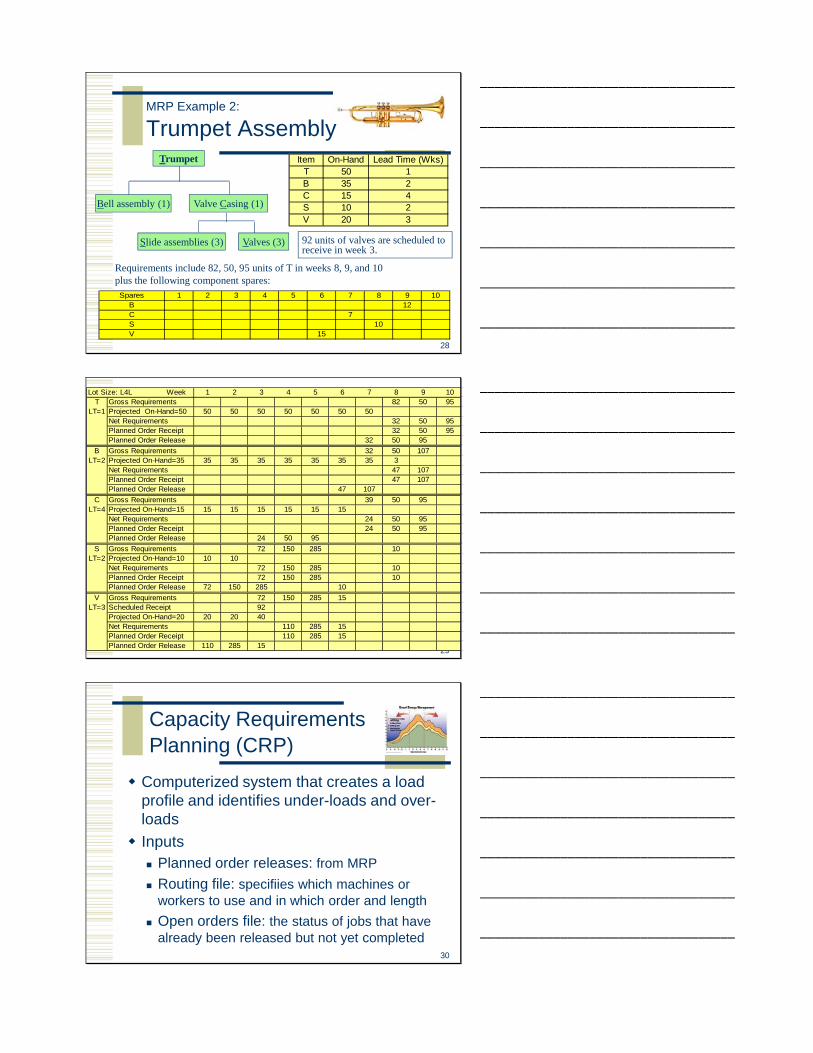
MRP Example 2:
Trumpet AssemblyItem On-Hand Lead Time (Wks)
T 50 1B 35 2C 15 4S 10 2V 20 3
Bell assembly (1) Valve Casing (1)
Valves (3)Slide assemblies (3)
Trumpet
Requirements include 82, 50, 95 units of T in weeks 8, 9, and 10plus the following component spares:
Spares 1 2 3 4 5 6 7 8 9 10B 12C 7S 10V 15
92 units of valves are scheduled to receive in week 3.
___________________________________
___________________________________
___________________________________
___________________________________
___________________________________
___________________________________
___________________________________
29
Lot Size: L4L Week 1 2 3 4 5 6 7 8 9 10T Gross Requirements 82 50 95
LT=1 Projected On-Hand=50 50 50 50 50 50 50 50Net Requirements 32 50 95Planned Order Receipt 32 50 95Planned Order Release 32 50 95
B Gross Requirements 32 50 107LT=2 Projected On-Hand=35 35 35 35 35 35 35 35 3
Net Requirements 47 107Planned Order Receipt 47 107Planned Order Release 47 107
C Gross Requirements 39 50 95LT=4 Projected On-Hand=15 15 15 15 15 15 15
Net Requirements 24 50 95Planned Order Receipt 24 50 95Planned Order Release 24 50 95
S Gross Requirements 72 150 285 10LT=2 Projected On-Hand=10 10 10
Net Requirements 72 150 285 10Planned Order Receipt 72 150 285 10Planned Order Release 72 150 285 10
V Gross Requirements 72 150 285 15LT=3 Scheduled Receipt 92
Projected On-Hand=20 20 20 40Net Requirements 110 285 15Planned Order Receipt 110 285 15Planned Order Release 110 285 15
___________________________________
___________________________________
___________________________________
___________________________________
___________________________________
___________________________________
___________________________________
30
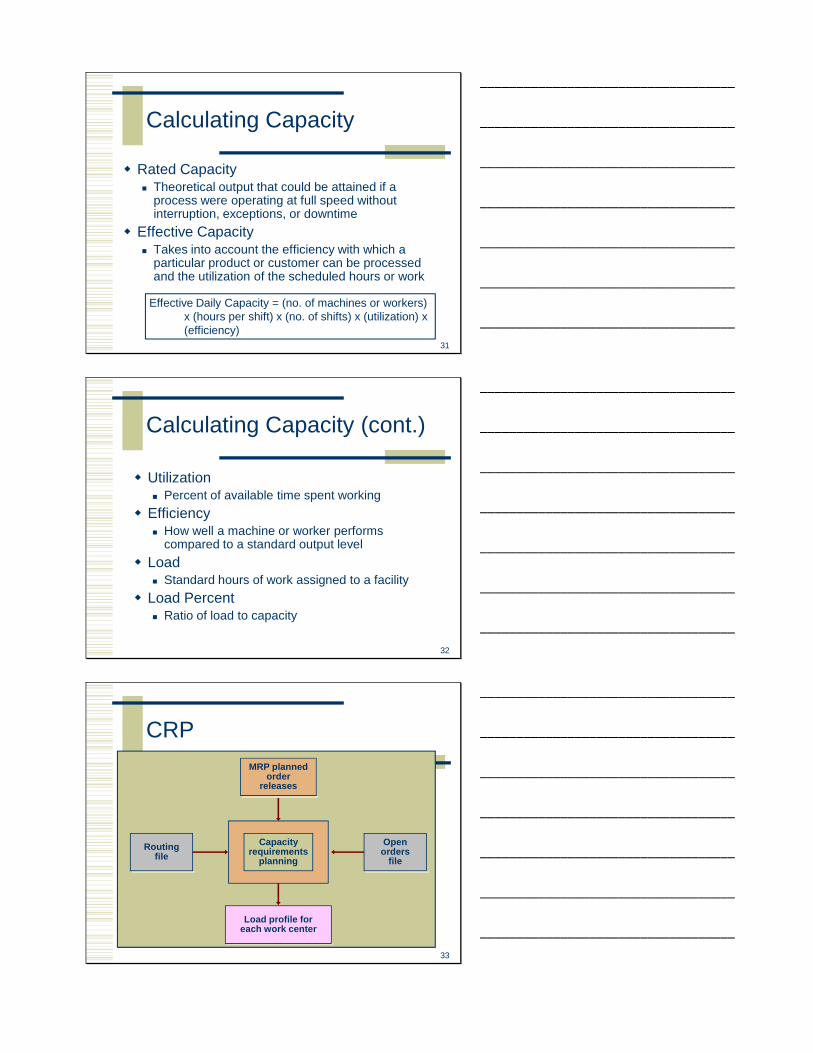
Capacity Requirements Planning (CRP)
Computerized system that creates a load profile and identifies under-loads and over-loadsInputs
Planned order releases: from MRPRouting file: specifiies which machines or workers to use and in which order and lengthOpen orders file: the status of jobs that have already been released but not yet completed
___________________________________
___________________________________
___________________________________
___________________________________
___________________________________
___________________________________
___________________________________
Calculating Capacity
Rated CapacityTheoretical output that could be attained if a process were operating at full speed without interruption, exceptions, or downtime
Effective CapacityTakes into account the efficiency with which a particular product or customer can be processed and the utilization of the scheduled hours or work
Effective Daily Capacity = (no. of machines or workers) x (hours per shift) x (no. of shifts) x (utilization) x (efficiency)
31
___________________________________
___________________________________
___________________________________
___________________________________
___________________________________
___________________________________
___________________________________
Calculating Capacity (cont.)
UtilizationPercent of available time spent working
EfficiencyHow well a machine or worker performs compared to a standard output level
LoadStandard hours of work assigned to a facility
Load PercentRatio of load to capacity
32
___________________________________
___________________________________
___________________________________
___________________________________
___________________________________
___________________________________
___________________________________
33
CRPMRP planned
orderreleases
Routingfile
Capacityrequirements
planning
Openorders
file
Load profile foreach work center
___________________________________
___________________________________
___________________________________
___________________________________
___________________________________
___________________________________
___________________________________
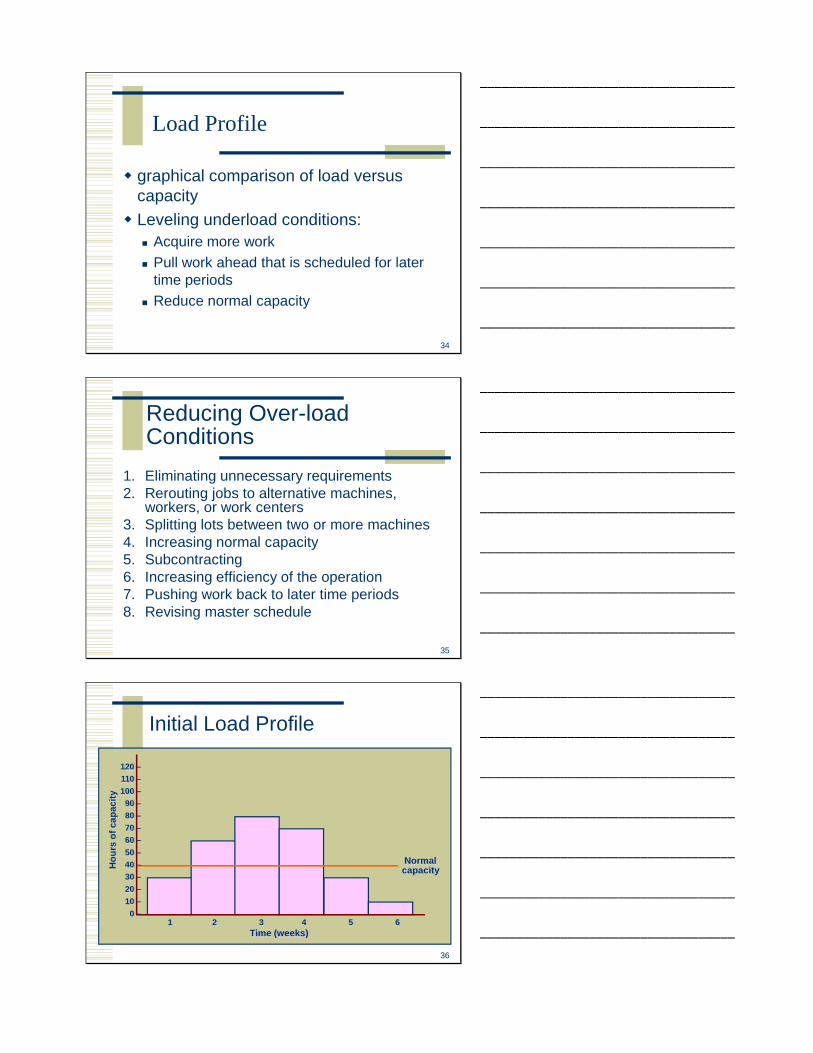
Load Profile
graphical comparison of load versus capacityLeveling underload conditions:
Acquire more workPull work ahead that is scheduled for later time periodsReduce normal capacity
34
___________________________________
___________________________________
___________________________________
___________________________________
___________________________________
___________________________________
___________________________________
Reducing Over-load Conditions
1. Eliminating unnecessary requirements2. Rerouting jobs to alternative machines,
workers, or work centers3. Splitting lots between two or more machines4. Increasing normal capacity5. Subcontracting6. Increasing efficiency of the operation7. Pushing work back to later time periods8. Revising master schedule
35
___________________________________
___________________________________
___________________________________
___________________________________
___________________________________
___________________________________
___________________________________
36
Initial Load Profile
Hou
rs o
f cap
acity
1 2 3 4 5 6Time (weeks)
Normalcapacity
120 –110 –100 –90 –80 –70 –60 –50 –40 –30 –20 –10 –0 –
___________________________________
___________________________________
___________________________________
___________________________________
___________________________________
___________________________________
___________________________________

37
Adjusted Load ProfileH
ours
of c
apac
ity
1 2 3 4 5 6Time (weeks)
Normalcapacity
120 –110 –100 –90 –80 –70 –60 –50 –40 –30 –20 –10 –0 –
Pull ahead Push back
Push backOvertime
Work an
extra shift
___________________________________
___________________________________
___________________________________
___________________________________
___________________________________
___________________________________
___________________________________