Embed Size (px)
Citation preview

MF Global Building Conference 2009
London, 16 January 2009
Christian Labeyrie
Deputy General Manager & Chief Financial Officer

VINCI today

3
Integrated concession-contracting model
Short and medium
Low
Operating cash flow structurally positive
Ability to design and build complex structuresStrong local commercial presencePartnering capacity
Long
High
Project company financed with strong leverage effect and without recourse to shareholdersProject financingLong-term relationship management with concession grantorService culture vis-à-vis end-customerOperations & maintenance
CashContracting
Construction, roads, energy
Concessions
Transport infrastructure & public facilities
Cycles
Capital intensity
Financing methods
Expertise
Complementary business model

4
Integrated concession-contracting model
CONTRACTING
VINCI Construction
Eurovia
VINCI Energies
99%
100%
83%
ASF
Cofiroute
VINCI Park
Escota
Other concessions
CONCESSIONS
100%
100%
100%
100%

5
Concessions: unique portfolio of contracts
Roads & motorways Car parks Airports Other concessions
ASFEscotaCofirouteArcour (A19) *A-Model (A4) *A86 Tunnel*Greek Motorways:*
Athens-TsakonaMaliakos-Kleidi
VINCI Park:FranceUKSpainGermanyEU
LAZ Parking (US)Gestipark
(Canada)
France:**GrenobleChamberyClermont-FerrandQuimper
Cambodia:Phnom-PenhSiem
Reap
Sihanoukville
3.3% of ADP
Stade
de FranceRion-Antirion Bridge
Prado-Carenage
TunnelLuciteaLeslys Light Rail*Nice Car Rental Garage*MMArena Stadium* Prado Sud Tunnel *Coentunnel *Liefkenshoek Rail Link *
* Under construction** Management contracts
2007 Revenue: €4.6 bn17,000 employees

6
Contracting
500 business units in Europe & Africa
Specialised civil engineering
Complex project mgmt.
2007 revenue: €13.7 bn74,000 employees
760 business unitsPower infrastructureMulti-technical mgmt.Networks:• Telecom• Business• Electrical
2007 revenue: €4.3 bn32,000 employees
300 business units
Material production:• 295 quarries • 430 binder & coatingplants
• 135 recycling facilities
Maintenance contracts
2007 revenue: €7.7 bn41,000 employees
VINCI Construction Eurovia VINCI Energies
Contracting activity is spread over 260,000 projects

7
Medium and long term drivers: Concessions
GDP correlation
Inflation-linked toll revenue with clear contractual frameworks
Important needs for transport infrastructure and public equipment all over Europe
A longstanding relationship with Grantor

8
Medium and long term drivers: Contracting
Structural needs for new and modernised European infrastructure and public facilities across a broad spectrum
(transport, energy, communications, healthcare, education, legal, defence)
Development of PPPs
Growing technical content of projects (design, financing, execution, etc.) favours large groups
New opportunities: environment, nuclear, “green initiatives”, water/waste management
VINCI’s
diversity, size and experience provide key competitive advantages

9
Very sound balance sheet
2593 1962824 1477
24900 25012
16540 16497
2356 22021228 1168
8197 8584
Assets AssetsEquity &
Liabilities
31 Dec. 2007
Equity
Non-current provisions and misc. long-termNet financial debt -
ConcessionsNet financial debt –
Holding companiesCapital employed-
ConcessionsCapital employed-
non Concessions
Net cash -
Contracting
30 June 2008€ in millions
Concessions represent most of invested capital and are largely financed with LT debtContracting assets are structural cash generators (negative WCR, provisions)At 30 June 2008: net debt/equity < 2x; net debt/EBITDA 3.5
Equity & Liabilities

10
Focus on net debt: €16 billion (at 30 Sept. 2008)
Other concessions Holding companies and otherCofirouteASF ASF Holding
0
500
1,000
1,500
2,000
2,500
3,000
08-09 09-10 10-11 11-12 12-13 13-14 14-15 15-16 16-17 17-18 18-19 19-20 20-21 21-22 22-23 23-24 24-25 25-26 26-27 > 2027
LT debt maturity schedule
(from 1 July 2008)
Very high liquidity€11.3 bn available at 30 September 2008:
€3.9 bn
in managed cash (Contracting)€7.4 bn
in unused, confirmed LoCs
(maturity between 2011 & 2013)
Financing needs Covered through 2011
Interest rate mgmt.Current cost of financing : < 5.5%
Should remain stable in 2009
Credit rating BBB+/Baa1 with Stable Outlook: allow access to credit

11
2008 objectives
Full year revenue:
up close to 10%
Operating margins:
consolidated
Net financial debt:
stabilised

Economic slowdown: impact on VINCI

13
Concessions: motorway traffic in France
Stable network traffic evolution
3Q 2008: 2.8% decrease due to light vehicle traffic decline
4Q 2008 trend:Light vehicle traffic still down although improving (due to oil price decrease)Heavy vehicle traffic decline due to economic downturn
FY 2008 toll revenue estimate
Unchanged: y-o-y increase due to new sections & price effects which more than offsetthe recent stable network traffic evolution
9M 2008 ASF ESCOTA Cofiroute TotalTraffic on a stable network -0.8% -0.8% -0.7% -0.8%New sections +0.3% - +3.3% +0.9%Price and other effects +3.7% +3.4% +2.1% +3.4%Toll revenue +3.2% +2.6% +4.7% +3.5%
14
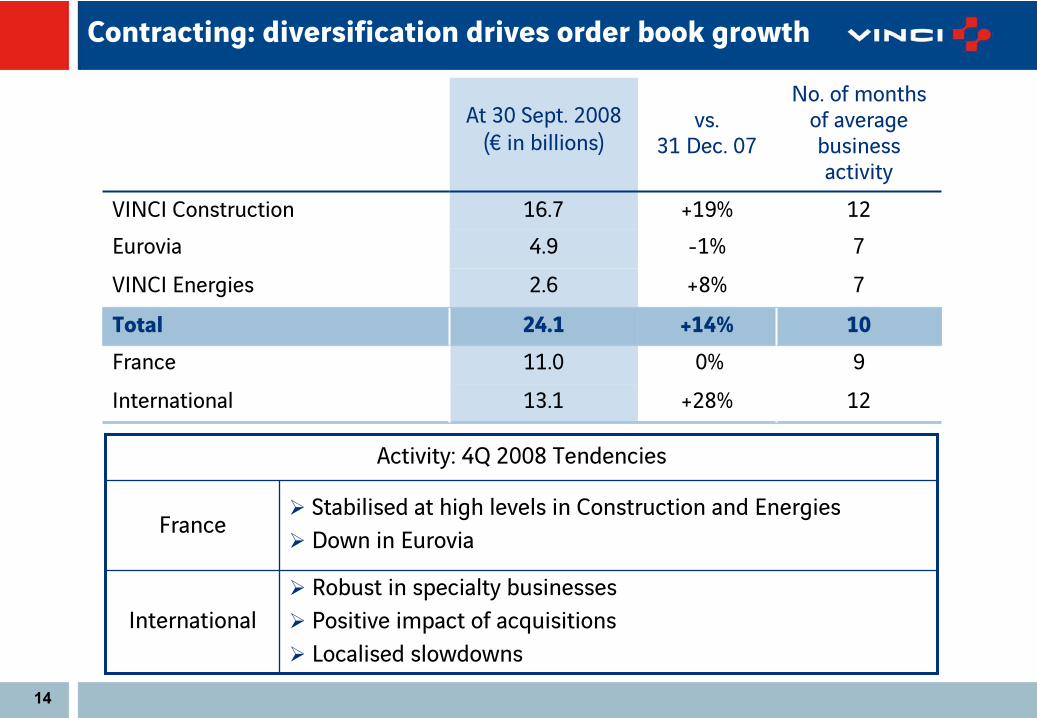
Contracting: diversification drives order book growth
At 30 Sept. 2008(€ in billions)
vs. 31 Dec. 07
No. of months of average business activity
VINCI Construction 16.7 +19% 12Eurovia 4.9 -1% 7VINCI Energies 2.6 +8% 7
Total 24.1 +14% 10France 11.0 0% 9International 13.1 +28% 12
Activity: 4Q 2008 Tendencies
FranceStabilised at high levels in Construction and EnergiesDown in Eurovia
InternationalRobust in specialty businessesPositive impact of acquisitionsLocalised slowdowns

15
Contracting: sustained order intake since 30 Sept 2008
11 contracts in excess of €50 million awarded in October & November*Combined value: €1.4 billion
France3 contracts for new and renovation of buildings in Paris & Montpellier (€450 m)
Prado Sud
tunnel in Marseille (€60 m)
International
Belgium: Liefkenshoek
rail link (€340 m)
Czech Rep.: 2 contracts for road & rail infrastructure (€215 m)
UK: 2 contracts for building demolition/reconstruction & tunnel walls (€130 m)
USA: tunnel construction (€125 m)
Poland: road infrastructure (€80 m)
* Data for December not finalised

16
VINCI’s
businesses at the heart of the French stimulus plan
Residential sector support, in particular in public housing
Strong commitment in favor of infrastructure and public equipmentAccelerating investments in new equipment and facilities renovationEducation, health, justice, defense, cultural heritage
Facilitate access to project financing and liquidityAt the local government levelFor large transportation infrastructure projects
€
8bn state guarantees€ 8bn CDC’s co-financings
Capex
increase of public companies : EDF, GDF Suez, SNCF, La Poste

17
Where the French stimulus plan could impact various concession and PPP projects in France
Mulhouse light rail systemExtension and maintenance
A355 -
€
0.4bnStrasbourg western bypass
RN88 -
€0.4bn
CDG Express -
€
0.6bnParis–Roissy airport rail link
Sud Europe Atlantique
-
> €
7bnTours–Bordeaux high-speed rail link
GSM Rail -
€
0.7bnMobile phone network over 14,000 km of railway track
A831 -
€
0.6bnFontenay Le Comte–Rochefort motorway (64 km)
Notre Dame des Landes Airport€ 0.5bn (Nantes airport)
North-Seine Canal
Nîmes-Montpellier railway bypass (70km)
RailroadsMotorwaysAirportsOther
LGV Bretagne-Pays de Loire180 km high-speed rail link

18
Defensive measures
1) Protect contracting marginsWilling to sacrifice top line growth if necessary
Strict upstream oversight/control on order intake
2) Clamp down on SG&AReduce contract & temp workers immediately
Spread out retiree replacement hires
3) Cash conservation
Reinforce focus on WC at operational levels
Capex: delay where possible; cut if necessary
No significant cash acquisitions
Phased implementation of regulatory requirement to accelerate supplier paymentsDividend policy (50% pay out) unchanged
4) Experienced management Past lessons learned allow to avoid pitfalls

MF Global Building Conference 2009
London, 16 January 2009

20
IR Contacts
G. Christopher WELTON+33 1 47 16 45 [email protected]
Marie-Amélia
FOLCH+33 1 47 16 45 [email protected]

MF Global Building Conference 2009 Appendices
London, 16 January 2009

22
Consolidated income statement
in € millions H1 2007 H1 2008 Δ 08/07
Revenue 13,665 15,737 +15%
Operating profit from ordinary activities 1,306 1,460 +12%
% of revenue 9.6% 9.3%
Operating profit 1,270 1,430 +13%
Net financial expense (296) (283) -4%
Income tax expense (300) (355)
Minority interests (60) (61)
Net profit attributable to equity holders of the parent 614 731 +19%
% of revenue 4.5% 4.6%

23
Cash flow statement (1/2)
in € millions 2007 H1 2007 H1 2008
Cash flow from operations 4,515 1,975 2,182Change in working capital requirement and current provisions 687 (400) (392)
Taxes paid (783) (365) (349)Net interest paid (836) (452) (463)Cash flow from operating activities 3,583 758 977Net investments in operating assets (683) (310) (473)Free cash flow 2,900 448 504
Purchases of concession fixed assets (1,269) (604) (529)
Net financial investments (2,023) (1,122) (102)Other cash flows 287 68 (10)Net cash flow from investing activities (3,005) (1,658) (641)
Net cash flows before
financing activities (105) (1,210) (136)

24
Cash flow statement (2/2)
in € millions 2007 H1 2007 H1 2008Free cash flow before movements in share capital (105) (1,210) (136)
Dividends (713) (433) (523)Capital increases 372 409 290Share buybacks (939) (891) (223)
Movements in share capital (1,280) (915) (456)Net cash flow during the period (1,385) (2,125) (592)Other changes and impact of consolidation (122) 165 158
Change in net financial debt (1,507) (1,960) (434)
Net financial debt (16,303) (16,756) (16,737)

25
Consolidated balance sheet
in € millions 30 June 2007 31 Dec. 2007 30 June 2008ASSETSNon-current assets –
concessions 25,200 25,489 25,722
Non-current assets –
other business lines 3,285 4,455 4,598Current financial assets 45 63 38Net cash 3,431 3,594 3,062Total Assets 31,961 33,601 33,420EQUITY & LIABILITIESEquity 7,586 8,197 8,588Non-current provisions and miscellaneous long-term 1,285 1,292 1,207
Financial debt 20,187 19,897 19,799WCR and current provisions 2,903 4,215 3,826Total equity and liabilities 31,961 33,601 33,420
Net financial debt (16,756) (16,303) (16,737)

26
Net financial debt
in € millions 30 June 2007 31 Dec. 2007 Net debt/ cash flow 30 June 2008 Δ 08/07
Concessions (16,432) (16,540) 5.8x (16,497) 43ASF + ASF Holding (12,088) (11,839) 6.4x (11,786) 53Cofiroute (3,098) (3,264) 4.5x (3,270) (6)VINCI Park (833) (857) 4.4x (803) 57Other infrastructure (413) (580) (638) (58)Contracting 1,999 2,593 NS 1,962 (631)VINCI Energies 518 515 502 (13)
Eurovia 253 600 106 (493)
VINCI Construction 1,228 1,478 1,354 (125)Holding companies and other (2,323) (2,356) (2,202) 154
Net financial debt (16,756) (16,303) 3.6x (16,737) (434)
Net financial debt stable over 12 months

27
Concessions: strong local & international presence

28
VINCI Autoroutes France
Europe's biggest motorway network
Very favourable position at the crossroads of Southern and Western Europe: border areasVaried traffic:
Urban network with significant daily traffic in areas with strong demographic growthMajor recurring tourism trafficStrong growth in freight traffic (Spain-
France-Italy)
■
Cofiroute: intercity network■
Arcour: A19■
ASF■
Escota■
Other networks
ASF Escota Cofiroute
Network under concession (km) 2,713 459 1,101
No. of km in service 2,590 459 1,083
End of concession 2032 2026 2030
Millions of km travelled in 2007 27,943 6,596 10,375

29
VINCI Autoroutes France: clearly defined contractual tariff framework
ASF Escota Cofiroute
End of concession 2032 2026 2030
Current contract 2007-2011
(signed June 07)
2007-2011
(signed June 07)
2004-2008
Confirmed tariff formulas
-
Current programme plan 85% x CPI + 0.825% 85% x CPI + 0.9% 85% x CPI
-
2009-2010 Application of programme plan
Application of programme plan
2009 =85% x CPI + 0.41%* 2010 = 70% x CPI + 0.41%
-
2012–2017 70% x CPI + 0.625% 70% x CPI 70% x CPI
-
After 2017 70% x CPI 70% x CPI 70% x CPI
Increases applied from 1 February 2008**
-
Light vehicles 2.45% 2.53% 1.94%***
- Heavy vehicles 2.81% 2.81% 3.44%
* Amendment 13 signed when northern Angers bypass opened ** Based on French inflation (excluding tobacco products) at end-October 2007: 1.92%
CPI at end-October 2008 = 2.7%*** +1.94% = 85% x CPI + 0.31% due to takeover of "orphan" sections

30
Almost 85,250 employees (54% of the Group's workforce) are VINCI
shareholdersTop 20 institutional shareholders account for almost 30% of VINCI's share capitalCarlo Tassara
International reduced its stake down to 0.4% in December 2008
Shareholder structure at 30 June 2008
Diversified shareholder base
At
31 Dec.
2007
At
30 June
2008
Employees 8.7% 8.6%
Treasury shares 3.7% 4.8%
Individual shareholders 11.0% 11.8%
Artemis 5.0% 4.9%
Predica 2.5% 2.6%
Carlo Tassara 2.0% 3.4%
French institutionals 29.3% 24.9%
UK institutionals 8.8% 6.3%
Other European institutionals 12.3% 14.5%
North American institutionals 15.2% 15.2%
Rest of the world 1.5% 3.0%
4.9%
11.8%
24.9%
6.3%
14.5%
15.2% 4.8%
2.6%3.4%
3.0%
8.6%

31
64.1%
6.4%6.7%
4.6%
3.2%
4.5%
3.5%
3.4%
3.6%
Diversification of revenue base
in € millions H1 2008 Δ 08/07
France 10,093 +9.4%Central & Eastern Europe 1,011 +5.4%United Kingdom 1,054 +17.4%Germany 731 +3.5%
Belgium 505 +26.6%
Rest of Europe 698 48.7%Europe (excl. France) 4,000 +16.6%Americas 544 +45.6%Africa 562 +54%Asia / Middle East / Oceania 538 +102%International (excl. Europe) 1,644 +63.7%Total revenue 15,737 +15.2%Total International 5,644 +27.2%
First-half revenue by geographical region
Portion of revenue deriving from abroad rose to 36%

32
United KingdomBirmingham PFI –
€
0.9bnRepair, maintenance and management of road network
BelgiumAntwerp ring road (10 km) -
€
2.7bn
CyprusPafos–Polis motorway (31 km) –
€
0.3bnVINCI preliminary preferred bidder
GermanyA5 (A-Modell) -
€
0.6bnOffenburg-Karlsruhe motorway (60 km)Waldeck-Frankenberg road
SlovakiaR1 motorway -> €
1bnR1 express road -
>€
2bnD1-2 motorway
RomaniaComarnic-Brasov motorway -
€
1.7bn
RussiaMoscow–St Petersburg motorway: €
2bnOrlovsky
Tunnel –
€
0.7bnSt Petersburg metro -
€
1.1bn
Preferred bidderProposal submitted
Proposal under developmentOther projects expected
NetherlandsMAVA motorway, A15 (40km)
Where various European concessions and PPP projects could impact activity outside France
![VINCI, global player in concessions and construction [VINCI] - … · 2018. 11. 12. · VINCI 1, cours Ferdinand-de-Lesseps F–92851 Rueil-Malmaison Cedex Tél. : + 33 1 47 16 35](https://img.dokumen.tips/doc/110x75/6112f2be581e3e65df7603d1/vinci-global-player-in-concessions-and-construction-vinci-2018-11-12-vinci.jpg)


![VINCI, global player in concessions and construction [VINCI] - … · 2013. 4. 15. · VINCI Construction France a poursuivi sa croissance en progressant de 7,4 %, à 6,5 milliards](https://img.dokumen.tips/doc/110x75/60d351f06fea574f571e83d7/vinci-global-player-in-concessions-and-construction-vinci-2013-4-15-vinci.jpg)