Embed Size (px)
Citation preview

Energy Studies Review Vol. 14, No.1. 2006 pp 80-103
Mexico's Long-Term Energy Outlook:Results of a Detailed Energy SupplyAnd Demand Simulation
Guenter Conzelmann, Juan Quintanilla,Vicente Aguilar, Luis Alberto Conde,Jorge Femimdez, Elizabeth Mar,Cecilia Martin del Campo,Gerardo Serrato, and Ruben Ortega
ABSTRACT
This paper presents the results of a detailed, bottom-up analysis ofMexico's energy markets. A team of U.S, and Mexican analysts used theEnergy and Power Evaluation Program (ENPEP) to develop energy marketforecasts to the year 2025, Primary energy supply is projected to growfrom 9,313 petajoules (Pl) in 1999 to 13,130 Pl by 2025, Mexico's crudeoil production is expected to increase by 1% annually to 8,230 Pl in 2025.As its domestic crude refining capacity becomes unable to meet the risingdemand for petroleum products, resulting from such factors as thecountry's rapidly growing transportation needs, imports of oil productswill become increasingly important. Gasoline imports, for example, areexpected to increase 12-fold, The Mexican natural gas markets are drivenby the strong demand for gas in the power generating and manufacturing
This work was supported by the U.S. Department of State and the International AtomicEnergy Agency under interagency agreement, through U.S. Department of Energy contractW-31-109-Eng-38. The views and opinions expressed in this paper are those of the authorsand may not necessarily reflect those of the institutions they represent.
G. Conzelmann ([email protected]) is with Argonne National Laboratory, 9700 S. CassAve., Argonne, fL. 60439, U.S.A.; 1. QUintanilla is with Direccion General de Servicios deC6mputo Academico at Universidad Nacional Autonoma de Mexico, Mexico City, Mexico;V. Aguilar is with Secretaria de Energia, Mexico City, Mexico; L. A. Conde is withInstituto Nacional de Ecologia, Mexico City, Mexico; J. Fernandez is with ComisionFederal de Electricidad, Mexico City, Mexico; E. Mar is with Instituto Mexicano delPetroleo, Mexico City, Mexico; C. Martin del Campo, G. Serrato, and R. Ortega are withFacultad de Ingenieria, Universidad Nacional Autonoma de Mexico, Mexico City, Mexico.

Conzelmann et al 81
industries. This demand is expected to significantly outpace projecteddomestic production. The result will be a large demand for natural gasimports, perhaps representing approximately 46% of total gas supplies by2025. The long-tenn market outlook for Mexico's electricity industryshows a heavy reliance on natural-gas-based generating technologies. Gasfired generation is forecast to increase 26-fold, eventually accounting for79% of total generation by 2025. Alternative results for a constrained-gasscenario show a substantial shift to coal-based generation and theassociated effects on the natural gas market.
INTRODUCTION
Under a Technical Cooperation (TC) project initiated in June 2000and funded by the International Atomic Energy Agency (IAEA) and theU.S. Department of State, a team of analysts from the Secretaria deEnergia (SENER), Comision Federal de Electricidad (CFE), Instituto deInvestigaciones Electricas (lIE), the Direccion General de Servicios deComputo Academico (DGSCA), the Programa Universitario de Energia(PUE), and the Facultad de Ingenieria, all three at the UniversidadNacional Autonoma de Mexico (UNAM), and the Center for Energy,Environmental, and Economic Systems Analysis (CEEESA) in theDecision and Infonnation Sciences Division at Argonne NationalLaboratory finished a detailed analysis of Mexico's power sector thatevaluated various power system expansion options and scenarios.
In September 200I, the scope of the analysis was broadened into afull energy system analysis that analyzed Mexico's future energy needs upto 2025 and estimated the associated environmental burdens. The previousteam of analysts was joined by experts from the Instituto Nacional deEcologia (INE), Instituto Mexicano del Petroleo (IMP), PetroleosMexicanos (PEMEX), and the Comision Nacional para el Ahorro deEnergia (CONAE). Final results were presented at a seminar at SENER inFebruary 2003.
1. Modeling Approach
Under Phase I - the power system expansion analysis - the teamused primarily the DECADES-WASP and VALORAGUA analysis tools.WASP is a dynamic optimization software that detennines the optimal,least-cost generation system expansion path that adequately meets thegrowing demand for electricity while respecting user-specified constraints,such as desired system reliability, fuel limitations, or environmentalconstraints. WASP uses a probabilistic simulation of production costs,
82 Energy Studies Review Vol. 14, No. I
energy-not-served costs, and system reliability parameters to compare totalcosts of alternative expansion paths.
VALORAGUA determines the optimal generating strategy of mixedhydro-thermal electric power systems. It can simulate the operation of allforms of hydropower plants (run-of-river, weekly, monthly, seasonal, ormulti-annual regulation), including pumped-storage plants andmultipurpose hydro projects. Both models have been in use at CFE forseveral years.
For the overall energy systems analysis under Phase 2, the teamadded the BALANCE module of ENPEP for Windows. BALANCE uses anonlinear, market-based equilibrium approach to determine the energysupply and demand balance for the entire energy system. With thisapproach, BALANCE is used to determine the response of varioussegments of the energy system to changes in energy price and demandlevels. The model relies on a decentralized decision-making process in theenergy sector and can be calibrated to the different preferences of energyusers and suppliers. Basic input parameters include information on theenergy system structure; base-year energy statistics, including productionand consumption levels and prices; projected energy demand growth; andany technical and policy constraints.
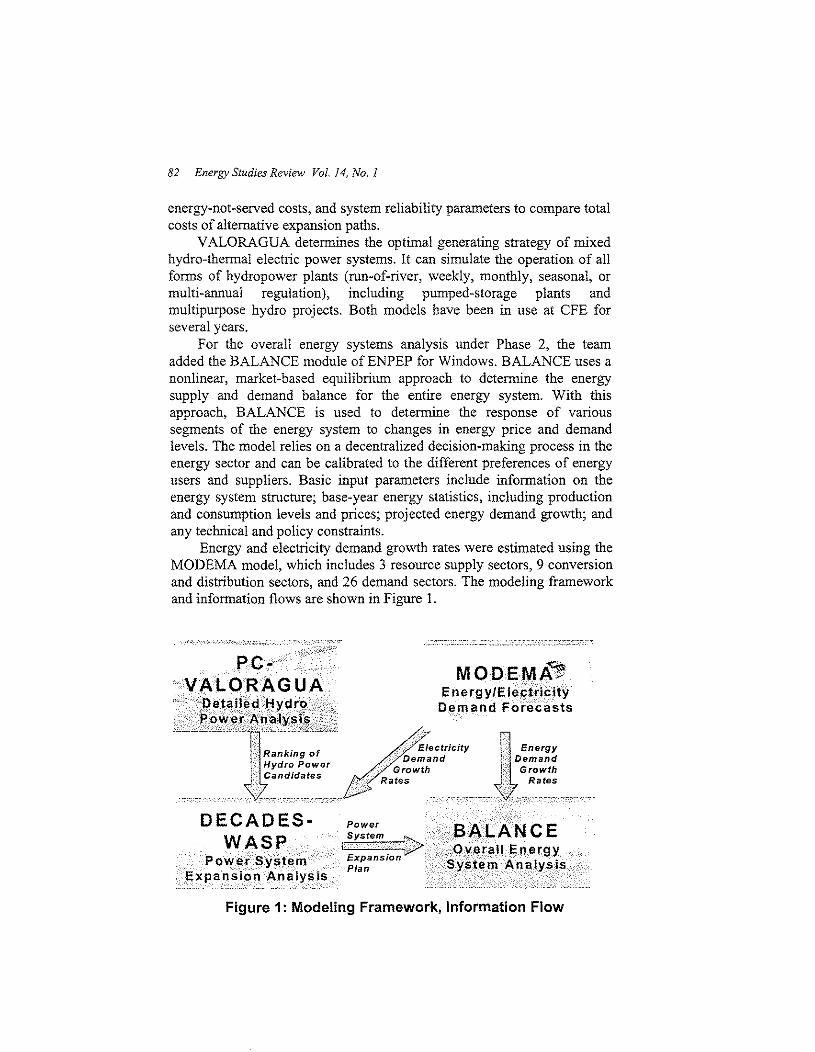
Energy and electricity demand growth rates were estimated using theMODEMA model, which includes 3 resource supply sectors, 9 conversionand distribution sectors, and 26 demand sectors. The modeling frameworkand information flows are shown in Figure 1.
DECADES- Power
MODEMA~Energy/E lel<tricity
Demand Forecasts
Figure 1: Modeling Framework, Information Flow
Conzelmann et al 83
2. Energy System Representation
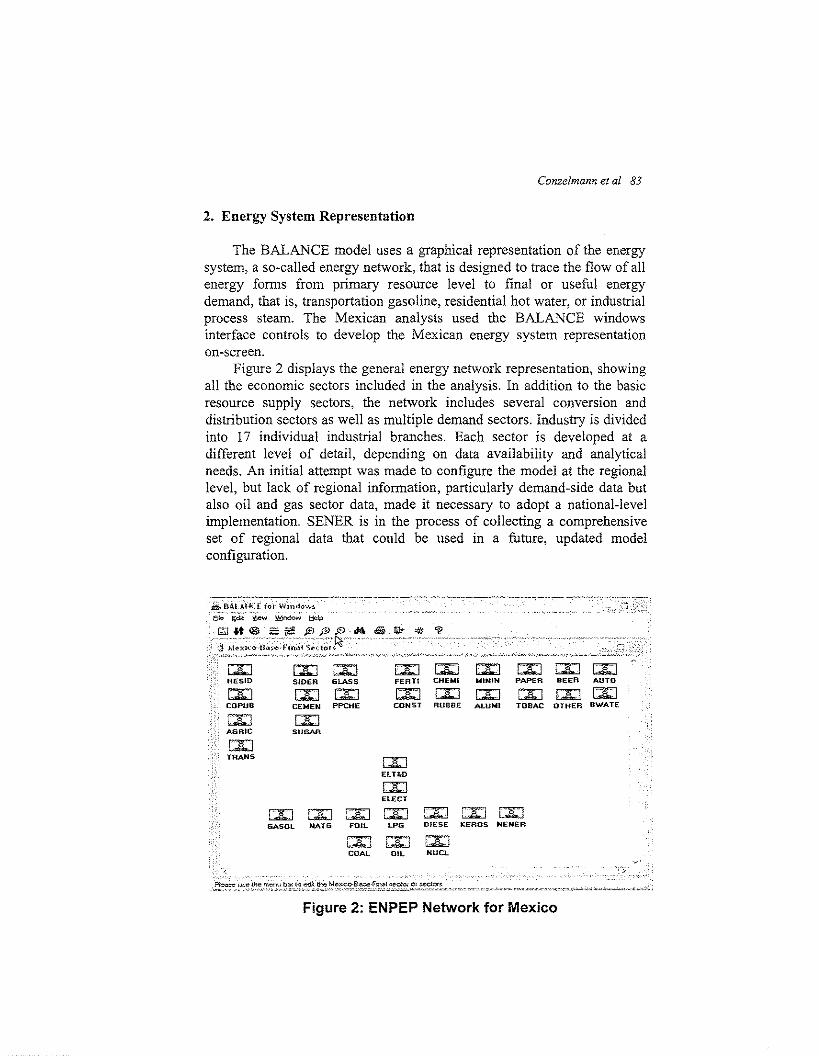
The BALA.NCE model uses a graphical representation of the energysystem, a so-called energy network, that is designed to trace the flow of allenergy fonns from primary resource level to final or useful energydemand, that is, transportation gasoline, residential hot water, or industrialprocess steam. The Mexican analysts used the BALANCE windowsinterface controls to develop the Mexican energy system representationon-screen.
Figure 2 displays the general energy network representation, showingall the economic sectors included in the analysis. In addition to the basicresource supply sectors, the network includes several conversion anddistribution sectors as well as multiple demand sectors. Industry is dividedinto 17 individual industrial branches. Each sector is developed at adifferent level of detail, depending on data availability and analyticalneeds. An initial attempt was made to configure the model at the regionallevel, but lack of regional infonnation, particularly demand-side data butalso oil and gas sector data, made it necessary to adopt a national-levelimplementation. SENER is in the process of collecting a comprehensiveset of regional data that could be used in a futnre, updated modelconfiguration.
SUGAR
LXI LXIFEATI CHEWI
CAl LXICONST RUBBE
CAlMININ
CAlALUMI
CAl CAl 00PAPER BEER AUTO
!Xl IAJ CAlTOBAC OTHEA B'WATE
TRANS
IAJGASOL
[AJELT&D
00ELECT
00 00 00NATG FOIL LPG
IAJ IAJCOAl. OIL
CAl LJ'l:] CAlDIESE KEROS NENER
!XlNUel.
Figure 2: ENPEP Network for Mexico
84 Energy Studies Review Vol. 14, No.1
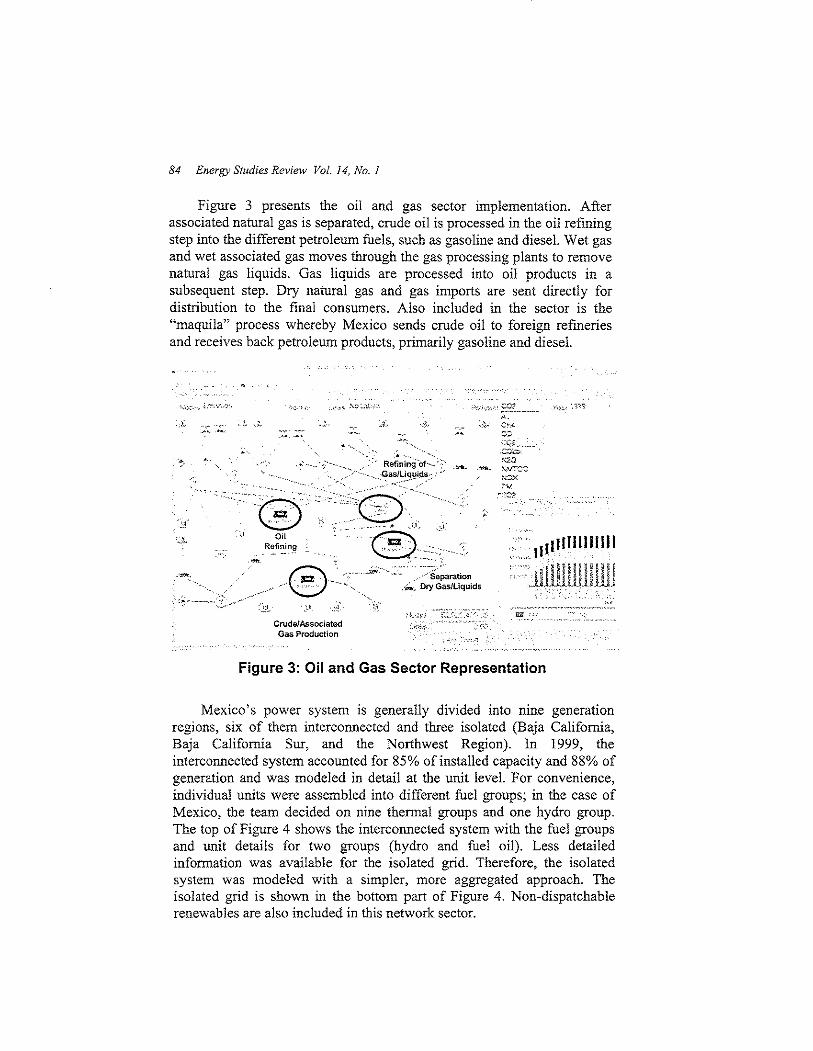
Figure 3 presents the oil and gas sector implementation. Afterassociated natural gas is separated, crude oil is processed in the oil refiningstep into the different petroleum fuels, such as gasoline and diesel. Wet gasand wet associated gas moves through the gas processing plants to removenatnral gas liquids. Gas liquids are processed into oil products in asubsequent step. Dry natnral gas and gas imports are sent directly fordistribution to the fmal consumers. Also included in the sector is the"maquila" process whereby Mexico sends crude oil to foreign refmeriesand receives back petroleum products, primarily gasoline and diesel.
.),..'C". ",-
"'~. , ....
>,ci_,:-, . cO?A.
~:0. 0·:<:co
'~,
"""-
.... ,.,. ,.,~ ..> R~fi~i'~g"Of"'>-;" .\ric_ •.,....
..·.• ,.,-GasJLiql,l.i~-:: -'• -e'-'".... '
_.,_,,·-s~paration.-;;:,., Dry Gas/Liquids
Crude/AssociatedGas Production
"20,"'c:::~,-;:)x
7V
" l,l IHIlI I' III I",I
'<!lIHIPPi!!.it ,u,Lttl>'".,.-. ".'.-"_ _,, ..
Figure 3: Oil and Gas Sector Representation
Mexico's power system is generally divided into nine generationregions, six of them intercormected and three isolated (Baja California,Baja California Sur, and the Northwest Region). In 1999, theintercormected system accounted for 85% of installed capacity and 88% ofgeneration and was modeled in detail at the unit level. For convenience,individual units were assembled into different fuel groups; in the case ofMexico, the team decided on nine thennal groups and one hydro group,The top of Figure 4 shows the interconnected system with the fuel groupsand unit details for two groups (hydro and fuel oil). Less detailedinformation was available for the isolated grid. Therefore, the isolatedsystem was modeled with a simpler, more aggregated approach. Theisolated grid is shown in the bottom part of Figure 4. Non-dispatchablerenewables are also included in this network sector.

Conzelmann et al 85
... >_.,,'~',,~.• ,~"" ..;-",~,,,,,
11 i 11 j illl' II·lll!Iii.1 ,{~ .~1)1_ .(.. ,.. _ idI"-'.>-"~'
IsoI Grid
Figure 4: Electric Sector Representation
The network includes several transmission and distribution (T&D)sectors, particularly for the various petroleum products. The T&D sectorsincorporate distribution costs (if available) and government taxes andsubsidies (if applicable), with the model computing the end-use energyprices across the different sectors to send the correct price signals toconsumers. Figure 5 shows an example for the diesel distribution network.Figure 5 also presents the sugar industry as an example for an end-usesector. Various furnaces, boilers, and cogenerators compete to supply thesugar industry's demand for direct heat and process steam. Cogenerationoffers an alternative supply to grid-purchased electricity.

86 Energy Studies Review Vol. 14, No.1
"., T xes
'.......c.
Distribution Costs
=":l',,', U'':'
.~, :
.llllllllllllillllll!I!I!!!!
'•.1....,
Figure 5: T&D and End·Use Sector Representation
3. Scenarios and Main Assumptions
For the power sector, the anaiysts examined a total of 14 scenarios,including a base case, variations in load growth, sensitivities to changes inprojected fuel prices, variations in assumed natural gas availability,different system reliability targets, and the possibility for additionalnuclear capacity. The power sector analysis is described in more detail inConzelmann et al. (2003). Forecasts until 2025 for the entire energysystem were developed for the following four scenarios:

Conzelmann et al 87
• Reference Case;• Limited Gas Scenario - assumes limited gas supply for power
generation starting in 2009 (maximum addition of 3 combinedcycle units per year);
• Renewables Scenario - investigates impacts of additionalrenewables for power generation (primarily wind plus some solarphotovoltaic);
• Nuclear Scenario - analyses the impacts of additional nuclearpower generation capacity
The analysis period for all scenarios was 1999 to 2025, with the first3 years used to calibrate the ENPEP-BALANCE model to the Mexicansituation. Economic growth was assumed to be 4.5% from 2002 through2011 and 3.5% from 2012 through 2025. Assumed population growth ratesdrop from 1.33% (2000-2010) to 1.02% (2011-2020) and 0.82% for theremainder. Fuel price escalation rates were developed based on Bates(2002), who estimated fuel price indexes using information from theWorld Bank and USElA. The discount rate is 10% for all scenarios. Noconstraints were imposed on the supply of natural gas under the ReferenceCase.
4. Reference Case Results
4.! Final Energy ConsumptionDespite the assumed energy efficiency improvements in the demand
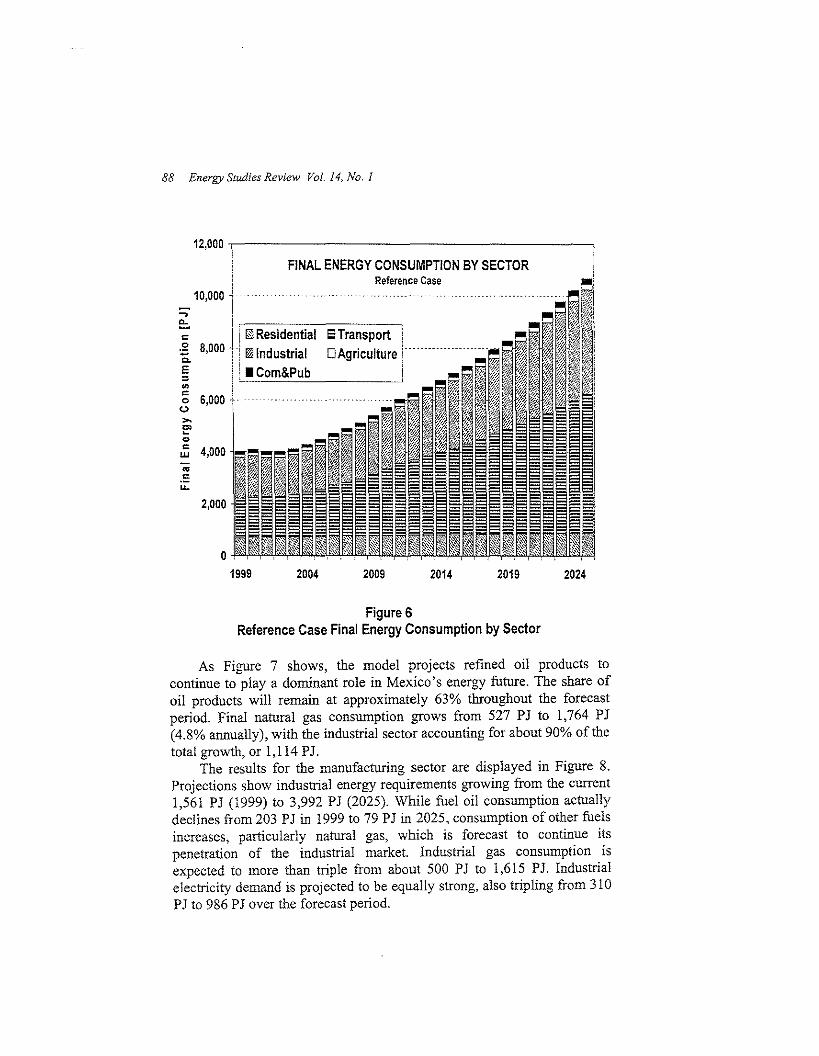
sectors, final energy consumption is projected to grow at an average rate of3.8% per year, from 4,030 PJ in 1999 to 10,666 PJ by 2025 (Figure 6).This growth is strongly fuelled by the observed increase in transportationdemand, which is projected to grow annually at 4.9% from 1,547 PJ in1999 to 5,349 PJ in 2025. Transportation accounts for about 57% of thetotal growth in final consumption (6,636 PJ), making the transport sectorthe largest consumer by 2025 with over 50% of total final energyconsumption (up from 38% in 1999). Industrial demand grows at 3.8% peryear, leading to a slight decline in its consumption share from 39% to37%. By 2025, transport and industry combined account for about 88% oftotal final energy consumption. Residential energy consumption growsrelatively slowly at about 1% annually, leading to a drop in its sectoralshare from 17% (1999) to 8% (2025).
88 Energy Studies Review Vol. 14, No.1
IaTransport !
2,000
'".r:....
10,000...,e:." 1Ii 0 Residential:3 8,000 .[ 01 Industrialc.E ' ICom&Pub"'""o(.),.,E'<l>
~ 4,000
12,000 .,------------------~
FINAL ENERGY CONSUMPTION BY SECTORReference Case
1999 2004 2009 2014 2019 2024
Figure 6Reference Case Final Energy Consumption by Sector
As Figure 7 shows, the model projects refmed oil products tocontinue to playa dominant role in Mexico's energy future. The share ofoil products will remain at approximately 63% throughout the forecastperiod. Final natural gas consumption grows from 527 PJ to 1,764 PJ(4.8% annually), with the industrial sector accounting for about 90% of thetotal growth, or 1,114 PJ.
The results for the manufacturing sector are displayed in Figure 8.Projections show industrial energy requirements growing from the current1,561 PJ (1999) to 3,992 PJ (2025). While fuel oil consumption actuallydeclines from 203 PJ in 1999 to 79 PJ in 2025, consumption of other fuelsincreases, particularly natural gas, which is forecast to continue itspenetration of the industrial market Industrial gas consumption isexpected to more than triple from about 500 PJ to 1,615 PJ. Industrialelectricity demand is projected to be equally strong, also tripling from 310PJ to 986 PJ over the forecast period.

Conzelmann et at 89
FINAL ENERGY CONSUMPTION BY FUELReference Case
20242019201420092004
6,000 ~
12,000 ,
I10,0001 ..
~ II :-=-::--cc-------==-=-=-----,--,.•Coke 1'.l Oil Products
§ ,a 8,000 t·: [] Natural Gas IS ElectricityE i E; Renewables:
1J()
2'~w..~
ii:
Figure 7Reference Case Final Energy Consumption by Fuel
INDUSTRIAL FINAL ENERGY CONSUMPTIONReference Case3,500 +
4,000 1
I!.Coke ilIIFuelOil:f 3,000 1j:;; Diesel Iil Kerosene Imm••• m.
';: li EJ LPG Eli Non energy I~ 2,500 i' 0 Natural Gas ~ Electricity u ....muu
.;; II § Renewables
~ 2,000 ~ ....u .. u
;;: .
~ 1,500
! Ii
.E 1,0001~~~~bJWW!~\d~~bj~I~~~~~~~j6!~I;~~~lil~ml~~~.~11500 { ~
o1999 2004 2009 2014 2019 2024
Figure 8Reference Case Industrial Final Energy Consumption by Fuel
90 Energy Studies Review Vol. 14, No. J
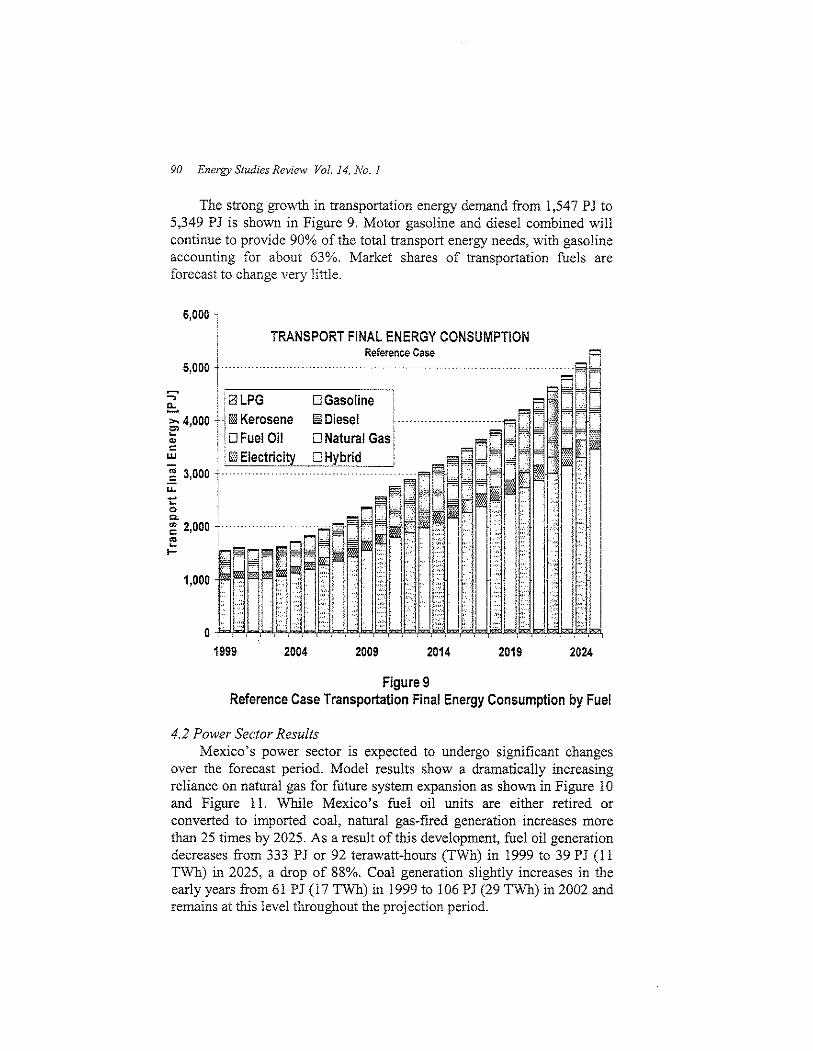
The strong growth in transportation energy demand from 1,547 PJ to5,349 PJ is shown in Figure 9. Motor gasoline and diesel combined willcontinue to provide 90% of the total transport energy needs, with gasolineaccounting for about 63%. Market shares of transportation fuels areforecast to change very little.
6,000 ,
TRANSPORT FINAL ENERGY CONSUMPTION
.;:.,
202420192014
Reference Case
20092004
~_Ii"················· .. ··· ..·······~r·F1.. f1
[] G~soline I , : -\" ~
." 'C~~:~~ II f' 11111 • 1,111 [,j.- Iri,j I
i .!I li:I!, i?l .. It.:.1 ..,OMdl..I,J...J.bd,biiJ!+4d1=\b;J,bd,bd)d)dii~d)d,bd,6J,1d,1~~d,id
1999
1,000
5,000 i~-------~
~ ! i0LPG- '!;;; 4,000 f'l i!iI Kerosene;;; ! !DFuel Oil- I,
W ' '0 ElectricityE 3,0001u.. I
~ iQ.
~ 2,000 C"
E !
I- i
'~
Figure 9Reference Case Transportation Final Energy Consumption by Fuel
4.2 Power Sector ResultsMexico's power sector is expected to undergo significant changes
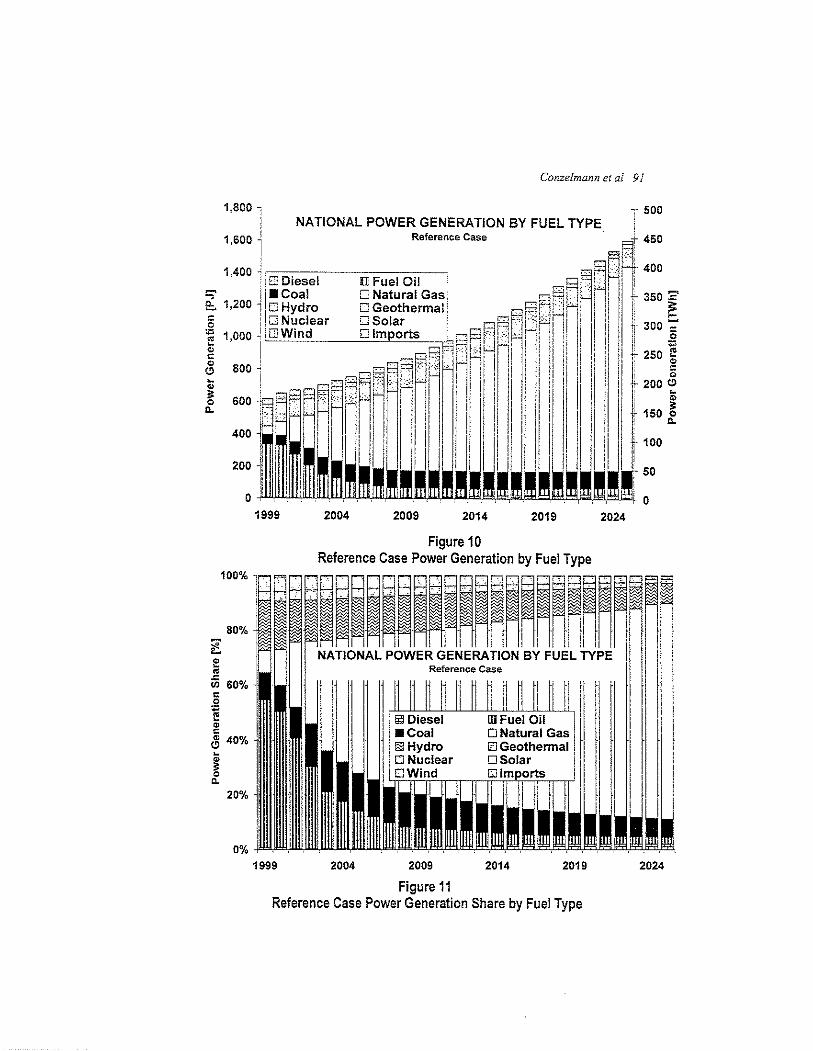
over the forecast period. Model results show a dramatically increasingreliance on natural gas for future system expansion as sho\\'!! in Figure 10and Figure 11. While Mexico's fuel oil units are either retired orconverted to imported coal, natural gas-fired generation increases morethan 25 times by 2025. As a result of this development, fuel oil generationdecreases from 333 PJ or 92 terawatt-hours (TWh) in 1999 to 39 PJ (11TWh) in 2025, a drop of 88%. Coal generation slightly increases in theearly years from 61 PJ (17 TWh) in 1999 to 106 PJ (29 TWh) in 2002 andremains at tbis level throughout the proj ection period.
Conzelmann et a! 91
-,- 500
20242019201420092004
NATIONAL POWER GENERATION BY FUEL TYPE1,800,
j
i1,600 1 Reference Case ~ 450
1,400 ' E3 Diesel []J Fuel Oil ""'SA:Ft' i"'I' 400:;' I • Coal [J Natural Gas ",Pi j' n: L 350 :2E::. 1,200 1 OHydro o Geothermal; _~P1UHh: if I ~§ : CJNuclear ;:;;~olarrt I ~fJr:ojr UHI !I Ii II i'l ~ 300-;~ 1,000 'I c.:[J"-W=in"'d'--_--=u"'m-"p"'o=s'-=~'::1Hf'I'n-'" I "II I I I :1 ,g:- ~ Ejpi W~ Ii " ,II d i' Ii r 250 ~,~ 800 J,' nY' 7" 'M' -' II" 'I ,I I,: II I, Ii il , 'II ~ c:...... ........,. !'-'~1' I' 'I I I, ! I 'I " 'I <>~ i ;..,..!::d .:l~-':: : 11:. iii:j I I Ii! I i il.' 200 G
&. H 'I I I I I I i' Ii II I II I' 150 0
Ii ill II I I Ii i II ,I I: II II II I I' Q.
'I : i! I: I : Ii I I II I I ' I 'I i 100. i ',! I ,I, , 'I' 'I 'IIII1 II il iii II I .i' II I, 50
. i
~I '
!
I I! ,
I II[I I
I II I
II
20242019201420092004
Figure 10Reference Case Power Generation by Fuel Type
0% "1999
'::1~ j II.~~~.~R~~~~~
e:. NATIONAL POWER GENERATION BY FUEL TYPE II~ Reference Case IrO%1 111 1111 illlllilli~ I I i llil Diesel III Fuel Oil ' I I~ J • Coal 0 Natural Gas I i~ 40% . I i §I Hydro 0 Geothermal I I"0; II 0 N'!clear 0 Solar
,IDWmd GJlm orts ,0. I .1. I I I '
20% j I, rl 1
"
Figure 11Reference Case Power Generation Share by Fuel Type
2024
92 Energy Studies Review Vol. 14, No.1
Natural gas generation grows at an average rate of 13.2%, from 50 PJ(14 TWh) in 1999 to 1,265 PJ (351 T\Vh) in 2025. By the end of theprojection period, gas-fired generation accounts for 79% of totalgeneration (up from 8% in 1999). Hydro and other renewables grow onlymodestly, leading to a gradual decline in their market share from 22% in1999 to about 9% in 2025. More details on Mexico's power sectorprojections are provided by Conzelmann et al. (2003).
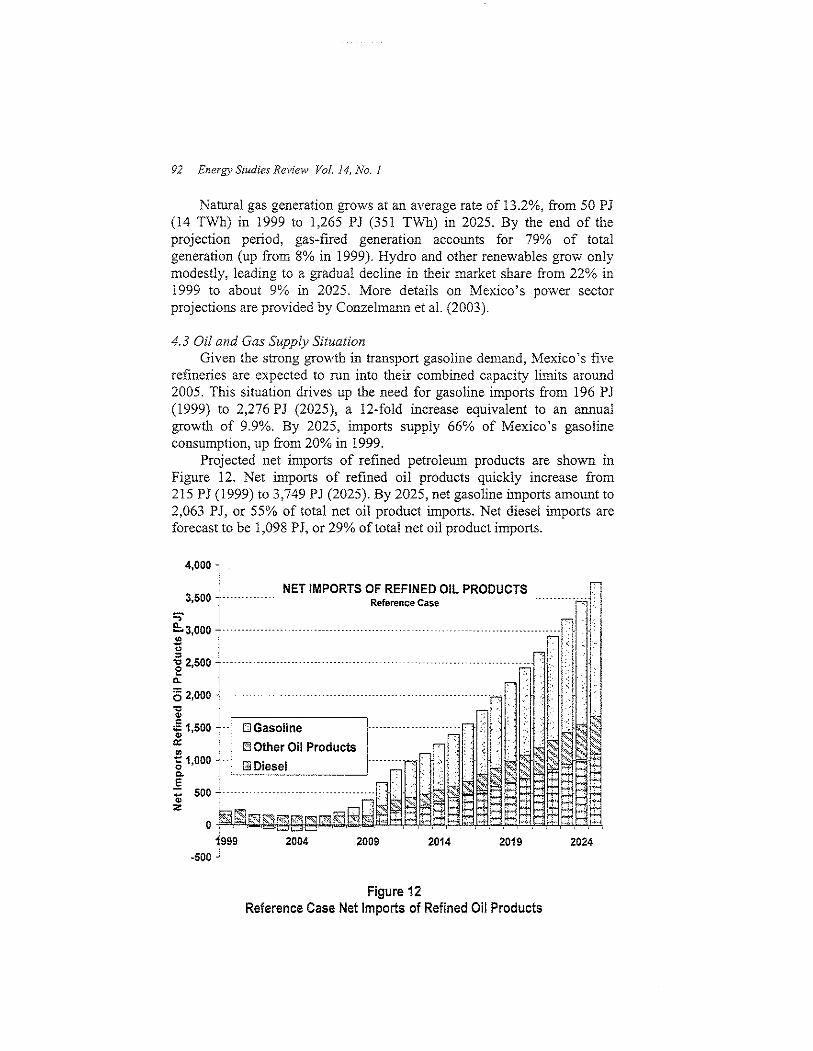
4.3 Oil and Gas Supply SituationGiven the strong growth in transport gasoline demand, Mexico's five
refineries are expected to run into their combined capacity limits around2005. This situation drives up the need for gasoline imports from 196 PJ(1999) to 2,276 PJ (2025), a 12-fold increase equivalent to an annualgrowth of 9.9%. By 2025, imports supply 66% of Mexico's gasolineconsumption, up from 20% in 1999.
Projected net imports of refined petroleum products are shown inFigure 12. Net imports of refined oil products quickly increase from215 PJ (1999) to 3,749 PJ (2025). By 2025, net gasoline imports amount to2,063 PJ, or 55% of total net oil product imports. Net diesel imports areforecast to be 1,098 PJ, or 29% of total net oil product imports.
4,000 1
I NET IMPORTS OF REFINED OIL PRODUCTS r3,500 l' m Reference Case --ijl:, I
~3,000uuuuuuuu uuuu, ,:llji 2,500 lwuuuuuuuuuuuuuuu wuu ' II'~ 2,000 juuuu ,uuuuu uuuuwuuuuu~ , ,~: "I
11
,500 tl ~ ~::::i~~ Products lu'unnnnn;;r-:" ,I 'lIbl~~.~lj~··I~~~·~'.il~~... ",~ 1,000 -1-, i 8J Diesel luu,~u,~ '1 >c' J~:.;; ~<
~"Q. 500 ~ , "u u~l. . k" ~ .-~, ,', ..j
z! _nfl~ F1 F i"':::-'I):':+f::-'o I!§~~~~~ k'11Z'l SJ tt:J klb 4-i l=L . ,. +:- -' .., h.i ,L -
1999 2004 2009 2014 2019-500 j
Figure 12Reference Case Net Imports of Refined Oil Products

Conze!mann et al 93
Figure 13 shows Mexico's net oil export ha1ance. The graph clearlyshows the impact of the projected growth in refilled product imports.While crude oil exports are expected to continue their growth at an averagerate of 0.7% per year from 3,396 PJ in 1999 to 4,520 PJ in 2025, netimports of refined products quickly increase and result in a rapid drop innet oil exports, eventually declining to 771 PJ in 2025, down from a peakof 3,848 PJ in 2005.
202420192014
II·.. H
ir···..·H......H.H.U.H...H....U.... u •••••
I
2009
NET OIL EXPORT BALANCEReference Case
2004
7,000 ,i
3,000 .[~ I~ 2,000 +HU U ... UHUHH' H-.. !tf) !-::: 1,000 i 'UU'HUUHH'H' UUU.~ I~ 0: iJoi.i:P~~"L.!';'1;;-'C'c;::;'",--,-, --,...,"-'-'-'---'--r-r-;--r--,---,...-,-"
.1,000 +UUUUHUUUUHUH~I ~
.2000.j.HUHUHHH', I
.3,000 t) -o-Crude OilI I -0- Refined Products
4000 ~'1, I I vIolal Net Oil Exports
.5,000 J1999
Figure 13Reference Case Net Oil Export Balance
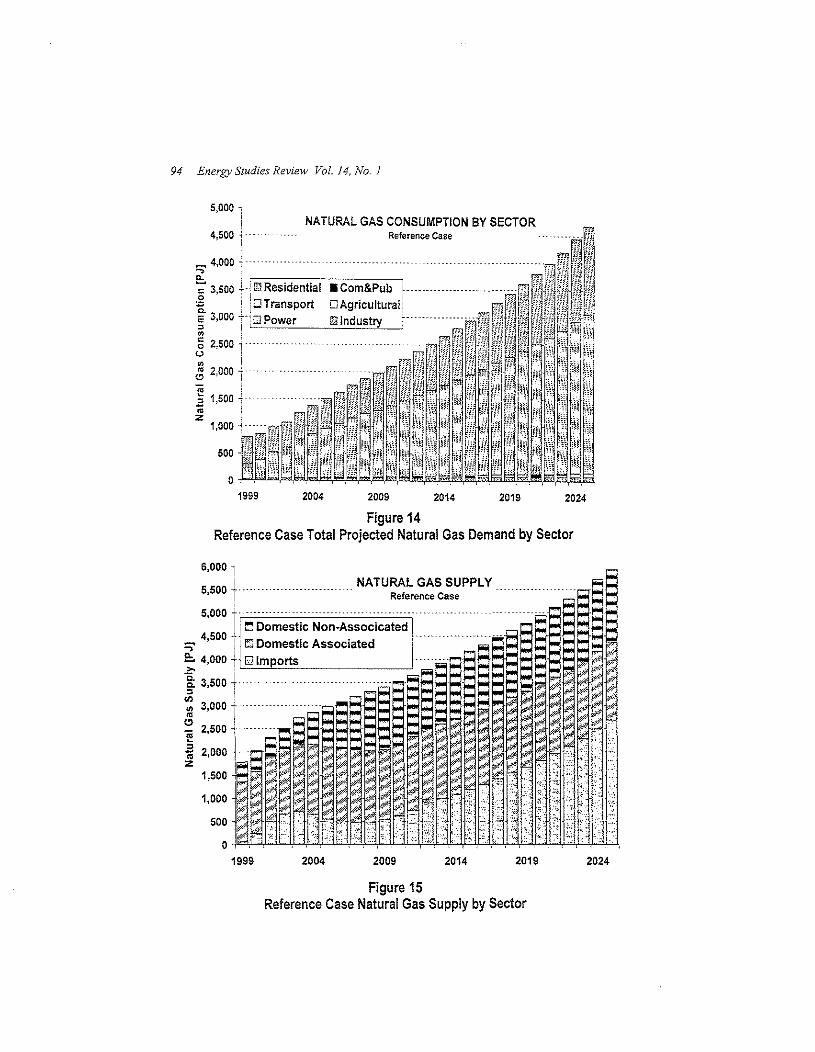
Total natural gas demand is forecast to grow from 799 PJ (21 billionm') to 4,678 PJ (127 billion m') over the projection period (Figure 14).Despite the strong growth in industrial demand (1,114 PJ total gro'Wih, or4.6% per year), the growth in natural gas demand is heavily driven by thepower sector dynamics. Natural gas consumption for power generationquickly grows from 273 PJ (7 billion m3) in 1999 to 2,914 PJ (79 billionm3) in 2025, equivalent to a 9.5% annual growth rate and accounting for68% (2,641 PJ) of the total growth.
94 Energy Studies Review Vol. 14, No.1
1999 2004 2009 2014 2019 2024
Figure 14Reference Case Total Projected Natural Gas Demand by Sector
2019 2024201420092004
, 1
fi" H·o -1""'I-"'--'HL..lf-'CLC!F-"'--'F'!c.cJ,L...u.:"Pli'-'!w!""-''I-"~-\'-"HL-' "1-'-'>'\L""','44'"'-,
1999
6,000 ,
5,500 I.. NATURAL GAS SUPPLY1 Reference Case
5,000 L .Iil!l Domestic Non-Associcated I
4500 -, , .,>' ~ i0 Domestic Associated f
~ 3,000 r" '.- 2,500,.. ..
~ I" 2,000 1"'Z I
1,500 ~
1,000
500
Figure 15Reference Case Natural Gas Supply by Sector
Conzelmann et al 95
Natural gas supply model results are shown in Figure 15. The rapidlygrowing demand is expected to put a strain on the domestic gas supplysystem. Results indicate the need to develop additional gas fields or relyon increasing gas imports, particularly after 2008 when gas fields currentlyunder development reach their maXimU1TI output (domestic non-associatedgas). At the same time, associated gas production is projected to slowdown as Mexico's oil refineries reach their combined process capacity,limiting domestic cmde oil production (assuming export markets cannotabsorb this incremental production). The results are clearly driven by someof the oil and gas sector-specific assumptions, such as (1) total capacity ofall gas processing plants remains constant at 5.034 billion ft' per day, (2)total capacity of all fractionating plants remains constant at 544 million 1'1'per day, (3) natural gas exports are marginal and decreasing, and (4) theratio of cmde to associated gas remains constant at historical levels.
It should be noted that according to SENER's most recent natural gasmarket analysis (SENER, 2002), PEMEX may substantially increase itsnatural gas investment program, with the goal of increasing its gasprocessing capacity, adding new integrated gas processing plants in theBurgos region, expanding its existing fractionating facilities inCoatzacoalcos, and upgrading its pipeline system. Under the acceleratedgas development program, domestic natural gas production may increasesubstantially to almost 9.0 billion ft' per day by 2010 and therebysignificantly alter the results above. This issue may be analyzed in moredetail in subsequent model runs.
In addition, the study reported here did not attempt to investigatedifferent sources of imported gas or whether it will be in the form ofliquefied natural gas (LNG) and where these LNG terminals will likely belocated. Undoubtedly though, if Mexico will not be able to close theprojected gap between supply and demand either from additional domesticsupplies or new imports, it might be exposed to price volatility similar towhat has been observed in the United States recently where, according toAlan Greenspan (2003), "futures markets anticipate that the currentshortage in natural gas will persist well into the future."
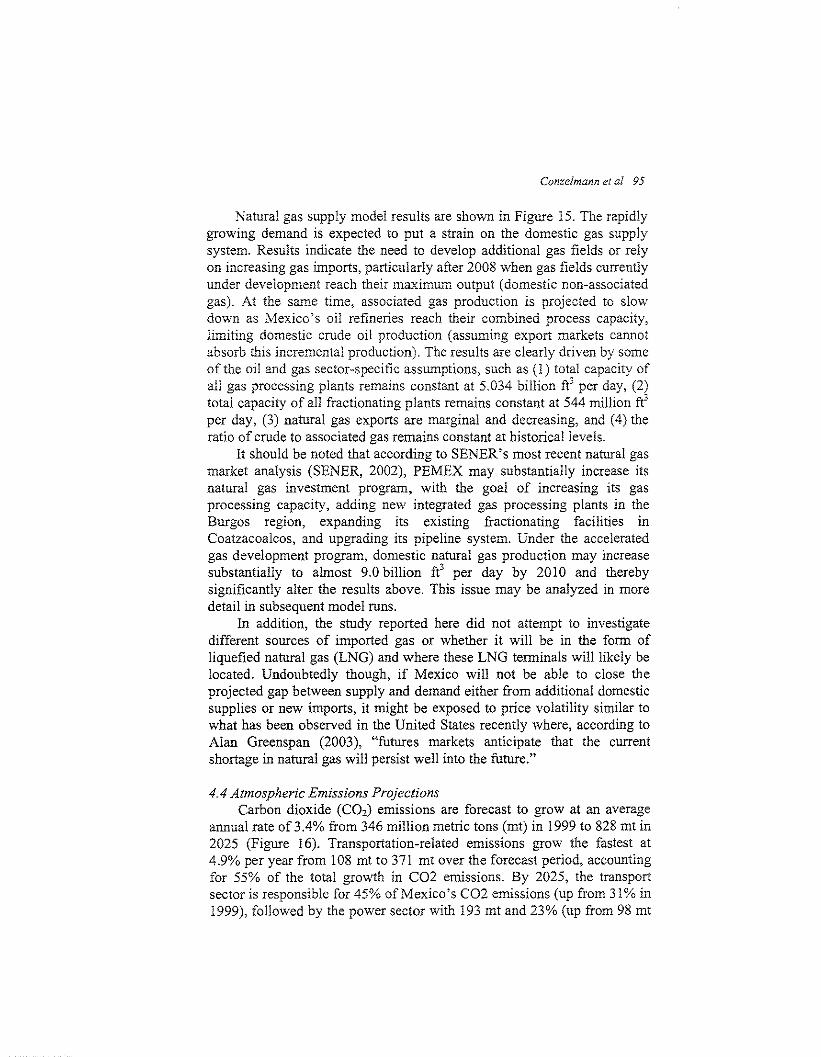
4.4 Atmospheric Emissions ProjectionsCarbon dioxide (C02) emissions are forecast to grow at an average
annual rate of 3.4% from 346 million metric tons (mt) in 1999 to 828 mt in2025 (Figure 16). Transportation-related emissions grow the fastest at4.9% per year from 108 mt to 371 mt over the forecast period, accountingfor 55% of the total grO\vth in C02 emissions. By 2025, the transportsector is responsible for 45% of Mexico's C02 emissions (up from 31% in1999), followed by the power sector with 193 mt and 23% (up from 98 mt
96 Energy Studies Review Vol. 14, No. I
and 28%) and industry with 147 mt and 18% (up from 58 mt and 17%).The 5% drop in the power sector share is related to the rapidly growingpenetration of natural gas as an energy source in that sector.
900
800 Reference CaseCO, EMISSIONS BY SECTOR
20242019201420092004o
1999
I 700 -r I U Agriculture &1 Residentialiii !!! Transport§ 600.,.1 ~ Industry- I§ OSupply§ 500-r
Figure 16: Reference Case CO, Emissions by Sector
5,000 1
2004 2009 2014 2019 2024
Figure 17: Reference Case NO. Emissions by Sector
Conzelmann et al 97
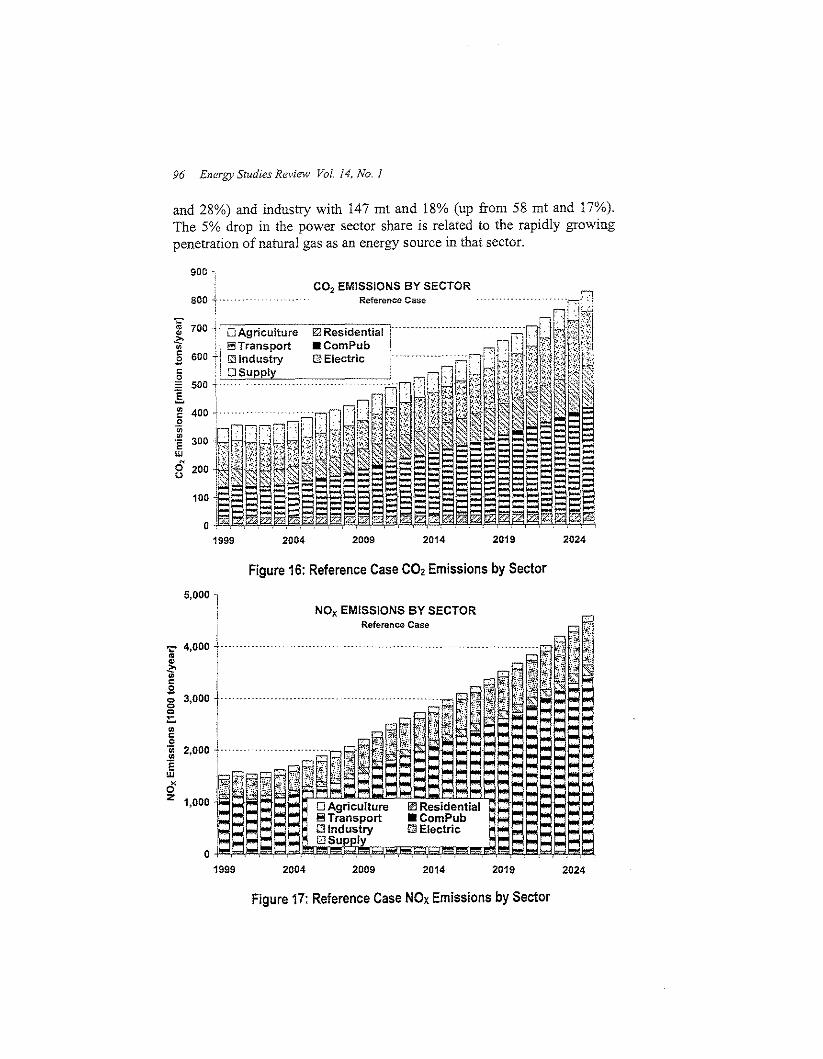
As shown in Figure 17, national emissions of nitrogen oxides (NOx)are projected to increase from 1.52 mt (1999) to 4.61 mt (2025), equivalentto a 4.4% growth rate. This development is closely linked to transportsector dynamics, as the sector contributes about 77%, or 2.38 mt, to theoverall growth in NOX emissions. The transport share remains very highand gradually increases from 67% to 74% through the forecast period. Thepower sector, the second largest source, contributes 282 kilotons (kt) orabout 19% in 1999 and 837 kt or about 18% in 2025.
SO, EMISSIONS BY SECTORReference Case
"".."""'"=.s'"'"'"~'"=0'in.l!lEw<3<n 500
o1999 2004 2009
I!'J Residential I,
2014 2019 2024
Figure 18: Reference Case 502 Emissions by Sector
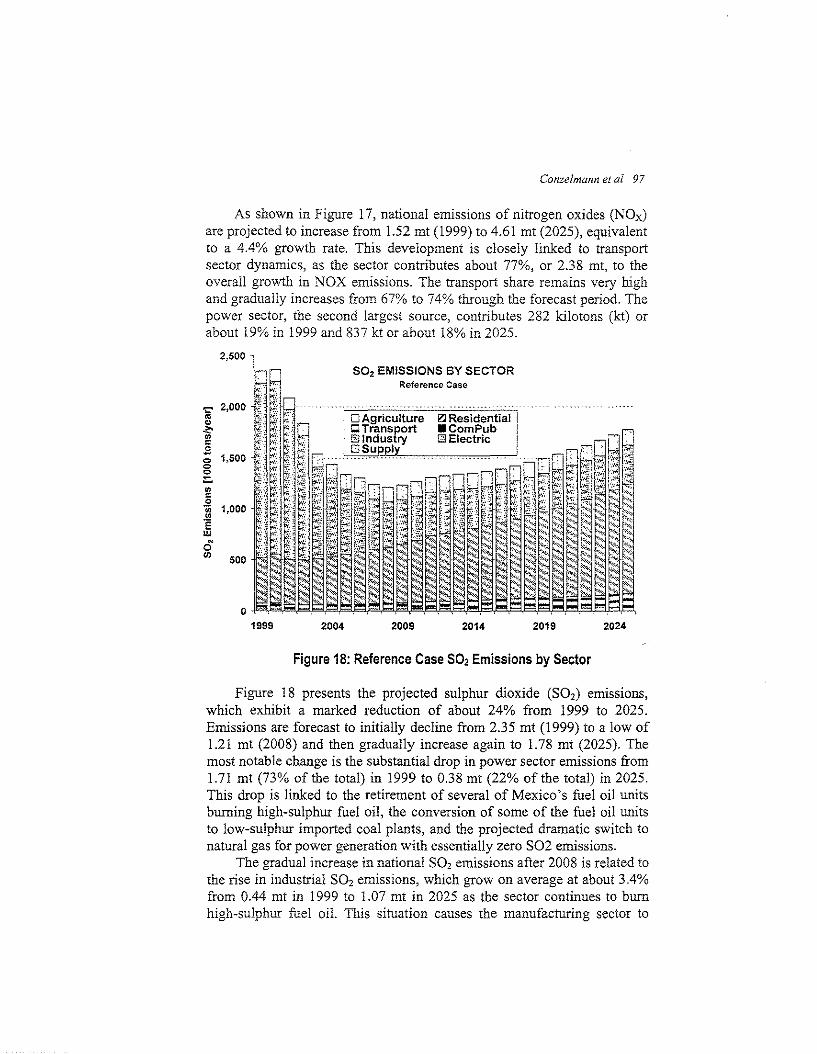
Figure 18 presents the projected sulphur dioxide (S02) emissions,which exhibit a marked reduction of about 24% from 1999 to 2025.Emissions are forecast to initially decline from 2.35 mt (1999) to a low of1.21 mt (2008) and then gradually increase again to 1.78 mt (2025). Themost notable change is the substantial drop in power sector emissions from1.71 mt (73% of the total) in 1999 to 0.38 mt (22% of the total) in 2025.This drop is linked to the retirement of several of Mexico's fuel oil unitsburning high-sulphur fuel oil, the conversion of some of the fuel oil unitsto low-sulphur imported coal plants, and the projected dramatic switch tonatural gas for power generation with essentially zero S02 emissions.
The gradual increase in national SO, emissions after 2008 is related tothe rise in industrial S02 emissions, which grow on average at about 3.4%from 0.44 mt in 1999 to 1.07 mt in 2025 as the sector continues to burnhigh-sulphur fuel oil. This situation causes the manufacturing sector to
98 Energy Studies RevieYol Vol. 14, No.1
become the largest source of S02 by the end of the analysis period,contributing 60% of S02 emissions as compared to 19% in 1999.
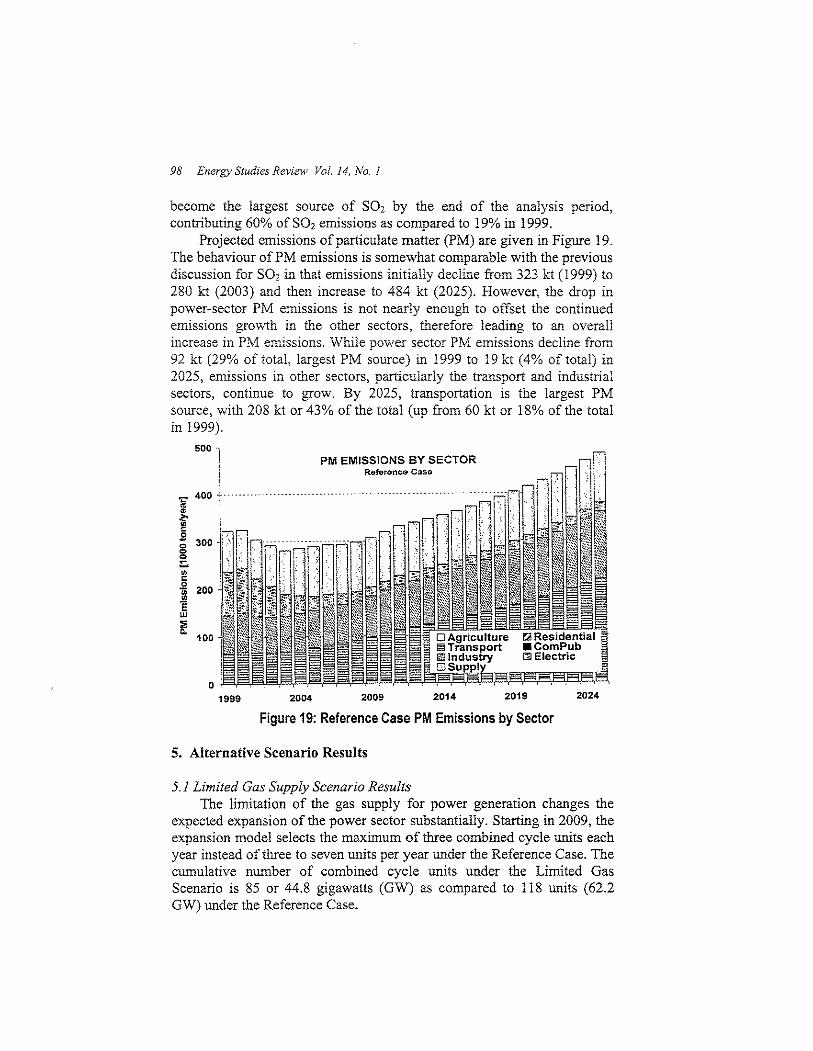
Projected emissions of particulate matter (PM) are given in Figure 19.The behaviour of PM emissions is somewhat comparable with the previousdiscussion for S02 in that emissions initially decline from 323 kt (1999) to280 kt (2003) and then increase to 484 kt (2025). However, the drop inpower-sector PM emissions is not nearly enough to offset the continuedemissions growth in the other sectors, therefore leading to an overallincrease in PM emissions. While power sector PM emissions decline from92 kt (29% of total, largest PM source) in 1999 to 19 kt (4% of total) in2025, emissions in other sectors, particularly the transport and industrialsectors, continue to grow. By 2025, transportation is the largest PMsource, with 208 kt or 43% of the total (up from 60 kt or 18% of the totalin 1999).
PM EMISSIONS BY SECTORReferoncO' Caso
500 "j,
I.,... 400 +~ I~ ,
fg<:.
100
o1999 2004 2009 2014
--["1
2019 2024
Figure 19: Reference Case PM Emissions by Sector
5. Alternative Scenario Results
5.1 Limited Gas Supply Scenario ResultsThe limitation of the gas supply for power generation changes the
expected expansion of the power sector substantially. Starting in 2009, theexpansion model selects the maximum of three combined cycle units eachyear instead of three to seven units per year under the Reference Case. Thecumulative number of combined cycle units under the Limited GasScenario is 85 or 44.8 gigawatts (GW) as compared to 118 units (62.2GW) under the Reference Case.
Conze/mann et al 99
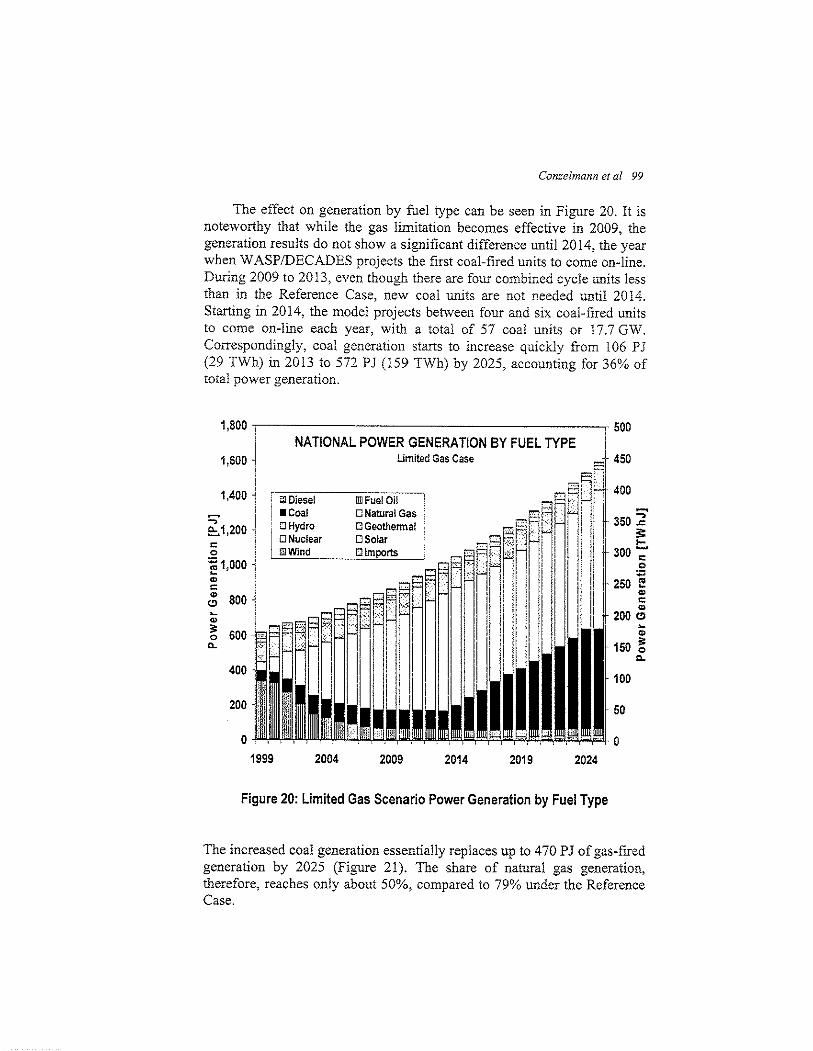
The effect on generation by fuel type can be seen in Figure 20. It isnoteworthy that while the gas limitation becomes effective in 2009, thegeneration results do not show a significant difference until 2014, the yearwhen WASP/DECADES projects the first coal-fired units to come on-line.During 2009 to 2013, even though there are four combined cycle units iessthan in the Reference Case, new coai units are not needed until 2014.Starting in 2014, the model projects between four and six coal-fired unitsto come on-line each year, with a total of 57 coal units or 17.7 GW.Correspondingiy, coal generation starts to increase quickly from 106 PJ(29 TWh) in 2013 to 572 PJ (159 TWh) by 2025, accounting for 36% oftotal power generation.
50
o
100
~..150 ~
""
202420192014
Umited Gas Case
20092004
i mDiesel !Ill Fuel Oil! • Coal 0 Natural Gas
II ~ ~~~~Zar ~ ~:~ermalL"'ill~w~in~d___=D~lm"'po=rts"__.J_C:JS I f1
~H I
~;~I' I
II 'II
o1999
200
400
1,600
1,800.,------------------'! 500NATIONAL POWER GENERATION BY FUEL TYPE i
J450
~i :~II I 300 i
250 f!i ~
'"200 Cl
1,400
::;'e:.1,200l:o
:;;; 1,000~
'"l:; 800
Figure 20: Limited Gas Scenario Power Generation by Fuel Type
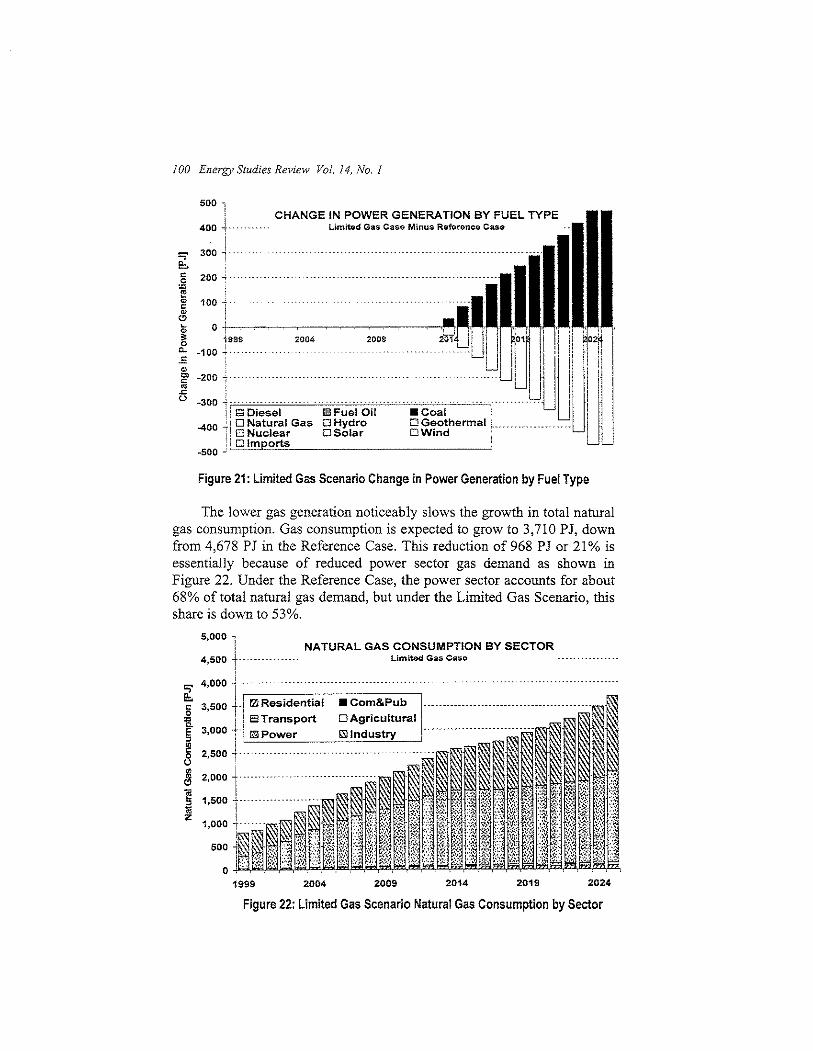
The increased coal generation essentially repiaces up to 470 PJ of gas-firedgeneration by 2025 (Figure 21). The share of natural gas generation,therefore, reaches only about 50%, compared to 79% under the ReferenceCase.
100 Energy Studies Review Vol. 14, No.1
500 iCHANGE IN POWER GENERATION BY FUEL TYPE
Limited Gas Caso Minus Roforonco Caso
-300 ~c;",:,",::",,""~"~"7"~"~H~"~"~H';';"";';H:,"H~""7":;H";"",,,H~H~""~H':';:"'::H~H~"C'H~H~'~H~H~"H,'i! § Diesel l1iJ Fuel Oil • Coal !
-400 i i 0 Natural Gas 0 Hydro 0 Geothermal L_11 o Nuclear OSolar OWind ." ,Q=lm=p"'o"-rts""" -'
~500";- -
20092004
Figure 21: Limited Gas Scenario Change in Power Generation by Fuel Type
The lower gas generation noticeably slows the growth in total naturalgas consumption, Gas consumption is expected to grow to 3,710 PJ, downfrom 4,678 PJ in the Reference Case, This reduction of 968 PJ or 21 % isessentially because of reduced power sector gas demand as shown inFigure 22. Under the Reference Case, the power sector accounts for about68% of total natural gas demand, but under the Limited Gas Scenario, thisshare is down to 53%,
2024201920142009
NATURAL GAS CONSUMPTION BY SECTORLimitod Gas Caso
2004
f'Zl Residential
o .jLl)~~~~';;j@~~Q)6~~IJi'il,!~I,§ii~~i'Jj;!;lp;;,1999
500
Figure 22: Limited Gas Scenario Natural Gas Consumption by Sector
COl'.zelmann et aliOi
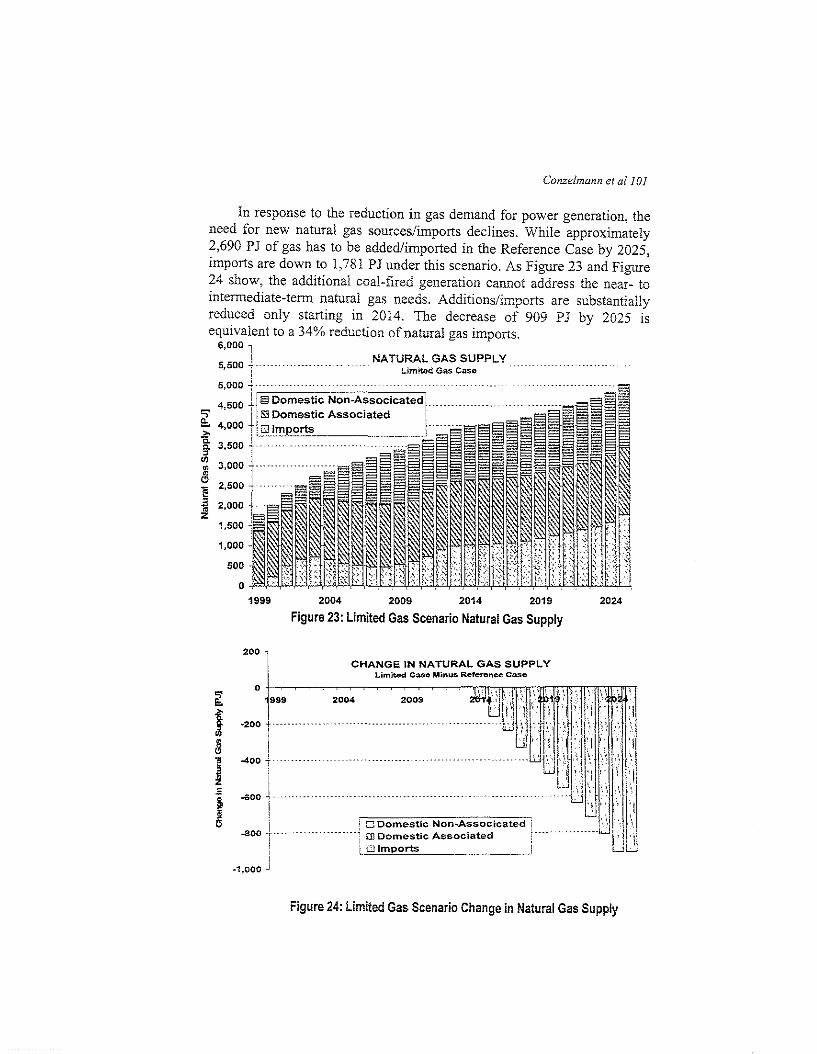
in response to the reduction in gas demand for power generation, theneed for new natural gas sources/imports declines. While approximately2,690 PJ of gas has to be added/imported in the Reference Case by 2025,imports are down to 1,781 PJ under this scenario. As Figure 23 and Figure24 show, the additional coal-fired generation cannot address the near- tointermediate-term natural gas needs. Additionslimports are substantiallyreduced only starting in 2014. The decrease of 909 PJ by 2025 isequivalent to a 34% reduction of natural gas imports.
6,000 1
! NATURAL GAS SUPPLY ,5,500,·- ----.. l..imitod Gas ens"
!5,000 -+ 'r:'= ::-c=c::-~===_::;;
~ I4,000 t10 Imports
~ i====-------,go 3,500 1
~ 3,000 i- _ ..E 2,500 +~
1,500 j1,000 j
500
o1999 2004 2009 2014 2019 2024
Figure 23: Limited Gas Scenario Natural Gas Supply
CHANGE IN NATURAL GAS SUPPLYLimited Case Minus. Reference ClISe
2004 2009
200 l
!o.J-,-~~~~~~~~--'-'ril'17''I'n'I:-cfE'J'El'l~Im'l':'Jl)Jm
1999
'
200 1-400 i- d
•,
-Goo t-!1 i 0 Domestic Non~Associcated i
-300 +m .. mmmmnul rn Domestic Associated run! Li,=O,-,lm"'.Ep~o!:,rts",- -.J
I.1,000 J
Figure 24: Limited Gas Scenario Change in Natural Gas Supply
102 Energy Studies Review Vol. 14, No. j
50
-10
Figure 25: Limited Gas Scenario Change in C02 Emissions
CHANGE IN NOx EMISSIONS BY SECTORLimited Gas Case Minus Reference Case
l?2 Residential 1. ... .• ComPub .!El Electric
20242019201420092004
160,
I140 In ...mm...'" ,
_:o~ 120 1 _ .1001."."",.,
g !~ 80 -l-_.
i : 0 Agriculture60 r m
! § Transport40 LJ SS Industry
1 ! OSupply
-60 J Figure 26: Limited Gas Scenario Change in NOx Emissions
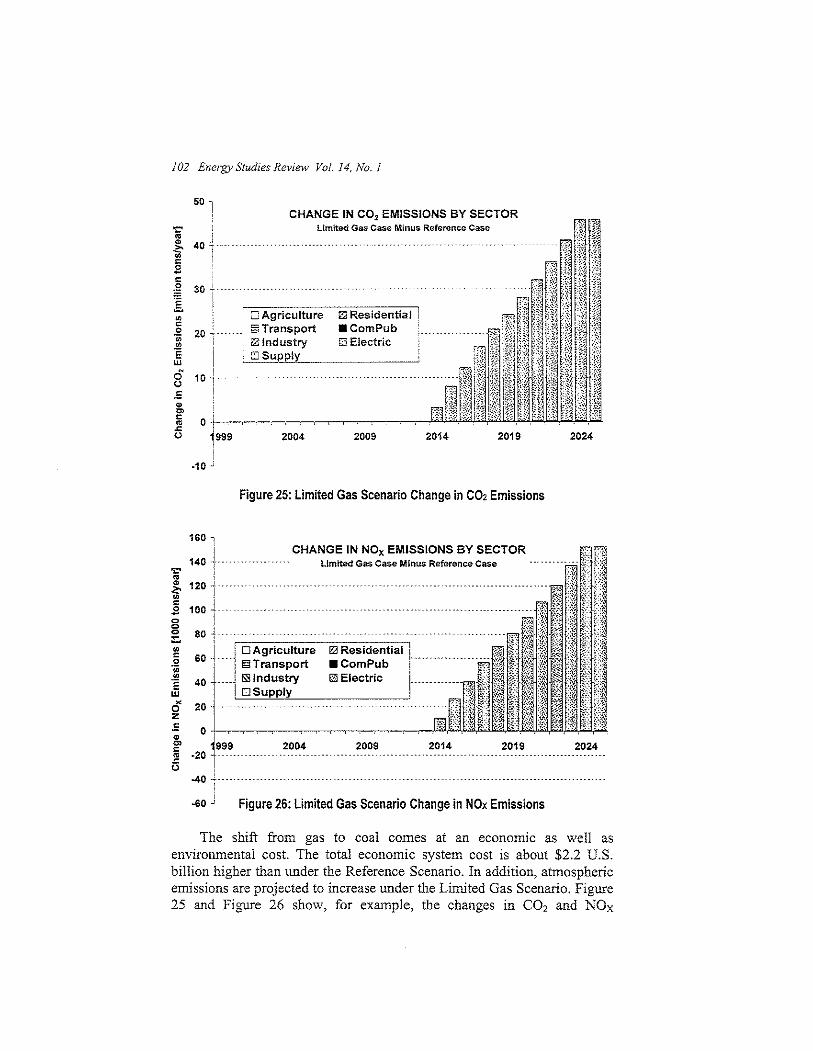
The shift from gas to coal comes at an economic as well asenvironmental cost The total economic system cost is about $2.2 U.S,billion higher than under the Reference Scenario. In addition, atmosphericemissions are projected to increase under the Limited Gas Scenario. Figure25 and Figure 26 show, for example, the changes in CO2 and NOx
Conzelmann et al 103
emISSIOns compared to the Reference Case. Under the Limited GasScenario, power sector CO2 emissions grow to 239 mt, while total nationalemissions reach 874 mt. This increase is about 46 million tons more thanthe Reference Case, equivalent to a 24% increase in power sectoremissions, or 5.5% of national CO2 emissions.
Emissions of NOx exhibit a similar behavior in that power sectoremissions are forecast to reach about 990 kt by 2025, which is about152 kt, or 18%, higher than under the Reference Case.
5.2 Other Scenario ResultsDetailed modeling results are also available for a renewables scenario
and a nuclear power scenario. The renewables scenario shows thereduction in gas imports and atmospheric emissions associated with anaccelerated introduction of renewable energy. The nuclear scenariopresents similar types of results for a nuclear policy case that includes oneadditional nuclear unit.
REFERENCES
Bates, R. (2002), Spreadsheet with Indexes of International Energy Prices forCoal, Oil, and Gas, Developed for the Turkey Energy and EnvironmentalReview.
Conzelmann, G, J. Fernandez Velazquez, E. !bars Hernandez, H. Cadena Vargas,1. Jimenez Lerma, J. Quintanilla Martinez, and V. Aguilar Alejandre (2003),"Powering Mexico's Future - An In-Depth Look at Long-Term ElectricityMarket Developments", Presented at the 23rd Annual USAEE/lAEEConference, October, 2003, Mexico City, Mexico.
Greenspan, A. (2003), "Natural Gas Supply and Demand Issues", Testimony ofChairman Alan Greenspan before the Committee on Energy and Commerceand the Committee on Financial Services, U.S. House of Representatives,July 10 and July 15,2003.
SENER (2002), Prospectiva del Mercado de Gas Natural 2002-2011, MexicoCity, Mexico.