Embed Size (px)
Citation preview
THIS REPORT CONTAINS ASSESSMENTS OF COMMODITY AND TRADE ISSUES MADE BY
USDA STAFF AND NOT NECESSARILY STATEMENTS OF OFFICIAL U.S. GOVERNMENT
POLICY
Date:
GAIN Report Number:
Approved By:
Prepared By:
Report Highlights:
The foodservice industry in Mexico includes the hotel, restaurant, and institutional segments. There are many
export opportunities for U.S. suppliers of food and beverages interested in this market, so it is important to
analyze each segment separately. This report focuses on the hotel segment, highlighting its structure, entry
strategy, and best product prospects.
Luis Chavez
Brian Goggin
HRI - Hotel Foodservice Sector
Food Service - Hotel Restaurant Institutional
Mexico
MX3505
3/8/2013
Required Report - public distribution
Post:
DISCLAIMER: This report is for informational purposes only to assist exporters of U.S. food and
agricultural products in their sales and promotional efforts in Mexico. The data in this report was
collected from local trade and government sources and is not necessarily official U.S. Department of
Agriculture (USDA) data. Neither the U.S. Agricultural Trade Offices nor the USDA endorse any
company mentioned herein. U.S. exporters should take normal commercial cautions when dealing with
any potential business partner, including checking credit/financial references.
SECTION I. MARKET SUMMARY
Mexico is the third largest U.S. trading partner after China and Canada. In 2012, U.S. exports of agricultural
products and fisheries to Mexico were valued at $18.95 billion, and around 70% of Mexican agricultural and
fisheries exports went to the United States. In 2012, the United States’ major agricultural exports to Mexico were:
coarse grains ($2.95 billion), red meats ($1.97 billion), soybeans ($1.86 billion), dairy products ($1.23 billion),
wheat ($1.12 billion), poultry meat ($1.05 billion), and sugar/sweeteners ($887 million).
In 2012, the foodservice sector in Mexico saw a stronger recovery after the economic downturn and the negative
image generated by drug-related violence since 2009. Even though sales began to pick up as early as 2010 and
have increased in 2011 and 2012, the recovery is still not complete, affected by the global increase in food prices,
a still uncertain economic outlook for Mexico’s main trade partner: the United States, and the negative reputation
of Mexico as an unsafe tourist destination.
Still, because the purchasing power of the Mexican consumer is expected to continue to increase as the Mexican
economy shows clear signs of stability and growth, overall consumer foodservice is expected to perform well. As
explained in previous reports, restaurants continue to grow, especially those offering home delivery, a trend
driven by both the fast pace lifestyle in large metropolitan areas or because of the sense of insecurity in some
cities. Similarly, the institutional segment registers a positive trend, with hospitals, caterers, airlines, industry
cafeterias, and even prisons and schools evolving into professional foodservice providers, creating a large market
with several opportunities for specific niches. Hotels, the main subject of this year’s report, are no exception:
Mexico’s Ministry of Tourism (SECTUR) highlighted that in the 2007-2012 period, private investment in the
tourism sector, led by the hotel industry (about 40% of the total), totaled over $19 billion.
The fact that Mexicans are becoming more cosmopolitan in their consumer behavior and that one third of the
population is between 20 - 40 years old also has an impact on new opportunities for the foodservice industry.
New concepts in restaurants and hotels with non-traditional cuisines (Thai, Chinese, Mediterranean, Ethiopian,
Vietnamese, etc.) are appearing throughout the country, and Mexican consumers, prone to grant themselves
certain “luxuries” when additional income is available, are travelling and eating outside their homes more often.
Mexico City ATO

While the restaurant and institutional segments have seen positive adjustments in terms of value growth, the 2011
and 2012 HRI GAIN Reports focusing on said segments remain current. This report will focus on the hotel
segment, although most of the information reported previously for the restaurant and institutional segments, such
as market entry strategy, competition and best prospects is very similar and minor differences will be pointed out
in each section.
According to the Mexican Institute of Geography and Statistics (INEGI), out of the three segments in HRI
foodservice, hotels are the smallest segment by number of outlets (see chart below). However, because of the
socio-economic categories it targets, hotels represent a better opportunity for imported products, where price
differential might be an issue for other markets.
Chart 1. Mexico’s HRI Sector by Category # of Outlets
Source: INEGI - DENUE Database
The HRI sector is served mostly through independent distributors. Given that very few hotels and restaurants
import directly, U.S. suppliers will most likely need to service the market through an established distributor.
Please refer to “Section 2 – Road Map for Market Entry” below for more details.
As previously reported, the HRI industry sources almost 90% of its food and beverages from two sources: first,
through supermarket chains, specifically the price club stores like Sam’s Club, COSTCO, and City Club (you can
find a more detailed analysis of this distribution channel in our latest GAIN Retail report). Second, through the
traditional wholesale markets, also known by their Spanish term: Centrales de Abasto (CEDA). The CEDAs are
part of the food distribution chain as most of the food supply of the Mexican population passes through them. For
example, it is estimated that over 50% of all food products sold in Mexico, go through the Mexico City CEDA,
supplying more than 700,000 traditional public markets, outdoor informal markets called tianguis, street vendors,
mom and pop stores, and the retail and HRI industries.
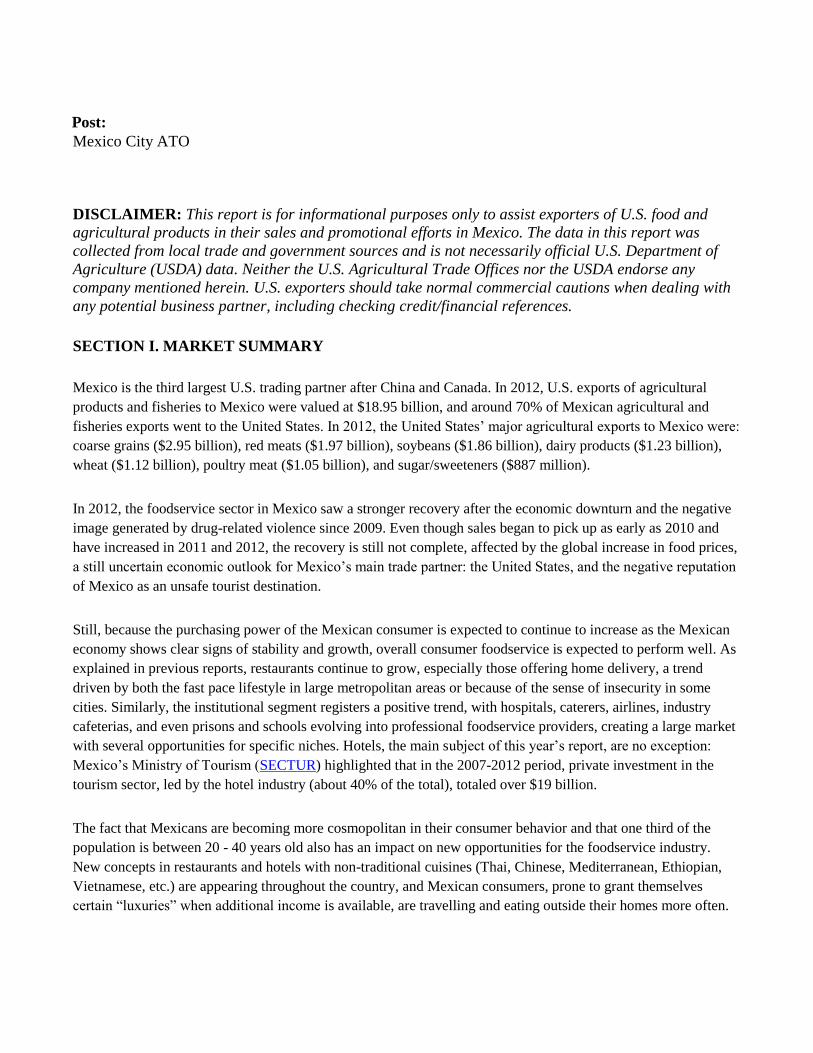
The main CEDAs are located in Mexico City, Guadalajara, and Monterrey, serving nearly 30 million people in
the country’s three major metropolitan areas. As points of entry in to Mexico, the CEDAs offer unique
opportunities for U.S. products and it is an indirect way to target the foodservice sector.
Table 1. Main Outlets where HRI sector source their fresh products
Produce Meat & Seafood Central Wholesale Markets 46% 22% Public Market 37% 17% Supermarket (Retail) 28% 30% Specialized Distributor 25% 48% Home Delivery 24% 25% Distributor multiple products 22% 27% Direct purchase w/producer 9% 13% Food Bank 7% 9% Others 1% 4%
Note: Percentages do not add up to 100%, because foodservice companies source in different outlets Source: El Economista. Agrointeligente Supplement June 2011
Hotel Segment Profile
In 2012, Mexico ranked 10th on the world’s main tourist destinations by number of foreign arrivals, with a little
less than 24 million international tourists from a record-high 143 different countries, but 23rd
when based on
tourism revenues, with almost $12 billion reported. Additionally, SECTUR estimates 177 million domestic
travelers in 2012 with a rate of growth of 4% per year. These numbers do not include nearly 60 million foreign
visitors that also come to Mexico via land borders (mainly from the United States) and cruise ships, since their
travel is less than 24 hours or does not include lodging.
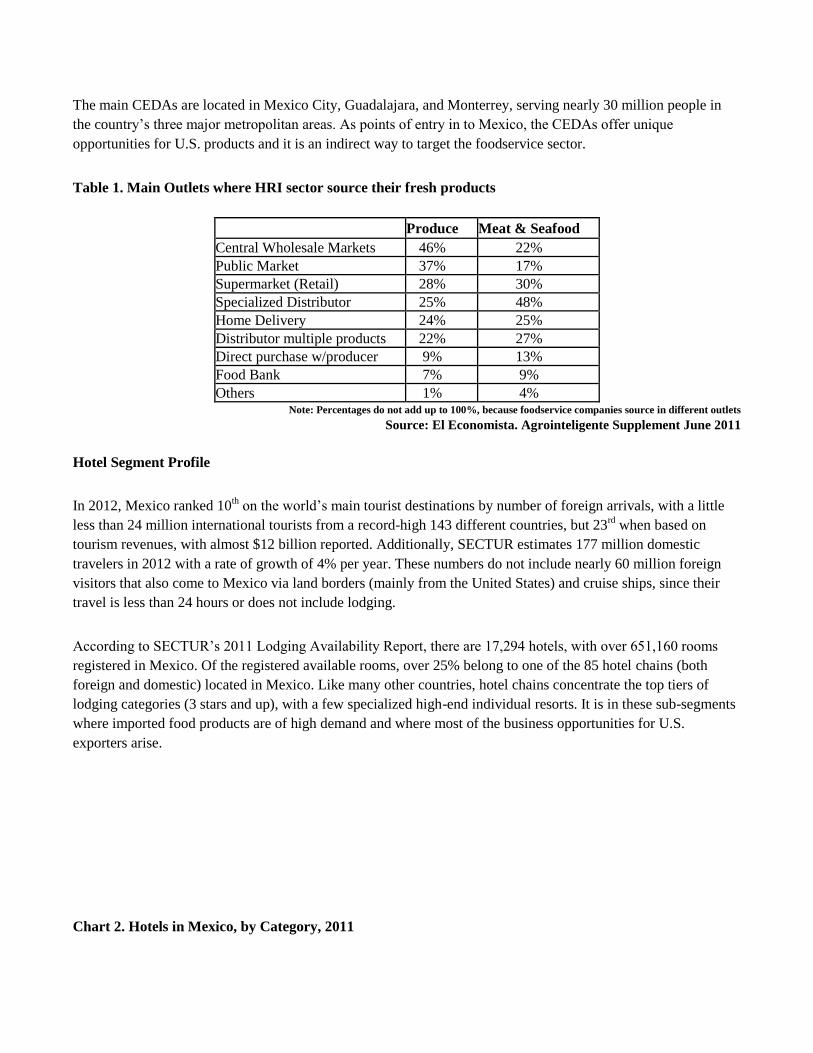
According to SECTUR’s 2011 Lodging Availability Report, there are 17,294 hotels, with over 651,160 rooms
registered in Mexico. Of the registered available rooms, over 25% belong to one of the 85 hotel chains (both
foreign and domestic) located in Mexico. Like many other countries, hotel chains concentrate the top tiers of
lodging categories (3 stars and up), with a few specialized high-end individual resorts. It is in these sub-segments
where imported food products are of high demand and where most of the business opportunities for U.S.
exporters arise.
Chart 2. Hotels in Mexico, by Category, 2011
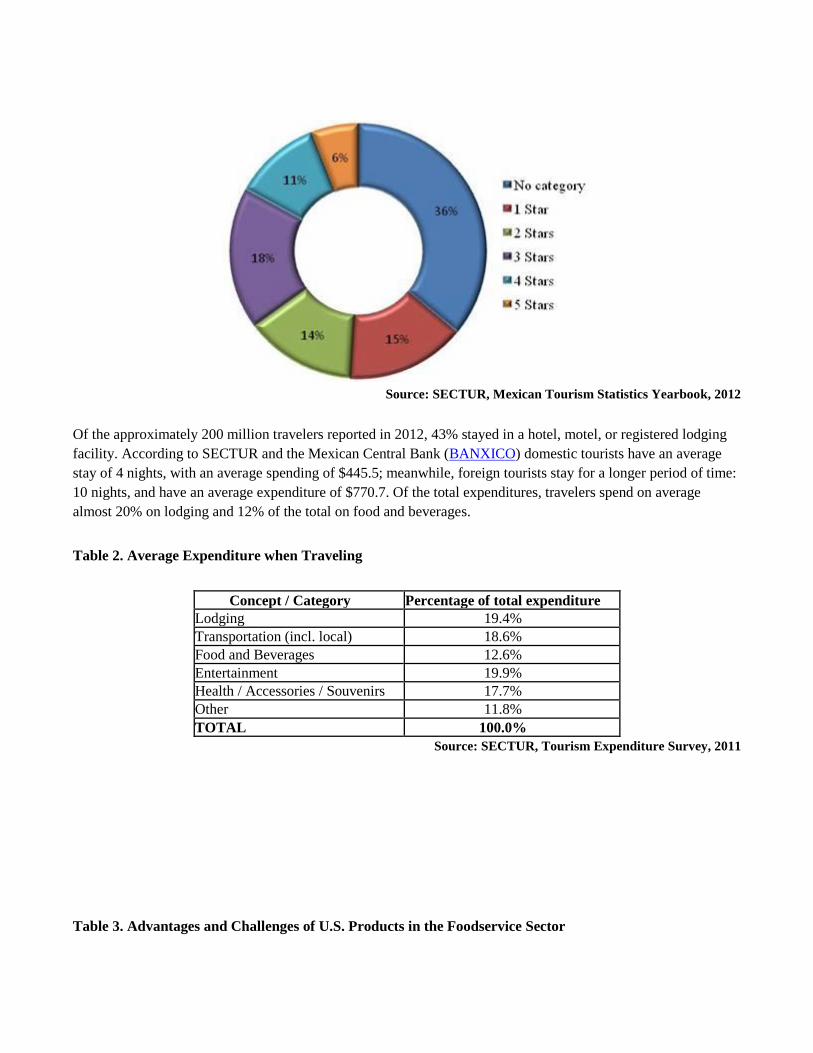
Source: SECTUR, Mexican Tourism Statistics Yearbook, 2012
Of the approximately 200 million travelers reported in 2012, 43% stayed in a hotel, motel, or registered lodging
facility. According to SECTUR and the Mexican Central Bank (BANXICO) domestic tourists have an average
stay of 4 nights, with an average spending of $445.5; meanwhile, foreign tourists stay for a longer period of time:
10 nights, and have an average expenditure of $770.7. Of the total expenditures, travelers spend on average
almost 20% on lodging and 12% of the total on food and beverages.
Table 2. Average Expenditure when Traveling
Concept / Category Percentage of total expenditure Lodging 19.4% Transportation (incl. local) 18.6% Food and Beverages 12.6% Entertainment 19.9% Health / Accessories / Souvenirs 17.7% Other 11.8% TOTAL 100.0%
Source: SECTUR, Tourism Expenditure Survey, 2011
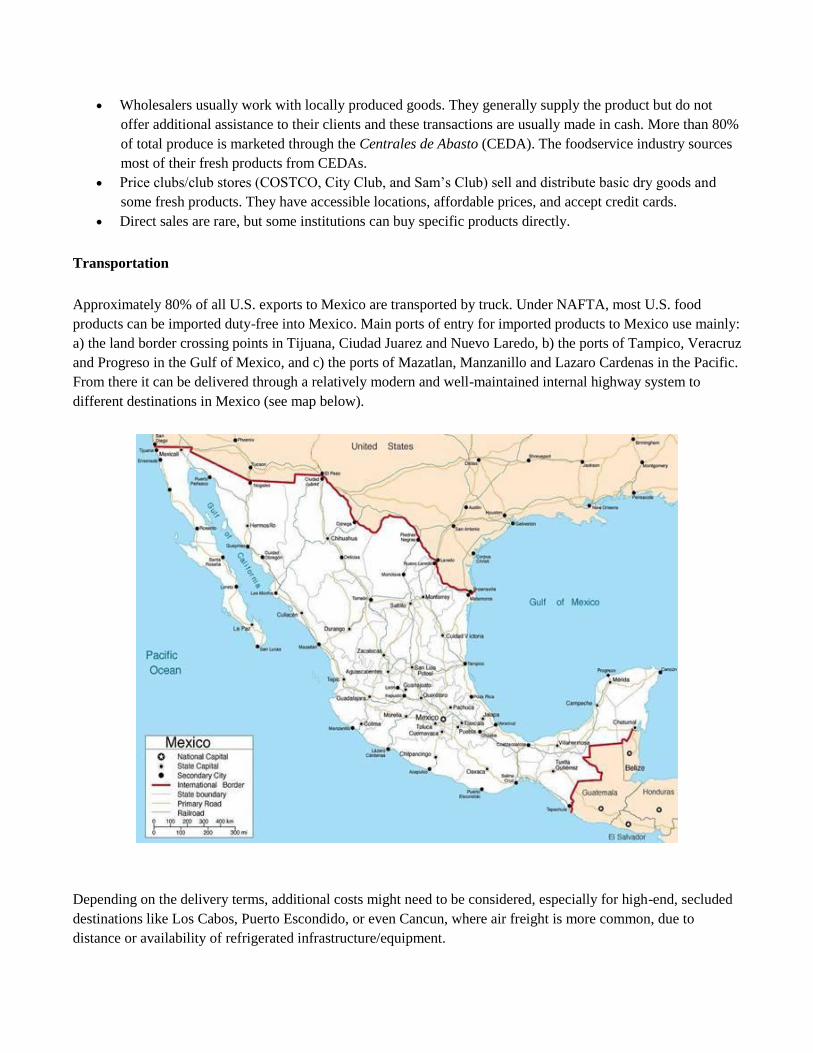
Table 3. Advantages and Challenges of U.S. Products in the Foodservice Sector
Advantages Challenges
All U.S. products can enter Mexico tariff-free With the exception of some high-end markets, price
of food is the key factor in food purchasing
decisions Sharing a land border with over 45 crossings, gives
U.S. exporters a competitive advantage over third
country suppliers
Transportation and distribution methods inside
Mexico are undeveloped in many regions
U.S. food products are usually regarded as high-
quality and safe Other countries are now able to deliver products
more efficiently to the Mexican market Higher income levels and more women in the
workforce have increased the demand to eat away
from home
Local producers and food processors are rising to
the challenge of producing quality goods, adapting
to growing demands The Mexican peso continues to be relatively stable in
its relation to the U.S. dollar, making unexpected
price fluctuations less likely
Mexican import regulations can change rapidly and
without notice, creating potential border issues and
delays
SECTION II. ROAD MAP FOR MARKET ENTRY
A. ENTRY STRATEGY
U.S. suppliers are encouraged to look for multiple local and regional distributors in Mexico and identify
distributors that service the major cities including Mexico City, Guadalajara, Monterrey and Tijuana, plus the
main beach destinations, such as Cancun, Los Cabos, Acapulco, Puerto Vallarta, and Mazatlan, where most of the
foodservice market is concentrated. Since these distributors already have an established relationship with key
contacts, it is highly recommended to approach these distributors first when entering the market.
Purchasing decisions by large institutions like hotel chains are usually made centrally by the chain supply
manager, with occasional input from the hotel’s chefs. For small volumes of products they turn to price
clubs/wholesale stores. Foodservice companies like to deal with established suppliers and local distributors that
provide excellent client services, have the infrastructure to handle a variety of products, and have good cold chain
management.
As previously reported, HRI companies in general: Are looking for products that help them reduce costs, reduce preparation times, and have stable prices. Seek, in order of preference: price, quality, and service. The key is price competitiveness and quick
access/availability of products. Have their demand directly linked with the size of the business. Products with the biggest volumes are
meat, processed foods, and cold meats. Look for suppliers that can also offer product variety and emergency necessities.
Purchase 80% of their fresh produce directly with a supplier at the CEDAs. Offer a variety of products depending on general preferences, unless they have specialized needs. Source imported specialty products from local/regional distributors, due to volume.
In Mexico, the best way to find a distributor and determine the feasibility of commercializing a product in the
market is to travel to Mexico and meet with several distributors. Mexico has a culture where personal business
relationships are very important. U.S. companies can take advantage of the U.S. pavilions organized by the
Agricultural Trade Offices in Mexico City and Monterrey to exhibit their products and meet key contacts,
including officials from large distributors who exhibit at the most important foodservice tradeshows. In many of
these shows and trade missions, U.S. exporters will also have an opportunity to showcase their products to their
potential final customer, like chefs and purchase managers.
B. MARKET STRUCTURE
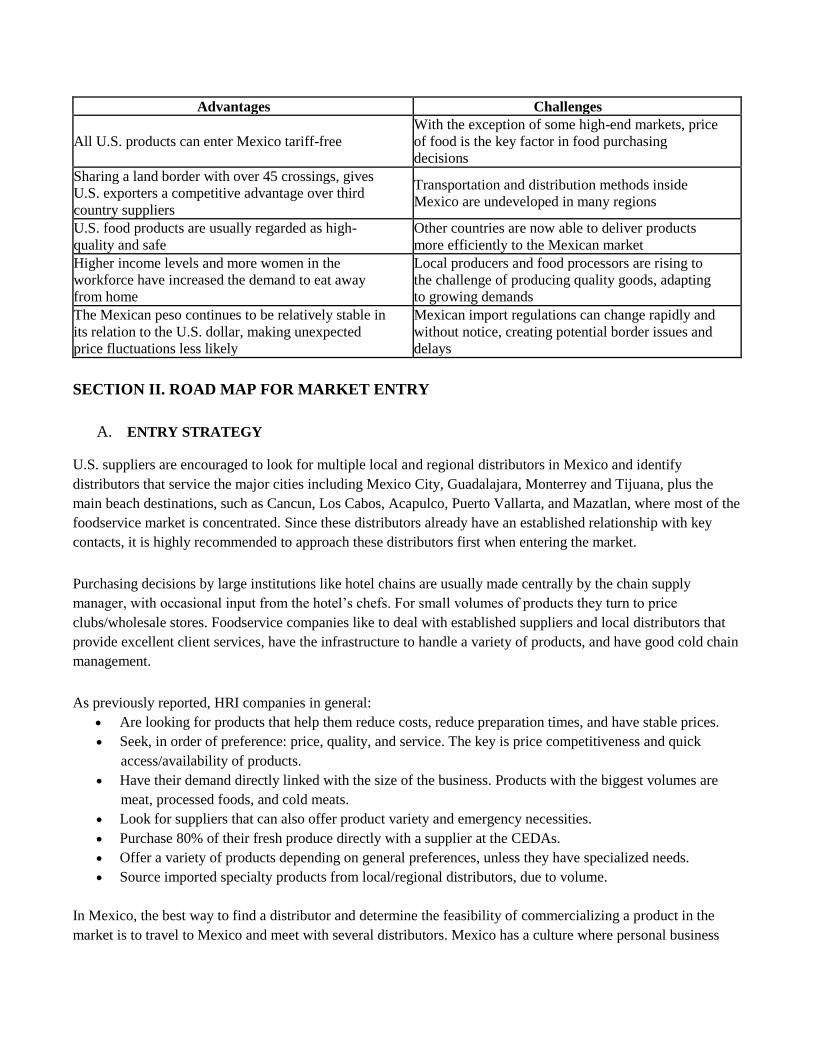
Distribution Channels for the Foodservice Industry in Mexico
Distribution Channels for HRI Institutional Sector The foodservice distribution is as follows:
Distributors can be divided into the following categories: Independent importers and/or distributors that have their own warehouses and deliver to the
entire HRI sector. They offer import assistance and all the required documentation, such as the
certificate of origin, compliance with the different Mexican norms, etc. Distributors who specialize in one product type, such as meat or seafood products. Distributors who specialize in several products such as frozen and/or refrigerated products and
dry goods.
Wholesalers usually work with locally produced goods. They generally supply the product but do not
offer additional assistance to their clients and these transactions are usually made in cash. More than 80%
of total produce is marketed through the Centrales de Abasto (CEDA). The foodservice industry sources
most of their fresh products from CEDAs. Price clubs/club stores (COSTCO, City Club, and Sam’s Club) sell and distribute basic dry goods and
some fresh products. They have accessible locations, affordable prices, and accept credit cards.
Direct sales are rare, but some institutions can buy specific products directly.
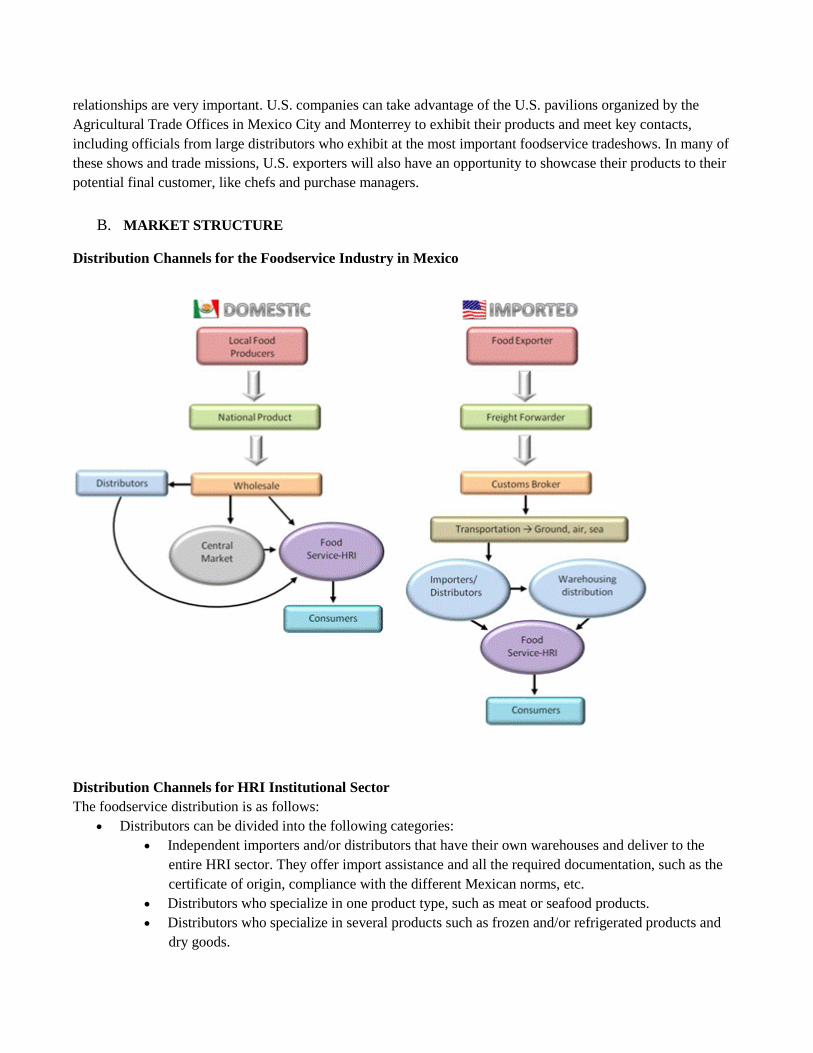
Transportation
Approximately 80% of all U.S. exports to Mexico are transported by truck. Under NAFTA, most U.S. food
products can be imported duty-free into Mexico. Main ports of entry for imported products to Mexico use mainly:
a) the land border crossing points in Tijuana, Ciudad Juarez and Nuevo Laredo, b) the ports of Tampico, Veracruz
and Progreso in the Gulf of Mexico, and c) the ports of Mazatlan, Manzanillo and Lazaro Cardenas in the Pacific.
From there it can be delivered through a relatively modern and well-maintained internal highway system to
different destinations in Mexico (see map below).
Depending on the delivery terms, additional costs might need to be considered, especially for high-end, secluded
destinations like Los Cabos, Puerto Escondido, or even Cancun, where air freight is more common, due to
distance or availability of refrigerated infrastructure/equipment.
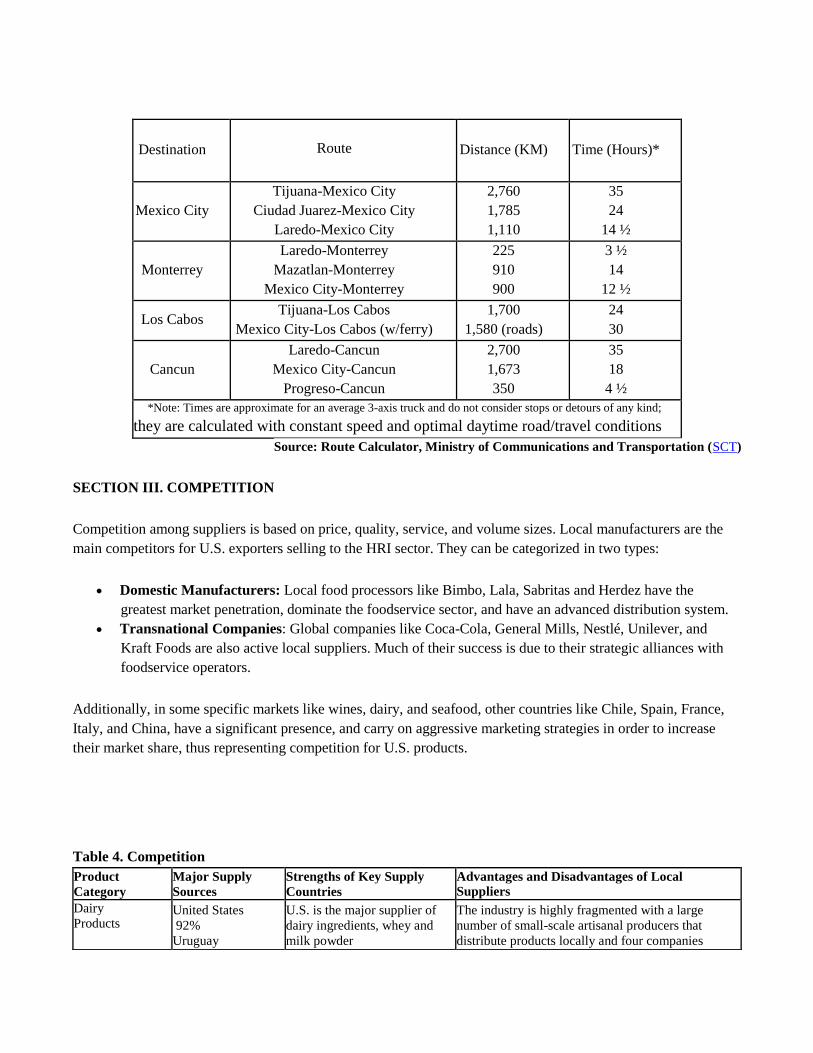
Destination
Route
Distance (KM) Time (Hours)*
Mexico City Tijuana-Mexico City
Ciudad Juarez-Mexico City Laredo-Mexico City
2,760 1,785 1,110
35 24
14 ½
Monterrey Laredo-Monterrey
Mazatlan-Monterrey Mexico City-Monterrey
225 910 900
3 ½ 14
12 ½
Los Cabos Tijuana-Los Cabos
Mexico City-Los Cabos (w/ferry) 1,700
1,580 (roads) 24 30
Cancun Laredo-Cancun
Mexico City-Cancun Progreso-Cancun
2,700 1,673 350
35 18
4 ½ *Note: Times are approximate for an average 3-axis truck and do not consider stops or detours of any kind;
they are calculated with constant speed and optimal daytime road/travel conditions
Source: Route Calculator, Ministry of Communications and Transportation (SCT)
SECTION III. COMPETITION
Competition among suppliers is based on price, quality, service, and volume sizes. Local manufacturers are the
main competitors for U.S. exporters selling to the HRI sector. They can be categorized in two types:
Domestic Manufacturers: Local food processors like Bimbo, Lala, Sabritas and Herdez have the
greatest market penetration, dominate the foodservice sector, and have an advanced distribution system. Transnational Companies: Global companies like Coca-Cola, General Mills, Nestlé, Unilever, and
Kraft Foods are also active local suppliers. Much of their success is due to their strategic alliances with
foodservice operators.
Additionally, in some specific markets like wines, dairy, and seafood, other countries like Chile, Spain, France,
Italy, and China, have a significant presence, and carry on aggressive marketing strategies in order to increase
their market share, thus representing competition for U.S. products.
Table 4. Competition
Product
Category Major Supply
Sources Strengths of Key Supply
Countries Advantages and Disadvantages of Local
Suppliers Dairy
Products
United States
92% Uruguay
U.S. is the major supplier of
dairy ingredients, whey and
milk powder
The industry is highly fragmented with a large
number of small-scale artisanal producers that
distribute products locally and four companies

Net Imports:
34,487,906
liters
5% New Zealand
1%
concentrating about 60 percent of the total dairy
market
Fresh Fruit Net Imports:
441,789 MT
United States
87% Chile
10% Argentina
1%
U.S. remains the leading
provider of apples, pears
and stone fruits in Mexico
Local production of deciduous fruits is not
sufficient to address the domestic demand.
Fresh
Vegetables Net Imports:
217,934 MT
United States
93% Chile
3% Canada
2%
U.S. is a key supplier of
seasonal veggies like
yellow onions and
pumpkins.
Local production is high and local brands are
well positioned in the market at very competitive
prices
Meat (pork
and beef) Pork: 499,724
MT Beef: 166,160
MT
United States
90% Canada:
9%
U.S. dominates meat
imports, followed by
Canada; U.S. meat is
regarded as high quality
Local companies dominate the market (85%).
Mexican meat producers don’t have a
classification system of quality in place, making
meat cuts not standardized
Poultry Net Imports:
698,288 MT
United States
98% Chile
2%
U.S. major supplier of
chicken paste and turkey;
U.S. poultry products are
regarded as high quality
Local poultry producers are major suppliers and
some local distributors have poor cold chain
management
Snack Foods Net Imports:
81,618 MT
United States
61% Canada
13% China
6% Guatemala
4%
U.S. is a major supplier for
ingredients of snack foods
processed in country
Leaders in this category are companies with a
well-developed distribution network & various
product mixes that include leading products in
different processed foods categories.
USDA: Global Trade Atlas
SECTION IV. BEST PROSPECTS It is important to highlight that although the following products have high sales potential in the hotel foodservice
segment, volumes required might be small, so exporters should take this into account when preparing for shows
and exhibitions, or trade missions:
Meat (pork and beef), cold cuts; in some specific regions, duck and lamb
Processed fruits and vegetables, including juices and mixes Salmon, crab, and other seafood products that Mexico does not produce Single-serve packaged food - nut mixes, (trail mixes), small chips bags, single-served fruit in syrup Healthier foods (Low sodium, low-fat, reduced sugar)
Specialized food products for specific food-styles (Thai, Korean, Mediterranean, etc.), including
dressings and salsas Desserts, like high-end bakery, cookies and pastries; ice cream Dairy: cheese and powder milk
SECTION V. POST CONTACT AND FURTHER INFORMATION For further information and to learn more about the services provided by the Agricultural Trade Offices (ATO) in
Mexico, please contact us at:
U.S. Agricultural Trade Office Mexico City, Mexico Liverpool #31, Col. Juárez Mexico, D.F. 06600 T: +52 (55) 5140-2671 F: +52 (55) 5535- 8357 E: [email protected]
U.S. Agricultural Trade Office Monterrey, Mexico Blvd. Díaz Ordaz #140 - T2 P7, Col. Santa Maria Monterrey, N.L. 64650 T: +52 (81) 8333-5289 F: +52 (81) 8333-1248 E: [email protected]
FAS/Mexico Web Site: We are available at: http://www.mexico-usda.com or visit the FAS headquarters' home
page at: http://www.fas.usda.gov for a complete selection of FAS worldwide agricultural reporting.
Related Tradeshows in Mexico: Feria Nacional de Abastecedores ANCH April 11-12, 2013 Barcelo Maya Beach Resort, Cancun, Q.R. www.anch.com.mx/html/feria.html
Alimentaria June 4-6, 2013 Location: Centro Banamex Convention Center, Mexico, D.F. www.alimentaria-mexico.com
Exphotel Cancun June 12-14, 2013 Cancun Convention Center, Cancun, Q.R. www.exphotel.net
Expo Proveedores del Restaurante August 6-7, 2013 Cintermex Convention Center, Monterrey, N.L. www.paraelrestaurante.com
Abastur August 26-29, 2013
Centro Banamex Convention Center, Mexico D.F. www.abastur.com
Sources: Euromonitor International El Economista, including its Agrointeligente supplement Mexican Association of Hotels and Motels (AMHM) Mexican Institute of Statistics and Geography (INEGI) Mexican Ministry of Tourism (SECTUR) National Chamber of the Restaurant Industry (CANIRAC) UNWTO World Tourism Barometer 2013 U.S. Bureau of the Census Trade Data
Useful Mexican Web Sites: Mexico's equivalent to the U.S. Department of Agriculture (SAGARPA) can be
found at http://www.sagarpa.gob.mx and Mexico’s equivalent to the U.S. Department of Commerce (SE) can be
found at http://www.economia.gob.mx. These web sites are mentioned for the readers' convenience but USDA
does NOT in any way endorse, guarantee the accuracy of, or necessarily concur with, the information contained
on the mentioned sites.