Embed Size (px)
Citation preview

©2014 Kansas City Southern
Mexico: Business Climate Update
and Port Expansion Review
Pat Ottensmeyer, EVP & CMO

©2014 Kansas City Southern 2
KCS Rail Network
©2014 Kansas City Southern
Founded in 1887, KCS is a 127
year old growth story
More than 6,400 track miles
Seamless network in and out of
Mexico
Service to 12 Gulf ports and 1
Pacific Ocean port
Service to more than 140 transload
centers and 11 intermodal ramps

©2014 Kansas City Southern
The New York Times
3
How Mexico Got Back in the
Game
Mexico: The New China
“That’s because the TJ template
isn’t so much about outsourcing
as it is quicksourcing. And that’s
also the way to create
thousands of good jobs in the
United States.
As any entrepreneur can tell
you, the shorter and more
nimble a supply chain is, the
better.”
By Chris Anderson
By Thomas L Friedman
“That’s because the TJ template
isn’t so much about outsourcing
as it is quicksourcing. And that’s
also the way to create
thousands of good jobs in the
United States.
As any entrepreneur can tell
you, the shorter and more
nimble a supply chain is, the
better.”
“Chrysler, for example, is using
Mexico as a base to supply some of
its Fiat 500s to the Chinese market.”
What struck me most here in
Monterrey, though, is the number of
tech start-ups that are emerging from
Mexico’s young population — 50
percent of the country is under 29 —
thanks to cheap, open source
innovation tools and cloud
computing.”
http://www.nytimes.com/2013/02/24/opinion/sunday/friedman-
how-mexico-got-back-in-the-game.html
http://www.nytimes.com/2013/01/27/opinion/sunday/the-tijuana-
connection-a-template-for-growth.html?hp&_r=0

©2014 Kansas City Southern
Foreign Direct Investment (FDI) in Mexico
4
• 2013 Foreign Direct
Investment (FDI) reached
$39.2 Billion (120%
increase vs 2012)
• Manufacturing sector
was key in 2013 with
72.3% investments
• 85% of FDI was registered
on states where KCS has
access
• 2014 FDI trough June
reached $9.7 Billion.
– 71.8% manufacturing .
• From 2000 to 2014 FDI
accounts $354.3 BillionElaboration by KCS Market Research based on Secretaría de Economía de México.
Data includes all economic sectors. (2013 & 2014 FDI)
©2014 Kansas City Southern
Why are decision makers
looking at Mexico?
5

©2014 Kansas City Southern 6
Economic Growth
SOURCE: DOC, Bloomberg Businessweek, World Bank, Mexico Today, J.P. Morgan, U.S. Bureau of
Labor Statistics, SICE, Goldman Sachs, Boston Consulting Group, Reuters., IMF
-6%
-4%
-2%
0%
2%
4%
6%
2006 2007 2008 2009 2010 2011 2012 2013 2014e 2015e
Annual GDP Growth Rate
US Mexico
Mexico has a projected growth
rate of 4% for 2013–2019,
According to the U.S.
Department of State’s Bureau of
Economic and Business Affairs

©2014 Kansas City Southern
GuatemalaEl SalvadorHondurasNicaraguaCosta RicaColombiaBoliviaChileUruguayPeruVenezuela
Japan
European UnionIcelandLiechtensteinNorwaySwitzerlandIsrael
Canada
United States
Trade Growth
The U.S. is Mexico’s largest trading partner
U.S. imports from Mexico have risen 23.5% since 2010
SOURCE: DOC, Bloomberg Businessweek, World Bank, Mexico Today, J.P. Morgan, U.S. Bureau of
Labor Statistics, SICE, Goldman Sachs, Boston Consulting Group, Reuters

©2014 Kansas City Southern
80
85
90
95
100
105
110
$0
$5
$10
$15
$20
$25
$30
$35
$40
$45
$50
Se
pte
mb
er
2004
Novem
ber
2004
Jan
uary
2005
Ma
rch 2
005
Ma
y 2
005
July
2005
Se
pte
mb
er
2005
Novem
ber
2005
Jan
uary
2006
Ma
rch 2
006
Ma
y 2
006
July
2006
Se
pte
mb
er
2006
Novem
ber
2006
Jan
uary
2007
Ma
rch 2
007
Ma
y 2
007
July
2007
Se
pte
mb
er
2007
Novem
ber
2007
Jan
uary
2008
Ma
rch 2
008
Ma
y 2
008
July
2008
Se
pte
mb
er
2008
Novem
ber
2008
Jan
uary
2009
Ma
rch 2
009
Ma
y 2
009
July
2009
Se
pte
mb
er
2009
Novem
ber
2009
Jan
uary
2010
Ma
rch 2
010
Ma
y 2
010
July
2010
Se
pte
mb
er
2010
Novem
ber
2010
Jan
uary
2011
Ma
rch 2
011
Ma
y 2
011
July
2011
Se
pte
mb
er
2011
Novem
ber
2011
Jan
uary
2012
Ma
rch 2
012
Ma
y 2
012
July
2012
Se
pte
mb
er
2012
Novem
ber
2012
Jan
uary
2013
Ma
rch 2
013
Ma
y 2
013
July
2013
Se
pte
mb
er
2013
Novem
ber
2013
Jan
uary
2014
Ma
rch 2
014
Ma
y 2
014
July
2014
US
In
du
str
ial P
rod
uc
tio
n In
de
x (
ad
jus
ted
)
To
tal T
rad
e w
ith
Me
xic
o (
$ b
illi
on
)
Total Trade with Mexico ($ billions) US Industrial Production Index (adjusted)
U.S. – Mexico Trade Growth
8
Source: Board of Governors of the Federal Reserve System and US Census Bureau

©2014 Kansas City Southern
Labor Force
9
Mexico has a labor force advantage over China
– By 2015, wages in Mexico are forecasted to be 30% lower than in China
– Mexican labor is highly skilled; Mexico manufacturing is moving from low-skill, high volume
products to high-skill, sophisticated products

©2014 Kansas City Southern
0
2
4
6
8
10
12
14
16
18
Dec-0
0
Ap
r-01
Au
g-0
1
Dec-0
1
Ap
r-02
Au
g-0
2
Dec-0
2
Ap
r-03
Au
g-0
3
Dec-0
3
Ap
r-04
Au
g-0
4
Dec-0
4
Ap
r-05
Au
g-0
5
Dec-0
5
Ap
r-06
Au
g-0
6
Dec-0
6
Ap
r-07
Au
g-0
7
Dec-0
7
Ap
r-08
Au
g-0
8
Dec-0
8
Ap
r-09
Au
g-0
9
Dec-0
9
Ap
r-10
Au
g-1
0
Dec-1
0
Ap
r-11
Au
g-1
1
Dec-1
1
Ap
r-12
Au
g-1
2
Dec-1
2
Ap
r-13
Au
g-1
3
Dec-1
3
Ap
r-14
Au
g-1
4
Peso & Yuan Exchange Rate
MXN
CNY
10
Currency Advantage
Source: YCharts
In U.S. dollar terms, since 2005 Chinese products have become about 65% more expensive than those sourced in Mexico

©2014 Kansas City Southern 11
Top Industries for Nearshoring Opportunities
Appliances &
Electronics
Construction
Equipment
Automotive
Furniture
Machinery
Aerospace
High Tech Electronics
Rubber & Plastics
Fabricated
Metals

©2014 Kansas City Southern
Global Automotive Production

©2014 Kansas City Southern©2014 Kansas City Southern
PLANT TIJUANAPLANT
HERMOSILLO PLANT
CHIHUAHUA
PLANT MOTORS
RAMOA ARIZPE
PLANT
SALTILLO
PLANT
SALTILLO
PLANT
RAMOS
ARIZPE
PLANT S.L.P PLANT
MORELOS
PLANT
PUEBLA
PLANT CUATITLANPLANT TOLUCAPLANT TOLUCAPLANT MOTORSPLANT SILAOPLANT CELAYA
PLANT SALAMANCA
PLANT EL SALTO
PLANT
AGUASCALIENTES
PLANT
AGUASCALIENTES
PLANT AUDI 2016
KIA
MONTERREY
2016
PLANT 2017
AGUASCALIENTES
PLANT S.L.P
2019

©2014 Kansas City Southern
New Auto Plant Openings
14
Source: (1) Autocast, June 2014 – Audi (Est. 2017 production)
(2) Manufacturer’s Press Releases
AUDISan Jose Chiapa,
Puebla, Mexico
Opens 2nd Quarter 2016 (1)
Est. Prod Capacity: 173K (1)
BMWSan Luis Potosi, Mexico
Opens 2019 (2)
Est. Prod Capacity: 150K (2)
MERCEDES BENZ/INFINITIAguascalientes, Mexico
Opens 2017 (2)
Est. Prod Capacity: 300K (2)
KIAPesqueria (Monterrey), Mexico
Opens Mid 2016 (2)
Est. Prod Capacity: 300K (2)

©2014 Kansas City Southern 15
By 2019, Mexico’s Auto ProductionExpected to Increase by 1 Million Units
Source: Autocast, September 2014
2014
2015
2016
2017
2018
2019 4.4m
4.2m
4.0m
3.7m
3.3m
3.2m
©2014 Kansas City Southern 16
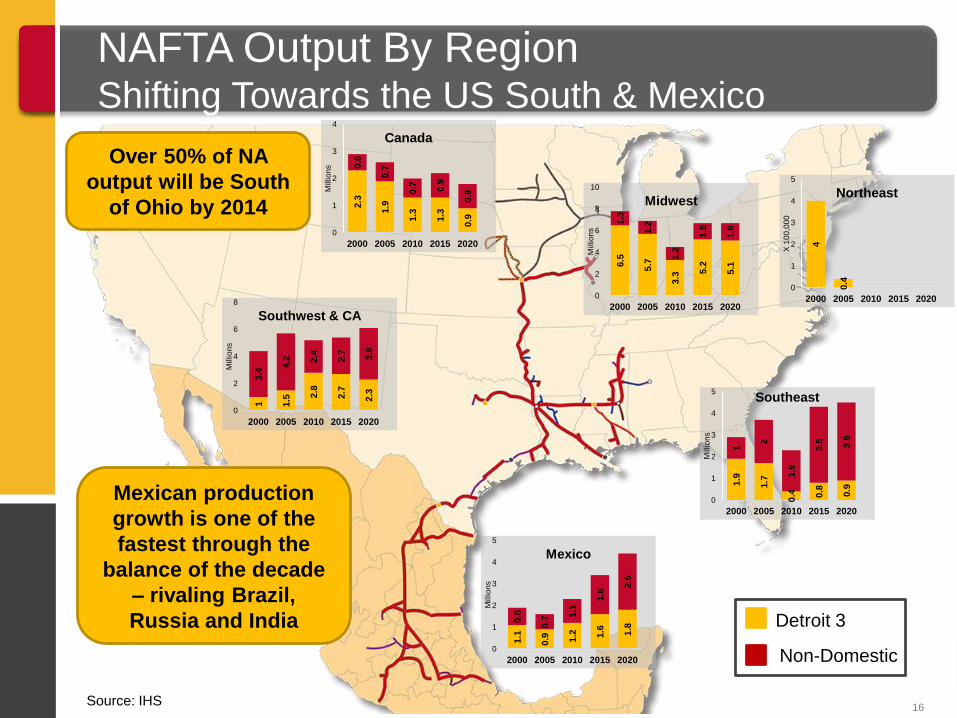
NAFTA Output By RegionShifting Towards the US South & Mexico
Mexican production
growth is one of the
fastest through the
balance of the decade
– rivaling Brazil,
Russia and India
Over 50% of NA
output will be South
of Ohio by 2014
1.1
0.9 1.2 1.6 1.8
0.8
0.7
1.1
1.8
2.6
0
1
2
3
4
5
2000 2005 2010 2015 2020
Millio
ns
Mexico
1.9
1.7
0.4 0.8 0.9
1
2
1.9
3.5 3.6
0
1
2
3
4
5
2000 2005 2010 2015 2020
Millio
ns
Southeast
4
0.4
0
1
2
3
4
5
2000 2005 2010 2015 2020
X 1
00
,00
0
Northeast
2.3
1.9
1.3
1.3
0.9
0.6
0.7
0.7 0.9
0.9
0
1
2
3
4
2000 2005 2010 2015 2020
Millio
ns
Canada
6.5
5.7
3.3
5.2
5.1
1.3
1.2
1.2
1.5
1.6
0
2
4
6
8
10
2000 2005 2010 2015 2020
Millio
ns
Midwest
1 1.5 2
.8
2.7
2.3
3.4
4.2 2
.4
2.7 3.8
0
2
4
6
8
2000 2005 2010 2015 2020
Millio
ns
Southwest & CA
Source: IHS
Detroit 3
Non-Domestic

©2014 Kansas City Southern 17
Automotive Production Has a Large Freight
“Funnel”

©2014 Kansas City Southern
Cross-border truck shipments represent a
significant opportunity for KCS
3.1 million truckloads originate
or terminate in KCS’ Target
Market
50 percent of loads move
to/from locations deep into
Mexico
KCS operates the Laredo rail
bridge on both sides of border
The current KCS intermodal
cross border market share
represents less than 3% of
available market.
18
SOURCE: KCS Market Research derived from BTS Data

©2014 Kansas City Southern
Cross Border Intermodal Coverage
19
Kansas City
Southern covers
60 percent of
Mexico’s
population
and
63 percent of
Mexico’s GDP.
Source: INEGI Censo de Población y Vivienda 2010

©2014 Kansas City Southern
KCS’s Network is the center of the North
American rail system
20
Laredo
Houston
Dallas
Shreveport
East St. Louis
Springfield
Kansas City
Birmingham
Meridian
New Orleans
Jackson

©2014 Kansas City Southern
Mexico Energy Reform is a Reality
21
Reform could drive an increase in
rail shipments in the following ways:
• General economic growth in Mexico
• Increased movement of steel tubing,
frac sand, fuel oil, diesel, gasoline,
LPG and shale oil
• Dec. 2013 – Mexico passed energy
reform legislation in the constitution
• Reform will affect refining, oil & gas
drilling, power generation and new
private-sector driven logistics market
• Laws and regulations associated with
this reform will be decided during
2014

©2014 Kansas City Southern 22
Mexico’s Natural Gas Potential

©2014 Kansas City Southern
1. Importation and intra-Mexico movement of steel pipe for oil fields and natural gas
transmission
New natural gas pipelines are under construction
2. Increased Fuel Oil Moves
KCS current transports fuel from Pemex refineries to export
Energy reform has opened the door to private sector participation in
terminals and more flexible contract guidelines
3. Importation of LPG
Deficit of LPG in Central Mexico
Specialized rail terminal in SLP has been permitted and construction will
begin in 1Q 2015
4. Importation of refined products (gasoline, diesel & biofuels)
Demand is increasing in Mexico
Refining capacity is insufficient
Strategic facilities and partners are being identified
5. Importation of frac sand
6. Shale oil (CBR) shipments from Mexican basins
23
Potential New Business Opportunities Resulting
from Mexican Energy Reform
©2014 Kansas City Southern
Mexico Port Expansions
24

©2014 Kansas City Southern
Pacific
Gulf
Lazaro Cardenas
Manzanillo
Progreso
Veracruz
Altamira
Ensenada
Others
Source: SCT 2013 Data
31%
69%
TEU Distribution per Port 20134,892,881 TEU*
1%
1%
3%
43%
22%
12%
18%
TEU Distribution 20134,892,881 TEU*
Ensenada
Altamira Progreso
Veracruz
Lazaro Cardenas
Manzanillo
Mexico Overview – Container Ports
25

©2014 Kansas City Southern
Expansion of the specialized container terminal &
improvement of technology
26
Port of Manzanillo
Picture: Manzanillo Port Authority, Inc.
Six year
investment of
$200M
Terminal will
increase
capacity to 4
million TEUs.
Source: Mexican PNI (Plan nacional de infraestructura)

©2014 Kansas City Southern
Total Investment - $820M
Will provide better access
via rail and highway
1st port in Latin America
with a deep-water area for
oil rigs & oil platforms
Will also include a station
to compress natural gas
27
Port of Altamira
Source: Mexican PNI (Plan nacional de infraestructura
Photo: Administración Portuaria Integral de Altamira
Expansion started in 2013 and will be completed in 2018

©2014 Kansas City Southern
Total investment - $4.6B
– $1.8B will be invested
between 2013 and
2018.
Will reduce congestion
by tripling capacity
Revival of older areas of
the port which will
integrate it into the
historic part of the city.
28
Port of Veracruz
Photo: International Transport Workers’ Federation
Source: Mexican PNI (Plan nacional de infraestructura)
Expansion started in 2013 and will be completed in 2030.

©2014 Kansas City Southern 29
Port of VeracruzFull Build Out (2030)
Source: SCT

©2014 Kansas City Southern
Lázaro Cárdenas Development Plans
30
• APM Terminals will invest $900m in the project. The new container port will have a
capacity of 1.2 million TEUS when opened and projected volume of +3 million TEUS by
2019. Projected completion is 1st half of 2016.
• In October 2012, SSA Marine won a concession to develop, operate and maintain a
Specialized Auto Terminal capable of handling up to 750,000 autos annually
• Hutchinson Port Holdings installed six new vessel cranes at Lazaro over the past two
years.
Source: APM Terminals Press Release dated October 9, 2014; sct.gob.mx

©2014 Kansas City Southern 31
Lázaro Cárdenas
Growth Plans
Bulk
Facility
New Container
Terminal
New Auto
Terminal
Expanded
Container Terminal

©2014 Kansas City Southern
West Coast Ports… Which
One Looks Different?
32

©2014 Kansas City Southern 33
Prince Rupert

©2014 Kansas City Southern
Vancouver
34

©2014 Kansas City Southern 35
Seattle

©2014 Kansas City Southern 36
Oakland

©2014 Kansas City Southern 37
LA/Long Beach

©2014 Kansas City Southern 38
Manzanillo

©2014 Kansas City Southern
Lázaro Cárdenas
39

©2014 Kansas City Southern 40
Thank you!