Embed Size (px)
Citation preview

METROPOLIS – Urban Airspace Design
Societal Demand & Technology Review (D1.1)
Document author(s) J.M. Hoekstra (TUD), Stefan Kern (DLR), Oliver Schneider (DLR), Franz Knabe (DLR), Bruno Lamiscarre (ENAC) Responsible Partner TU Delft Reviewed by O.Schneider (DLR), F.J.L Bussink (NLR), D. van Nieuwenhuizen(NLR), J.
Ellerbroek (TUD)
Dissemination Level
PU Public X
PP Restricted to other programme participants (including the Commission Services)
RE Restricted to a group specified by the consortium (including the Commission Services)
CO Confidential, only for members of the consortium (including the Commission

Metropolis
2
Services)
The page intentionally left blank

Metropolis
3
Document information table
Contract number: ACP3-GA-2013-341508
Project title: METROPOLIS
Project Co-ordinator: Delft University of Technology
Document Responsible Partner: J.M. Hoekstra [email protected]
Document Type: Report
Document Title : Metropolis WP1 Workplan
Document ID: D1.1 Version: 1.0
Contractual Date of Delivery: Feb 2014 Actual Date of Delivery: Mar 2014
Filename: WP1 Report on Societal Demand & Technology review.docx
Status: Final
Cover illustration:
Tableau by 1st author using the following sources:
Creative Commons Search: London citiyscape, Paris Cityscape, Night city scape
UAVs (md4-3000) from http://orbitgis.com
PAVs: http://PAL-V.com , http://bowlofknowledge.blogspot.nl, http://www.terrafugia.com
Preface
This publication only reflects the view of the METROPOLIS Consortium or selected participants
thereof. Whilst care has been taken to ensure that this information is accurate, it may be out of
date or incomplete. Neither the METROPOLIS Consortium participants nor the European
Community are liable for any use that may be made of the information contained herein.
This document is published in the interest of the exchange of information and it may be copied
in whole or in part providing that this disclaimer is included in every reproduction or part thereof
as some of the technologies and concepts predicted in this document may be subject to
protection by patent, design right or other application for protection, and all the rights of the
owners are reserved.
The information contained in this document may not be modified or used for any commercial
purpose without prior written permission of the owners and any request for such additional
permissions should be addressed to the METROPOLIS co-ordinator. (Prof.dr.ir. Jacco
Hoekstra, Delft University of Technology, Faculty of Aerospace Engineering, Kluyverweg 1, NL-
2629HS, Delft, The Netherlands)

Metropolis
4
The page intentionally left blank
Metropolis
5
Revision table
Version Date Modified Page/Sections
Author Comments
01a 2-12-2013 Initial version J.M.Hoekstra
0.3 13-1-2014 1-3, bilibography J.M.Hoekstra
0.8 4-2-2104 DLR part added Schneider, Kern, Knabe
1.0 8-3-2104 Chapters DLR, ENAC integrated
J.M.Hoekstra
Partners involved in the document
Nb Member name Short name
Check if involved
1 Technical University of Delft TUD X
2 National Aerospace Laboratory NLR X
3 École Nationale de l’Aviation Civile ENAC X
4 Deutsches Zentrum für Luft- und Raumfahrt e.V. DLR X
Executive summary
This document contains the results of work package 1 Societal Demand & Technology Review.
It provides input to the other work packages on both the demand side and vehicle technology.
These are essential for generating concepts and scenarios for the batch simulation.

Metropolis
6
.
Table of Contents 1 Introduction ............................................................................................................................ 9
2 Societal Demand [TU Delft] ................................................................................................. 10
2.1 Demographics & Urbanisation ...................................................................................... 10
2.1.1 Global urbanisation ............................................................................................... 10
2.1.2 European urbanisation .......................................................................................... 11
2.1.3 Metropolitan areas ................................................................................................. 13
2.1.4 Metropolis choice for our model city. ..................................................................... 15
2.2 Long-term scenario studies on the future of transport and energy ............................... 16
2.2.1 EU GHG overview study and the VLEEM 2 project .............................................. 16
2.2.2 DHL/Z_punkt logistics scenario study ................................................................... 17
2.2.3 Shell scenarios ...................................................................................................... 18
2.2.4 Other long-term visions: changes in energy and mobility ...................................... 19
2.2.5 Choices for Metropolis scenario context based on these studies.......................... 20
2.3 Cargo trends and volumes ........................................................................................... 20
2.4 Personal Transport volume .......................................................................................... 20
3 Vehicle Technology review .................................................................................................. 22
3.1 Unmanned Aerial Vehicle Technology Review ............................................................. 22
3.1.1 Goal of this review ................................................................................................. 22
3.1.2 The logistics of using UAVs for package deliveries ............................................... 22
3.1.3 Fuel costs .............................................................................................................. 23
3.1.4 Environmental considerations ............................................................................... 24
3.1.5 Overview of existing UAV technology ................................................................... 25
3.1.6 Battery technology ................................................................................................. 27
3.2 Personal Air Vehicle Technology Review ..................................................................... 29
3.2.1 Case and resulting main criteria for PATS ............................................................ 29
3.2.2 Review of different vehicles ................................................................................... 32
3.2.3 Tilt-rotor aircraft ..................................................................................................... 34
3.2.4 Expected PAV-type(s) and performance characteristics ....................................... 35
4 Infrastructure & Systems [DLR] ........................................................................................... 36
4.1 Personal Air Vehicle Ports ............................................................................................ 36

Metropolis
7
4.1.1 Initial Situation ....................................................................................................... 36
4.1.2 PAV infrastructure ................................................................................................. 36
4.1.3 Plausibility check on infrastructure ........................................................................ 39
4.1.4 Conclusion ............................................................................................................. 42
4.2 Unmanned Aerial Vehicle Cargo Station and Reception System ................................. 42
4.2.1 Distribution centre ................................................................................................. 42
4.2.2 Delivery ................................................................................................................. 43
4.3 Systems ........................................................................................................................ 44
4.3.1 Navigation Systems ............................................................................................... 44
4.3.2 Security ................................................................................................................. 45
4.3.3 Surveillance Systems ............................................................................................ 45
6 Airspace Capacity limits & constraints [ENAC] .................................................................... 47
6.1 Introduction ................................................................................................................... 47
6.2 Flow Structure and Capacity ........................................................................................ 48
6.2.1 Two Dimensional Traffic ........................................................................................ 48
6.2.2 Stream Variables ................................................................................................... 48
6.2.3 Three Dimensional traffic ...................................................................................... 51
6.3 Phase analogy for local capacity .................................................................................. 53
6.3.1 Fully coherent structures ....................................................................................... 53
6.3.2 Semi-coherent structures ...................................................................................... 53
6.3.3 Fully autonomous flights ........................................................................................ 53
7 Bibliography [All: Insert references] ..................................................................................... 55

Metropolis
8
The page intentionally left blank

Metropolis
9
1 Introduction This document describes the context required to generate the scenarios for the batch simulations. It is based on a review of literature on:
- Demographics & urbanisation - Transport & Energy - UAVs (suitable for the urban environment) - Personal Air vehicles (as suitable for the urban environment) - Communication, Navigation & Surveillance system requirements - Infrastructure Requirements
The focus is on the city 50+ years into the future. The current status and trends of the development of urbanisation and mobility will be extrapolated to the future. This gives the estimate for the future demand, both qualitatively (which applications) and quantitatively. For UAVs there already are vehicles available, which can be used for urban cargo transport. A review of existing (proto)types has been performed. Based on the expected demand and expected technological advances, the future cargo UAV and its application will be described. A review of on-going developments on personal air transport vehicles will give an indication of the expected type(s) of the vehicles, which are most likely to reach the consumer market in high numbers. Based on the current prototypes and their feasibility, the performance characteristics of the future personal air vehicles can be estimated. Navigation and surveillance in an urban environment is a challenge. Which systems and levels of automation are foreseen will be described in chapter 4 as this has an impact on the interaction between the vehicles. This interaction is an important ingredient of the batch simulations. The required infrastructure refers to both the sites for take-off & landing as well as to the ground-based systems required for Communication Navigation Surveillance/Air Traffic Management. After each review a decision has been made on choices for the Metropolis scenarios. From the demand study, the expected numbers of vehicles will be derived. As part of this study, it is also required to look at the limits of airspace capacity for these types of vehicles. What these limits are will be discussed in the final chapter. The outcome of the WP1 study is:
- Performance models of one or more personal air vehicles - Performance models of one or more urban cargo UAVs - Infrastructure, route structure and CNS systems - Expected and extreme capacity demands

Metropolis
10
2 Societal Demand [TU Delft]
2.1 Demographics & Urbanisation
2.1.1 Global urbanisation
fig 2.1 Predicted urbanisation percentages for developed and less developed countries[1]
According to the United Nation Population offices, the world population is expected to grow from
7 billion in 2011 to 9.3 billion in 2050. In 2011 3.6 billion lived in urban areas, while in 2060 6.3
billion are expected to live in urban areas.
fig 2.2 Level of urbanisation per major geographical area[4]

Metropolis
11
2.1.2 European urbanisation
To illustrate the status and trends in urbanisation for a selection of European countries, these
data are given in the figures below and on the next pages, from the site of the United nations,
Population Division[4]:

Metropolis
12
fig 2.3 European urbanisation for European countries

Metropolis
13
The graphs on the left side look different based on the starting level of urbanisation. But the trend is very similar for all regions in Europe: everywhere in Europe the urbanisation continues. In these graphs, urbanisation refers to people living in urban areas. Note that an urban area is not the same as a metropolitan area (see definition in next section). Urban areas are areas which are not rural, but they do not have to be a large city. Still, the growth of people living in urban areas is a good indicator of the growth of large cities as the main growth lies in the regions with several cities, which merge with each other, or with a larger city, to become one metropolitan area. An example where this is already happening today is the coastal area of the Netherlands, the so-called Randstad, an urban area, which is currently becoming one metropolitan area with 7.1 million inhabitants, making it number 3 in the list of urban areas in Europe. The only reason it is often not listed is that it is a combination of three cores: Amsterdam, The Hague and Rotterdam.
fig. 2.4 “Randstad” metropolitan area in 2040 [2]
2.1.3 Metropolitan areas
A Metropolitan region is defined as a region with a densely populated urban core and its less densely populated surrounding territories, sharing industry, infrastructure, and housing. Based on data from Eurostat[3] the top 20 of Metropolitan regions for European countries are, with the population and the growth of 2012, sorted on population size:
Table 2.1 European Metropolitant regions
Metro reg Size Growth
London 13,614,409 2.3%
Paris 11,914,812 0.5%
Madrid 6,387,824 0.3%
Barcelona 5,357,422 -0.3%
Ruhrgebiet 5,135,136 -0.3%
Berlin 5,097,712 0.8%
Milano 4,275,216 1.0%
Roma 4,233,933 1.0%
Athina 4,109,074 -0.1%

Metropolis
14
Warszawa 3,271,938 0.7%
Hamburg 3,228,054 0.6%
Napoli 3,078,408 -0.1%
Budapest 2,985,089 0.5%
Bruxelles 2,922,678 1.3%
Lisboa 2,823,798 0.0%
Katowice 2,794,569 -0.3%
München 2,727,106 1.5%
Stuttgart 2,691,666 0.5%
Manchester 2,682,537 1.4%
Wien 2,635,990 0.9%
For the number one in this list, London, the growth over the past 10 years is indicated in the next figure:
fig. 2.5 The growth of the London Metropolitan region
This shows an exponential growth with an average rate of 1.1% per year. Even this modest rate, and not the much higher rate of 2012, would, if it continues, lead to a size of 20.6 million in 2050 and even 35.6 million in 2100, which is just over 50% of the total UK population of today. The global top three of urban areas based on population size contains only Asian cities[5]
Table 2.2 Largest urban areas in Asia
Region Population
Tokyo-Yokohama 37,239,000
Jakarta 26,746,000
Seoul-Incheon 22,868,000
The first US city, New York with 20.6 million, is found at nr. 8, the first European city is Moscow (15.8 million), while Paris and London are at 27 and 29. In this list, as in most lists, the Paris region is

Metropolis
15
considered larger than the London area, as in most lists. The difference stems from the different choice for the boundaries of the area. The assumption that the cities will continue to grow is supported by this model of the self-reinforcing effect of city growth:
fig. 2.6 City growth cycle [6]
2.1.4 Metropolis choice for our model city.
Cities with over 10 million inhabitants already exist today. The trend indicates these will continue to grow till over 20 million or 30 million in the coming century. As a model city for Metropolis we therefore choose a city like future Paris with a stable population of 20 million as our nominal (smallest, ‘single’) scenario. If we define Paris as a slightly larger region, then today there are already 16.7 million people living in what INSEE refers to as the Paris metro area (bound by economy and commuters) [7].

Metropolis
16
fig. 2.7 Perimeter of the Paris Metropolitan area according to INSEE [7]
Using this area with a slightly higher population density satisfies the requirements for our Metropolis scenario. Our focus will be on the core area, as this is the most densely populated area. This core area has a radius of 50 km.
2.2 Long-term scenario studies on the future of transport and energy
Most studies on the future of transport have done so in the context of energy and sustainability. Two studies are mentioned here. The first is an overview study and this provides entries into many more of these projects for the interested reader. 2.2.1 EU GHG overview study and the VLEEM 2 project
In the task 9 Report V of the project “EU Transport GHG: Route to 2050?” an overview of 22 studies into the future of transport and sustainability, some global some European, has been listed and analysed [8]. One of these is the VLEEM 2 project[9]. Its final report gives a prediction for the demand of transport based on three different population predictions:
HiPop: World population will be 12 billion in 2100
MidPop: Stable world population of 8 billion
LowPop: Peak at 8 billion and then a decrease to 6 billion Note how the MidPop scenario predicts a lower number for 2100 than the current UN prediction of 9.3 billion for 2050.

Metropolis
17
Based on the population number of the MidPop scenario, 8 billion people, the following demand for transport is predicted for 2100:
fig. 2.8 Passenger mobility: individual vs. public
A large portion of road freight transport is urban, which for small parcels could be replaced by UAVs, which is not foreseen in the second figure. From these figures we can see a large demand for individual transport, even assuming today’s technology. 2.2.2 DHL/Z_punkt logistics scenario study
DHL has asked a company named Z_punkt, which is an internationally operating, strategy and consultancy company, to perform a study with a group of international experts, both from universities and industry to define a number of consistent long-term future scenarios for logistics[10]. The methodology they have used consisted of 5 steps:
1. List all influencing factors

Metropolis
18
2. Estimate future development/projection of key factors 3. Compile raw scenarios (combination of factor developments) 4. Perform internal consistency analysis to identify 5 future scenarios 5. Impact analysis to determine strategic implications for logistics
As an outcome, the following 5 scenarios have been identified:
Scenario 1: Untamed Economy – Impending Collapse
Scenario 2: Mega-efficiency in Megacities
Scenario 3: Customized Lifestyles
Scenario 4: Paralyzing protectionism
Scenario 5: Global Resilience – Local Adaptation For our study scenario 2 provides the most challenging and relevant context for the Metropolis scenarios. The scenarios 3 and 5 share the individualized, decentralized nature which is one of the driving factors for the Metropolis project scenario. The key elements of Scenario 2 Mega-efficiency in Megacities are:
Fully automated way of life due to ubiquitous data exchange
An increase in global supply chains.
Continuous inter-modal flow of parcels
More efficient fuel efficiency (factor of 3 is mentioned). High level of regulation in cities
80% reduction of CO2 emissions.
Strong metropolization of economic activities
Inner-city point-to-point delivery: taken over by swarms of small players 2.2.3 Shell scenarios
Shell has a group working on long-term scenarios for many years. Many independent experts contribute to these scenarios and they have earned a good reputation worldwide. In their study of 2008 [11] two options are mentioned for 2050: one based on low government influence, the so-called “Scramble”-scenario and one assuming more regulation, the scenario called “Blueprints”-scenario. In the Scramble scenario it is harder to make a transition to new energy technologies, so only a move towards biofuels has been predicted in this scenario. In the Blueprints scenario, a larger step can be taken and a transition to electricity especially for transport is predicted.
fig 2.9 Energy transitions for transport according to Scramble (left) and Blueprints(right) [11]

Metropolis
19
A recent study by Shell [6], performed in 2013, is called New Lens Scenarios. In this study, the energy source distribution for the coming 50 years is predicted as indicated in the following diagram:
fig 2.10 Primary energy source 2000-2060 [6]
As can be seen, in this study, the outlook is more conservative, and thus closer to the earlier Scramble scenario with less government influence and less regulation. But even in this scenario, in 2060 the share of sustainable energy as primary energy resource has increased from a one fifth to one third. Electrical propulsion The changing energy source mix and extrapolating current developments in both road traffic and UAVs, we assume electricity as a medium for energy for transport, even when the source of this electricity could be fossil for some decades to come. An advantage of electricity is the absence of the impact on the local air quality, which in large cities would still be an issue when using the sustainable synthetic fuel or biofuel. Hydrogen leads only to the emission of water vapour and therefore could also be a clean alternative but a transition to hydrogen remains more speculative than electricity: it requires an infrastructure which is not present and hence would require a huge investment before it has become available for mass consumption. Hydrogen is also more dangerous using today’s storage and combustions technologies 2.2.4 Other long-term visions: changes in energy and mobility
Energy Abundance? For the year 2100, some radical changes are foreseen by some futurologists. Michio Kaku, a physics professor at the City University of New York predicts the age of abundance[12] [12]. This will result from two developments: the energy transition to sustainable sources and the reduction of our energy consumption due to new technologies such as small chips and LED lighting. Critics point at the fact that

Metropolis
20
until now, this has not always led to a lower energy consumption: LED television screens are twice as large as tube type TVs. End of commuting? Similarly the need for transport might change radically in a century. For example as many companies increase their profit by reducing staff and using automation for tasks formerly performed by employees, as we see happening today. If this trend continues, there might be less work leading to less commuting. One way to maintain a stable society in this scenario is to distribute this evenly, leading to a shorter work week or less hours per day. This means that an increase of population might not automatically lead to an increased need for transport and can lead to less concentration in peak hours. Similarly, working from home might reduce the need for commuting within a metropolitan region. 3D printers and electronic media? The rise of 3D printers could lead to more products being manufactured at home. To what scale this will affect the need for transport is yet unclear. Development like e-books instead of paper books, on-line on-demand video & music services and digital signatures could also lead to a decrease in package delivery within an urban region, despite the growth in population. 2.2.5 Choices for Metropolis scenario context based on these studies
All of the more visionary studies on 2100 in the previous section have been heavily criticized. Predicting radical changes remains highly speculative. We will therefore limit our assumptions to extrapolations and the changes required for the Metropolis scenarios to become a reality.
2.3 Cargo trends and volumes
We assume a direct point-to-point system for UAVs, which carry the smaller parcels. Limits of the cargo carried by the UAVs will be determined by the UAV vehicle technology, the logistics and the third party risk. There is demand for this mode of package delivery due to the traffic congestion in cities, limiting delivery times. The congestion problem is expected to increase as the cities grow. In terms of volume, nowadays, for example in France e-consumers buy about 13.5 parcels per year per person [13]. For a city of 20 million this would mean 740,000 parcels per day for only the final delivery, not even including the sending to a central distribution centre. To estimate an order of magnitude, assuming a speed of 50 km/hr and an average radius of 25 km, and assuming each would fly an hour, there would be on average 31 000 light parcels in the air. In transport it is not uncommon to have a peak of twice the daily average, in this case 60 000 parcels, which could be in the air during these peaks. In the period 2004-2010, the French parcel market has grown with 13% in 6 years. The express parcel market has even grown with 36% [14] and comprised of 48% of the total in 2010.
2.4 Personal Transport volume
We assume there will still be a need for personal transport. As a baseline and order of magnitude the figures for Paris in 2003 [15] can be used for daily traffic:
Daily traffic in and out of Paris core area: 1,400,000 vehicles

Metropolis
21
Distribution over type of road:
34% by autoroute
22% by routes nationales
44% by secondary roads And by vehicle type:
6% by motorbike
82% by cars
7% by vans
5% by trucks This will scale linearly with the size of the population. These figures are based on a population of 11.2 million for the Paris metro region, similar to today. As personal transport aims to replace inter-urban transport, the motorway traffic is a useful indicator of the potential demand. Which fraction could and will use personal air transport, once this has become available, depends on the market proposition in terms of costs and time. This mainly depends on the numbers in which this vehicle technology will be adopted, which will be looked at in the next sections.

Metropolis
22
3 Vehicle Technology review
3.1 Unmanned Aerial Vehicle Technology Review
3.1.1 Goal of this review
There may still be some challenges to tack before a UAV package delivery systems can become a reality. The goal of Metropolis is not to address these in detail. The assumption for Metropolis is that these technological challenges have been solved. The goal of this section is to arrive at the best estimate of how such a system would look. A brief review of the current prototype and systems as well as a comparison with the current way of delivering packages in an urban environment is used for this. Some technological advances may be expected but the goal is to assume only the advances which are expected or which are needed to arrive at a feasible system.
3.1.2 The logistics of using UAVs for package deliveries
To decide when package delivery by UAV is feasible, we first will take a look at the logistic consequences by comparing a delivery by a van with the point-to-point delivery by a series of UAVs. Before looking at the specifications of a suitable UAV, there are two logistic aspects to consider: delivery time and distance travelled. The route via the road vs. great circle In an urban environment the route travelled via the road is much longer in both time and distance than when travelling by air. Below a sample of some destinations around Paris are taken, the distance by road, using the planner of Google maps, and the great circle distance has also been computed. The travel times by road have been included based on a Monday morning at 10:30 (just after rush hour).
Table 3.1 Example trip times for a delivery within an urban region
Travelling from Place St. Michel, Paris, to:
Great Circle distance
[km]
Road distance
[km]
Extra way travelled [%]
Time one way(Monday
10:30)
Equivalent great circle
speed [km/hr]
Orly Airport 12.8 18.8 47% 36 min 21
Aerodrome Toussus le Noble 20.9 34.0 63% 54 min 23
Brétigny-sur-Orge 27.5 37.5 36% 48 min 34
Melun Centre 42.0 58.9 40% 55 min 46
We can see that to meet the delivery times in case of an individual delivery, we would need to fly around 30 km/hr for a highly populated core with a radius of 25 km, and about 50 km/hr for a larger radius of 40 km, to match the speed of a road delivery for one individual package. Taking all packages at once or delivering individually Because a UAV has a low payload capacity, it would employ a different mode than normal deliveries where a van normally takes more packages at once, especially in case of non-express delivery.

Metropolis
23
As a simplified way to look at this effect, see the effect below on a number of destinations all at an equal distance of 25 km away from the distribution centre.
Table 3.2 Logistics example of collective delivery vs. individual delivery
2 ( 1)
2n
d rn
2d n r
From this we can see that for 10 packages, the individual, point-to-point (express) delivery takes 2½ times as much kilometres than the collective route. But we can see that per package, the individual delivery mode is 4 times as fast as the average distance with the same speed. 3.1.3 Fuel costs
As reference mileage for delivery by road we take a mileage of 1 litre diesel for 15 km [16]. Without Value Added Tax, in Paris today this would cost around 1.22 euro per litre. As a rough estimate for the car itself, without the fuel, we can use a cost of at least as much at least 0.10 ct/km. In the table we see that the distance saving effect of the great circle is at least 40%. So for a single delivery the energy cost of the UAV could be 1.22 x 1.4 = 1.71 per 15 km or 11.4 cts per km.
Number
of
packages
Distance in
case of one
route for all
[km]
Average distance
per package for
one route [km]
Individual
delivery total
[km]
Individual
per package
[km]
1 50 25 50 25
2 129 64 100 25
3 155 77 150 25
4 168 84 200 25
5 176 88 250 25
6 181 90 300 25
7 185 92 350 25
8 187 94 400 25
9 190 95 450 25
10 191 96 500 25
15 197 98 750 25

Metropolis
24
As reference price for electricity we take price of EDF in France, which is 0.12 euro per kWh. So in order to be comparable with today’s road traffic in energy costs, we have a huge energy budget of nearly 1 kWh per km! As we will see, this is one or two orders of magnitude larger than what a UAV actually needs. So already with today’s technology, the UAV delivery systems would be superior in energy efficiency compared to road transport.
3.1.4 Environmental considerations
Emissions To reduce the impact on the local air quality in the urban environment, especially in the light of the potentially large numbers of UAVs, an electrical propulsion system is preferred. When the electricity is generated without CO2 emissions (such as solar, wind or nuclear) or in a sustainable way (biofuel / biomass, waste combustion, it would also reduce the environmental footprint of the UAV delivery system. Noise Electrical propulsion is less noisy than combustion engines, but noise could still be an issue. Currently techniques such as noise shielding are hardly used in UAVs, so there is room for improvement in the design phase. The noise aspect also may have to be considered when deciding on operational issues like concentrating or spreading the traffic. Any rerouting reduces the benefit of UAVs in comparison with surface traffic. Another operational measure to reduce noise is an increase in cruise altitude for the UAVs. This has an energy penalty. Third party risk One of the causes of resistance against a high number of packages flying in the air is the (perceived) risk for people on the ground. To reduce this third party risk, there are, next to improving the overall reliability, a number of mitigation options:
- Low weight - Shrouded rotor/propeller - Multiple low power engines instead of one large rotor/propeller - Adapt routing - Avoid flammable fuel and hence combustion engines
Security/Package delivery Intercepting package UAVs could be a low risk-high gain crime. Even though today’s mail can be stolen as well, the fact that a UAV is unmanned clearly removes a barrier. To prevent this, a high speed and high altitude are preferable, making it harder to mechanically intercept the packages. But even then it has been suggested that people will shoot it down. On-board security cameras, which transmit the video images to a ground station, could be a way to mitigate this risk. The actual delivery does not have to include a landing. Similar to current mail delivery, a reception box could be attached to the building of the recipient. Electronic confirmation of the delivery can replace the signature. Such a system would also reduce the risk of theft and protect packages against weather influences like rain.

Metropolis
25
3.1.5 Overview of existing UAV technology
UAV/RPA systems There is a large variety of capable UAV systems available today. Based on the contours of the systems from the previous sections, a selection of systems, which most closely match the required characteristics will be selected as baseline. From the 2013/2104 overview published in the yearly RPAS Global Perspective document [17] a first selection has been made of light-weight RPAs, which can carry a payload. Microdrones’ vehicles have also been added to this list[18]. They are shown in the table below:
Table 3.3 Reviewed UAVs from yearly overview: VTOL with payload
Max speed Endurance Range MTOW Payloadkm/hr hrs km kg max kg
Advanced UAV Technology AT-10 Mini/EL Rotor 50 0.5 4 4.8 1.5
Advanced UAV Technology AT-20 Mini/EL Rotor 80 0.92 4 7 4.5
Advanced UAV Technology AT-30 Mini/Gasoline Rotor 80 2.5 4 7 5
Aerialtronics Altura Pro AT6 Mini EL Hexacopter 21.6 0.47 2 5.4 1.75
Aerialtronics Altura Pro AT8 Mini EL Octocopter 21.6 0.36 2 7.75 2.75
Aerialtronics Altura Pro ATX4 Mini / EL Quadricopter 21.6 0.58 2 2.2 1
Aerialtronics Altura Pro ATX8 Mini / EL Quadricopter 21.6 0.42 2 7.25 2.75
Aerocam 23F Mini Rotor 0.5 2 10 3
Airscooter Airscooter E70 Micro/EL Rotor 0.25 14 2.25
Airscooter Airscooter G70 Micro/Rotor 92 0.6 14 4.5
Airview AV-01 Mini Rotor 110 2 6 1.5
Airview AV-02 Mini Rotor 120 2 8 2
Alpha Unmanned Systems Sniper Mini Rotor 150 3 25 17 2
Alpha Unmanned Systems Sniper XL Mini Rotor 40 1 25 32 4
Challis Helicopters Heliplane E950 Mini/EL Rotor+nose propeller 1 15 25 10
CINAVE Berrio Mini Rotor 60 1 12 5
CyberFlight Cybershark Mini Rotor 100 1 100 14 2
Delft Dynamics RH2 Stern Mini Rotor 15 2
Fy-n-Sense Scancopter X5 Micro Hexacopter 72 0.5 3.2 1.2
HighEye HE 26 CA Mini Rotor 145 2 100 8 8
HighEye HEF 30 CA Mini Rotor 145 2 100 7 8
Infotron IT 180-5 EL Mini EL Rotor 90 0.5 5 15 5
Microdrones MD4-1000 Mini / EL Quadricopter 43.2 1.5 20 5.55 1.2
Microdrones MD4-3000 Mini / EL Quadricopter 57.6 0.75 50 15 3
Nascent Technology AHMMH-1 XS Mini Rotor 3 4.83 7.26 2.72
Neural Robotics Autocopter Mini Rotor 2.41 13.5 6.8
Oneseen Skytech MAVtrinix 7000 Mini Coaxial Rotor 0.25 8 4
Radar MMS DPV-8-B Mini Rotor 1.5 10 8 1
Radar MMS DPV-12-B Mini Rotor 1 10 12 3
Radar MMS DPV-20-B Mini Rotor 1 10 20 5
Rotomotion SR-30 Mini Rotor 45 1.5 4.5
Rotrob Marvin S14 Mini Rotor 0.5 14 5
Selex ES Profalk Mini Tilt Rotor 4 18 3
Singapore Technologies Aerospace Fantail Mini/Shrouded Rotary Wing 130 0.5 5 3 1 incl.fuel
Singapore Technologies Aerospace Fantail 5000 Mini/Shrouded Rotary Wing 0.5 8 6.5 0.9
Steadycopter Black Eagle 50 Mini Rotor 126 3 50 35 3
Steadycopter STD-5 Close Range Rotor 1 or 2 5 13.6 8
Surveycopter(Cassidan) Copter 1b Mini Rotor 70 0.75 or 1.0 10 or 25 15 5
Tianjin Aurora UAV Technology A1 Mini Rotor 0.3 10.2 3.5
Uav Vision Aeolus Mini Rotor 1 or 2 14 5
ZalaAero Zala 421-06 Mini Rotor 50 1.5 15 12 2
Producer Model Cat/Type

Metropolis
26
Many systems that meet the payload and range requirements are based on a mini-helicopter, often using a large single unshrouded, rotary wing. From the both third-party risk and environment perspective, in the previous sections a light-weight electrical systems is preferred. If we use this criterion, the following system remain:
Table 3.4 Selection currently system currently using electrical propulsion
From this second table there are still huge differences, especially in the range-payload combination. Only a few vehicles have a range larger than 10 km: the Microdrones and Heliplane E950. The MD4-3000 has a payload of 3 kg. As can be seen in the following section, the range requirement might improve as a result of battery technology advances, other vehicles could also become a candidate. While this document was being prepared, the CEO of Amazon, declared that package delivering UAVs will become a reality in five years, so in 2018[19]. Amazon showed videos of an Octocopter with a flight time of 3 x 30 minutes, delivering packages up to 2.3 kg, which is 86% of the deliveries of Amazon. DHL is also considering using UAVs for package delivery. One of the resulting articles discussing the feasibility was published in a Dutch newspaper[20]. The reporter concluded that the German Microdrones’ md4-3000, a new model recently announced in a press release, meets the requirements. From the table with UAV specifications we can see its specifications do indeed stand out.
fig. 3.1 MD4-3000 (Image from Microdrones.com)
Max speedEndurance Range MTOW Payload
km/hr hrs km kg max kg
Advanced UAV Technology AT-10 Mini/EL Rotor 50 0.5 4 4.8 1.5
Advanced UAV Technology AT-20 Mini/EL Rotor 80 0.92 4 7 4.5
Aerialtronics Altura Pro AT6 Mini EL Hexacopter 21.6 0.47 2 5.4 1.75
Aerialtronics Altura Pro AT8 Mini EL Octocopter 21.6 0.36 2 7.75 2.75
Aerialtronics Altura Pro ATX4 Mini / EL Quadricopter 21.6 0.58 2 2.2 1
Aerialtronics Altura Pro ATX8 Mini / EL Quadricopter 21.6 0.42 2 7.25 2.75
Airscooter Airscooter E70 Micro/EL Rotor 0.25 14 2.25
Challis Helicopters Heliplane E950 Mini/EL Rotor+nose propeller 1 15 25 10
Fy-n-Sense Scancopter X5 Micro Hexacopter 72 0.5 3.2 1.2
Infotron IT 180-5 EL Mini EL Rotor 90 0.5 5 15 5
Microdrones MD4-1000 Mini / EL Quadricopter 43.2 1.5 20 5.55 1.2
Microdrones MD4-3000 Mini / EL Quadricopter 57.6 0.75 50 15 3
Singapore Technologies Aerospace Fantail Mini/Shrouded Rotary Wing 130 0.5 5 3 1 incl.fuel
Singapore Technologies Aerospace Fantail 5000 Mini/Shrouded Rotary Wing 0.5 8 6.5 0.9
Producer Model Cat/Type

Metropolis
27
The specifications of the MD4-3000 are:
Maximum Take-Off weight: 15 kg Payload weight: 3 kg Cruising speed“: ~ 16 m/s Flight time: about 45 min Flight Radius: up to 50 km Service Ceiling: 4.000 m Temperature Range: -10 / +50 °C Dimensions: H 360 / L 2052 / B 1888 mm Noise from similar MD4-1000: 68 dBA, hovering in a distance of 3m
At TU Delft another concept is explored, the so-called ATMOS. This quadricopter-flying wing hybrid is a variation on the tilt rotor as the complete vehicle rotates. It combines the versatility of a rotorcraft with the endurance and range of a fixed wing aircraft. The ATMOS vehicle has a range of 3.5 km and can reach a speed of 75 km/hr. However current versions do not yet have a substantial payload capacity. Work is ongoing on a large version aimed at carrying payload. A disadvantage is the quickly increasing size when payload and wing area are higher.
Fig. 3.2 Prototype of ATMOV tilt-wing vehicle
3.1.6 Battery technology
One area where a substantial increase is currently observed is the energy density of batteries[21]. An example of a new promising technology for UAVs is the metal-air battery as this uses oxygen from the air, which therefore does not have to be carried in the battery. As a result, the energy density can become even higher.

Metropolis
28
fig. 3.3 Battery weight
As can be seen in the figure above from [21], the Li-Air battery can reach an energy density of 1,000 Wh/kg, five times as high as current Li-ion. This would therefore increase the range or reduce battery weight and increase payload of the UAVs currently using Li-ion batteries. There is still significant progress to be expected in terms of battery chemistry, as can be seen from the table below from[22]:
Table 3.5 Different battery technologies compared

Metropolis
29
For the Cargo UAVs we therefore presume an electric UAV, similar to the MD4-3000 quadcopter up to larger octocopters. The range and speed may benefit from advances in battery and electrical engine technology.
3.2 Personal Air Vehicle Technology Review 3.2.1 Case and resulting main criteria for PATS
To see the advantage of a more individual mode of air travel we take a sample trip from Wassenaar, north of The Hague in the Netherlands to downtown Paris. The door-to-door great circle distance is 390 km.
Table 3.6 Example trip segment times for a flight within Europe
Location Clock time
Leave home for station 5:30
Train from local station De Vink 6:00
Arrive at Schiphol by train 6:30
Passed check-in, security , boarding at 7:30
Flight departure 8:00
Flight arrival 9:25
Take train 9:45
Arrive downtown station 10:10
Arrive walking to hotel 10:25
Door-to-door time 4:55
As we can see that even though the actual flight time is only 1:25 hr, the total trip takes 4:55 hr, and this schedule assumes a very reliable public transport system, as the only margin is a 30 minutes later arrival at the departure airport. This is quite an optimistic planning: if one would take one train earlier or later on either side an hour can easily be added to make sure to arrive at a meeting in time. This also means that taking the train or especially the car for such a distance will be just as fast or faster as you’re less dependent of schedule times. This will be especially true when due to the automation the effort is also comparable. The difference with personal air transport is that roads are more easily congested, because there is less space, which still leads to a long door-to-door time. In case of using a personal air transport vehicle, the relevant distance is the great circle distance. So the travel time will be 390 km divided average ground speed in km/hr. Note that for the example above the average speed relative to the great circle is only 80 km/hr. Any addition to travel time before and after the flight, due to a limited number of landing/take-off sites, will reduce the travel time advantage. Therefore a short take-off and landing or even vertical is preferred, as it will reduce the space required for the infrastructure. The possibility to take off very close takes away the need for a hybrid, roadable vehicle. The hybrid aspect of these vehicles has a clear weight penalty, so avoiding this will benefit the efficiency of future personal air transport vehicles.

Metropolis
30
Travelling individually, instead of collectively, generates more drag and hence has a higher environmental impact. However, from the example above we see this can be mitigated by flying slower, while still arriving earlier than with the current centralized transport system. Halving the speed, reduces the required energy by a factor 4 as drag increases with the square of the airspeed. Air taxi modes could ensure higher occupancy rates, but would also increase the travel time. These considerations mean that the main criteria for a personal air vehicle to meet the demands are:
- Range of 400 km - Cruise speed high enough for an acceptable travel time - Required landing and take-off length
As the automation level of the production line and the one-time development costs are a large part of the price, the vehicles price depends on the numbers in which it is produced. For example, cars would be at least as expensive as airplanes if they would be manufactured, and sold in the same limited numbers as aircraft. So the current estimated price is not considered representative for the end-state. The mileage is relevant for the introduction but is also an area, which will change quickly as a transition is made to new energy sources and media. This means that current cost and mileage are less relevant to estimate the type of vehicle for personal air transport in the far future. This figure still has been included in the review as an indicator of predicted relative energy efficiency, even though the fossil fuel may not be the medium in the future. For safety, a number of vehicles have been fitted with an emergency parachute for the complete vehicle. Also, (semi-)automated control modes have been proposed for the vehicles still in the conceptual phase. This last option is already within today’s technological capabilities. Because the PAVs are, more than UAVs, still in the early stages of development, their feasibility is far from certain. So another criterion for our selection is the chance of success. For this we will use the technology readiness level (TRL) and also look at the development time. For the readiness level, the NASA TRL scale will be used. [24]

Metropolis
31
Table 3.7 Technology Readiness Definitions by NASA[24]
Batteries vs. Fuel Cells Personal Air vehicles are more demanding in terms of energy density and power to weight ratio as they travel longer distances. In the table below from Eaves & Eaves, 2003 [23], There are basically three alternatives for fossil fuels:
- Batteries - Hydrogen with fuel cells - Synthetic fuel (uses a combustion engine)
A comparison between fuel cells and batteries shows that batteries outperform the fuel cells in weight and volume, main due to storage requirements.
Technology Readiness Level Description
1. Basic principles observed and reportedThis is the lowest "level" of technology maturation. At this level, scientific research begins to be translated into
applied research and development.
2. Technology concept and/or application formulated
Once basic physical principles are observed, then at the next level of maturation, practical applications of those
characteristics can be 'invented' or identified. At this level, the application is still speculative: there is not
experimental proof or detailed analysis to support the conjecture.
3. Analytical and experimental critical function and/or
characteristic proof of concept
At this step in the maturation process, active research and development (R&D) is initiated. This must include
both analytical studies to set the technology into an appropriate context and laboratory-based studies to
physically validate that the analytical predictions are correct. These studies and experiments should constitute
"proof-of-concept" validation of the applications/concepts formulated at TRL 2.
4. Component and/or breadboard validation in laboratory
environment
Following successful "proof-of-concept" work, basic technological elements must be integrated to establish that
the "pieces" will work together to achieve concept-enabling levels of performance for a component and/or
breadboard. This validation must be devised to support the concept that was formulated earlier, and should also
be consistent with the requirements of potential system applications. The validation is "low-fidelity" compared to
the eventual system: it could be composed of ad hoc discrete components in a laboratory.
5. Component and/or breadboard validation in relevant
environment
At this level, the fidelity of the component and/or breadboard being tested has to increase significantly. The basic
technological elements must be integrated with reasonably realistic supporting elements so that the total
applications (component-level, sub-system level, or system-level) can be tested in a 'simulated' or somewhat
realistic environment.
6. System/subsystem model or prototype
demonstration in a relevant environment (ground or
space)
A major step in the level of fidelity of the technology demonstration follows the completion of TRL 5. At TRL 6, a
representative model or prototype system or system - which would go well beyond ad hoc, 'patch-cord' or discrete
component level breadboarding - would be tested in a relevant environment. At this level, if the only 'relevant
environment' is the environment of space, then the model/prototype must be demonstrated in space.
7. System prototype demonstration in a space
environment
TRL 7 is a significant step beyond TRL 6, requiring an actual system prototype demonstration in a space
environment. The prototype should be near or at the scale of the planned operational system and the
demonstration must take place in space.
8. Actual system completed and 'flight qualified' through
test and demonstration (ground or space)
In almost all cases, this level is the end of true 'system development' for most technology elements. This might
include integration of new technology into an existing system.
9. Actual system 'flight proven' through successful
mission operations
In almost all cases, the end of last 'bug fixing' aspects of true 'system development'. This might include
integration of new technology into an existing system. This TRL does not include planned product improvement of
ongoing or reusable systems.

Metropolis
32
Table 3.8 Comparions Fuel Cells and batteries [23]
3.2.2 Review of different vehicles
Based on data from the manufacturers [25] [26] [27], [28] [29], the following table has been compiled for currently existing vehicles/concepts for personal air transport.
Table 3.9 Reviewed Personal Air Transport Vehicles
There is a huge difference in TRL and feasibility. On the one end, there is the Skycar 400, which has been under development for decades and still not reached a very high level of readiness. There has not been a substantial success since the tethered test flight in 2003 and it is therefore highly speculative. Other vehicles such as the Transition and PAL-V, with less ambitious specifications, are already performing test flights. The R22 helicopter and E-glider Antares 20E, which have been included as a reference, are already available and being used. The images below/on the next page give an impression of the types of vehicles in the list.
Skycar 400
Producer Model Type of vehicle Propulsion type
Person
s on
board
Readines
s in 2013
[TRL]
Range
[km]
Mileage
[lkm/lit]
Cruise
speed
[km/hr]
Take-off
length
[m]
Landing
length
[m]
Möller Skycar 400 Tilt Rotor/Fixed Wing
Road-Flight Hybrid
537 kW Ethanol rotary engine 4 4 1213 4.0 (est.) 212 (496) VTOL VTOL
Terrafugia Transition Fixed Wing 75 kW 4-stroke engine 2 7 660 8.5 160 518
Terrafugia TF-X Tilt Rotor/Fixed Wing 2 x 447 kW electric + 1x 224 kW
combustion
4 2 805 322 VTOL VTOL
PAL-V PAL-V One Gyrocopter Road-
Flight Hybrid
170 kW combusion 2 7 300-500 4.1 (est.) 165 30
Robinsons R22 Helicopter 108 kW 4 stroke combustion 2 9 386 4.4 165 VTOL VTOL
Lange Aviation Antares 20E Fixed Wing 42 kW electric 1 9 190 45 100 (est.)

Metropolis
33
Terrafugia Transition
Terrafugia TF-X
PAL-V
Metropolis
34
Robinson R22 Helicopter
Antares 20E
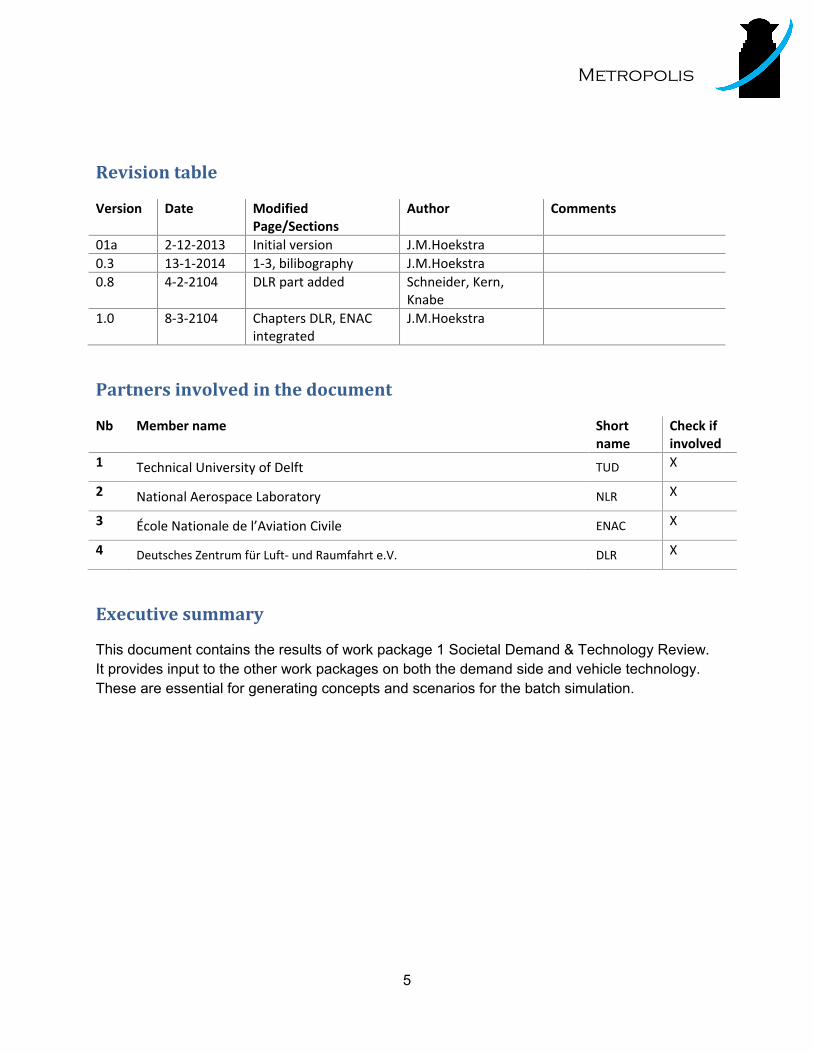
fig. 3.4 Different vehicle type options for large scale personal air transport 3.2.3 Tilt-rotor aircraft
In vision documents, like Flight path 2050 from ACARE, many advances are foreseen in the development of tilt-rotor vehicles as they are currently only used for military purposes (see figure below).
fig 3.5 V-22 osprey, an operational tilt-rotor aircraft

Metropolis
35
As these aircraft combine the versatility of the helicopter and an efficiency close to a turbo-prop fixed wing aircraft, they are an attractive alternative for helicopters. Their VTOL capabilities mean application in urban areas, similar to emergency helicopters today can be expected. Their higher efficiency means they may also be used for non-emergency operations, increasing the number of flying vehicles in the urban airspace. All current prototypes are not aiming at personal transport and hence can be left out of the review in this chapter. They still have to be taken into account as part of the scenario as they can be seen as the flying ‘buses’ which will intervene with the flying ‘cars’. 3.2.4 Expected PAV-type(s) and performance characteristics
As the use of the PAV is foreseen as a means of transport in between different urban areas (so inter-city), the range has to be substantial, in the order of at least 400 km to make it an attractive option. A feasible PAV should also allow a short or vertical take-off and landing distance for reasons mentioned before, and combines this with an acceptable cruise speed and range. Main advances in performance are to be expected in:
- Vehicle structural weight reduction - Weight of electric energy storage - Volume of electrical energy storage - Weight of electrical engines - Aerodynamic efficiency of vehicle-propulsion integration
For fossil fuel and combustion engines the innovation cycle has already reached a point where the advances will be less than in electrical media and engines. Still, also here a substantial gain is still to be expected when the time span encompasses decades. For the PAVs vehicles we see the Terrafugia TF-X as the potential replacement for the car while the PAL-V can be seen a s a replacement for the motor cycle. The fraction of road traffic which will be replaced by flying traffic is hard to judge. The trip distance pays a role but also the economics and status play a role, which might in turn completely change the distribution of trip distance for commuting and recreation. As a conservative estimate in a brainstorm it was decided that we assume 1/6 of the road traffic has the potential to be replaced by these personal air transport vehicles when we assume a mature and economic version of the TF-X and the PAL-V.
fig 3.6 Base type of VSTOL vehicles of choice: PAL- V(1-2p), Terrafugia TF-X (1-4p)

Metropolis
36
4 Infrastructure & Systems [DLR]
4.1 Personal Air Vehicle Ports 4.1.1 Initial Situation
The main Problem, which already exists today, is overload of the traffic infrastructure in urban areas or rather leading to and away from major cities. The logical consequences of overloaded roads are congestions. Taking a look at the previous and predicted trends in urbanisation, as described in section 2.1, this issue will get more intense. Figure 4.1 shows the actual congestion level in average and during peak hours for different major cities in Europe and North America.
Figure 4.1: average and peak hour congestion in major cities [30]
A rise in congestion time also has an increasing impact on time costs of each person involved in the traffic jam. To solve this problem, e.g. a new road infrastructure or an implementation of a PAV system seems necessary. Based on the flexibility of PAVs and the reduced time costs, a positive effect on acceptance of PAVs will arise. The main group affected by congestion in cities is the commuter traffic, so this group will contain users with the highest potential to purchase a PAV. 4.1.2 PAV infrastructure
Based on the expected PAV-types to replace cars, they feature vertical take-off and landing capabilities in case of the Terrafugia TF-X or identify themselves by having a short take-off distance of round about 541 ft (165 m) considering the PAL-V. In principle for PAVs with the ability of vertical take-off and landing operations, take-offs and landings could be performed on relative flat surfaces:
on rooftops,
in the backyard,
at open space,
Metropolis
37
on streets,
on created platforms on waterways, or
at airports. For the PAL-V it is more difficult by means of the required take-off length. Concerning this kind of PAV it is possible to start and land:
on pre-defined street lanes,
on rooftops providing the minimum length for take-off and landing,
on created platforms on waterways, or
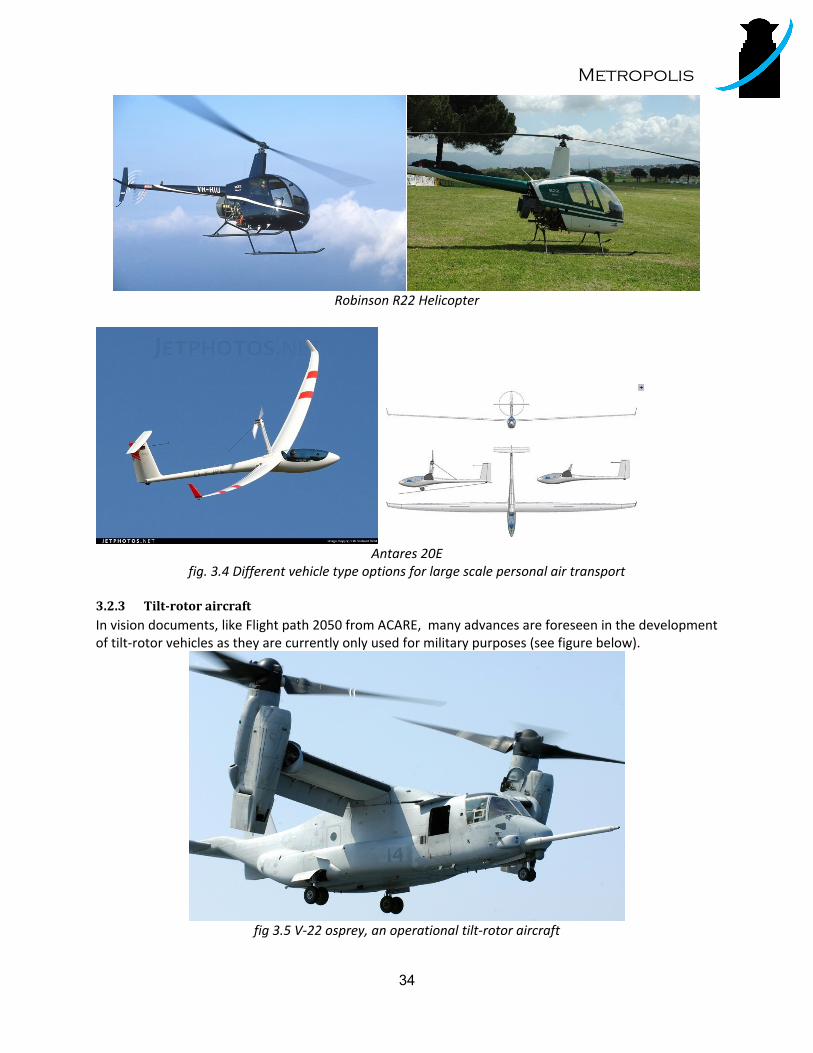
at airports. An important factor which has to be kept in mind for departures and arrivals on rooftops is that there is an open area needed for safety reasons. Buildings that are surrounded by higher buildings are inappropriate for take-off and landing operations. Road-legal PAVs are capable of flying to a PAV-port and continuing to their intended destination on the streets. On first thought, this concept would not require dedicated PAV-parking facilities but, even if a lot of time could be saved by flying into the city’s core area, the travellers would still waste time by being stuck in inner-city road traffic searching for parking spots or driving to their destinations. This results in the need to establish a network of combined landing and parking facilities that are located throughout the city. The question on how to offer enough parking spaces can be solved by establishing “PAV towers”, which in idea are similar to car-towers, with the difference that they are intended for storing PAVs instead of cars. On top of each tower there can be one or more PAV-ports with access to the parking places by an elevator, as shown for cars in Figure 4.2.
Figure 4.2: car-tower as model for a plane-tower [31], [32]
One of these towers with a height of about 160 ft (48 m) has a capacity of 400 vehicles. This actual technology has the ability to store a car in less than two minutes or faster, depending on the parking position [33]. Looking into the future it should be expected that advanced technology can reduce the actual storing time. Additionally, it might also be recommendable to build additional parking floors on top of existing buildings or office blocks to have an opportunity to store PAVs of the respective employees. In those cases it is also necessary to create designated areas for take-off and landing on the

Metropolis
38
rooftops and a lift to get to the parking floors. The technology for storing PAVs is similar to the one used in car-towers. Looking at the aspect of PAVs without the ability to take-off and land vertically, more space for take-off and landing is needed. These PAVs could operate from predefined lanes on the street or other large and level areas on ground level providing minimum take-off and landing length. In this regard it is conceivable to store PAVs of this kind in an underground plane parking lot, in regular parking garages or in the aforementioned plane-tower using a street-level entrance. Cities with several railroad stations or non-underground suburban or transit railroad lines offer enough space to establish a building or a rooftop platform above railroad tracks or stations to start and land PAVs. In addition, these buildings could have the capability to provide some parking places either with an access to an underground plane parking lot or by allocating parking places between the runway on the rooftop and the rail tracks. Independent to all the designated areas for take-off and landing on buildings in the city center, already existing or new built airfields can be used as well. Additionally platforms could be set up on waterways to meet the requirements for take-off and landing. Taking a look at the position and number of PAV-capable parking lots, it has to be considered that the traveller’s final destination is not too far away from the parking position. It has to be kept in mind that the benefit of using PAVs, especially saving time from the starting point to the individual destination, should be preserved. Another aspect to discuss is the infrastructure on the ground. Imagining 1/6 of the road traffic has the potential to be replaced by PAVs, meaning that for instance Paris (example mentioned before) with a road-traffic of 1.4 million vehicles, would have about 230,000 PAVs streaming into and out of the city every day. This amount of PAVs might present challenges to offer enough PAV-capable parking spaces in the city, especially if it is not possible to use regular car-parking spaces. Furthermore, the benefit of using PAVs instead of cars in regard of reduced travel times would be significantly reduced if the traveller needs to waste additional time to circle the streets looking for a suitable parking space. To cope with the approximated amount of PAVs in operation by 2050, in consequence generates great demands on infrastructure. Implicating that every PAV will need a parking space, requires at least 230,000 PAV-capable parking places in the city, using the example of Paris mentioned before. Related to the core area of Paris with a radius of 50 km, in average 30 parking spots per km² will be needed. Due to different densities e.g. in view of workplaces within the city core, the real number per km² will differ from the average. Additionally all PAVs need to be supplied with fuel. So at this point it is also necessary to implement a supply infrastructure. One option is to integrate filling stations into the parking lots. On the other hand probably the easiest way to comply with the topic of refuelling is to operate electrical driven PAVs. In consequence no fuel has to be pumped up to the upper levels of buildings. Simultaneously it is also practical to have a PAV parked and charging in be backyard of the owner’s property or in the upper levels of buildings. Due to the hybrid drive installed in the Terrafugia TF-X it can be operated electrical on ground and furthermore the electrical power also assists the main engine during take-off and landing. For charging its batteries it is imaginable to have a recharging station in every parking lot, otherwise it also can be

Metropolis
39
recharged by its combustion engine. The engine is used during flight or on the ground and runs on gasoline. [34] For safety reasons, refilling gasoline should take place at regular gas stations on the ground instead of at the parking spaces. In comparison the PAL-V has an engine which runs only on gasoline. The advantage of both PAVs is its ability to drive on streets, whereby it is capable to use the already existing infrastructure of gas stations for ground vehicles.
To cope with safety it is recommendable to give a release to the PAV pilots for entering the airspace, only when there is a parking spot vacant for the time of arrival. Additionally information about air traffic and weather conditions can be provided on INFO frequencies, already used today for VFR traffic. Another option to damp capacity limitations can be realized by establishing a plane-sharing or taxi service. 4.1.3 Plausibility check on infrastructure
During the first step, ideas have been collected to make a rough overview about what seems to be possible for a PAV infrastructure. In the next step a validation will be executed, to exclude ideas, which do not fulfil the requirements for perform a safe take-off and landing process. To recall the possible options for landing and take-off of PAVs, they are listed below one more time:
Existing airfields
Dedicated PAV strips or spots
Usage of road segments alternating with road traffic
Pillar mounted strips or spots on existing road or railroad infrastructure or on waterways
Rooftops of existing buildings In order to estimate the space needed for a PAV landing and take-off site, the specifications of the two PAVs assumed for the METROPOLIS study are taken as input. The current specification of the PAL-V ONE shows a take-off roll of 165 m and a landing roll of 30 m, all in all a “space measuring about 200 by 30 m without surrounding obstacles is needed to take-off and land” [35]. Terrafugia TF-X™ is planned to be able to takeoff vertically from a level clearing of at least 100 ft in diameter [34]. During the next section all options will be discussed in detail with their advantages and disadvantages, which in the end are tried to be expressed in facts and figures.
4.1.3.1 Dedicated strips or spots on the ground
Talking about take-off and landing spots on the ground, it includes airfields as well as dedicated strips or spots in general. Finding an area, which offers enough space to realize a runway for PAVs, is very hard in a densely populated city. The only option is to resort to local parks or already existing airfields. This causes disadvantages with respect to the time of travel. This kind of landing spots cannot be realized in a large scope, because it depends on the location of the local parks or open space. Especially the PAL-V suffers from its long take-off distances so not all places can be taken into consideration.

Metropolis
40
4.1.3.2 Usage of road segments alternating with road traffic
The street infrastructure is highly developed and provides many opportunities for take-off and landing. Under consideration of the clearance area needed for a PAV many streets have to be neglected and also other aspects have to be considered. For comparison: The Av. des Champs Elysees leaving the Pl. de la Concorde has a width of roughly 27 m which is comparable to the space required by the two selected concepts. It is used for eight lanes of car traffic. The average traffic per day on Ave. Champs Elysees is 87000 vehicles, i.e. a minimum of 87000/1440 = 60 road vehicles per minute in a peak hour. If a PAV would block such a street for only one minute in a peak hour for a take-off or landing operation, 60 road vehicles would have to wait. Technically and procedurally such a solution seems to be feasible, but the rough estimate for the number of cars blocked seems to be fairly high. There are a number of options to decrease the blocking of road traffic and thus to make a street use more possible:
Reduce the obstacle free area requirements (=street width requirements) for both concepts, that would increase the number of streets which could be used. For smaller streets the number of blocked road vehicles during take-off and landing will be lower.
Use smaller streets with adjacent obstacle free areas. Less road traffic will be blocked: Examples for average road traffic flows per day on German streets (2011) [36]:
Highway: 48191 units/day federal highway: 12536 units/day main through road: 6558 units/day (equal to 7.5% of Champs Elysees)
Reduce the “road-runway occupancy time” in order to block a minimum of road vehicles during landing and take-off operation. The number of one minute is an educated guess, which includes closing the road segment for road traffic, clearing the segment, roll-up, take-off and re-opening the segment for road traffic.
In conclusion starting and landing directly on streets does not seem to be a far-reaching option, which fulfils the expectations or respectively the requirements for an even greater demand. Nevertheless it is still possible that the free area requirements could be reduced in the near future based on new technologies, so in the end better results will be generated by using this option.
4.1.3.3 Dedicated landing and take-off spots on top of existing infrastructure
This section is combining all possible landing spots on top of already existing buildings or created auxiliary surfaces e.g. on waterways. As already discussed starts and landings on streets does not seem to be the best solution. On the other hand it is possible to put auxiliary surfaces on top of streets e.g. imaginable as a platform on pillars. This issue would only affect a few streets, based on the relative low number of PAVs in use. To cope with the height of trucks these platforms should reach at least a height of 5 meters. Under these circumstances enough clearance between street level and platform bottom is guaranteed. Additionally no traffic on the streets is blocked and the traffic flow does not get interrupted. Furthermore this also offers a higher rate of flow for PAVs. Assuming one minute for take-off and

Metropolis
41
landing procedures of a PAL-V, during one hour 60 starts or landings are possible. Thinking one step further there also need to be parking spots to store the vehicles. In case of the PAL-V a ramp can be established to roll on and off the platform. In this case the PAL-V can also use conventional parking places, which are used by cars. The Terrafugia TF-X might need less than one minute for take-off and landing. An educated guess assumes 30 seconds per arrival or departure. Considering a traffic mix of 20% PAL-V and 80% Terrafugia TF-X during one hour 108 movements are feasible. Additionally to ramps, parking spots connected to the platforms e.g. underneath the streets or in adjacent buildings seem to be a suitable solution. Similar to the proposed ideas in combination with streets, waterways provide enough space to establish a platform on pillars as well. These platforms could be realized:
on rivers,
on lakes,
on channels,
in harbours, or
in a bay. Ramps leading to and away from the platforms should provide a connection to the road infrastructure with the opportunity to store the PAVs close by e.g. in a “plane tower”. Taking the dimensions of this platform in consideration, there is an even higher flow possible compared to the platforms above streets. In case of wide waterways two runways/ports do not seem unrealistic. Other places to set up platforms are above railroad tracks or stations. An additional ramp or elevator could provide a connection to streets or parking lots. Realization also depends on the properties of the tracks. A very curvy railroad line for instance is unsuitable, because for take-off and landing of the PAL-V a straight runway should be available. A positive feature of this option in contrast is the short access to public transportation, in case of landing sites on top of railway stations or close to those. All options using platforms for take-off and landing offer the same infrastructure with the same characteristic data in reference to traffic flow. In some cases the width of the platform can be increased so the traffic flow can rise as well. A limiting factor for all options is the technology for storing PAVs at parking spots. This could reduce the actual traffic flow, based on the transfer-time from the parking spot to the take-off position and the other way around. Especially during peak hours this is a critical factor. A similar kind of platforms is embodied by rooftops on existing buildings. This kind is more capable for the Terrafugia TF-X and its availability for vertical take-off and landing operations. For the PAL-V it is nearly impossible to find a building in Paris, which copes with the minimum required runway length. Furthermore there are also objects like air conditioning units on top of roofs or the roofs have a slope. This in consequence implies extensive conversion work. Due to the size of the roofs and the obstacle clearance required for take-off and landing, parking on top of the building as well will be not possible in most cases. PAVs have to be stored beneath the top level using elevators or a ramp system. Assuming a roof-top-occupancy time (educated guess) of 30 seconds per arrival or departure including ramp usage to and from the parking level a service rate of 100+ operations per hour could be achieved. If one elevator is used the service rate may decrease. Assuming a service rate of 2 minutes per elevator service cycle (loading, down, unloading, (loading), up, unloading), a capacity of 30 arrivals per hour is

Metropolis
42
feasible, if a departure demand is there, 60 operations could be possible. If two elevators are used, a service rate comparable to the ramp proposal may be achieved. Overall there are enough options to provide an infrastructure for PAVs in major cities, but this only will be accepted when there is a time saving factor. Thus it is assumable to have at least one landing/take-off spot per square km, i.e. a maximum direct distance of 700 m to destination (walking distance may be higher). Furthermore direct access to public transportation is beneficial. With a radius of 50 km of the core area of Paris (7854 km²) and an infrastructure for PAVs with a density of one landing site per km², around 30 parking spots would be needed per km² (230,000 vehicles assumed). Depending on the infrastructure of the city, on km² can hold several business tower or shopping center, which in consequence requires more than 30 parking spots. How the 30 parking sport are spread inside one km² therefore is influenced by existing infrastructure. The target groups of people who will own a PAV are basically commuters and business travelers. So in the end most of the parking spots need to be close to the working places. In average, between 30 and 45 parking spots per km² seem more practical. 4.1.4 Conclusion
To reflect all options found and discussed it can be summarized, that there is no perfect solution to cope with the needs of PAVs. There will be a mixture of several options to fulfil the requirements. On top of an office block, which characterizes the shortest distance for employees, will be the best solution for a commuter or business traveler. Landing on rooftops is better suited for the Terrafugia TF-X with its vertical take-off and landing ability. Overall it is easier to find a landing spot for this kind of PAV. Nevertheless also the use of platforms, let it be on streets, waterways or train stations, generates more opportunities for the PAL-V to get closer to the final destination without having to drive longer distances on inner-city streets,. The parking situation will either be solved by plane towers, underground parking spots or on top of existing office blocks.
4.2 Unmanned Aerial Vehicle Cargo Station and Reception System
Initially there are two different perspectives concerning the topic of cargo stations and reception systems. The first idea is that cargo is delivered by UAVs that are operated by logisticians. Thinking one step further it also is possible that there are personal UAVs owned by individuals, that could be send to pick up packages from cargo stations or different selling points, but may also be used for e.g. grocery shopping based on instructions by their owners. Just as a starting statement the next section will deal with distribution centres. 4.2.1 Distribution centre
Cities with millions of inhabitants do not only need to be supplied with food but also e.g. with medicine or packages with a variety of content for personal needs. Due to these facts, distribution centres are established. Not unlike with today’s road-based delivery-system, these distribution facilities could either belong to manufacturers or distributors that want to distribute their products directly to their customers or to logistic/postal companies. Due to limited space in the city centre and the fact that distribution centres will need to receive a lot of large shipments from other logistic centres or manufacturers, these will usually be located at the outskirts of the city with good connections to railroad lines, a larger airport or inter-city roads. This will also generate short distances for delivery UAVs to the city centre and the

Metropolis
43
suburban areas surrounding the city. In this consideration and a population of approximately of 11 million, to outline it on the example of Paris, a potential need of more than one cargo supply station already exists today. Accordingly different distribution centres will be spread around the metropolitan core area. To take a look at the inside of distribution centres it is conceivable, that there are several spots, where UAVs can be loaded. These spots can be reached either by sensor-regulated openings integrated in the ceiling or by doors working under the same conditions. Each spot supplies more than one UAV with cargo. In the course of time the electrical driven UAVs will run out of battery, so it will be inevitable to take them out of service for charging. This circumstance reveals that several UAVs are needed to do a kind of second shift, while the other ones are recovering. The other way it is also possible that personal UAVs can be applied to pick up packages from the distribution centre. Accordingly the UAV gets a permission, for instance via RFID-chip, to enter the area of the distribution centre and pick up goods. Further discussion about the process of delivery can be read in the next section. 4.2.2 Delivery
UAVs will deliver packages to a closed system using a docking interface, ensuring fast processing time. Delivery directly to the recipient would require additional on-board systems to identify the person retrieving the package and the UAV might have to wait until the packages are picked up. In the city, the docking interfaces will be located on higher buildings. Using RFID chips or barcodes, the packages could then automatically be distributed either directly to the recipient’s flat or to an automated self-service parcel booth (similar to DHL’s Packstation as depicted in Figure 4.3) located on the ground floor for the recipient to pick it up.

Metropolis
44
Figure 4.3: DHL Packstation [37]
Delivering packages to docking interfaces located on lower structures or even on ground level might pose higher risks either for people to get injured or for the UAVs to collide with obstacles. Furthermore, the UAV faces a significantly higher risk of being attacked. During peak times, multiple deliveries might arrive during a short time span. These will be processed on a first-come first-serve basis with the waiting UAVs entering a holding pattern overhead or diverting to a nearby holding platform until the docking interface is ready to process the next UAV.
4.3 Systems
4.3.1 Navigation Systems
In urban environments, knowledge of the exact position of an aerial vehicle is an important factor regarding trajectories and separation assurance/conflict avoidance. Even with today’s high accuracy of satellite- and radio-based positioning systems, high-rise buildings could shield GPS and other radio or data-link signals. To improve signal accuracy, additional ground-based broadcast stations could be installed, either to transmit corrections to GPS signals (differential GPS, GBAS), to relay data-link signals or to provide independent positioning data. These stations could additionally be used for the surveillance of the airspace as described in the next section. Furthermore, UAVs and highly automated PAVs will need sensors to detect unexpected obstacles like building cranes, other aerial vehicles or even objects intended to hinder the aircraft. Even if all PAVs and regular UAVs are equipped with advanced systems like ADS-B and TCAS that assure separation, remotely piloted model airplanes or even large flock of birds would still need to be detected to prevent collisions.

Metropolis
45
4.3.2 Security
Unmanned cargo delivery aircraft face several different threats they need to be protected against, the most obvious one being the attempt to steal the cargo. Different approaches have to be considered, from shooting down of the UAVs to get ahold of the parcel to hacking and hijacking the vehicle including its cargo or reprogramming it to deliver the cargo to a different location. Hacking attacks could either target a specific UAV or all UAVs in an area (e.g. by using a brute force attack or by jamming or interfering data-link signals). Furthermore, navigational aids could be manipulated to guide the UAV to a different address. Without any people present, the inhibition threshold for using force against an UAV to steal the cargo might be significantly lower compared to robbing a manned parcel truck. Furthermore, shooting down of UAVs just to see if the cargo might be interesting could turn into a problem. A different aspect to consider is that, even with low-noise, electrically powered UAVs, a high number of these vehicles passing certain areas at low altitude might raise opposition from residents or activists. In some cases, this might also lead to attempts to sabotage or shooting of UAVs using low-tech weapons, for example water hoses, fireworks, potato guns or even stationary objects like large nets blocking the UAVs flight path. The UAV also needs to be protected against these weapons, especially while approaching or departing its intended delivery address. The cargo UAV system also needs to be protected against terrorists using it for their purposes, e.g. by using an UAV to shoot down PAVs, by sending explosive or poisonous cargo to their intended targets or to detonate “dirty bombs” at altitude. On the other hand, PAVs also need to be highly automated due to the fact that they are to be operated by people that may not be professional pilots. This high degree of automation also requires protection against hacking or manipulating navigational systems to prevent attacks or hijacking attempts. 4.3.3 Surveillance Systems
With a high number of PAVs and UAVs operating in an urban airspace, a multi-level surveillance and traffic control system is required. The first level of this system is a decentralized vehicle based system. Every vehicle intended for operation in the airspace is required to be equipped with an operational broadcast system, comparable to an advanced version of ADS-B and TCAS that transmits the exact position as well as the intended trajectory and additional data like information about obstacles detected by on-board sensors. The systems of vehicles in close proximity need to communicate with each other to assure separation. The position and trajectory data is also transmitted to a control centre. Depending on the airspace concept, this control centre will provide clearances for level changes, trajectories or even the whole flight, taking into account where parking spaces are available and allocating one to the PAV. Furthermore, this system would provide warnings or close sectors if obstacles are detected or any vehicle’s on-board system fails to transmit correctly.

Metropolis
46

Metropolis
47
6 Airspace Capacity limits & constraints [ENAC]
6.1 Introduction
Being able to estimate an ultimate airspace capacity is one of the cornerstones of the Metropolis
project. It is quite different from the so-called operational capacity in air traffic management (ATM)
since the latter is essentially related to a centralized control while the former assumes autonomous
vehicles.
Obtaining an accurate capacity metric is one of the goals of the project, and is heavily dependent on the
structure of the traffic flows. However, a simple approach based on a physical analogy with the phases
of matter can be taken in order to get a crude estimate of what can be ultimately obtained.
Depending on the level of traffic organization, three different phases can be identified:
Solid phase when relative speeds between vehicles vanish. This situation is analogous to the
physical structure of a crystal where atoms are fixed.
Liquid phase when traffic is bound to a coherent structure along lines or sheets of flow, but with
an allowed velocity variation (sliding condition) between them.
Gaseous phase, when no assumptions are made on the relative speeds.
Capacity is decreasing with the level of organization, the first phase being the most capacitive.
Tools needed to estimate the ultimate capacity in each case are different: for the fully coherent
structure, it boils down to finding the number of vertices of a lattice within a given volume, for the half-
coherent situation, the counting procedure is applied to flow sheets or flow lines while in the last case, a
probabilistic approach if taken.
Approach based on road flows will also be described for which definition of flow capacity, flow density
etc. will be given. Based on such flow structure for which vehicle are constrained in speed, it is quite
easy to extract a capacity bound.
The various procedures are detailed below, keeping in mind that the capacity evaluated this way is only
an order of magnitude of what can be ultimately reached. More accurate capacity figures can be
obtained only through simulation and statistical analysis of the mean structure of the traffic.

Metropolis
48
6.2 Flow Structure and Capacity
Depending of the traffic orientation we may end up with different capacity. In this chapter we will
consider a full organized traffic for which Vehicles are moving in the same direction. Based on this
organization restriction, one can search for the traffic structure which enables to put the maximum
number of aircraft in a given piece of airspace.
6.2.1 Two Dimensional Traffic
For cars, traffic flow is generally constrained along a one-dimensional pathway (e.g. a travel lane). Traffic
flow in a time-space diagram is represented by the individual trajectory lines of individual vehicles.
Vehicles following each other along a given travel lane will have parallel trajectories, and trajectories will
cross when one vehicle passes another. In order to have the maximum capacity of the flow one must
force the vehicles to have the same speed. Determination of relationships between concentration,
density, speed and volume is of primary interest in traffic flow theory, which involves the development
of mathematical relationships among the primary elements of a traffic stream – flow, speed, density.
Consider the case of vehicles following each other on a long stretch of roadway or guide-way.
Furthermore, assume that these vehicles are not required to interrupt their motion for reasons that are
external to the traffic stream. In this case of uninterrupted flows the only interference that a single
vehicle experiences is caused by other vehicles on the roadway. The higher the level of safety the higher
the required spacing has to be just to avoid a collision. On this basis alone it would seem reasonable to
choose the safest level of operation. However, by increasing the level of safety, the capacity of the
system (i.e. the maximum number of vehicles or passengers that can be accommodated during a given
period of time) suffers. Consequently, a trade-off between safety and capacity exists.
6.2.2 Stream Variables
Spacing and speeds of the vehicles make up the stream. Two measures are therefore of fundamental
importance in traffic stream calculations – spacing and time-headway between successive vehicles. The
spacing is simply the distance between successive vehicles, typically measured from front bumper to
front bumper. It is the reciprocal of density. Time-headway is the time between the arrival of successive
vehicles at a specified point and it is the reciprocal of volume. For many light traffic situations, traffic can
be described by the Poisson probability distribution:
( )
where
( ) is the probability that exactly randomly arranged vehicles will be observed in a
unit length of road, or the probability of arrival of exactly vehicles in a unit length of
time.
the average number of vehicles arriving in an interval of length
Metropolis
49
traffic volume (vehicle per hour)
length of time interval
It should be emphasized that the Poisson exponential distribution is applicable to random or free-flow
traffic situations. In order to increase flow capacity, one must definitely organize the traffic also in the
time dimension (in this case the traffic is structured in the time dimension and Poisson distribution is no
more valid.
Traffic density, also referred to as traffic concentration of the vehicular stream, is defined as the
average number of vehicles occupying a unit length of roadway at a given instant or the ratio of the
number of vehicles appearing on a photograph to the length of the roadway segment. This is an
instantaneous measurement taken at the instant when the picture was taken. The dimensions of
concentration are given in terms of vehicles per length of roadway. Generally it is expressed in units of
vehicles per kilometer at an instant in time. Traffic density bears a functional relationship to speed and
volume. Concentration is in the present recommended as the basic parameter for describing the quality
of flow along freeways and other multilane roads. The relationship between spacing (or average spacing
when not constant) and concentration is:
Consider a stationary observer next to the roadway. Vehicles pass the observer’s location one after
another at intervals of time defined as the headways between vehicles. In the simple example
described above, the headway between vehicles is constant and can be computed by dividing the
constant spacing by the constant speed of system operation. Time headway ( ) is the difference
between the time the front of a vehicle arrives at a point on the highway and the time the front of the
next vehicle arrives at that same point. Time headway usually is expressed in seconds. Space headway –
spacing ( ) – is the distance between the front of a vehicle and the front of the following vehicle.
The number of vehicles counted at the point of observation (point along a roadway or traffic lane)
divided by the total observation time (equivalent hourly rate at which vehicles pass a point on a highway
lane during a time period) is defined as the stream flow – sometimes referred as volume – and
measured in vehicles per unit time. A measure of the quantity of stream flow is commonly measured in
units of vehicles per day, vehicles per hour, etc. Flow is a measurement at a point on the roadway over
time. The relationship between headway and flow is given by:
Volume is then the total number of vehicles that pass a point on a highway during a given time interval.
When the time interval is one hour, the unit of volume is vehicle per hour. On a given roadway, the
volume of traffic fluctuates widely with the time.
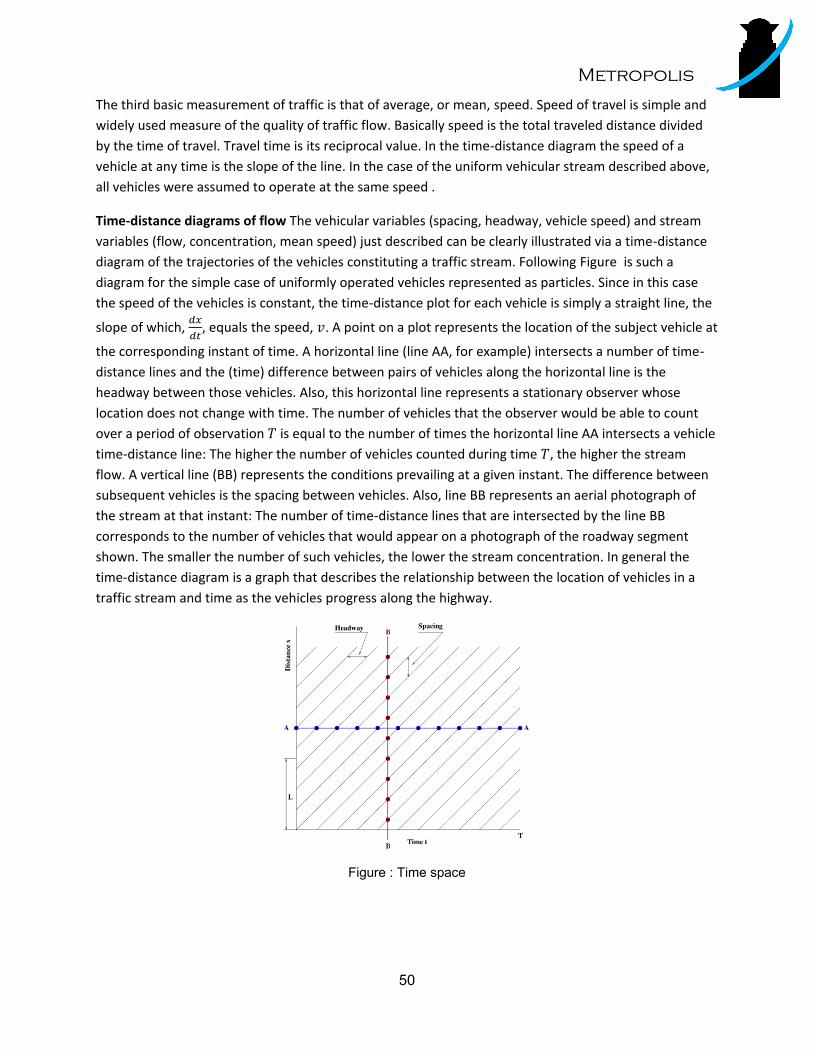
Metropolis
50
The third basic measurement of traffic is that of average, or mean, speed. Speed of travel is simple and
widely used measure of the quality of traffic flow. Basically speed is the total traveled distance divided
by the time of travel. Travel time is its reciprocal value. In the time-distance diagram the speed of a
vehicle at any time is the slope of the line. In the case of the uniform vehicular stream described above,
all vehicles were assumed to operate at the same speed .
Time-distance diagrams of flow The vehicular variables (spacing, headway, vehicle speed) and stream
variables (flow, concentration, mean speed) just described can be clearly illustrated via a time-distance
diagram of the trajectories of the vehicles constituting a traffic stream. Following Figure is such a
diagram for the simple case of uniformly operated vehicles represented as particles. Since in this case
the speed of the vehicles is constant, the time-distance plot for each vehicle is simply a straight line, the
slope of which,
, equals the speed, . A point on a plot represents the location of the subject vehicle at
the corresponding instant of time. A horizontal line (line AA, for example) intersects a number of time-
distance lines and the (time) difference between pairs of vehicles along the horizontal line is the
headway between those vehicles. Also, this horizontal line represents a stationary observer whose
location does not change with time. The number of vehicles that the observer would be able to count
over a period of observation is equal to the number of times the horizontal line AA intersects a vehicle
time-distance line: The higher the number of vehicles counted during time , the higher the stream
flow. A vertical line (BB) represents the conditions prevailing at a given instant. The difference between
subsequent vehicles is the spacing between vehicles. Also, line BB represents an aerial photograph of
the stream at that instant: The number of time-distance lines that are intersected by the line BB
corresponds to the number of vehicles that would appear on a photograph of the roadway segment
shown. The smaller the number of such vehicles, the lower the stream concentration. In general the
time-distance diagram is a graph that describes the relationship between the location of vehicles in a
traffic stream and time as the vehicles progress along the highway.
Figure : Time space

Metropolis
51
6.2.3 Three Dimensional traffic
In the Metropolis framework, vehicle are moving in a three dimensional space which enable new
opportunities to organize flows. Based on set of three dimensional lanes, one can investigate the best
way to aggregate such lanes into a three dimensional flow in order to maximize the overall capacity.
Different structures exit as it can be seen on figure.
Figure : Structure
For example the figure presents two possible flow sections for which black points represent individual
lanes. For regular grid, it can be shown that hexagonal structure as shown in figure, maximize the flow
capacity.
Fundamental equation of vehicular stream
If two vehicles are traveling at a spacing and speed , the headway between them is simply
.
Substituting and in this relationship leads to the fundamental equation describing a traffic stream:
where
: average volume or flow (vehicles per hour)
: average density or concentration (vehicle per kilometer)
: space-mean speed
Although a number of theoretical and analytically speed-density relationships have been published, the
exact shape of the curve has not been conclusively established. A model proposed by Greenshields
assumed a linear relationship between speed and density. With that assumption, a parabolic volume-
density model results.
This equation is fundamental for describing the speed-volume-density relationship. The product of
higher speed times a lower concentration gives the resulting flow. Note that the units balance to
vehicles per hour on both sides of this equation, which represents a three-dimensional relationship
between the basic vehicular stream variables – flow, mean speed and concentration. It is if the utmost
importance to realize that the three variables vary simultaneously. Consequently, it would be generally

Metropolis
52
incorrect to attempt to compute the value of one of the three variables by varying another while holding
the third constant.
1. When the density (concentration) on the highway is zero, the flow is also zero as there
are no vehicles on the highway.
2. As the density increases, the flow also increases.
3. However, when the density reaches its maximum, generally referred to as the jam
density ( ), the flow must be zero, as vehicles will tend to line up and to end.
4. It follows, therefore, that as density increases from zero, the flow will also initially
increases from zero to a maximum value. Further continuous increase in density,
however, will result in continuous reduction of the flow, which will eventually be zero
when the density is the jam density.
We can also define traffic density which is the number of vehicles per unit area of the roadway. In traffic
flow, the two most important densities are the critical density ( ) and jam density ( ). The maximum
density achievable under free flow is , while is the maximum density achieved under congestion.
For flying vehicle, the has no meaning due to the fact that vehicles have to fly. The density ( ) within
a length of roadway ( ) at a given time ( ) is equal to the inverse of the average spacing of the n
vehicles. For a given lane, the maximum density will be reached when average spacing between vehicles
is minimum. For road traffic, such density is maximum when vehicles are block in a traffic jam. For
Metropolis project, such maximum density is unreachable due to the fact that vehicle has to fly inducing
a minimum safety buffer between two consecutive.
The flow rate can be compared to the discharge or the flux of a stream. The flow rate represents the
number of vehicles that passes a certain cross-section per time unit. We call the maximum possible flow
rate of any road its capacity. For instance, depending on vehicle composition, the capacity of a
motorway lies between 1800 and 2400 vehicles per hour per traffic lane. When vehicles are not
impeded by other traffic they travel at a maximum speed of (free speed). This speed is dependent,
among other things, on the design speed of the road, the speed restrictions in operation at any
particular time and the weather. The capacity of a road is equal to the maximum flow rate . The
maximum flow rate of has an associated capacity speed of and a capacity density of .
The maximum capacity of a road is reached when traffic has homogeneous speed and when such speed
is maximum with a minimum spacing (which reduce the overall safety).

Metropolis
53
6.3 Phase analogy for local capacity
Local capacity estimates are computed using a coherence assumption in analogy with the three physical
phases: solid, liquid, gaseous. Phase transition situations are not investigated, nor are the interfaces
between airspaces with different structures.
6.3.1 Fully coherent structures
In such a situation, relative velocities between vehicles are forced to vanish. Although a global
displacement exists, one can assume a static situation, where on tries to pack the maximum number of
spheres within a given volume, the radius of the spheres being set to the regulatory separation between
vehicle1. Although this problem has no general solution, letting the sphere centers be the vertices of an
hexagonal lattice is a very good approximate at least when airspace dimension is large compared to the
spheres radii. The problem of estimating the number of lattice points in a polytope has been intensively
studied [38], [39], and algorithms exist that runs efficiently on the instances size that one can expect to
encounter in the Metropolis project. A crude estimate is simply to take the ratio of the polytope volume
by the volume of an individual sphere, that yields an upper bound2.
6.3.2 Semi-coherent structures
This situation is half-way between full coherence and full autonomy, and is not so easy to deal with. It is
proposed to resort to a two-step estimation. First of all, a traffic organized on straight lines or planar
sheets is assumed. Within a line or sheet, a fully coherent structure is assumed, so that capacity
computation can be made using the procedure presented above. Between organized structures, no
velocity coherence is imposed, and capacity is limited by regulatory separation between vehicles. An
estimate for a sheet organized traffic is given by with the capacity of a single sheet and the
integer ratio between the length of the airspace cross-section (normal to sheets) and the separation
norm. For a line organized traffic, the value becomes , with the capacity of a single line and the
number of an hexagonal two dimensional lattice points falling within a cross-section.
When the traffic has some structure but is heterogeneous, that is sheet and lines coexist, there is no
obvious way extend the counting procedure. As far as only an order of magnitude is sought after, a
conservative procedure is to assume a line organization, since it has the least capacity value. Within a
cross-section of the airspace (that will be two dimensional since a line organization is assumed), the
fractal dimension of the traffic is computed [40], then the number of lines that may fit in this space is
estimated as the integer ratio (
)
the mean dimension of the cross-section and the regulatory
separation. Gathering things, the capacity is , with the line capacity as above.
6.3.3 Fully autonomous flights
In this situation, no assumption is made on relative speeds. Assuming fully autonomous flights,
separation between vehicles relies on embedded automatics. In such a case, the dimensioning value is
the maximal rate of conflict resolution maneuvers that can be taken. It is technology dependent and
cannot be given a priori without further investigations that are part of the metropolis project. In the
1 A tentative value for the separation needed can be obtained using monte-carlo simulations with accelerated convergence procedures like stratified sampling 2 Such a simple procedure may be satisfactory in a first approach

Metropolis
54
sequel, it will be assumed that this rate is known. Since pairwise encounters are by far the most
common, only this case will be investigated in order to derive a capacity value. An assumption of
uniform distribution of vehicles and probabilistic independence between them is made. Based on that,
one can select a specific vehicle as a reference and estimated the conflict rate within its own referential.
The goal is then to evaluate the number of vehicles entering a sphere centered at the origin whose
radius is the regulatory separation. Given a vehicle volumic density of , the conflict probability per
unit of time is √ where is the mean velocity. From that, a capacity can be infered using the
maximal conflict solving rate.

Metropolis
55
7 Bibliography [1] United Nations Population Division, World Urbanization Prospects: The 2005
Revision, 2006
[2] https://publicwiki.deltares.nl/display/KWI/1.2.1.8.+Randstad+2040,
[3] Eurostat- App for data on European region: http://appsso.eurostat.ec.europa.eu
[4] United Nations, Population Division/DESA www.unpopulation.org or
http://esa.un.org/unup/Country-Profiles/country-profiles_1.htm
[5] Demographia World Urban Areas (World Agglomerations): 9th Annual Edition, March
2013
[6] Shell New Lens scenarios – Shell international, 2013 www.shell.com/scenarios
[7] INSEE, Statistical data by INSEE, National Institute for Statistics and Economics,
France, http://www.insee.fr
[8] Xander Rijkee, Huib van Essen (CE Delft) - Review of projections and scenarios for
transport in 2050 EU Transport GHG: Routes to 2050 AEA/ED45405/Task 9 Report
V, February 2010
[9] VLEEM 2 Consortium, VLEEM 2 Final Report, EC/DG ResearchContract ENG1-CT
2002-00645, 2002
[10] Oppolzer, Jonathan (Editor) - Delivering Tomorrow - Logistics 2050 A Scenario Study
– DHL/Deutsche Post AG, First edition, February 2012
http://www.dhl.com/content/dam/Local_Images/g0/aboutus/SpecialInterest/Logistics2
050/szenario_study_logistics_2050.pdf
[11] Shell International - Shell Energy Scenarios to 2050 – Shell international, 2008
[12] Michio Kaku - Physics of the Future, How Science will shape human destiny and our
daily lives in 2100 – Penguin books, 2011
[13] Ducret R., Durand B. (2012). e-Commerce et logistique urbaine: la consigne
automatique, une alternative d’avenir?, RIRL 2012, The 9th International Conference
on Logistics and SCM Research, Montréal, 2012
[14] Ducret R, Dulaitre, L (2013) Parcel Delivery and urban Logisitics – Changes in Urban
courier, express and parcel services: the French case.World Conference on Transport
Research, Rio de Janeiro, Brazil, July 2013
[15] SIRIUS, Statistiques de Trafic sur le reseau Sirius en 2003 – Service
Interdépartemental de la Sécurite et de l’Exploitation de la Route,
http://www.driea.ile-de-france.developpement-
durable.gouv.fr/IMG/pdf/intro_1_8_cle068d28-1.pdf
[16] Ligterink, N.E., Smokers, R.T.M. Praktijkverbruik van zakelijke personenauto’s en
plug-in voertuigen (Mileage from practice of cars for commerial usage an plug-in
vehicles), TNO Behavioural & Social Sciences, TNO 2013 R10703, May 2013
http://www.amazon.com/b?ref_=tsm_1_tw_s_amzn_mx3eqp&node=8037720011
[17] Anon, RPAS Remotely Piloted Aircraft Systems – The Global Perspective 2013/2014
11th edition
[18] Website Microdrones, http://microdrones.com/products/products.php , Germany, 2012

Metropolis
56
[19] Amazon Prime Air Project, as announced in 60 minutes by CEO Jeff Bezos, See also
video on their website, Dec 2nd, 2013
[20] Weijer, Bart van den, “Is de pakjesdrone luchtfietserij?”(“Are package delivering
drones a fantasy?”), Article in Dutch Newspaper Volkskrant, December 7, 2013
[21] Christensen, J. Albertus, P. et al, A Critical Review of Li/Air Batteries, Journal of
Electrochemical Society, 159 (2) R1-R30 (2012)
[22] M. Armand & J.-M. Tarascon, Building better batteries, Nature 451, 652-657(7
February 2008), doi:10.1038/451652a
[23] S. Eaves & J. Eaves, Cost Comparison of fuel cell and battery electric vehicles,
Journal of Power Sources, Volume 130, Issues 1–2, 3 May 2004, Pages 208–212
[24] Mankins, John C. (6 April 1995). "Technology Readiness Levels: A White Paper".
NASA, Office of Space Access and Technology, Advanced Concepts Office
[25] Terrafugia website: http://www.terrafugia.com/
[26] Moller website: http://moller.com/dev/
[27] PAL-V website: http://pal-v.com/
[28] Lange Avaition website: http://www.lange-aviation.com/
[29] Robinson Helicopters webstie: http://www.robinsonheli.com/
[30] Decker, M. ; Fleischer, T. ; Meyer-Soylu, S. ; Schippl, J., Personal air vehicles as a
new option for commuting in Europe : vision or illusion?, European Transport
Conference 2013, Association for European Transport, 1-20
[31] http://upload.wikimedia.org/wikipedia/commons/e/e5/CarTower.jpg , 2014
[32] http://upload.wikimedia.org/wikipedia/commons/2/2c/Autoturm_von_Innen.jpg ,
2014
[33] Website Autostadt Wolfsburg, http://www.autostadt.de/de/autostadt-
erkunden/autotuerme/ , Germany, 2014
[34] http://www.terrafugia.com/tf-x#sthash.KKpSGy40.dpuf, Jan 24th, 2014
[35] http://pal-v.com/the-pal-v-one/specifications/ , Jan 24th, 2014
[36] http://www.statistik.baden-wuerttemberg.de/UmweltVerkehr/Landesdaten/v5c02.asp ,
Jan 24th, 2014
[37] http://commons.wikimedia.org/wiki/File:BigPS.JPG, Jan 24th, 2014
[38] J. A. De Loera, R. Hemmecke, J. Tauzer and R. Yoshida, "Effective lattice point
counting in rational convex polytopes ", Journal of Symbolic Computation , volume 38
number 4, pages 1273 – 1302, 2004, ,
"http://www.sciencedirect.com/science/article/pii/S0747717104000422"
[39] M. Beck, “Integer Points in Polyhedra-- Geometry, Number Theory, Representation
Theory, Algebra, Optimization, Statistics: AMS-IMS-SIAM”, Joint Summer Research
Conference, June 11-15, 2006, Snowbird, Utah,, 2008, American Mathematical
Society
[40] S. Mondoloni and D. Liang, “Airspace Fractal Dimensions and Applications”, In
Proceedings of Third USA/Europe ATM R\&D Seminar, 2001