Embed Size (px)
Citation preview

Aalto University
School of Electrical Engineering
Metrology Research Institute
Version 1.4
13/12/2018
Farshid Manoocheri
Saulius Nevas
Quality Manual for
Spectral Responsivity Calibrations

Quality Manual for SpectralResponsivity Calibrations
Page 2 (21)
Version: 1.3 Date: December 13, 2018 Last edited by: FM
1. Table of contents
1. Table of contents ............................................................................................. 22. Definition ........................................................................................................ 3
2.1. Scope .......................................................................................................... 32.2. Object and field of application .................................................................... 32.3. Features ...................................................................................................... 32.4. Spectral responsivity of transfer standard detectors ................................... 4
3. Equipment ....................................................................................................... 63.1. Description of setups .................................................................................. 63.2. Calibration requirements ............................................................................ 7
3.2.1. Maintenance of the equipment .............................................................. 73.2.2. Responsible Persons ............................................................................... 9
4. Measurement traceability ............................................................................... 105. Calibration and measurement procedures including validation methods ......... 11
5.1. Calibration methods and procedures for spectral responsivity .................... 115.2. Automation software .................................................................................. 11
6. Handling of calibration items ........................................................................... 127. Uncertainty budgets ........................................................................................ 13
7.1. Uncertainty components of responsivity measurements ............................. 137.2. Measurement ranges and best measurement capabilities .......................... 15
8. Accommodation and environmental conditions .............................................. 169. Field calibrations ............................................................................................. 1710. Control data .................................................................................................... 1811. Certificates ...................................................................................................... 1912. Intercomparisons ............................................................................................ 2013. Publications ..................................................................................................... 21

Quality Manual for SpectralResponsivity Calibrations
Page 3 (21)
Version: 1.3 Date: December 13, 2018 Last edited by: FM
2. Definition
2.1. Scope
This quality manual describes the use of Reference spectrometer and of transfer stand-ard detectors for absolute spectral responsivity calibrations of optical detectors. Trans-fer standard detectors are calibrated with (or traceable to) the cryogenic radiometerwith lasers. Modelling or spectral flatness are used to extrapolate the wavelength re-gions in the ultraviolet (UV), visible (VIS), and near-infrared (NIR) from 220 nm to 1800nm.
Spectral responsivity measurements using the laser light sources are described else-where.*
2.2. Object and field of application
Pyroelectric radiometer: Thermal, spectrally flat detector used in UV, VIS and NIR re-gions. The operational wavelength region is 200 nm – 16 µm and the highest measurablepower is 1 W.
Broad band detectors: Silicon photodiodes and multi-element detectors (trap detectors)for both radiometric and photometric measurements of optical power at wavelengthsbetween 220 nm and 1050 nm. Some traps have also been calibrated with the pyroelec-tric radiometer for the wavelength region 220 nm – 950 nm. The maximum measurablepower level is ~10 µW.
Broad band NIR detectors: Indium Gallium Arsenide (InGaAs), Germanium (Ge) photodi-odes and detectors (including a preamplifier) used for radiometric measurements of op-tical power at wavelengths between 820 nm and 1800 nm.
Narrow band filter radiometers: Detectors made of a combination of diffuser-aperture,a narrow or bandpass filter, and a photodiode are used in radiometry. Such filter radi-ometers are typically used to determine the irradiance of a light source with in a specificwavelength band.
2.3. Features
The configuration of the reference spectrometer for measurements of the spectral re-sponsivity includes the following features:
a) Automated instrument allowing simultaneous measurement of the response of thereference detector and a test detector in a wide range of wavelength settings
b) Reflecting optics
* Quality Manual of Optical Power Laboratory, MRI Publication.
Quality Manual for SpectralResponsivity Calibrations
Page 4 (21)
Version: 1.3 Date: December 13, 2018 Last edited by: FM
c) Collimated single-beam design allowing the determination of various uncertaintycomponents
d) Trap detectors with low back reflection and predictable spectral responsivity areused as transfer standard and reference detectors
2.4. Spectral responsivity of transfer standard detectors
Spectral responsivity in UV and visible
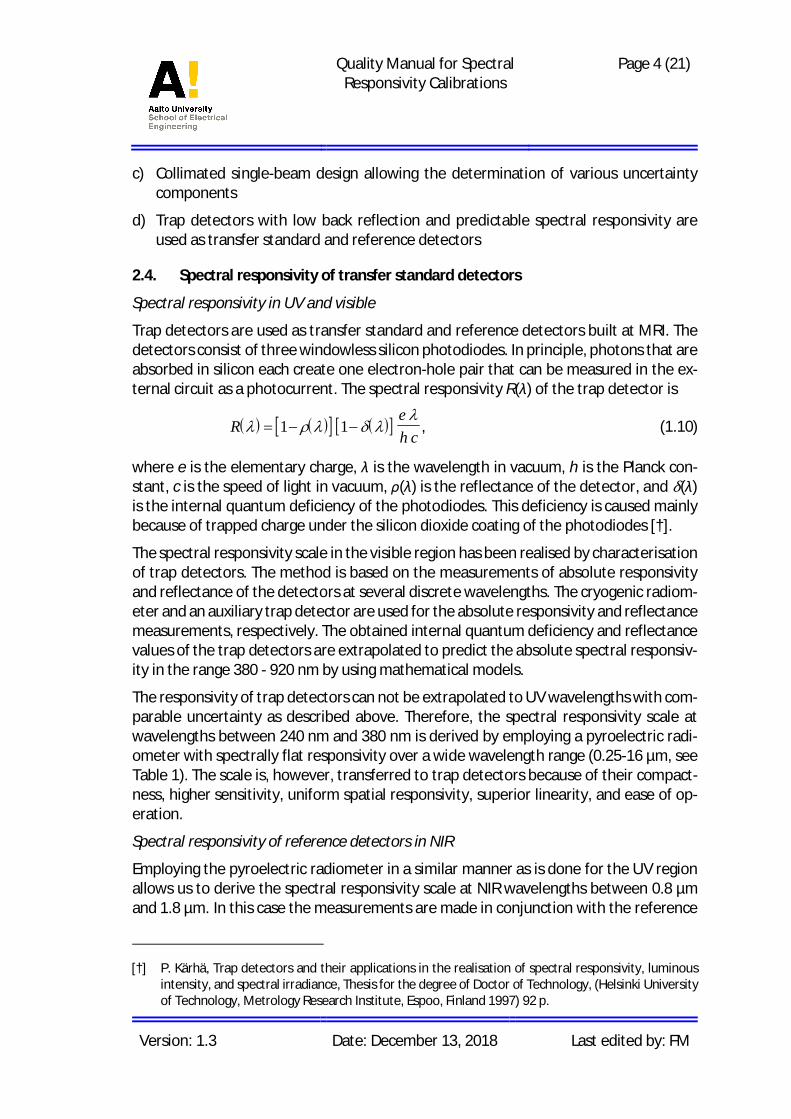
Trap detectors are used as transfer standard and reference detectors built at MRI. Thedetectors consist of three windowless silicon photodiodes. In principle, photons that areabsorbed in silicon each create one electron-hole pair that can be measured in the ex-ternal circuit as a photocurrent. The spectral responsivity R(λ) of the trap detector is
( ) ( )[ ] ( )[ ]Reh c
l r l d ll
= - -1 1 , (1.10)
where e is the elementary charge, λ is the wavelength in vacuum, h is the Planck con-stant, c is the speed of light in vacuum, ρ(λ) is the reflectance of the detector, and δ(λ)is the internal quantum deficiency of the photodiodes. This deficiency is caused mainlybecause of trapped charge under the silicon dioxide coating of the photodiodes [†].
The spectral responsivity scale in the visible region has been realised by characterisationof trap detectors. The method is based on the measurements of absolute responsivityand reflectance of the detectors at several discrete wavelengths. The cryogenic radiom-eter and an auxiliary trap detector are used for the absolute responsivity and reflectancemeasurements, respectively. The obtained internal quantum deficiency and reflectancevalues of the trap detectors are extrapolated to predict the absolute spectral responsiv-ity in the range 380 - 920 nm by using mathematical models.
The responsivity of trap detectors can not be extrapolated to UV wavelengths with com-parable uncertainty as described above. Therefore, the spectral responsivity scale atwavelengths between 240 nm and 380 nm is derived by employing a pyroelectric radi-ometer with spectrally flat responsivity over a wide wavelength range (0.25-16 µm, seeTable 1). The scale is, however, transferred to trap detectors because of their compact-ness, higher sensitivity, uniform spatial responsivity, superior linearity, and ease of op-eration.
Spectral responsivity of reference detectors in NIR
Employing the pyroelectric radiometer in a similar manner as is done for the UV regionallows us to derive the spectral responsivity scale at NIR wavelengths between 0.8 µmand 1.8 µm. In this case the measurements are made in conjunction with the reference
[†] P. Kärhä, Trap detectors and their applications in the realisation of spectral responsivity, luminousintensity, and spectral irradiance, Thesis for the degree of Doctor of Technology, (Helsinki Universityof Technology, Metrology Research Institute, Espoo, Finland 1997) 92 p.

Quality Manual for SpectralResponsivity Calibrations
Page 5 (21)
Version: 1.3 Date: December 13, 2018 Last edited by: FM
spectrometer. The absolute responsivity of the pyroelectric radiometer is calibrated us-ing a reference trap detector at wavelengths between 0.8 µm and 0.92 µm. The Ge andInGaAs detectors are then calibrated with the pyroelectric radiometer at wavelengthsbetween 0.8 µm and 1.8 µm. The Ge and InGaAs detectors are also compared with eachother to confirm the results.
Spectral responsivity of detectors to be measured
Usually the detector to be calibrated is also a silicon-photodiode based detector whoseresponsivity is different because of material of the window or coatings on the active areaof the diode. Others may include electronic amplification and reading instruments sothat the output voltage signal or display reading should be calibrated.

Quality Manual for SpectralResponsivity Calibrations
Page 6 (21)
Version: 1.3 Date: December 13, 2018 Last edited by: FM
3. Equipment
3.1. Description of setups
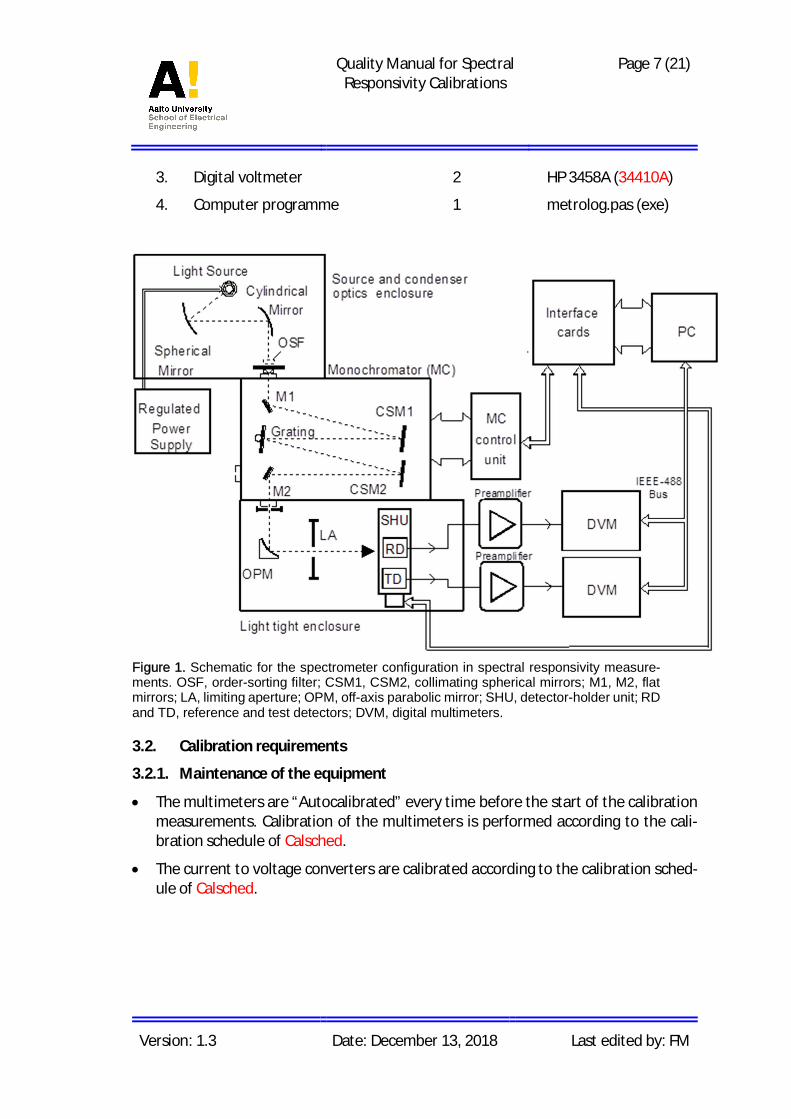
The configuration of the reference spectrometer for spectral responsivity measure-ments is shown in Figure 1. Equipment needed for the calibrations is presented in Table1. The equipment required for use and calibration of wavelength scale that is the samefor all measurement set-ups of reference spectrometer is given in a separate docu-ment.‡ For measurements in which movement of the detectors is not possible, the setupshown in Figure 2 is employed. We perform the measurements in two scans to cancelthe effects of the beam splitter.
Table 1. Equipment for spectral responsivity calibrations.
Description Quantity Identification
A. Reference spectrometer
B. Reference detector 1
1. Trap detector 2 MRI-9911, MRI-9806
2. InGaAs photodiode 2 HUTIGA-1, -2
3. Pyroelectric detector 1 RS-5900
4. Pyroelectric radiometer Rk-5720-RkP575
C. AR coated Achromatic lens
1. UV, f=250 mm 1
2. VIS, f=50 mm, f=250 mm 2
3. NIR, f=50 mm, f=250 mm 2
D. Linear translator stage Physik-Instrumente
1. Rail components. 3
E. Iris, limiting apertures, stands, and holders 1 x (built at MRI)
F. Alignment system
1. Alignment laser 1 OMTec
G. Control and data acquisition
1. Computer 1 PC (Mxxx)
2. Current-to-voltage converter 2 Vinculum SP042 (SR570)
‡ Quality Manual of Reference Spectrometer Laboratory, MRI Publication.
Quality Manual for SpectralResponsivity Calibrations
Page 7 (21)
Version: 1.3 Date: December 13, 2018 Last edited by: FM
3. Digital voltmeter 2 HP 3458A (34410A)
4. Computer programme 1 metrolog.pas (exe)
Figure 1. Schematic for the spectrometer configuration in spectral responsivity measure-ments. OSF, order-sorting filter; CSM1, CSM2, collimating spherical mirrors; M1, M2, flatmirrors; LA, limiting aperture; OPM, off-axis parabolic mirror; SHU, detector-holder unit; RDand TD, reference and test detectors; DVM, digital multimeters.
3.2. Calibration requirements
3.2.1. Maintenance of the equipment
· The multimeters are “Autocalibrated” every time before the start of the calibrationmeasurements. Calibration of the multimeters is performed according to the cali-bration schedule of Calsched.
· The current to voltage converters are calibrated according to the calibration sched-ule of Calsched.

Quality Manual for SpectralResponsivity Calibrations
Page 8 (21)
Version: 1.3 Date: December 13, 2018 Last edited by: FM
· The time since last calibration for reference (trap) detectors used for calibrationsshould not exceed two years. This applies also to absolute responsivity measure-ments with cryogenic radiometer, reflectance measurements, and responsivity ex-trapolations.§
· The pyroelectric radiometer is calibrated once a year. Due to its spectral flatness, thecalibration only needs to be done at one visible wavelength.
· Before calibration it is visually checked that there is no dust inside the trap detector.If there is visible dust, it may be carefully cleaned from the first photodiode withKodak lens cleaning tissue. The two inner diodes cannot be cleaned. Air should notbe used for cleaning, because the dust may end up on the inner diodes.
· Other equipment is calibrated according to the Calsched calibration schedule.
MCcontrol unit
Cylindrical Mirror
Light tight enclosure
Monochromator (MC)Spherical Mirror
Source and condenseroptics enclosure
QTH Lamp
Shutter
M1CSM1
CSM2
Grating
M2
D2
Interface cards PC
OSF
OPM
LA
Regulated Power Supply
D1
IEEE-BUS
BS
LENS
Meter(DVM)
DVM(Meter)
Figure 2. Schematic of the spectrometer configuration for spectral responsivity measure-ments when movements of detectors are difficult. OSF, order-sorting filter; CSM1, CSM2,collimating spherical mirrors; M1, M2, flat mirrors; LA, limiting apertures; OPM, off-axis par-abolic mirror; BS, beam splitter; D1 and D2, reference and sample detectors at measure-ment positions 1 and 2; DVM, digital multimeter.
§ Instruction Manual for Cryogenic Radiometer, MRI Publication.

Quality Manual for SpectralResponsivity Calibrations
Page 9 (21)
Version: 1.3 Date: December 13, 2018 Last edited by: FM
3.2.2. Responsible Persons
Branch manager and deputy are defined in the Quality Management System. Personsauthorised to do calibrations are defined in Annex A.

Quality Manual for SpectralResponsivity Calibrations
Page 10 (21)
Version: 1.3 Date: December 13, 2018 Last edited by: FM
4. Measurement traceability
Traceability of responsivity measurements
The calibration of a detector measured for spectral responsivity is traceable to the ab-solute cryogenic radiometer using calibrated reference detectors as secondary transferstandards.* Figure 3 shows the traceability chain for calibration measurements of spec-tral responsivity.
Cryogenic Radiometer
Transfer Standard Detectors
Reference Spectrometer
Reference Detector
Pyroelectric Detector
Calibrated Detector
Figure 3. Traceability chain of detector calibrations for spec-tral responsivity.

Quality Manual for SpectralResponsivity Calibrations
Page 11 (21)
Version: 1.3 Date: December 13, 2018 Last edited by: FM
5. Calibration and measurement procedures including valida-tion methods
5.1. Calibration methods and procedures for spectral responsivity
The spectral responsivity measurements for the wavelengths from 240 to 1700 nm areperformed using the single-beam reference spectrometer. A three-element reflectiontrap detector a temperature-stabilised 5-mm diameter InGaAs-photodiode and a Ge de-tector (serve as the reference detectors for measurements within the spectral range of240-950 nm, 940-1600 nm and 800-1800 nm wavelengths, respectively.
The reference detector and the test detector are interchangeably placed in the beamand the responses are measured at each wavelength. After subtraction of the dark signalfrom reading, the ratio of the test detector response to that of the reference detector iscalculated. The known spectral responsivity of the reference detector is finally used todetermine the spectral responsivity of the test detector. A detailed description of themeasurements and uncertainty analysis is given in the publication [6] listed at the endof this document.
5.2. Automation software
In order to control the related operations of the instruments a computer program pack-age has been developed (see also publication [**]). The program, ''RefSpecV3'', is amenu-driven PC program written in LabView. The program controls the operation ofeach automated device of the spectrometer not only during the transmittance meas-urement procedures but also whenever their action is required. The DVMs are con-trolled via a GPIB-488 controller card. The monochromator, and the filter wheel unit areautomated with separate interface cards via a parallel printer port. The linear translatorstage used as the detector-holder is automated via a controller-driver card.
The main command menu of the program offers choices of measurement procedures.The program allows a choice of the position of detectors and wavelength scans atequally spaced intervals or arbitrary specific wavelengths. The results of the responsivitymeasurements are saved in a file that can be monitored by a program menu commandafter the measurements are done. Detailed information on the instrument automationis available in [**].
[**] F. Manoocheri, Operating Instructions for Reference Spectrometer, ’’a short note on steps to betaken for spectral transmittance measurements’’, Quality Manual of Metrology Research Institute,(1994).
Quality Manual for SpectralResponsivity Calibrations
Page 12 (21)
Version: 1.3 Date: December 13, 2018 Last edited by: FM
6. Handling of calibration items
All items are handled with care and stored in locked rooms/laboratories.
Upon arrival, items are checked visually to note possible damage in the transport. Beforecalibration, operation of the items is tested.
If a defect in an item is noted, the item is not repaired without notifying the customer.This applies to cleaning or service of items as well.
Some calibration items, e.g. delicate optics such as diffuse reflectance standards, mayrequire special handling procedures. If such requirements exist, they should be definedin the Quality or Instruction manuals.

Quality Manual for SpectralResponsivity Calibrations
Page 13 (21)
Version: 1.3 Date: December 13, 2018 Last edited by: FM
7. Uncertainty budgets
7.1. Uncertainty components of responsivity measurements
The uncertainty budget for the spectral responsivity measurements is presented in Ta-ble 2 for UV, visible and NIR at wavelength of 300 nm, 600 nm, and 1500 nm, respec-tively. The wavelength-dependent expanded uncertainty is presented graphically in Fig-ure 4. The uncertainty components induced by the detector to be calibrated are in-cluded in the budget for a typical high quality photodiode. Other detector related un-certainty components should be taken into account separately. The uncertainty in re-sponsivity of the reference detectors is due to the procedure used in transferring thescales from the primary detectors. The component due to temperature is caused by amaximum variation of 1°C in the temperature of the output optics compartment of thespectrometer and the temperature coefficient of the detector.
The linearity of the detectors has been measured to be satisfactory within the workingpower range (0.01-20 µW) with the given standard uncertainty [††]. The component dueto the spatial nonuniformity of the detector responsivity is based on the results of rele-vant measurements of beam nonuniformity and for an uncertainty of 1 mm in centringof the detector in the measurement beam [‡‡,§§]. At NIR wavelengths, the InGaAs ref-erence detector is usually used in with an antireflection coated acromatic lens or in com-bination with an averaging sphere with a nonuniformity of 0.04% mm-1. The effect istaken into account when bare Ge or InGaAs detectors must be used. The componentsinduced by the reference spectrometer are obtained from the characterisation meas-urements of the instrument and are given elsewhere.‡Table 2. Relative Uncertainty Components of Spectral Responsivity Measurements.
Standard uncertainty (%)
Component \ Wavelength UV Visible NIR
Transfer standard detector Pyroelectric Si trap Pyroelectric
1. Primary reference --- 0.03 ---
2. Reflectance modeling --- 0.04
3. IQE modelling 0.05
4. Spectral flatness of Pyro 0.5 --- 0.5
[††] T. Kübarsepp, A. Haapalinna, P. Kärhä, and E. Ikonen, “Nonlinearity measurements of silicon photo-detectors,” Appl. Opt. 37, 2716-2722 (1998).
[‡‡] K. D. Stock, R. Heine, and H. Hofer “Influence of inhomogeneity of NIR-photodiodes on calibrationsat 1047 nm,” Metrologia 28, 207-210 (1991)
[§§] F. Manoochehri, “High-Accuracy Spectrometer for Applications in Photometry and Radiometry”,Doctors thesis, Helsinki University of Technology, 115 p. (1998).

Quality Manual for SpectralResponsivity Calibrations
Page 14 (21)
Version: 1.3 Date: December 13, 2018 Last edited by: FM
5. Spatial nonuniformity 0.4 0.01 0.5
6. Range correction 0.4 --- 0.3
7. AC to DC conversion 0.3 0.3
8. (a)Root of sum of squares 0.81 0.07 0.82
Reference detector Si trap Si trap InGaAs
9. Repeatability 0.2 0.05 0.23
10. Temperature 0.1 0.01 0.12
11. Linearity 0.05 0.02 0.05
12. Spatial nonuniformity 0.04 0.01 0.14
Reference spectrometer
13. Stray light 0.08 0.02 0.03
14. Beam displacement 0.09 0.04 0.04
15. Wavelength scale 0.03 0.02 0.05
16. Interreflections 0.04 0.01 0.15
17. Current-to-voltage-conver-sion
0.08 0.04 0.04
18. Polarisation 0.02 0.01 0.05
19. (b)Root of sum of squares 0.28 0.09 0.35
Calibration of single photodi-odes Silicon Silicon Germanium
20. Repeatability 0.2 0.08 0.09
21. Temperature 0.05 0.01 0.12
22. Linearity 0.04 0.02 0.05
23. Beam displacement 0.09 0.09 0.09
24. Interreflections 0.08 0.01 0.15
25. Current-to-voltage-conver-sion
0.08 0.04 0.04
26. (c)Root of sum of squares 0.25 0.13 0.24
27. Expanded uncertainty(k=2) 1.79 0.35 1.85
Quality Manual for SpectralResponsivity Calibrations
Page 15 (21)
Version: 1.3 Date: December 13, 2018 Last edited by: FM
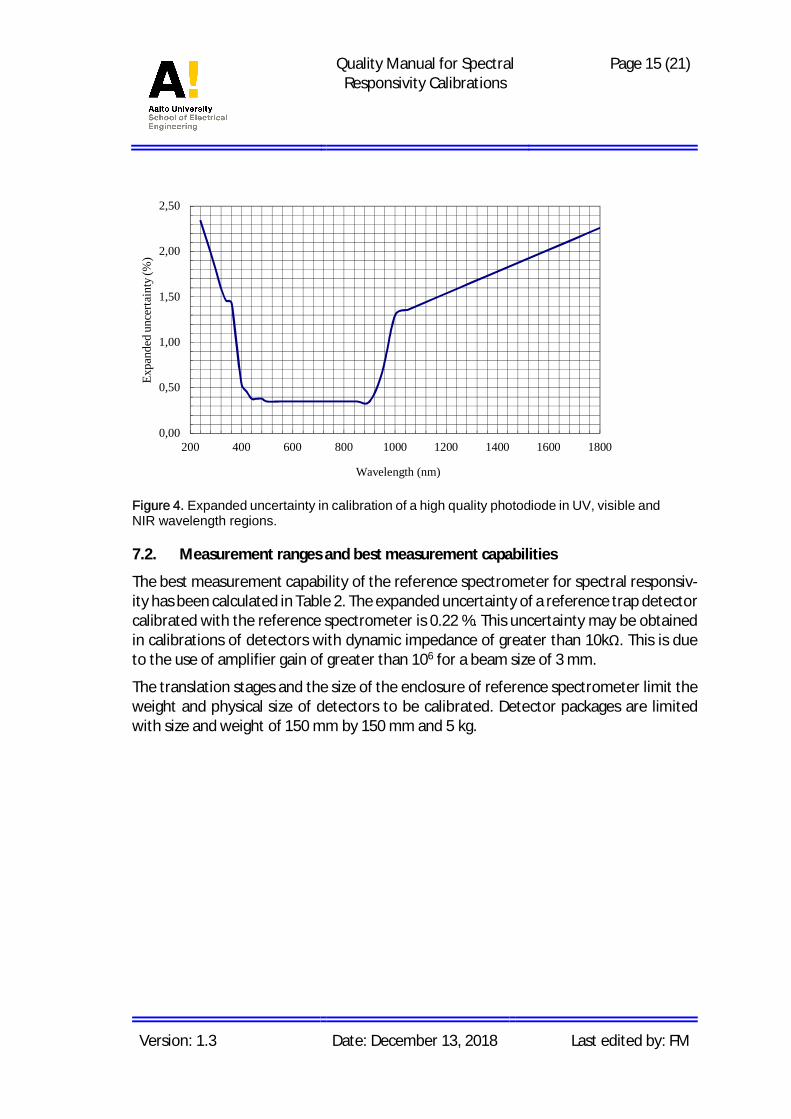
Figure 4. Expanded uncertainty in calibration of a high quality photodiode in UV, visible andNIR wavelength regions.
7.2. Measurement ranges and best measurement capabilities
The best measurement capability of the reference spectrometer for spectral responsiv-ity has been calculated in Table 2. The expanded uncertainty of a reference trap detectorcalibrated with the reference spectrometer is 0.22 %. This uncertainty may be obtainedin calibrations of detectors with dynamic impedance of greater than 10kΩ. This is dueto the use of amplifier gain of greater than 106 for a beam size of 3 mm.
The translation stages and the size of the enclosure of reference spectrometer limit theweight and physical size of detectors to be calibrated. Detector packages are limitedwith size and weight of 150 mm by 150 mm and 5 kg.
0,00
0,50
1,00
1,50
2,00
2,50
200 400 600 800 1000 1200 1400 1600 1800
Expa
nded
unc
erta
inty
(%)
Wavelength (nm)
Quality Manual for SpectralResponsivity Calibrations
Page 16 (21)
Version: 1.3 Date: December 13, 2018 Last edited by: FM
8. Accommodation and environmental conditions
The conditions of the environment are explained in the Quality Manual of ReferenceSpectrometer Laboratory.

Quality Manual for SpectralResponsivity Calibrations
Page 17 (21)
Version: 1.3 Date: December 13, 2018 Last edited by: FM
9. Field calibrations
Not applicable.

Quality Manual for SpectralResponsivity Calibrations
Page 18 (21)
Version: 1.3 Date: December 13, 2018 Last edited by: FM
10. Control data
The measurement data coming from calibrations or development of equipment is ar-chived. The measurement notes (date, set up, raw data) are written down and the ana-lysed measurement data is stored in chronological order. The related computer datafiles are also stored in the shelves of the responsible persons. The records are arrangedin the following manner:
· Regular measurement records are kept in folders under the title of the spectral re-gion (UV, VIS, NIR) in which the measurements are done. International comparisonrecords are kept in files and disks.
· Calibration records are kept in files and disks under the title of ‘’Spectral responsivitycalibrations and certificates’’.
Maintenance records of the equipment are written in a chronological order to a note-book labelled “Calibrations and measurements with reference spectrometer” and it iskept in the Reference spectrometer laboratory.

Quality Manual for SpectralResponsivity Calibrations
Page 19 (21)
Version: 1.3 Date: December 13, 2018 Last edited by: FM
11. Certificates
Calibration certificates are handled according to publication in Annex C of quality sys-tem.*** In brief, each calibration has a certificate with a unique running number as in thefollowing pattern; T-R 1, T-R 2, T-R 3, etc. It includes the method of calibration, tracea-bility, uncertainty, measurements, and results. The calibration certificates are stored atthe archive of the Metrology Research Institute.
*** Instructions on writing calibration certificates, MRI document.
Quality Manual for SpectralResponsivity Calibrations
Page 20 (21)
Version: 1.3 Date: December 13, 2018 Last edited by: FM
12. Intercomparisons
CCPR-K2.a International comparison of spectral responsivity in the wavelength region900 nm to 1600 nm
The measurements for this key comparison were carried out by HUT in 1999. Theresults indicate a good agreement for HUT within uncertainties.
CCPR-K2.b International comparison of spectral responsivity in the visible region
The key comparison is on spectral responsivity measurements of trap detectorsand photodiodes in the wavelength region from 300 nm to 1000 nm. The meas-urements for this comparison were carried out by HUT in 2000. The results indi-cate a good agreement for HUT within uncertainties [†††].
CCPR K2.c key comparison of spectral power responsivity of detectors in the ultravioletspectral range from 200 nm to 400 nm
The measurements for this comparison were carried out by HUT in 2005 [Certif-icate of Calibration T-R 383]. The results indicate a good agreement for HUTwithin uncertainties [7].
[†††] R Goebel and M Stock, “Report on the comparison CCPR-K2.b of spectral responsivity measure-ments in the range 300 nm to 1000 nm,” Metrologia 41 (2004).
Quality Manual for SpectralResponsivity Calibrations
Page 21 (21)
Version: 1.3 Date: December 13, 2018 Last edited by: FM
13. Publications
1. P. Kärhä, Trap detectors and their applications in the realisation of spectral respon-sivity, luminous intensity, and spectral irradiance, Thesis for the degree of Doctor ofTechnology, (Helsinki University of Technology, Metrology Research Institute, Es-poo, Finland 1997) 92 p.
2. F. Manoocheri, Operating Instructions for Reference Spectrometer, ’’a short noteon steps to be taken for spectral transmittance measurements’’, Quality Manual ofMetrology Research Institute, (1994).
3. T. Kübarsepp, A. Haapalinna, P. Kärhä, and E. Ikonen, “Nonlinearity measurementsof silicon photodetectors,” Appl. Opt. 37, 2716-2722 (1998).
4. K. D. Stock, R. Heine, and H. Hofer “Influence of inhomogeneity of NIR-photodiodeson calibrations at 1047 nm,” Metrologia 28, 207-210 (1991)
5. F. Manoochehri, “High-Accuracy Spectrometer for Applications in Photometry andRadiometry”, Doctors thesis, Helsinki University of Technology, 115 p. (1998).
6. R Goebel and M Stock, “Report on the comparison CCPR-K2.b of spectral responsiv-ity measurements in the range 300 nm to 1000 nm,” Metrologia 41 (2004)
7. Lutz Werner, “Final report on the key comparison CCPR-K2.c-2003: Spectral respon-sivity in the range of 200 nm to 400 nm,” Metrologia, 51 (2014)
Other related publications
8. F. Manoocheri, P. Kärhä, L. Palva, P. Toivanen, A. Haapalinna and E. Ikonen, “Char-acterization of optical detectors using high-accuracy instruments”, Analytica Chim-ica Acta 380, pp. 327-337(1999).
9. Instruction Manual for Modelling Trap Detectors, MRI Publication.