Embed Size (px)
Citation preview

Metro State of Safety Report Appendix to the Regional Transportation Safety Strategy
A compilation of information on roadway-related crashes, injuries, and fatalities
in the greater Portland region and beyond, 2011-2015 crash data
January 2018

Metro State of Safety 2018 Report
i
Executive Summary No death or life changing injury from a traffic crash is acceptable on our region’s roadways, which is why
Metro and regional partners are adopting a Vision Zero target for 2035 and implementing a safe systems
approach to transportation safety.
The information in this State of Safety Report was used to inform the development of the 2018 Regional
Transportation Safety Strategy and to develop performance measures to meet federal requirements
required in the federal transportation bill MAP-21.
Between 2011 and 2015, there were 304 Fatal crashes in the Portland Metro region, killing 311 people,
and an additional 2,102 crashes resulting in incapacitating injury. Nationwide, crashes killed an average
of 33,305 people per year between 2011 and 2015, and roadway safety remains one of the most
pressing health issues nationwide. The 8% increase in traffic deaths in 2015 is the highest increase in
fifty years, and it is expected that the number of Serious crashes in 2016 and 2017 will be even higher.
For young people between the ages of 5 and 24, motor vehicle crashes are the leading cause of death.
It is the Portland Metro region’s adopted goal to progressively reduce the number of people killed or
seriously injured on the region’s roadways to zero by 2035. The purpose of this report is to document
roadway crash data, patterns, and trends in the Portland Metro area and beyond to inform the pursuit
of this goal. The Oregon Department of Transportation (ODOT) has assembled and distributed
statewide crash data since 2007. This is a rich dataset, including numerous information fields for each
geocoded crash, and is complemented by Metro’s rich datasets of transportation infrastructure,
transportation operations, and spatial data. The combination of these provides the opportunity of
detailed analyses of the safety of the region’s transportation system and land use patterns. Further, a
large amount of US and international data is available to document national and international patterns
and trends. This information is important to provide context for local data.
In 2010-2011, Metro staff worked with staff from cities and counties of the Metro region, ODOT, TriMet,
and other local safety experts to develop a strategy for analyzing and summarizing this data from 2007
to 2009. The 2012 State of Safety report was the result of this collaboration. This report updates these
findings, using the most recent five years of crash data – through 2015. It identifies trends and
relationships of Serious crashes with environmental factors including roadway characteristics. This
report provides the data for the update of the 2018 Regional Transportation Safety Action Plan.
The findings include:
Nationally and in Oregon, fatalities have stabilized for automobile occupants and motorcyclists,
while fatalities have been increasing for pedestrians and bicyclists. (Section 1)
Higher levels of vehicle miles travelled (VMT) correlate with more Fatal and Serious crashes due
to increased exposure. (Section 1)
The Portland Metro region has less than half the annual fatalities per million residents compared
to Oregon’s and the national average. (Section 1)

Metro State of Safety 2018 Report
ii
Arterial roadways comprise 73% of the region’s Serious crashes, 77% of the Serious Pedestrian
crashes, and 65% of the Serious Bicyclist crashes, while accounting for 12% of road miles.
(Sections 2, 5, and 6)
Alcohol or drugs were a factor in 57% of Fatal crashes. (Section 2)
Excessive speed is a contributing factor in 33% of Fatal crashes, and aggressive driving is a factor
in 34% of Fatal crashes. (Section 2)
Seat belt use in the region as reported exceeds 99%. (Section 2)
The percent of Serious crashes for male drivers age 70-79 and female drivers age 80-84 is double
the regional average. (Section 2)
Streets with more lanes have higher Serious crash rates per road mile and per VMT. This follows
trends documented in AASHTO’s Highway Safety Manual. (Section 3)
Streets with more lanes have an especially high Serious crash rate for pedestrians, producing
higher crash rates per mile and per VMT as compared to other modes. (Section 5)
The most common Serious crash types were Turning and Rear End. For Fatal crashes, the most
common types were Pedestrian and Fixed Object. (Section 3)
Serious Pedestrian crashes are disproportionately represented after dark. While 39% of all
Serious crashes happen at night, 64% of Serious Pedestrian crashes happen at night. (Section 5)

Metro State of Safety 2018 Report
iii
Table of Contents Executive Summary ........................................................................................................................................ i Introduction .................................................................................................................................................. 1 Definitions ..................................................................................................................................................... 3 Section 1 – Regional, State, National, and International Trends .................................................................. 4
Travel and Fatality Patterns: US and Oregon ............................................................................................ 4 Fatality Patterns by Mode: US and Oregon .............................................................................................. 5 Annual Vehicle-Miles Traveled (VMT) ...................................................................................................... 6 State-by-State Fatality Trends .................................................................................................................. 7 European Data .......................................................................................................................................... 7 Urban Region Fatality Trends.................................................................................................................... 9 US City Data ............................................................................................................................................ 10
Section 2 – All Crashes ................................................................................................................................ 12 Crashes By Year ....................................................................................................................................... 12 Metro crash rates compared to other places ......................................................................................... 13 By Sub-Region ......................................................................................................................................... 14 By City ..................................................................................................................................................... 15 By Roadway Classification ....................................................................................................................... 17 By Mode .................................................................................................................................................. 19 By Month................................................................................................................................................. 20 By Time of Day ........................................................................................................................................ 21 By Crash Type .......................................................................................................................................... 23 By Contributing Factor ............................................................................................................................ 24 By Driver’s Age and Gender .................................................................................................................... 25 Seat Belt Use ........................................................................................................................................... 26
Section 3 – Roadway Characteristics of Non-Freeway Crashes .................................................................. 27 By Roadway Classification ....................................................................................................................... 27 By Number of Lanes ................................................................................................................................ 29 By Crash Type .......................................................................................................................................... 31 By Contributing Factor ............................................................................................................................ 32 By Contributing Factor ............................................................................................................................ 32 By Volume-to-Capacity Ratio .................................................................................................................. 33
Section 4 – Roadway Characteristics of Freeway Crashes .......................................................................... 34 By Number of Lanes ................................................................................................................................ 34 By Crash Type .......................................................................................................................................... 36 By Contributing Factor ............................................................................................................................ 37 By Volume-to-Capacity Ratio .................................................................................................................. 38
Section 5 – Pedestrians (Non-Freeway Crashes) ........................................................................................ 39 By Year .................................................................................................................................................... 39 By Sub-Region ......................................................................................................................................... 40 By City ..................................................................................................................................................... 41 By Month................................................................................................................................................. 43 By Time of Day ........................................................................................................................................ 44 By Weather ............................................................................................................................................. 45 By Road Surface Condition ...................................................................................................................... 45 By Lighting ............................................................................................................................................... 45 By Roadway Classification ....................................................................................................................... 46 By Number of Lanes ................................................................................................................................ 47 By Contributing Factor ............................................................................................................................ 48

Metro State of Safety 2018 Report
iv
By Pedestrian’s Age and Gender ............................................................................................................. 49 Section 6 – Bicyclists (Non-Freeway Crashes) ............................................................................................. 50
By Year .................................................................................................................................................... 50 By Sub-Region ......................................................................................................................................... 51 By City ..................................................................................................................................................... 52 By Month................................................................................................................................................. 54 By Time of Day ........................................................................................................................................ 55 By Weather ............................................................................................................................................. 56 By Lighting ............................................................................................................................................... 56 By Roadway Classification ....................................................................................................................... 57 By Number of Lanes ................................................................................................................................ 58 By Contributing Factor ............................................................................................................................ 59 By Bicyclist’s Age and Gender ................................................................................................................. 60
Section 7 – Crash Type Detail ...................................................................................................................... 61 Crash Severity ......................................................................................................................................... 61 Contributing Factors ............................................................................................................................... 62 All Crash Types ........................................................................................................................................ 63 Rear End Crashes .................................................................................................................................... 65 Turning Crashes....................................................................................................................................... 67 Fixed Object Crashes ............................................................................................................................... 69 Pedestrian Crashes .................................................................................................................................. 71 Crash Factor Matrix ................................................................................................................................. 74

Metro State of Safety 2018 Report
1
Introduction It is the Portland Metro region’s adopted goal to progressively reduce the number of people killed or
seriously injured on the region’s roadways to zero by 2035. Part of a safe systems approach to
transportation safety is to use a ‘data-driven’ approach identify what causes crashes and strategies and
actions to address those causes.
The purpose of this report is to document roadway crash data, patterns, and trends in the Portland
Metro area and beyond to inform the pursuit of this goal. The Oregon Department of Transportation
(ODOT) has assembled and distributed statewide crash data since 2007. This is a rich dataset, including
numerous information fields for each geocoded crash, and is complemented by Metro’s rich datasets of
transportation infrastructure, transportation operations, and spatial data. The combination of these
provides the opportunity of detailed analyses of the safety of the region’s transportation system and
land use patterns.
Further, a large amount of US and international data is available to document national and international
patterns and trends. This information is important to provide context for local data.
Methodology
In this report, crashes are broken down by a number of factors contained in the dataset provided by
ODOT.
Injury Type: Each crash is identified by the worst injury incurred in the crash: Fatal, Injury A
(incapacitating), Injury B (moderate), Injury C (minor) or Property Damage Only (PDO). This
report largely focuses on Fatal/Incapacitating crashes (the sum of Fatal and Injury A), referred to
as ‘Serious Crashes’ throughout this report. These are the types of crashes that the region is
primarily focused on eliminating.
Location
Date and Time
Weather and Pavement Conditions
Roadway Location: the location on the roadway system allows data from Metro’s mapping
databases to be attributed to the crash.
Contributing Factors: These include speeding, alcohol, drugs, school zone, work zone, and hit
and run.
ODOT’s crash data is reliant on crash information collected by police. Quality of crash data is dependent
upon thoroughness of information collected at the crash scene. ODOT checks the data for quality and
geo-codes the data to the street network. This process results in Metro acquiring the crash data one to
one and half years later.

Metro State of Safety 2018 Report
2
Metro’s mapping database includes:
Roadway data, such as speed, geometry, traffic volumes, traffic congestion, transit routes,
bicycle routes, and sidewalk inventory
Spatial data, such as land use, population, density, socioeconomic factors, and walkability
Note that many figures in this document are in color, and while colors are generally selected to be
legible when printed in black and white, they are most readable in full color.

Metro State of Safety 2018 Report
3
Definitions
Terms that are used throughout this report are defined as follows:
“Portland Metro region” is the scope of this study, and is defined as the area within the Metropolitan
Planning Area (MPA) as of December 31, 2016. The MPA is slightly larger than the Urban
Growth Boundary (UGB).
“Serious Crashes” in this report refers to the total number of Fatal and Injury A crashes. The words
“Serious” and “Fatal” are capitalized throughout the report for emphasis.
“Injury A” and “Incapacitating injury” are used interchangeably. Incapacitating injuries typically are
injuries that the victim is not able to walk away from. They are synonymous with the term
“Severe injury”
“Injury B” and “Moderate injury” are used interchangeably.
“Injury C” and “Minor injury” are used interchangeably.
Per capita is used to describe crash rate per population. Except where otherwise noted, crash rates are
per million residents.
Per VMT is used to describe crash rate per vehicle miles. Except where otherwise noted, crash rates are
per 100-million vehicle miles travelled.
Arterial is a functional classification for surface streets. AASHTO defines arterials from the motor
vehicle perspective as providing a high degree of mobility for the longer trip lengths and high
volumes of traffic, ideally providing a high operating speed and level of service and avoiding
penetrating identifiable neighborhoods.
Collector is a functional classification for surface streets. AASHTO defines collectors as providing both
land access and traffic circulation within neighborhoods and commercial and industrial areas.
The role of the collector system, from the motor vehicle perspective, is to distribute traffic to
and from the arterial system.
Local is a functional classification for surface streets that includes all public surface streets not defined
as arterial or collector. Local streets are typically low-speed streets with low traffic volumes in
residential areas, but also include similar streets in commercial and industrial areas.

Metro State of Safety 2018 Report Section 1 – Regional, State, National, and International Trends
4
Section 1 – Regional, State, National, and International Trends Data from the National Highway Traffic Safety Administration (NHTSA) were compiled and analyzed
along with population data from the US Census to identify trends in national, state, regional and city
crashes. NHTSA summarizes traffic fatality data by state and by major city, including number of
fatalities, fatalities per capita and per vehicle-miles travelled (VMT), and by travel mode. Five years of
data between 2011 and 2015 were generally considered for this analysis, while longer term trends were
identified where additional earlier years of data were available.
Travel and Fatality Patterns: US and Oregon
Travel patterns in the US have changed in the last decade due to a variety of external factors. While the
population has continued to increase, VMT per capita and absolute VMT have declined. Roadway
fatality rates declined after 2005, but have increased significantly since 2010. In Oregon, these trends
have been consistent with national patterns, although fatalities in Oregon increased more dramatically
since 2013. This rapid increase does not appear to be a statistical outlier as the trend has continued in
2016 and 2017 (official data is not yet available for 2016-17). Figures 1-1 and 1-2 show the national and
state trends of population, VMT, and crash-related fatalities.
Figure 1-1
Figure 1-2
It is common practice to normalize roadway fatality rates by both population and traffic volumes.
Normalization by population is useful in measuring the overall safety of the roadway system.
Normalization by traffic volumes is useful in measuring the safety per distance travelled. Figures 1-3 and
1-4 show national and state trends for fatalities and fatality rates.
60%
80%
100%
120%
140%
1994 95 96 97 98 99 2000 01 02 03 04 05 06 07 08 09 10 11 12 13 14 15
National Trends: Population, VMT, and Roadway FatalitiesRelative to 2015
Fatals
VMT per capita
VMT
Population
2015:35,092 Roadway Fatals9,662 VMT per capita3.1 Trillion VMT321 Million Population
60%
80%
100%
120%
140%
1994 95 96 97 98 99 2000 01 02 03 04 05 06 07 08 09 10 11 12 13 14 15
Oregon Trends: Population, VMT, and Roadway FatalitiesRelative to 2015
Fatals
VMT per capita
VMT
Population
2015:447 Roadway Fatals8,947 VMT per capita36 Billion VMT4 Million Population

Metro State of Safety 2018 Report Section 1 – Regional, State, National, and International Trends
5
Figure 1-3
Figure 1-4
Total fatalities, fatalities per capita, and fatalities per VMT are all generally decreasing over time,
although there has been a notable uptick since 2010. The increases in Oregon since 2013 are more
pronounced than national trends.
Fatality Patterns by Mode: US and Oregon
The NHTSA data are broken out by mode: automobile occupants, motorcyclists, bicyclists, and
pedestrians. Figures 1-5 and 1-6 show the recent national and state trends for each mode.
Figure 1-5
Figure 1-6
Fatalities have recently stabilized nationally for automobile occupants and motorcyclists, while Fatalities
have been increasing nationally for pedestrians and bicyclists. The decrease in Fatalities for people in
automobiles is likely due to advancements in vehicle technology, such as air bags.
80%
100%
120%
140%
160%
1994 95 96 97 98 99 2000 01 02 03 04 05 06 07 08 09 10 11 12 13 14 15
National Trends: Normalized Fatalities Relative to 2015
Fatals
Fatals perPopulation
Fatals perVMT
2015:35,092 Roadway Fatals109 Fatals per 1M Residents1.13 Fatals per 100M VMT
60%
80%
100%
120%
140%
160%
180%
1994 95 96 97 98 99 2000 01 02 03 04 05 06 07 08 09 10 11 12 13 14 15
Oregon Trends: Fatalities Relative to Other FactorsRelative to 2015
Fatals
Fatals perPopulation
Fatals perVMT
2015:447 Roadway Fatals111 Fatals per 1M Residents1.24 Fatals per 100M VMT
40%
60%
80%
100%
120%
140%
160%
2000 01 02 03 04 05 06 07 08 09 10 11 12 13 14 15
National Trends: Fatalities By ModeRelative to 2015
Auto Fatals
Bike Fatals
Ped Fatals
MotorcycleFatals
2015:23,624 Auto occupants killed818 Bicyclists killed5,376 Pedestrians killed4,976 Motorcyclists killed
60%
80%
100%
120%
140%
160%
180%
200%
220%
240%
02 03 04 05 06 07 08 09 10 11 12 13 14 15
Oregon Trends: Fatalities By Mode3-year averages, Relative to 2013-15 3-year average*
*3-year average used to address year-to-year data volatility
Auto Fatals
Bike Fatals
Ped Fatals
MotorcycleFatals
2015:304 Auto occupants killed8 Bicyclists killed69 Pedestrians killed61 Motorcyclists killed

Metro State of Safety 2018 Report Section 1 – Regional, State, National, and International Trends
6
Annual Vehicle-Miles Traveled (VMT)
One of the clearest trends in crash data nationally and locally, is the correlation between fatality rates
and annual per capita VMT. Figure 1-7 shows the relationship by US state for all fatalities, and Figure 1-
8 shows the relationship for pedestrian or bicyclist fatalities.
States with higher per capita VMT typically also have higher per capita fatality rates, as the typical
exposure to risk is increased. A polynomial equation with a good R-squared value can be fitted to the
relationship between roadway fatalities and VMT, and is shown in Figure 1-7.
All Fatalities
It is apparent from the data that
states with more auto travel
typically exhibit higher fatality
rates. The District of Columbia
has the lowest per capita VMT at
5,480, and exhibits the lowest
annual fatality rate of 33 per
million residents – less than one-
third of the national average. Of
the states, Massachusetts has the
lowest fatality rate, with the 7th
lowest per capita VMT. Wyoming,
with the highest per capita VMT
of 16,200, also has the highest annual fatality rate at 221 per million residents – more than double the
national average.
As with the 2012 State of Safety report, which looked at 2005 – 2009 data, a polynomial equation with a
good R-squared value can be generated for the VMT-fatality relationship by setting the intercept to
zero. While the equation is likely to vary slightly year-to-year, the relationship appears to be
permanent. The relationship for 2011 – 2015 data is shown in Figure 1-7.
The national average is 9,500 VMT per capita and 105 fatalities per million residents.
Oregon statistics are 8,680 VMT per capita (91% of the national average) and 90 fatalities per million
residents (86% of the national average).
Pedestrian/Bicyclist Fatalities
The relationship between statewide VMT per capita and pedestrian/bicyclist fatalities is unclear. As can
be seen in Figure 1-8, the data are scattered, and unlike the overall fatality data, no clear trend exists.
This may be due to the complex relationships at play – higher VMTs can make pedestrian/bicyclist travel
more dangerous, but discourage travel by these modes thereby reducing pedestrian/bicyclist exposure.
y = 0.7142x2 + 4.1886xR² = 0.6991
0
50
100
150
200
250
0 2 4 6 8 10 12 14 16 18
Fata
litie
s p
er
Mill
ion
re
sid
en
ts
VMT per capita (thousands)
Relationship of Fatalities and VMT per capitaFor the 50 States and DC, 2011 - 2015
Figure 1-7

Metro State of Safety 2018 Report Section 1 – Regional, State, National, and International Trends
7
The national average (2011 –
2015) is 15.3 pedestrians killed in
crashes per million residents and
2.3 bicyclists killed in crashes per
million residents.
Oregon crash statistics are 14.0
pedestrians killed per million
residents (91% of the national
average) and 2.2 cyclists killed per
million residents (94% of the
national average).
State-by-State Fatality Trends
Figure 1-9 shows the per capita fatality rate by state. Oregon is slightly better than the US average.
European Data
Data from the EU Road Federation’s publication “European Road Statistics” were compiled in order to
provide a comparison to US data. European practices are often considered as a best practice as their
transportation systems are generally safer and more efficient than US systems.
Figures 1-10 and 1-11 present European roadway fatality rates per capita and per VMT.
Of the 28 EU countries, 22 of them exhibit lower rates of roadway fatality per capita than the US
average. On a per-VMT basis, 19 of them exhibit lower fatality rates than the US average.
221209 208 204
178 177 176 175 167 164 161 154 154 150132 131 130 129 127 125 124 121 120 118 115 110 109
99 98 97 96 94 92 91 91 90 87 83 82 81 78 74 74 71 69 68 65 58 55 4933
0
50
100
150
200
250
Wyo
min
g
Mo
nta
na
Mis
siss
ipp
i
No
rth
Dak
ota
Sou
th C
aro
lina
Ala
bam
a
Okl
aho
ma
Ark
ansa
s
We
st V
irgi
nia
New
Mex
ico
Ke
ntu
cky
Lou
isia
na
Sou
th D
ako
ta
Ten
nes
see
Mis
sou
ri
No
rth
Car
olin
a
Kan
sas
Flo
rid
a
Texa
s
Ari
zon
a
Geo
rgia
De
law
are
Idah
o
Ind
ian
a
Neb
rask
a
Mai
ne
Iow
a
Nev
ada
Wis
con
sin
Pe
nn
sylv
ania
Ve
rmo
nt
Mic
hig
an
Co
lora
do
Oh
io
Vir
gin
ia
Ore
gon
Ala
ska
Uta
h
New
…
Mar
ylan
d
Cal
ifo
rnia
Illin
ois
Haw
aii
Min
nes
ota
Co
nn
ecti
cut
Was
hin
gto
n
New
Je
rse
y
New
Yo
rk
Rh
od
e Is
lan
d
Mas
sach
use
tts
Dis
tric
t o
f C
ol.
An
nu
al R
oad
Fat
alit
ies
per
1M
res
iden
ts
State-by-State Roadway Fatalities per capita, 2011-15
US Average (105)
0
1
2
3
4
5
6
7
0
5
10
15
20
25
30
0 2 4 6 8 10 12 14 16 18
Bik
e F
atal
itie
s p
er
Mill
ion
re
sid
en
ts
Pe
d F
atal
itie
s p
er
Mill
ion
re
sid
en
tsVMT per capita (thousands)
Relationship of Ped/Bike Fatalities and VMT per capitaFor the 50 States and DC, 2011 - 2015
Pedestrians
Bicyclists
Figure 1-8
Figure 1-9

Metro State of Safety 2018 Report Section 1 – Regional, State, National, and International Trends
8
European countries appear to be limiting roadway fatalities both by managing safer roadways and
developing transportation systems and development patterns which require less driving.
0
20
40
60
80
100
120SE
- S
we
de
n
UK
- U
. K.
NL
- N
eth
erl.
MT
- M
alta
DE
- G
erm
any
IE -
Irel
and
DK
- D
enm
ark
ES -
Sp
ain
FI -
Fin
lan
d
FR -
Fra
nce
IT -
Ital
y
AT
- A
ust
ria
SK -
Slo
vaki
a
EE -
Est
on
ia
LU -
Lu
xem
b.
HU
- H
un
gary
SI -
Slo
ven
ia
BE
- B
elgi
um
PT
- P
ort
uga
l
CY
- C
ypru
s
CZ
- C
zech
Rep
.
LV -
Lat
via
BG
- B
ulg
aria
LT -
Lit
hu
anu
ia
EL -
Gre
ece
PL
- P
ola
nd
RO
- R
om
ania
Ro
adw
ay F
atal
itie
s p
er
1M
re
sid
en
ts
European Union Roadway Fatalities per capita (2013)
US AverageEU-28 Average
0.00
0.50
1.00
1.50
2.00
2.50
3.00
3.50
SE -
Sw
ed
en
UK
- U
. K.
NL
- N
eth
erl.
DE
- G
erm
any
FI -
Fin
lan
d
IE -
Irel
and
FR -
Fra
nce
DK
- D
enm
ark
IT -
Ital
y
LU -
Lu
xem
b.
SI -
Slo
ven
ia
ES -
Sp
ain
AT
- A
ust
ria
BE
- B
elgi
um
MT
- M
alta
EE -
Est
on
ia
PT
- P
ort
uga
l
LT -
Lit
hu
anu
ia
CY
- C
ypru
s
CZ
- C
zech
Rep
.
EL -
Gre
ece
SK -
Slo
vaki
a
LV -
Lat
via
PL
- P
ola
nd
HU
- H
un
gary
BG
- B
ulg
aria
RO
- R
om
ania
Ro
adw
ay F
atal
itie
s p
er
10
0 M
illio
n V
MT
European Union Roadway Fatalities per 100 Million VMT (2013)
US Average
EU-28 Average
Figure 1-10
Figure 1-11

Metro State of Safety 2018 Report Section 1 – Regional, State, National, and International Trends
9
Urban Region Fatality Trends
Crash and population data was reviewed for the urban regions in the US (using Metropolitan Planning
Organization boundaries), using FHWA’s Roadway Safety Data Dashboards. A comparison was made of
the large urban regions – those with populations of over 1 million people as of the 2010 Census. Figure
1-12 shows the per capita fatality rate by urbanized region. Note that the rate is slightly overstated
since it is based on fatal crashes between 2011 and 2015 compared to a 2010 population due to the
limited availability of regional population data. Roadway fatalities per capita in the Portland Metro
region are less than 40% of the US average and less than half the State of Oregon’s average.
Fatality rates
The worst regions in the nation for overall fatality rates are concentrated in Florida and the Sun Belt,
where driving is the completely dominant mode of travel. The safest regions in the nation for overall
fatality rates are Boston, Minneapolis-St. Paul, Portland, New York, and Chicago. In general, the safest
urban regions are those that exhibit dense urban environments and higher usage of non-auto travel
modes.
141 138
119115 114
109 107 107 106 105 102 100 9995 92 91 91 90 90 89 88 87
82 7873 73 73 71 70 70 69 67 64 60 58 57 55 55 55 53 52 48
42 40 37 35
0
20
40
60
80
100
120
140
Jack
son
ville
Tam
pa
Orl
and
o
Au
stin
Mem
ph
is
San
An
ton
io
Mia
mi
W. P
alm
Be
ach
Okl
aho
ma
Cit
y
Ft. L
aud
erd
ale
Lou
isvi
lle
Nas
hvi
lle
Ho
ust
on
St. L
ou
is
Ph
oen
ix-M
esa
Sacr
amen
to
Kan
sas
Cit
y
New
Orl
ean
s
Pit
tsb
urg
h
Dal
las
Las
Veg
as
Atl
anta
Ral
eig
h
Det
roit
Cin
cin
nat
i
Los
An
gele
s
Bal
tim
ore
Ch
arlo
tte
Vir
gin
ia B
each
San
Die
go
Co
lum
bu
s
Ph
ilad
elp
hia
Den
ver
Salt
Lak
e C
ity
Was
hin
gto
n, D
C
Bu
ffal
o
Pro
vid
en
ce
San
Fra
nci
sco
New
ark
Cle
vela
nd
Seat
tle
Ch
icag
o
New
Yo
rk
Po
rtla
nd
Min
ne
apo
lis
Bo
sto
n
An
nu
al F
atal
itie
s p
er M
illio
n r
esid
ents
(20
10
Cen
sus
po
pu
lati
on
)
Roadway Fatalities by Urban Region, 2011 - 2015US Urban Regions (MPOs) >1M population US Overall
Average (105)
Median, US Urban Regions >1M (80)
Figure 1-12

Metro State of Safety 2018 Report Section 1 – Regional, State, National, and International Trends
10
US City Data
NHTSA data include counts of all fatalities and pedestrian fatalities in US cities. This information is of
special interest for this report given that the the Portland Metro region is highly urbanized and that the
adopted growth concepts call for accomodating growth by increasing urbanization.
The figures below summarize overall fatality rates and pedestrian fatality rates for the best and worst 15
cities with population above 300,000. The figures are five-year averages (2011 – 2015). Asterisks (*)
indicate that the city was also in the best or worst 15 for the 2012 State of Safety report, which looked
at 2005 – 2009 data. There is a high degree of consistency between the best and worst cities between
the two reports despite the differing analysis periods, indicating an established long-term relationship.
Overall fatality rates
The worst cities in the nation for overall fatality rates are Detroit, St. Louis, Memphis, Jacksonville, and
Kansas City MO. In general, the worst cities are in states which have higher levels of VMT per capita,
such as Michigan, Missouri, Florida, Texas, Oklahoma, and Arizona.
The safest cities in the nation in terms of
roadway fatalities per capita are Boston,
New York, Washington DC, Minneapolis,
and Seattle. In general, the safest cities
are those that exhibit dense urban
environments and higher usage of non-
auto travel modes.
As of 2014, the city of Portland ranks well
in this list, at 13th best out of the 65 cities
of population 300,000 or more. In the
prior State of Safety report, Portland
ranked 8th best.
Pedestrian fatality rates
The worst cities in the nation for
pedestrian crash fatality rates are Detroit,
Miami, St. Louis, Jacksonville, and
Phoenix. Many of the most dangerous
cities for pedestrians are in states which
have higher levels of VMT per capita.
The safest cities in the nation for
pedestrians per capita in terms of crash
fatalities are Virginia Beach, Boston,
Wichita, Seattle, and Cleveland. The city
of Portland ranks in the middle of the pack, at 43rd of the 65 cities of population 300,000 or more.
05
101520253035
404550
Det
roit
Mia
mi
St. L
ou
is
Jack
son
ville
Ph
oen
ix
Atl
anta
Dal
las
New
Orl
ean
s
Tam
pa
Alb
uq
uer
qu
e
Mem
ph
is
San
An
ton
io
Tucs
on
San
ta A
na
Bak
ers
fiel
d
Po
rtla
nd
Riv
ersi
de
Co
lum
bu
s
Lexi
ngt
on
-…
Cin
cin
nat
i
Pit
tsb
urg
h
Mes
a
Om
aha
Min
ne
apo
lis
Au
rora
Co
lora
do
Sp
rin
gs
Cle
vela
nd
Seat
tle
Wic
hit
a
Bo
sto
n
Vir
gin
ia B
each
An
nu
al P
ed
Fat
alit
ies
pe
r M
illio
n r
esi
de
nts
Pedestrian Fatalities by City, 2011 - 2015Best and Worst of US cities >300,000 population
15 best cities15 worst citiesMedian, US
cities >300,000 population
US Overall Average
* * * * * * * * * * * * * * * * **
* Indicates that this city was in the same group in the 2005 - 2009 data
0
20
40
60
80
100
120
140
160
180
Det
roit
St. L
ou
is
Mem
ph
is
Jack
son
ville
Kan
sas
Cit
y
Okl
aho
ma
Cit
y
Tam
pa
Tuls
a
Lou
isvi
lle-J
eff
.…
Mia
mi
Dal
las
New
Orl
ean
s
Ph
oen
ix
Atl
anta
Tucs
on
Oak
lan
d
An
ahei
m
Po
rtla
nd
Pit
tsb
urg
h
San
Jo
se
Vir
gin
ia B
each
Fres
no
Bal
tim
ore
Ch
icag
o
San
Fra
nci
sco
Seat
tle
Min
ne
apo
lis
Was
hin
gto
n
New
Yo
rk
Bo
sto
n
An
nu
al F
atal
itie
s p
er
Mill
ion
re
sid
en
ts
Roadway Fatalities by City, 2011 - 2015Best and Worst of US cities >300,000 population
15 best cities15 worst citiesUS Overall
Average
Median, US cities >300,000
population
* * * * * * * * * * * * * * * * * * * * ** * *
* Indicates that this city was in the same group in the 2005 - 2009 data
Figure 1-17
Figure 1-18

Metro State of Safety 2018 Report Section 1 – Regional, State, National, and International Trends
11
Discussion
In general, overall fatality rates per capita in cities are less than the national average for all areas. For
example, the city of Portland’s average annual fatality rate of 52 fatalities per million residents is much
less than the national average of 105 and the Oregon statewide average of 90. Fifteen of the 65 cities
exhibited crash fatality rates above the overall national average, with 50 exhibiting crash fatality rates
below the national average.
This is likely due to a number of factors including fewer miles driven per capita due to the proximity of
services, and the lower speeds of urban streets compared to rural highways, resulting in lower crash
severity.
In general, cities which are more urban and which have lower levels of VMT per capita show
substantially lower overall crash fatality rates. Those which have invested disproportionately in auto
infrastructure, and therefore have higher VMT per capita, exhibit higher crash fatality rates.
Regarding pedestrian fatality rates, the relationships are complex, as cities with better pedestrian
infrastructure encourage use by people walking, thereby increasing exposure. So while it may be safer
to walk a given distance, the increased walking that results may increase pedestrian exposure and thus
pedestrian crashes. Increasing walking may lead to more pedestrian fatalities because of the increased
exposure but fewer overall fatalities because of the reduced VMT.
Cities which have managed to consistently demonstrate both low overall fatality rates and low
pedestrian fatality rates include Boston, Seattle, Virginia Beach, and Minneapolis.

Metro State of Safety 2018 Report Section 2 – All Crashes
12
Section 2 – All Crashes This section summarizes all crashes occurring in the Portland Metro region. The term “Serious crashes”
refers to all Fatal or incapacitating injury (Injury A) crashes.
Crashes By Year
Year Total
Crashes
Fatal Crashes
(Fatalities) Injury A Crashes
Injury B Crashes
Injury C Crashes
All Injury Crashes
(Injuries) Serious Crashes
2011 22,591 54 (54) 455 2,487 8,404 11,400 509
2012 23,064 63 (66) 421 2,654 8,555 11,693 484
2013 22,736 66 (68) 363 2,428 7,666 10,523 429
2014 23,291 56 (57) 383 2,512 8,217 11,168 439
2015 24,716 65 (66) 480 2,655 9,881 13,081 545
METRO 116,398 304 (311) 2,102 12,736 42,723 57,865
(81,718) 2,406
Figures 2-1 and 2-2
Total reported crashes and injury crashes have increased since 2007 (Figure 2-1). Fatal and Serious
crashes have fluctuated since 2007, but have more recently been increasing (Figure 2-2). Data prior to
2011 is included where available.
7,5
58
7,7
05
8,2
77
9,8
33
11
,40
0
11
,69
3
10
,52
3
11
,16
8
13
,08
1
19
,60
3
18
,45
9
18
,19
9
20
,10
1
22
,59
1
23
,06
4
22
,73
6
23
,29
1
24
,71
6
0
5,000
10,000
15,000
20,000
25,000
2007 2008 2009 2010 2011 2012 2013 2014 2015
Nu
mb
er
of
Cra
she
s
All Crashes by yearAll Crashes in the Metro region, 2007 - 2015
All Injury
Total Crashes
64 47 57 46 54 63 66 56 65
591
742
359405
509484
429 439
545
0
100
200
300
400
500
600
700
800
2007 2008 2009 2010 2011 2012 2013 2014 2015
Nu
mb
er
of
Cra
she
s
Serious Crashes by yearFatal/Incapacitating Crashes in the Metro region, 2007 - 2015
Fatal
Serious

Metro State of Safety 2018 Report Section 2 – All Crashes
13
Metro crash rates compared to other places
2011-2015 Population
(2015) Annual VMT
(2015)
Annual Injury crashes Annual Serious crashes
per 1M residents
per 100M VMT
per 1M residents
per 100M VMT
Metro 1,603,229 10,437,000,000 7,219 111 300 4.6
2011 - 2015
Average Annual
Fatalities Population
(2015) Annual VMT
(2015)
Annual Fatality rate
per 1M residents
Fatality rate per 100M
VMT
Metro 62.2 1,603,229 10,437,000,000 39 0.60
Median, regions >1M pop*. 78 n/a
City of Portland 31.8 620,540 4,303,000,000 51 0.74
Median, cities >300,000 pop.* 72 n/a
Oregon 356 4,028,977 36,000,000,000 88 0.99
Oregon excl.
Metro region 294 2,425,748 25,562,000,000 121 1.15
US 35,092 321,418,820 3,095,373,000,000 109 1.13
UK** 2,123 64,128,226 520,600,000,000 33 0.41
EU – 28** 32,463 506,592,457 4,322,500,000,000 64 0.75 * All data for other regions and cities is 2010 - 2014
** All data for UK and EU is for year 2013
The City of Portland, the Portland Metro region, and the State of Oregon all have fatality rates below the
national average. The fatality rates in the State of Oregon when the Metro region is excluded from
consideration are higher than the national average. The United Kingdom and European Union data are
included for reference as international best practice.
Metro State of Safety 2018 Report Section 2 – All Crashes
14
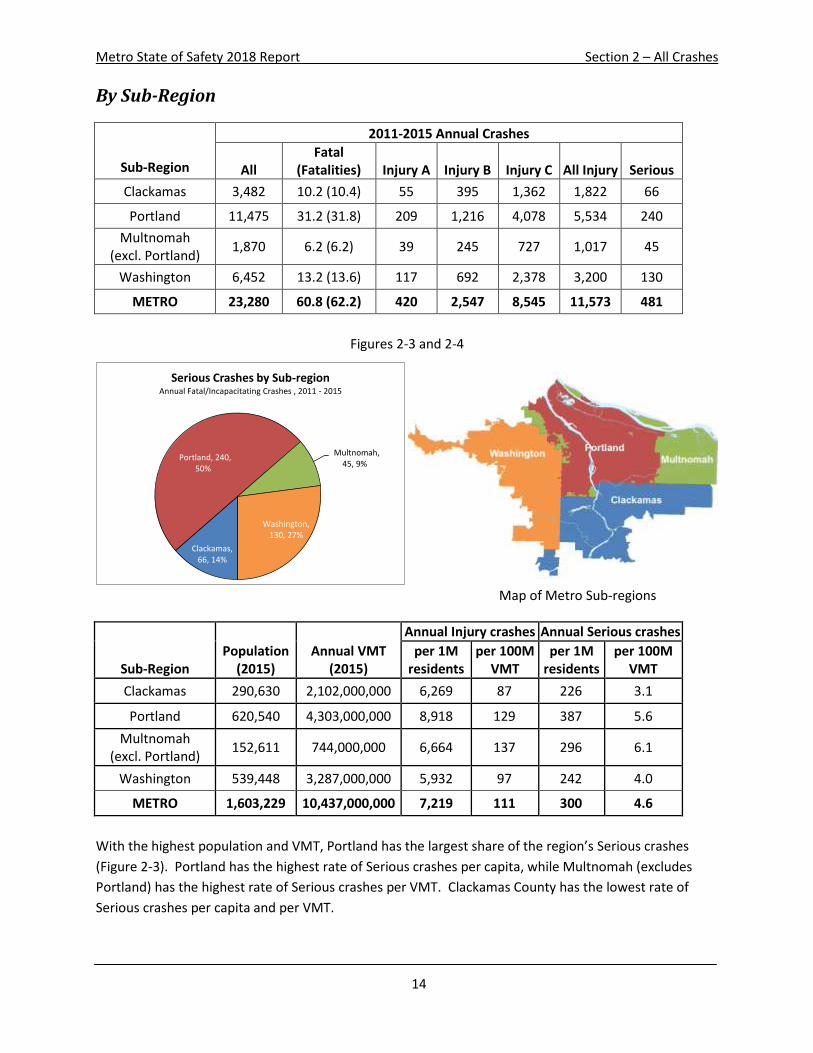
By Sub-Region
Sub-Region
2011-2015 Annual Crashes
All Fatal
(Fatalities) Injury A Injury B Injury C All Injury Serious
Clackamas 3,482 10.2 (10.4) 55 395 1,362 1,822 66
Portland 11,475 31.2 (31.8) 209 1,216 4,078 5,534 240
Multnomah (excl. Portland)
1,870 6.2 (6.2) 39 245 727 1,017 45
Washington 6,452 13.2 (13.6) 117 692 2,378 3,200 130
METRO 23,280 60.8 (62.2) 420 2,547 8,545 11,573 481
Figures 2-3 and 2-4
Sub-Region Population
(2015) Annual VMT
(2015)
Annual Injury crashes Annual Serious crashes
per 1M residents
per 100M VMT
per 1M residents
per 100M VMT
Clackamas 290,630 2,102,000,000 6,269 87 226 3.1
Portland 620,540 4,303,000,000 8,918 129 387 5.6
Multnomah (excl. Portland)
152,611 744,000,000 6,664 137 296 6.1
Washington 539,448 3,287,000,000 5,932 97 242 4.0
METRO 1,603,229 10,437,000,000 7,219 111 300 4.6
With the highest population and VMT, Portland has the largest share of the region’s Serious crashes
(Figure 2-3). Portland has the highest rate of Serious crashes per capita, while Multnomah (excludes
Portland) has the highest rate of Serious crashes per VMT. Clackamas County has the lowest rate of
Serious crashes per capita and per VMT.
Clackamas, 66, 14%
Portland, 240, 50%
Multnomah, 45, 9%
Washington, 130, 27%
Serious Crashes by Sub-regionAnnual Fatal/Incapacitating Crashes , 2011 - 2015
Map of Metro Sub-regions

Metro State of Safety 2018 Report Section 2 – All Crashes
15
By City
City
2011-2015 Annual Crashes
All Fatal Injury A Injury B Injury C All Injury Serious
Beaverton 1,987 3.0 35 179 729 946 38 Cornelius 101 0.0 4 11 37 52 4 Durham 13 0.0 0 1 6 7 0 Fairview 88 0.2 1 13 35 49 1
Forest Grove 137 0.6 5 19 45 69 5 Gladstone 136 0.4 2 16 51 70 2 Gresham 1,356 3.4 27 170 546 747 30
Happy Valley 221 1.0 3 28 91 123 4 Hillsboro 1,413 3.6 26 177 545 751 29
Johnson City 0 0.0 0 0 0 0 0 King City 9 0.0 0 1 1 2 0
Lake Oswego 282 0.0 4 29 96 130 4 Maywood Park 27 0.0 1 2 12 15 1
Milwaukie 210 0.4 5 28 77 109 5 Oregon City 588 1.8 8 62 232 304 10
Portland 11,479 31.2 209 1,216 4,079 5,536 240 Rivergrove 1 0.0 0 0 0 0 0 Sherwood 160 0.2 2 18 58 79 3
Tigard 935 1.6 12 91 353 457 13 Troutdale 167 0.8 4 22 63 89 5 Tualatin 486 0.4 7 50 199 256 7
West Linn 213 0.6 2 23 78 104 3 Wilsonville 218 0.0 2 23 76 102 2
Wood Village 67 0.2 1 7 24 32 1 Unincorp Clack 1,651 6.0 30 187 670 893 36 Unincorp Mult 155 1.6 4 29 45 81 6 Unincorp Wash 1,180 3.8 26 144 397 571 30
METRO 23,280 60.8 420 2,547 8,545 11,573 481
These two tables and the accompanying Figure 2-5 summarize crash data within the region by City and
for the unincorporated sections of each of the three counties. Crash rates were determined per capita
but not per VMT, as the VMT estimates for the smaller cities are not considered reliable enough for such
an analysis.

Metro State of Safety 2018 Report Section 2 – All Crashes
16
City
Population
(2015)
2011-2015 Annual crashes
All Injury per 1M residents
Serious per 1M residents
Beaverton 96,704 9,782 393 Cornelius 12,389 4,230 339 Durham 1,430 4,895 0 Fairview 9,357 5,194 150
Forest Grove 23,630 2,903 220 Gladstone 11,990 5,805 200 Gresham 111,716 6,683 272
Happy Valley 20,835 5,894 173 Hillsboro 100,109 7,506 292
Johnson City 588 0 0 King City 3,817 576 52
Lake Oswego 38,156 3,397 105 Maywood Park 809 19,036 1,236
Milwaukie 21,365 5,121 234 Oregon City 35,004 8,673 280
Portland 620,540 8,921 387 Rivergrove 321 623 0 Sherwood 19,012 4,134 137
Tigard 51,642 8,849 259 Troutdale 16,486 5,411 303 Tualatin 26,617 9,625 271
West Linn 26,267 3,967 107 Wilsonville 22,932 4,448 96
Wood Village 4,056 7,988 247 Unincorp Clack 113,172 7,889 320 Unincorp Mult 10,187 7,932 589 Unincorp Wash 204,098 2,796 147
METRO 1,603,229 7,219 300
Figure 2-5
0
200
400
600
Un
inco
rp M
ult
Bea
vert
on
Po
rtla
nd
Co
rnel
ius
Un
inco
rpC
lack
Tro
utd
ale
Hill
sbo
ro
Ore
gon
Cit
y
Gre
sham
Tual
atin
Tiga
rd
Milw
auki
e
Fore
st G
rove
Gla
dst
on
e
Hap
py
Val
ley
Un
inco
rpW
ash
Sher
wo
od
Wes
t Li
nn
Lake
Osw
ego
Wils
on
ville
Seri
ou
s C
rash
es p
erM
illio
n r
esid
ents
Serious Crash Rate by CityAnnual Fatal/Incapacitating Crashes per capita for cities pop. >10,000, 2011 - 2015
Unincorp Mult
Portland
Cornelius
Oregon City
MultnomahPortlandWashingtonClackamas

Metro State of Safety 2018 Report Section 2 – All Crashes
17
By Roadway Classification
Roadway Classification
2011-2015 Annual Crashes Percent
Serious All Fatal Injury A Injury B Injury C All Injury Serious
Freeway 3,688 4.4 43 301 1,454 1,802 47 1.3%
Arterial 14,463 41.8 276 1,606 5,605 7,529 318 2.2%
Collector 3,609 12.6 76 476 1,140 1,705 89 2.5%
Local 1,519 2.0 25 164 345 536 27 1.8%
METRO 23,280 60.8 420 2,547 8,545 11,573 481 2.1%
Roadway
Classification
Total Road-
Miles
Annual VMT
(2015)
Annual Crashes per Road-Mile
Annual Crashes per 100M VMT
All Injury Serious All Injury Serious
Freeway 304 4,455,000,000 5.9 0.16 40 1.1
Arterial 772 4,281,000,000 9.8 0.41 176 7.4
Collector 994 1,081,000,000 1.7 0.09 158 8.2
Local 4,565 620,000,000* 0.1 0.01 87 4.3
METRO 6,635 10,437,000,000 1.7 0.07 111 4.6 * VMT for local streets is a low-confidence estimate
Figures 2-8 and 2-9
A review of the distribution of the region’s Serious crashes by roadway classification reveals one of the
most conclusive relationships in this study. Arterial roadways are the location of the majority of the
Serious crashes in the region (Figure 2-8). A similar relationship is evident for pedestrians and cyclists,
as detailed in Sections 5 and 6. Freeways and their ramps are relatively safe, per mile travelled,
compared to arterial and collector roadways (Figure 2-9).
Figure 2-10 presents the functional classification of the region’s roadways. Blue are freeways, red are
arterial roadways, green are collectors roadwyas, and light blue are local.
Freeway, 47, 10%
Arterial, 318, 66%
Collector, 89, 18%
Local, 27, 6%
Serious Crashes by Roadway ClassAnnual Fatal/Incapacitating Crashes, 2011 - 2015
1.1
7.4
8.2
Freeway Arterial Collector
0
1
2
3
4
5
6
7
8
9
Seri
ou
s C
rash
es
pe
r 1
00
M V
MT
Serious Crash Rate by Roadway ClassFatal/Incapacitating Crashes per VMT, 2011-2015

Metro State of Safety 2018 Report Section 2 – All Crashes
18
Figure 2-10
Map of Roadway Functional Classifications

Metro State of Safety 2018 Report Section 2 – All Crashes
19
By Mode
Year
Pedestrians Bicyclists Autos Only Motorcycle Truck Involved
All Injury Serious
All Injury Serious
All Injury Serious
All Injury Serious
All Injury Serious
2011 418 65 481 32 10,502 412 312 72 250 20
2012 511 88 560 37 10,622 359 353 63 277 16
2013 428 67 485 33 9,607 327 356 76 238 11
2014 480 81 509 38 10,179 320 302 55 281 22
2015 474 81 477 35 12,129 429 339 86 320 19
METRO 2,311 382 2,512 175 53,039 1,847 1,662 352 1,366 88
Figures 2-11 and 2-12
Figure 2-13
Figure 2-11 presents the annual number of Serious crashes involving only motor vehicles (no pedestrians
or cyclists). Figure 2-12 presents the annual number of Serious crashes involving pedestrians and
cyclists. Figure 2-13 presents the annual number of Serious crashes involving motorcycles and large
trucks. Data prior to 2011 is included where available.
468
642
268319
412359
327 320
429
0
100
200
300
400
500
600
700
2007 2008 2009 2010 2011 2012 2013 2014 2015
Nu
mb
er
of
Cra
she
s
Serious Crashes - Motor Vehicles OnlyAnnual Fatal/Incapacitating Crashes, 2007 - 2015
80
57 55
67 65
88
67
81 81
43 4336
19
3237
3338 35
0
10
20
30
40
50
60
70
80
90
100
2007 2008 2009 2010 2011 2012 2013 2014 2015
Nu
mb
er
of
Cra
she
s
Serious Crashes - Pedestrians and BicyclistsAnnual Fatal/Incapacitating Crashes, 2007 - 2015
Pedestrians
Bicyclists
72
63
76
55
86
2016 11
22 19
0
10
20
30
40
50
60
70
80
90
100
2011 2012 2013 2014 2015
Nu
mb
er
of
Cra
she
s
Serious Crashes - Motorcycles and TrucksAnnual Fatal/Incapacitating Crashes, 2011 - 2015
Motorcycle
Truck Involved

Metro State of Safety 2018 Report Section 2 – All Crashes
20
By Month
Month
2011-2015 Annual Crashes
All Serious
January 1,787 39
February 1,679 36
March 1,788 36
April 1,859 33
May 1,881 38
June 1,922 43
July 1,922 44
August 1,971 47
September 1,995 45
October 2,200 39
November 2,102 41
December 2,173 41
12 MONTHS 23,280 481
Figure 2-14
Figure 2-14 presents the annual average number of Serious crashes by month. No clear trend is evident.
3936 36
3338
43 4447 45
39 41 41
0
5
10
15
20
25
30
35
40
45
50
An
nu
al S
eri
ou
s C
rash
es
Serious Crashes by MonthAnnual Fatal/Incapacitating Crashes , 2011 - 2015

Metro State of Safety 2018 Report Section 2 – All Crashes
21
By Time of Day Figure 2-15
Serious Crashes by Day of Week and Hour Annual Fatal/Incapacitating Crashes, 2011 - 2015
Avg Avg
Hour Sun Mon Tue Wed Thu Fri Sat Hour Wkday Wkend
12 AM 2.2 1.8 0.8 0.6 1.8 1.8 3.0
12 AM 1.4 2.6
1 AM 2.6 2.0 0.8 1.6 0.6 1.6 2.0
1 AM 1.3 2.3
2 AM 4.8 0.6 1.0 1.8 1.2 2.8 3.6
2 AM 1.5 4.2
3 AM 1.2 0.6 0.4 0.8 0.6 1.2 2.0
3 AM 0.7 1.6
4 AM 1.4 0.2 1.2 0.6 0.2 0.2 0.6
4 AM 0.5 1.0
5 AM 0.6 1.2 1.2 1.0 1.4 1.8 0.8
5 AM 1.3 0.7
6 AM 0.8 1.8 1.4 3.0 1.8 2.8 0.6
6 AM 2.2 0.7
7 AM 2.8 2.6 3.0 4.2 2.8 2.6 1.8
7 AM 3.0 2.3
8 AM 0.6 3.2 2.4 4.2 3.4 3.0 1.0
8 AM 3.2 0.8
9 AM 1.6 1.6 2.8 2.2 2.8 2.4 1.2
9 AM 2.4 1.4
10 AM 2.0 2.0 2.6 2.4 3.2 2.0 3.4
10 AM 2.4 2.7
11 AM 2.2 2.6 2.6 3.0 3.0 5.0 3.0
11 AM 3.2 2.6
12 PM 3.0 2.0 1.8 3.4 4.8 4.8 3.6
12 PM 3.4 3.3
1 PM 3.0 3.2 4.2 3.4 3.0 4.2 4.2
1 PM 3.6 3.6
2 PM 3.6 5.6 4.6 3.0 4.2 3.0 2.8
2 PM 4.1 3.2
3 PM 4.2 4.8 5.6 4.6 4.4 5.4 5.4
3 PM 5.0 4.8
4 PM 2.8 6.2 5.8 6.6 5.8 5.2 2.8
4 PM 5.9 2.8
5 PM 4.6 5.0 7.8 7.4 6.4 6.6 5.0
5 PM 6.6 4.8
6 PM 3.4 4.8 5.0 5.0 5.2 5.8 5.2
6 PM 5.2 4.3
7 PM 3.0 3.2 4.2 3.8 5.0 4.6 4.8
7 PM 4.2 3.9
8 PM 3.4 1.4 2.8 2.0 2.2 2.2 2.6
8 PM 2.1 3.0
9 PM 2.6 3.2 2.4 3.6 3.8 3.6 1.8
9 PM 3.3 2.2
10 PM 1.8 2.0 1.8 2.8 2.6 3.0 3.4
10 PM 2.4 2.6
11 PM 1.4 1.2 1.4 2.0 1.6 2.8 1.8
11 PM 1.8 1.6
Sun Mon Tue Wed Thu Fri Sat Avg
Wkday Avg
Wkend All Day 59.6 62.8 67.6 73.0 71.8 78.4 66.4
All Day 70.7 63.0
Figure 2-15 presents the rate of Serious crashes by day of the week and hour of the day using a “heat
map” format. Dark cells indicate the highest relative crash time periods; light cells indicate the lowest
relative crash time periods. The average weekday and weekend day are summarized on the right side of
the figure, while each day is summarized and compared at the bottom of the figure.
The weekday evening peak hours produce the highest number of Serious crashes, with the 5:00 – 5:59
pm hour as the worst. Late Friday night/early Saturday morning and late Saturday night/early Sunday
morning also stand out with high rates of Serious crashes.

Metro State of Safety 2018 Report Section 2 – All Crashes
22
By Weather
Weather
2011-2015 Annual Crashes
All Serious
Cloudy/Clear 17,658 384
Rain/Fog 4,462 84
Sleet/Snow 189 3
Unknown 970 10
METRO 20,947 481
The majority (80%) of Serious crashes occurred in
clear or cloudy conditions (Figure 2-16).
By Road Surface Condition
Road
Condition
2011-2015 Annual Crashes
All Serious
Dry 16,378 349
Ice/Snow 342 6
Wet 5,715 120
Unknown 844 6
METRO 20,947 481
The majority (73%) of Serious crashes occurred in dry
conditions (Figure 2-17).
By Lighting
Lighting
2011-2015 Annual Crashes
All Serious
Daylight 16,508 282
Dawn/Dusk 1,657 33
Night - Dark 892 40
Night - Lit 4,153 125
Unknown 70 1
METRO 20,947 481
The majority (59%) of Serious crashes occurred in
daylight (Figure 2-18).
Cloudy/Clear80%
Rain/Fog17%
Sleet/Snow1%
Other/ Unknown
2%
Serious Crashes by WeatherFatal/Incapacitating Crashes, 2011 - 2015
Dry73%
Ice/Snow1%
Wet25%
Unknown1%
Serious Crashes by Road SurfaceFatal/Incapacitating Crashes, 2011 - 2015
Daylight59%
Dawn/Dusk7%
Night - Dark8%
Night - Lit26%
Unknown0%
Serious Crashes by LightingFatal/Incapacitating Crashes, 2011 - 2015
Figure 2-16
Figure 2-17
Figure 2-18

Metro State of Safety 2018 Report Section 2 – All Crashes
23
By Crash Type
Collision Type
2011-2015 Annual Crashes
All Fatal Injury A Injury B Injury C All Injury Serious
Angle 2,304 4 51 388 803 1,246 55
Backing 336 0 1 6 71 79 2
Fixed Object 1,734 16 67 289 341 712 82
Head-on 151 5 13 34 44 96 18
Single Vehicle 101 3 11 43 23 79 13
Other 78 0 1 10 10 21 2
Parking 201 0 0 8 30 38 0
Pedestrian 450 21 51 214 160 447 72
Rear End 10,573 4 96 661 4,948 5,710 100
Sideswipe 2,198 1 21 136 476 635 23
Turning 5,154 6 108 758 1,638 2,510 114
METRO 23,280 61 420 2,547 8,545 11,573 481
Figures 2-19 and 2-20
Figures 2-19 and 2-20 present Serious crash types and Fatal crash types. Fatal crashes are specifically
broken out here because the distribution is substantially different. For the purpose of establishing crash
type, bicycles are considered vehicles, and so there is no separate bicycle crash type.
The most common Serious crash types were Turning and Rear End.
The most common Fatal crash types were Pedestrian and Fixed Object.
ANGLE11%
BACKING0%
FIXED OBJECT17%
HEAD-ON4%
SINGLE VEH.3%
OTHER0%PARKING
0%
PEDESTRIAN15%
REAR END21%
SIDESWIPE5%
TURNING24%
Serious Crashes by Crash TypeFatal/Incapacitating Crashes, 2011 - 2015
ANGLE7%
BACKING1%
FIXED OBJECT26%
HEAD-ON8%
SINGLE VEH.4%
OTHER1%
PARKING0%
PEDESTRIAN34%
REAR END7%
SIDESWIPE2%
TURNING10%
Fatal Crashes by Crash TypeFatal Crashes only, 2011 - 2015

Metro State of Safety 2018 Report Section 2 – All Crashes
24
By Contributing Factor
Collision Type
2011-2015 Annual Crashes (All Crashes)
All Fatal Injury A Injury B Injury C All Injury Serious
Excessive Speed 2,897 20.6 68 372 1,019 1,480 89
Following Too Close 7,806 1.4 65 486 3,660 4,212 66
Fail to Yield ROW 7,081 19.2 177 1,227 2,369 3,793 196
Improper Maneuver 4,636 16.4 79 400 1,137 1,633 96
Inattention 1,279 3.0 29 166 533 731 32
Reckless or Careless 1,086 6.8 52 234 375 668 59
Aggressive 9,663 21.2 123 771 4,198 5,114 144
Fail to Stop 8,979 1.6 73 514 4,228 4,817 75
Parking Related 136 0.0 0 4 18 22 0
Vehicle Problem 124 0.8 4 18 35 57 4
Alcohol or Drugs 1,056 34.4 60 215 265 575 94
Hit and Run 1,382 5.0 12 104 452 572 17
School Zone 66 0.2 1 13 26 39 1
Work Zone 177 0.2 5 25 69 99 5
METRO 23,280 60.8 420 2,547 8,545 11,573 481
Figures 2-21 and 2-22
Figure 2-21 presents the the percentage of crashes of Serious severity (Fatal or Injury A) with each
contributing factor. Figure 2-22 presents the the percentage of Fatal crashes with each contributing
factor. Each crash may have several contributing factors. The determination of contributing factors is
described in more detail in Section 7.
Alcohol and Drugs, Excessive Speed, Fail to Yield ROW, and Aggressive Driving are particularly common
factors. Crashes involving Alcohol and Drugs have a much higher likelihood of being Fatal than other
crashes.
18%14%
41%
20%
7%12%
30%
16%
0% 1%
20%
4% 0% 1%0%
10%20%30%40%50%60%70%80%90%
100%
Contributing Factor to Serious CrashesFatal/Incapacitating Crashes, 2011 - 2015
34%
2%
32%27%
5%11%
35%
3% 0% 1%
57%
8%0% 0%
0%10%20%30%40%50%60%70%80%90%
100%
Contributing Factor to Fatal Crashes2011 - 2015

Metro State of Safety 2018 Report Section 2 – All Crashes
25
By Driver’s Age and Gender
The age and gender of drivers involved in crashes, regardless of fault, are presented in the following
table and Figures 2-23 and 2-24.
Age Group
Total Male Drivers (2011 – 2015) Total Female Drivers (2011 – 2015)
All Crashes Serious Percent Serious All Crashes Serious
Percent Serious
14-17 3,076 17 0.6% 3,579 42 1.2%
18-21 9,572 99 1.0% 9,413 93 1.0%
22-24 7,518 91 1.2% 7,466 77 1.0%
25-29 12,431 96 0.8% 11,968 123 1.0%
30-34 11,897 114 1.0% 10,804 105 1.0%
35-39 10,343 122 1.2% 9,247 67 0.7%
40-44 10,421 63 0.6% 8,898 86 1.0%
45-49 9,218 87 0.9% 8,053 70 0.9%
50-54 9,114 77 0.8% 7,500 43 0.6%
55-59 8,248 115 1.4% 6,810 53 0.8%
60-64 6,734 66 1.0% 5,529 38 0.7%
65-69 4,589 41 0.9% 3,823 38 1.0%
70-74 2,408 48 2.0% 2,180 22 1.0%
75-79 1,428 33 2.3% 1,306 24 1.8%
80-84 820 4 0.5% 813 21 2.6%
85+ 747 10 1.3% 777 15 1.9%
Unknown 15,669 16 0.1% 11,098 14 0.1%
METRO 124,233 1,099 0.9% 109,264 931 0.9%
Figures 2-23 and 2-24
Male , 54.1%
Female, 45.9%
Driver's Gender in Serious CrashesFatal/Incapacitating Crashes, 2011 - 2015
17
99 91 96114122
63
8777
115
66
41 48 334 10
42
93
77
123105
67
86 70
43
53
38
38 2224
21 15
0
50
100
150
200
250
14
-17
18
-21
22
-24
25
-29
30
-34
35
-39
40
-44
45
-49
50
-54
55
-59
60
-64
65
-69
70
-74
75
-79
80
-84
85
+
Nu
mb
er
of
Dri
vers
Driver Age Group
Driver's Gender and Age in Serious CrashesFatal/Incapacitating Crashes, 2011 - 2015
Females
Males

Metro State of Safety 2018 Report Section 2 – All Crashes
26
Seat Belt Use
The reported use of seat belts is shown in the following tables, for all crashes, for Serious crashes only,
and for non-serious crashes.
Seat Belt Use (All crashes, 2011-2015)
Gender Seat Belt
Use No Seat
Belt Unknown % Seat
Belt Use % No Seat
Belt
Males 81,267 769 47,229 99.1% 0.9%
Females 80,854 445 34,213 99.5% 0.5%
Unknown 245 2 6,261 99.2% 0.8%
METRO 162,366 1,216 87,703 99.3% 0.7%
Seat Belt Use (Serious crashes, 2011-2015)
Gender Seat Belt
Use No Seat
Belt Unknown % Seat
Belt Use % No Seat
Belt
Males 622 79 164 88.7% 11.3%
Females 768 51 100 93.8% 6.2%
Unknown 0 0 0 - -
METRO 1,390 130 264 91.4% 8.6%
Seat Belt Use (Injury B, C, and PDO crashes, 2011-2015)
Gender Seat Belt
Use No Seat
Belt Unknown % Seat
Belt Use % No Seat
Belt
Males 80,645 690 47,065 99.2% 0.8%
Females 80,086 394 34,113 99.5% 0.5%
Unknown 245 2 6,261 99.2% 0.8%
METRO 160,976 1,086 87,439 99.3% 0.7%
Seat belt use in the region as reported exceeds 99%.
Males were 71% more likely than females to be reported without a seat belt.
Occupants without seat belts were 12 times as likely to be seriously injured or killed as occupants
wearing seat belts.

Metro State of Safety 2018 Report Section 3 –Non-Freeway Crashes
27
Section 3 – Roadway Characteristics of Non-Freeway Crashes
By Roadway Classification
Roadway Classification
Total Road-
Miles
Annual VMT
(2015)
2011-2015 Annual Crashes
All All Injury Serious
Arterial 772 4,281,000,000 14,463 7,529 318
Collector 994 1,081,000,000 3,609 1,705 89
Local 4,565 620,000,000* 1,519 536 27
METRO 6,331 5,982,000,000 19,591 9,771 434
* VMT for local streets is a low-confidence estimate
Figures 3-1 and 3-2
Roadway Classification
% crashes resulting in Annual Crashes per Road-Mile
Annual Crashes per 100M VMT
All Injury Serious All Injury Serious All Injury Serious
Arterial 52% 2.2% 9.8 0.41 176 7.4
Collector 47% 2.5% 1.7 0.09 158 8.2
Local 35% 1.8% 0.1 0.01 -- --
METRO 50% 2.2% -- -- -- --
A review of the distribution of non-freeway Serious crashes by roadway classification reveals one of the
most conclusive relationships in this report. Arterial roadways are the location of the majority of the
Serious crashes in the region. Despite making up only 12% of the region’s non-freeway road miles, they
constitute 73% of the Serious crashes (Figures 3-1 and 3-2). A similar relationship is evident for
pedestrians and cyclists, as detailed in Sections 5 and 6. In general, these roads have high traffic
volumes, high travel speeds, and are challenging to pedestrians crossing.
Arterial, 318, 73%
Collector, 89, 21%
Local, 27, 6%
Non-Freeway Serious Crashes by Roadway Class
Annual Fatal/Incapacitating Crashes, 2011 - 2015
Arterial12%
Collector16%
Local72%
Non-Freeway ClassificationPercent of the Overall System by Road Miles, 2015

Metro State of Safety 2018 Report Section 3 –Non-Freeway Crashes
28
As shown in Figure 3-3, collector streets have the highest crash rate per traffic volume, followed closely
by arterial streets. Figure 3-4 presents the functional classification of the region’s roadways. Red are
arterial roadways and green are collector roadways.
Figure 3-3
7.48.2
Arterial Collector
0
2
4
6
8
10
12
14
16
Seri
ou
s C
rash
es
pe
r 1
00
M V
MT
Serious Crash Rate by Non-Freeway ClassFatal/Incapacitating Crashes per VMT, 2011-2015
Figure 3-4
Map of Roadway Functional Classifications
Metro State of Safety 2018 Report Section 3 –Non-Freeway Crashes
29
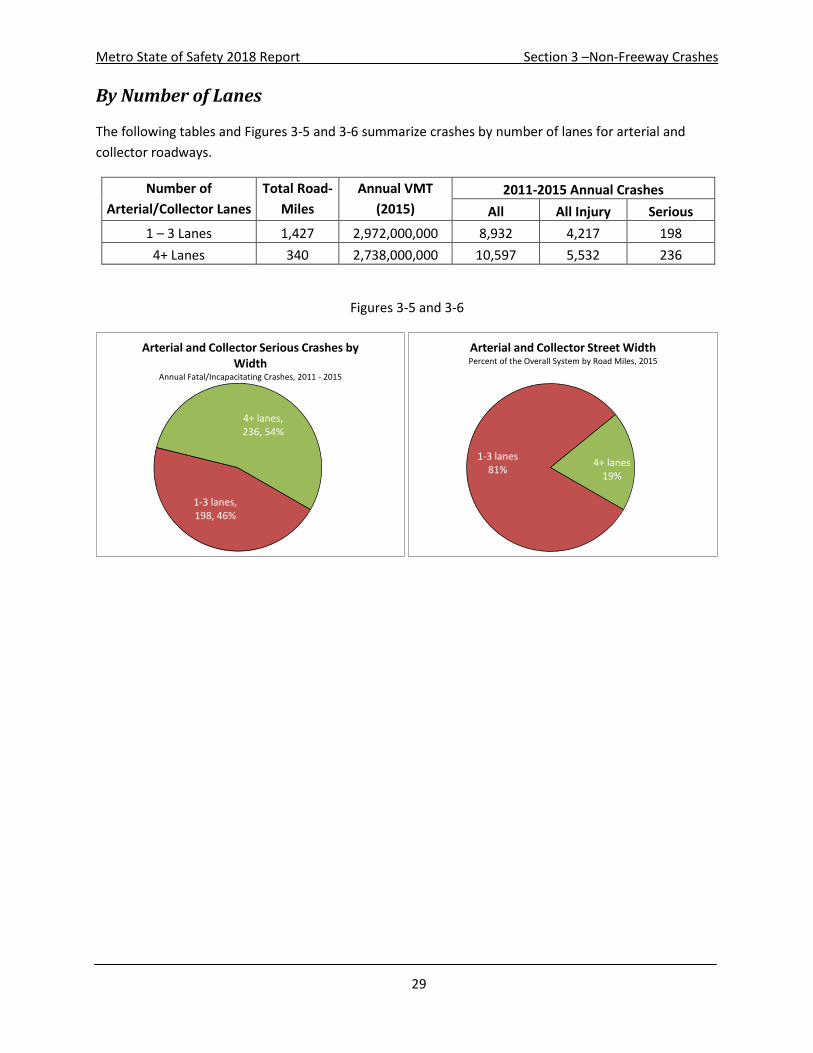
By Number of Lanes
The following tables and Figures 3-5 and 3-6 summarize crashes by number of lanes for arterial and
collector roadways.
Number of
Arterial/Collector Lanes
Total Road-
Miles
Annual VMT
(2015)
2011-2015 Annual Crashes
All All Injury Serious
1 – 3 Lanes 1,427 2,972,000,000 8,932 4,217 198
4+ Lanes 340 2,738,000,000 10,597 5,532 236
Figures 3-5 and 3-6
1-3 lanes, 198, 46%
4+ lanes, 236, 54%
Arterial and Collector Serious Crashes by Width
Annual Fatal/Incapacitating Crashes, 2011 - 2015
1-3 lanes81%
4+ lanes19%
Arterial and Collector Street WidthPercent of the Overall System by Road Miles, 2015

Metro State of Safety 2018 Report Section 3 –Non-Freeway Crashes
30
Number of Arterial/Collector
lanes
% crashes resulting in Annual Crashes per Road-Mile
Annual Crashes per 100M VMT
All Injury Serious All Injury Serious All Injury Serious
1-3 lanes 47% 2.2% 3.0 0.14 142 6.6
4+ lanes 52% 2.2% 16.3 0.69 202 8.6
ALL ARTERIALS
AND COLLECTORS 50% 2.2% 5.5 0.25 171 7.6
Figure 3-7 presents the crash rate per traffic
volume, and Figure 3-8 presents the number of
lanes for arterials and collectors in the region. The
influence of street width is consistent with the
influence of roadway classification. Wider
roadways are the location of a disproportionate
number of Serious crashes in relation to both their
share of the overall system (Figures 3-5 and 3-6)
and the vehicle-miles travelled they serve (Figure
3-7). Similar patterns are documented in
AASHTO’s Highway Safety Manual (2010), Chapter
12.
6.6
8.6
1-3 lanes 4+ lanes
0
2
4
6
8
10
12
14
16
Seri
ou
s C
rash
es
pe
r 1
00
M V
MT
Serious Crash Rate by Arterial and Collector Street Width
Fatal/Incapacitating Crashes per VMT, 2011-2015
Figure 3-7
Figure 3-8 Map of Number of Lanes for Arterials and Collectors

Metro State of Safety 2018 Report Section 3 –Non-Freeway Crashes
31
By Crash Type
Collision Type
2011-2015 Annual Crashes
All Fatal Injury A Injury B Injury C All Injury Serious
Angle 2,296 4.2 50 386 801 1,241 55
Backing 329 0.4 1 6 70 78 2
Fixed Object 1,416 14.4 57 241 263 575 71
Head-on 145 5.0 13 33 41 93 18
Single Vehicle 79 2.0 9 35 18 64 11
Other 51 0.2 1 7 7 15 1
Parking 200 0.0 0 8 30 38 0
Pedestrian 446 19.8 51 212 160 442 70
Rear End 7,912 3.6 71 467 3,753 4,294 74
Sideswipe 1,608 1.2 17 100 324 442 19
Turning 5,108 5.6 108 754 1,623 2,490 113
METRO 19,591 56.4 377 2,247 7,090 9,771 434
Figure 3-9 and 3-10
Figures 3-9 and 3-10 present non-freeway Serious crash types and non-freeway Fatal crash types. Fatal
crashes are specifically broken out here because the distribution is substantially different. For the
purpose of establishing crash type, bicycles are considered vehicles, and so there is no separate bicycle
crash type.
The most common Serious crash types were Turning and Rear End.
The most common Fatal crash types were Pedestrian and Fixed Object.
ANGLE13%
BACKING0%
FIXED OBJECT17%
HEAD-ON4%
SINGLE VEH.3%
OTHER0%
PARKING0%
PEDESTRIAN16%
REAR END17%
SIDESWIPE4%
TURNING26%
Non-Freeway Serious Crashes by TypeFatal/Incapacitating Crashes, 2011 - 2015
ANGLE7%
BACKING1%
FIXED OBJECT26%
HEAD-ON9%
SINGLE VEH.4%
OTHER0%
PARKING0%
PEDESTRIAN35%
REAR END6%
SIDESWIPE2%
TURNING10%
Non-Freeway Fatal Crashes by TypeFatal Crashes Only, 2011 - 2015

Metro State of Safety 2018 Report Section 3 –Non-Freeway Crashes
32
By Contributing Factor
Collision Type
2011-2015 Annual Crashes (Non-Freeway)
All Fatal Injury A Injury B Injury C All Injury Serious
Excessive Speed 1,982 18.8 53 276 644 991 71
Following Too Close 5,815 1.2 49 338 2,771 3,159 50
Fail to Yield ROW 7,000 18.8 176 1,219 2,344 3,758 195
Improper Maneuver 3,902 15.2 69 341 937 1,363 85
Inattention 1,071 2.4 25 144 445 617 28
Reckless or Careless 922 6.0 43 204 305 559 49
Aggressive 7,208 19.2 96 566 3,141 3,823 115
Fail to Stop 7,046 1.2 60 384 3,354 3,799 61
Parking Related 133 0.0 0 4 17 22 0
Vehicle Problem 90 0.6 3 15 28 46 3
Alcohol or Drugs 958 31.8 54 195 235 516 86
Hit and Run 1,161 5.0 11 92 374 482 16
School Zone 66 0.2 1 13 25 39 1
Work Zone 129 0.2 3 17 50 70 3
METRO 19,591 56.4 377 2,247 7,090 9,771 434
Figures 3-11 and 3-12
Figures 3-11 and 3-12 present the proportion of non-freeway crashes by contributing factor for Serious
and Fatal crashes, respectively. Alcohol or Drugs, Fail to Yield ROW, Aggressive Driving, and Excessive
Speed are the most common factors.
The determination of contributing factors is described in more detail in Section 7.
16%12%
45%
20%
6%11%
27%
14%
0% 1%
20%
4% 0% 1%0%
10%20%30%40%50%60%70%80%90%
Contributing Factor to Serious Non-Freeway Crashes
Fatal/Incapacitating Crashes, 2011 - 2015
33%
2%
33%27%
4%11%
34%
2% 0% 1%
56%
9%0% 0%
0%10%20%30%40%50%60%70%80%90%
Contributing Factor to Fatal Non-Freeway Crashes2011 - 2015
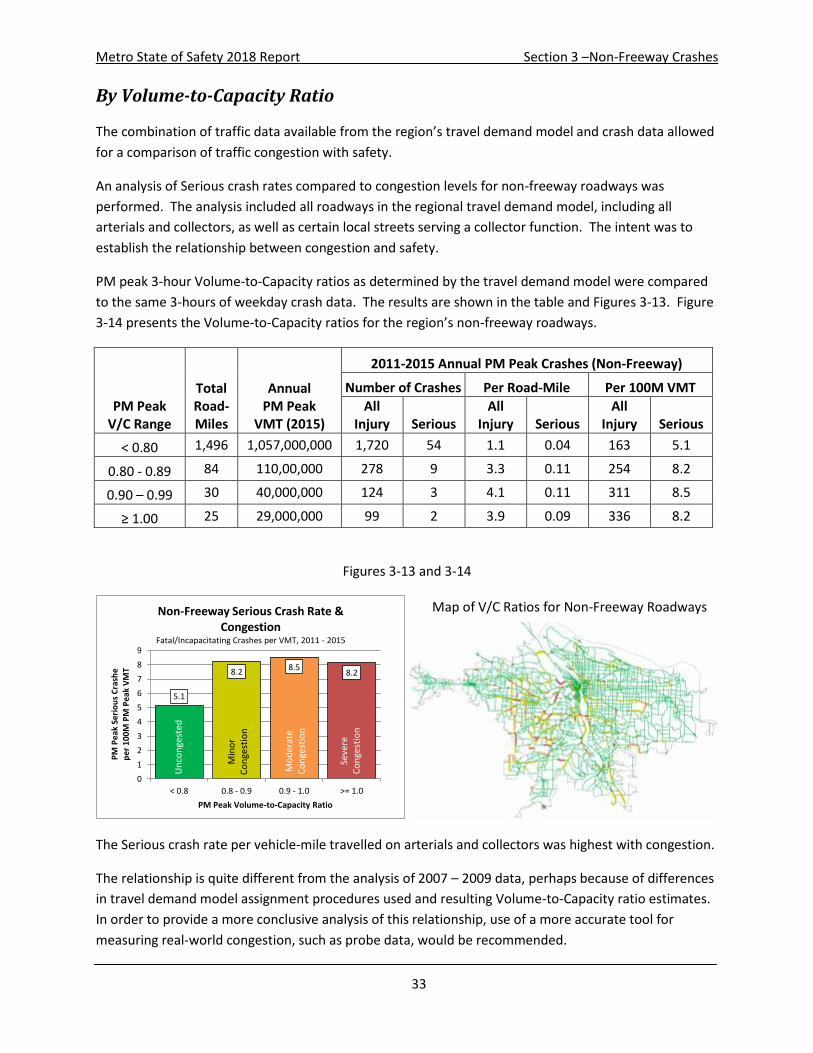
Metro State of Safety 2018 Report Section 3 –Non-Freeway Crashes
33
By Volume-to-Capacity Ratio
The combination of traffic data available from the region’s travel demand model and crash data allowed
for a comparison of traffic congestion with safety.
An analysis of Serious crash rates compared to congestion levels for non-freeway roadways was
performed. The analysis included all roadways in the regional travel demand model, including all
arterials and collectors, as well as certain local streets serving a collector function. The intent was to
establish the relationship between congestion and safety.
PM peak 3-hour Volume-to-Capacity ratios as determined by the travel demand model were compared
to the same 3-hours of weekday crash data. The results are shown in the table and Figures 3-13. Figure
3-14 presents the Volume-to-Capacity ratios for the region’s non-freeway roadways.
PM Peak V/C Range
Total Road-Miles
Annual PM Peak
VMT (2015)
2011-2015 Annual PM Peak Crashes (Non-Freeway)
Number of Crashes Per Road-Mile Per 100M VMT
All Injury Serious
All Injury Serious
All Injury Serious
< 0.80 1,496 1,057,000,000 1,720 54 1.1 0.04 163 5.1
0.80 - 0.89 84 110,00,000 278 9 3.3 0.11 254 8.2
0.90 – 0.99 30 40,000,000 124 3 4.1 0.11 311 8.5
≥ 1.00 25 29,000,000 99 2 3.9 0.09 336 8.2
Figures 3-13 and 3-14
The Serious crash rate per vehicle-mile travelled on arterials and collectors was highest with congestion.
The relationship is quite different from the analysis of 2007 – 2009 data, perhaps because of differences
in travel demand model assignment procedures used and resulting Volume-to-Capacity ratio estimates.
In order to provide a more conclusive analysis of this relationship, use of a more accurate tool for
measuring real-world congestion, such as probe data, would be recommended.
5.1
8.2 8.58.2
< 0.8 0.8 - 0.9 0.9 - 1.0 >= 1.0
0
1
2
3
4
5
6
7
8
9
PM Peak Volume-to-Capacity Ratio
PM
Pe
ak S
eri
ou
s C
rash
ep
er
10
0M
PM
Pe
ak V
MT
Non-Freeway Serious Crash Rate & Congestion
Fatal/Incapacitating Crashes per VMT, 2011 - 2015
Seve
re
Co
nge
stio
n
Mo
der
ate
Co
nge
stio
n
Min
or
Co
nge
stio
n
Un
con
gest
ed
Map of V/C Ratios for Non-Freeway Roadways

Metro State of Safety 2018 Report Section 4 –Freeway Crashes
34
Section 4 – Roadway Characteristics of Freeway Crashes
By Number of Lanes
Number of Freeway
lanes (in one direction)
Total Road-
Miles Annual VMT (2015)
2011-2015 Annual Crashes
All All Injury Serious
Freeway ramp 83 275,000,000 300 151 5
1 Lanes 10 48,000,000 68 33 1
2 Lanes 61 758,000,000 493 234 6
3 Lanes 111 2,386,000,000 1,906 923 23
4+ Lanes 40 979,000,000 909 456 12
ALL FREEWAYS 304 4,455,000,000 3,688 1,802 47
Figures 4-1 and 4-2 present the distribution of freeway crashes by number of lanes. They also present
the proportion of freeway crashes that occur on ramps.
Figure 4-1 and 4-2
Number of Freeway lanes (in one direction)
% crashes resulting in Per Road-Mile Per 100M VMT
All Injury Serious All Injury Serious All Injury Serious
Freeway ramp 50% 1.7% 1.8 0.06 55 1.8
1 Lanes 49% 1.5% 3.5 0.10 70 2.1
2 Lanes 48% 1.3% 3.9 0.11 31 0.8
3 Lanes 48% 1.2% 8.3 0.21 39 1.0
4+ Lanes 50% 1.3% 11.3 0.30 47 1.2
ALL FREEWAYS 49% 1.3% 5.9 0.16 41 1.1
RAMP, 5, 11%
1 LANE, 1, 2%
2 LANES, 6, 13%
3 LANES, 23, 48%
4+ LANES, 12, 26%
Freeway Serious Crashes by WidthAnnual Fatal/Incapacitating Crashes, 2011 - 2015
RAMP27%
1 LANE3%
2 LANES20%
3 LANES37%
4+ LANES13%
Freeway WidthPercent of the Overall System by Directional Road Miles, 2015

Metro State of Safety 2018 Report Section 4 –Freeway Crashes
35
The influence of freeway width is not as
pronounced as for non-freeway roadways.
Freeways with two directional lanes (including
auxiliary lanes) exhibit the lowest crash rates,
while the rate increases for freeways with more or
fewer lanes (Figure 4-3). Figure 4-4 presents the
number of lanes for the region’s freeways. Ramps
(off-ramps and on-ramps) exhibit a higher Serious
crash rate per mile travelled, while still
representing a relatively small proportion (11%) of
all Serious freeway crashes (Figure 4-1). Single-
lane segments are uninterrupted ramps
connecting freeways.
1.8
2.1
0.81.0
1.2
RAMP 1 LANE 2 LANES 3 LANES 4+ LANES
0.0
0.5
1.0
1.5
2.0
2.5
Seri
ou
s C
rash
es
pe
r 1
00
M V
MT
Serious Crash Rate by Freeway WidthFatal/Incapacitating Crashes per VMT, 2011 - 2015
Figure 4-4
Figure 4-3
Map of Freeways by Number of Lanes

Metro State of Safety 2018 Report Section 4 –Freeway Crashes
36
By Crash Type
Collision Type
2011-2015 Annual Crashes
All Fatal Injury A Injury B Injury C All Injury Serious
Angle 8 0.2 0 2 3 6 1
Backing 7 0.0 0 0 1 1 0
Fixed Object 318 1.4 10 48 77 136 11
Head-on 6 0.0 0 1 3 4 0
Single Vehicle 21 0.6 2 8 4 15 3
Parking 1 0.0 0 0 0 0 0
Pedestrian 4 1.0 1 2 0 4 2
Rear End 2,661 0.8 25 195 1,195 1,416 26
Sideswipe 589 0.2 4 36 152 192 4
Turning 46 0.2 0 5 15 21 1
Other 27 0 0 3 3 7 0
METRO 3,688 4.4 43 301 1,454 1,802 47
Total – Fwy Mainline 3,117 3.8 37 252 1,230 1,522 41
Total – Fwy Ramps 572 0.6 6 48 225 280 7
Figure 4-5 and 4-6
Figures 4-5 and 4-6 present freeway Serious crash types and freeway Fatal crash types. Fatal crashes are
specifically broken out here because the distribution is substantially different.
The most common Serious crash type was Rear End crashes.
The most common Fatal crash type was Fixed Object crashes.
ANGLE1%
FIXED OBJECT24%
HEAD-ON1%
SINGLE VEH.6%
PEDESTRIAN3%
REAR END55%
SIDESWIPE9%
TURNING1%
Freeway Serious Crashes by Crash TypeFatal/Incapacitating Crashes, 2011 - 2015
ANGLE4%
FIXED OBJECT32% HEAD-ON
0%
SINGLE VEH.14%
PEDESTRIAN23%
REAR END18%
SIDESWIPE4%
TURNING5%
Freeway Fatal Crashes by Crash TypeFatal Crashes Only, 2011 - 2015

Metro State of Safety 2018 Report Section 4 –Freeway Crashes
37
By Contributing Factor
Collision Type
2011-2015 Annual Crashes (Freeway)
All Fatal Injury A Injury B Injury C All Injury Serious
Excessive Speed 915 1.8 16 96 375 488 18
Following Too Close 1,991 0.2 16 148 889 1,053 16
Fail to Yield ROW 81 0.4 1 9 25 35 1
Improper Maneuver 734 1.2 10 58 200 269 11
Inattention 208 0.6 4 21 88 114 4
Reckless or Careless 164 0.8 8 30 70 109 9
Aggressive 2,456 2.0 27 205 1,057 1,291 29
Fail to Stop 1,932 0.4 13 131 874 1,018 13
Parking Related 2 0.0 0 0 0 1 0
Vehicle Problem 34 0.2 1 3 7 11 1
Alcohol or Drugs 98 2.6 6 20 31 59 8
Hit and Run 221 0.0 1 12 78 91 1
School Zone 0 0.0 0 0 0 0 0
Work Zone 48 0 2 8 19 29 2
METRO 3,688 4.4 43 301 1,454 1,802 47
Figures 4-7 and 4-8
Figures 4-7 and 4-8 present the proportion of freeway crashes by contributing factor for Serious and
Fatal crashes, respectively. Alcohol and Drugs, Aggressive Driving and Excessive Speed are the most
common factors.
The determination of contributing factors is described in more detail in Section 7.
37% 34%
3%
23%
9%
19%
61%
28%
0% 2%
18%
3% 0% 4%
0%10%20%30%40%50%60%70%80%90%
Contributing Factor to Serious Freeway Crashes
Fatal/Incapacitating Crashes, 2011 - 2015
41%
5%9%
27%
14%18%
45%
9%0%
5%
59%
0% 0% 0%0%
10%20%30%40%50%60%70%80%90%
100%
Contributing Factor to Fatal Freeway Crashes2011 - 2015

Metro State of Safety 2018 Report Section 4 –Freeway Crashes
38
By Volume-to-Capacity Ratio
The combination of traffic data available from the region’s travel demand model and crash data allowed
for a comparison of traffic congestion with safety.
An analysis of Serious crash rates compared to congestion levels for freeways was performed. The
intent was to establish the relationship between congestion and safety.
PM peak 3-hour Volume-to-Capacity ratios as determined by the travel demand model were compared
to the same 3-hours of weekday crash data. The results are shown in the table and Figures 4-9. Figure
4-10 presents the Volume-to-Capacity ratios for the region’s freeways, including ramps.
PM Peak V/C Range
Total Road-Miles
Annual PM Peak
VMT (2015)
2011-2015 Annual PM Peak Crashes (Freeway)
Number of Crashes Per Road-Mile Per 100M VMT
All Injury Serious All Injury Serious All Injury Serious
< 0.80 212 537,000,000 198 5.0 0.9 0.02 37 0.9
0.80 - 0.89 53 232,000,000 134 2.0 2.5 0.04 58 0.9
0.90 – 0.99 28 110,000,000 90 1.6 3.2 0.06 82 1.5
≥ 1.00 10 36,000,000 26 0.2 2.7 0.02 79 0.6
Figures 4-9 and 4-10
The Serious crash rate per vehicle-mile travelled on freeways increased with moderate congestion, but
dropped and was lowest with severe congestion.
The relationship is consistent with the analysis of 2007 – 2009 data, and may result from traffic at free-
flow speed encountering traffic stopped or slowed for congestion. In order to provide a more conclusive
analysis of this relationship, use of a more accurate tool for measuring real-world congestion, such as
probe data, would be recommended.
0.90.9
1.5
0.6
< 0.8 0.8 - 0.9 0.9 - 1.0 >= 1.0
0.0
0.2
0.4
0.6
0.8
1.0
1.2
1.4
1.6
PM Peak Volume-to-Capacity Ratio
PM
Pe
ak S
eri
ou
s C
rash
es
pe
r 1
00
M P
M P
eak
VM
T
Freeway Serious Crash Rate and CongestionFatal Incapacitating Crashes, 2011 - 2015
Un
con
-ge
ste
d
Min
or
Co
nge
stio
n
Mo
de
rate
C
on
gest
ion
Seve
re
Co
nge
stio
n
Map of V/C Ratios for Freeways

Metro State of Safety 2018 Report Section 5 – Pedestrians
39
Section 5 – Pedestrians (Non-Freeway Crashes)
By Year
Year
Fatal Crashes
(Fatalities) Injury A Crashes
Injury B Crashes
Injury C Crashes
All Injury Crashes Serious
2011 15 (15) 49 191 161 416 64
2012 24 (24) 62 238 184 508 86
2013 19 (20) 46 227 132 424 65
2014 22 (22) 57 238 154 471 79
2015 25 (25) 55 196 190 466 80
METRO 105 (106) 269 1,090 821 2,285 374
Figure 5-1
As presented in Figure 5-1, Serious and Fatal Pedestrian crashes increased somewhat over the 5-year
period. Pedestrian fatalities have steadily increased to 2015.
15
2419
2225
64
86
65
79 80
0
10
20
30
40
50
60
70
80
90
2011 2012 2013 2014 2015
Nu
mb
er
of
Seri
ou
s P
ed
est
rian
Cra
she
s
Serious Pedestrian Crashes by yearAnnual Fatal/Incapacitating Pedestrian Crashes, 2011 - 2015
Fatal
Serious

Metro State of Safety 2018 Report Section 5 – Pedestrians
40
By Sub-Region
Sub-Region
2011-2015 Annual Pedestrian Crashes
Fatal Injury A Injury B Injury C All Injury Serious
Clackamas 3.0 8 25 19 54 11
Portland 10.4 28 119 86 243 38
Multnomah (excl. Portland)
1.8 7 27 18 54 8
Washington 5.8 12 47 42 106 18
METRO 21.0 54 218 164 457 75
Sub-Region Population
(2015)
Annual VMT
(2015)
Annual Pedestrian Injury Crashes
Annual Serious Pedestrian Crashes
per 1M residents
per 100M VMT
per 1M residents
per 100M VMT
Clackamas 290,630 1,048,000,000 186 5.2 36 1.0
Portland 620,540 2,096,000,000 391 11.6 62 1.8
Multnomah (excl. Portland)
152,611 548,000,000 351 9.8 55 1.5
Washington 539,448 2,031,000,000 197 5.2 33 0.9
METRO 1,603,229 5,723,000,000 285 8.0 47 1.3
Figure 5-2
With the highest population, transit usage, VMT, and likely the largest number of pedestrians, Portland
has 51% of the region’s Serious Pedestrian crashes (Figure 5-2). Portland also has the highest rate of
Serious Pedestrian crashes per capita and per VMT. Multnomah (excludes Portland) also has high rates
of Serious Pedestrian crashes per capita and per VMT. Clackamas County and Washington County have
relatively low rates of Serious Pedestrian crashes, which is likely largely due to fewer people walking.
Clackamas, 11, 14%
Portland, 38, 51%
Multnomah, 8, 11%
Washington, 18, 24%
Serious Ped Crashes by Sub-regionAnnual Fatal/Incapacitating Pedestrian Crashes, 2011 - 2015

Metro State of Safety 2018 Report Section 5 – Pedestrians
41
By City
City
2011-2015 Annual Pedestrian Crashes
Fatal Injury A Injury B Injury C All Injury Serious
Beaverton 1.0 3.6 9.2 7.4 21.2 4.6 Cornelius 0.0 0.4 0.6 0.8 1.8 0.4 Durham 0.0 0.0 0.0 0.0 0.0 0.0 Fairview 0.0 0.0 1.4 0.4 1.8 0.0
Forest Grove 0.6 0.6 2.0 1.4 4.6 1.2 Gladstone 0.2 0.6 1.0 0.0 1.8 0.8 Gresham 1.6 5.6 22.6 14.4 44.2 7.2
Happy Valley 0.0 0.2 1.0 1.0 2.2 0.2 Hillsboro 2.0 2.8 13.0 13.0 30.8 4.8
Johnson City 0.0 0.0 0.0 0.0 0.0 0.0 King City 0.0 0.2 0.4 0.0 0.6 0.2
Lake Oswego 0.0 0.6 2.4 1.6 4.6 0.6 Maywood Park 0.0 0.2 0.0 0.0 0.2 0.2
Milwaukie 0.0 0.8 3.0 1.8 5.6 0.8 Oregon City 0.8 0.8 3.8 4.2 9.6 1.6
Portland 10.4 27.8 119.0 85.6 242.8 38.2 Rivergrove 0.0 0.0 0.0 0.0 0.0 0.0 Sherwood 0.2 0.0 2.0 0.8 3.0 0.2
Tigard 0.8 2.0 4.6 4.6 12.0 2.8 Troutdale 0.0 0.6 2.4 1.8 4.8 0.6 Tualatin 0.0 0.2 3.6 5.2 9.0 0.2
West Linn 0.0 0.2 1.4 0.4 2.0 0.2 Wilsonville 0.0 0.4 1.4 1.6 3.4 0.4
Wood Village 0.2 0.0 0.6 1.0 1.8 0.2 Uninc. Clackamas 2.0 4.0 11.0 8.2 25.2 6.0
Uninc. Multnomah 0.0 0.2 0.2 0.0 0.4 0.2 Uninc. Washington 1.2 2.0 11.4 9.0 23.6 3.2
METRO 21.0 53.8 218.0 164.2 457.0 74.8
While Portland has the largest number and rate of Serious Pedestrian crashes, it is apparent from Figure
5-3 that there are a number of other cities and areas with a high rate of Serious Pedestrian crashes per
capita. Gladstone, Gresham, Tigard, unincorporated Clackamas County, Forest Grove, Hillsboro,
Beaverton, and Oregon City all experience relatively high rates of Serious Pedestrian crashes.

Metro State of Safety 2018 Report Section 5 – Pedestrians
42
City
Population
(2015)
2011-2015 Annual Pedestrian Crashes
All Injury Per 1M residents
Serious per 1M residents
Beaverton 96,704 219 47.6 Cornelius 12,389 145 32.3 Durham 1,430 0 0.0 Fairview 9,357 192 0.0
Forest Grove 23,630 195 50.8 Gladstone 11,990 150 66.7 Gresham 111,716 396 64.4
Happy Valley 20,835 106 9.6 Hillsboro 100,109 308 47.9
Johnson City 588 0 0.0 King City 3,817 157 52.4
Lake Oswego 38,156 121 15.7 Maywood Park 809 247 247.2
Milwaukie 21,365 262 37.4 Oregon City 35,004 274 45.7
Portland 620,540 391 61.6 Rivergrove 321 0 0.0 Sherwood 19,012 158 10.5
Tigard 51,642 232 54.2 Troutdale 16,486 291 36.4 Tualatin 26,617 338 7.5
West Linn 26,267 76 7.6 Wilsonville 22,932 148 17.4
Wood Village 4,056 444 49.3 Uninc. Clackamas 113,172 223 53.0
Uninc. Multnomah 10,187 39 19.6 Uninc. Washington 204,098 116 15.7
METRO 1,603,229 285 46.7
Figure 5-3
0
10
20
30
40
50
60
70
Gla
dst
on
e
Gre
sham
Po
rtla
nd
Tiga
rd
Un
inco
rp C
lack
Fore
st G
rove
Hill
sbo
ro
Bea
vert
on
Ore
gon
Cit
y
Milw
auki
e
Tro
utd
ale
Co
rnel
ius
Un
inco
rp M
ult
Wils
on
ville
Lake
Osw
ego
Un
inco
rp W
ash
Sher
wo
od
Hap
py
Val
ley
Wes
t Li
nn
Tual
atin
Seri
ou
s P
ed
estr
ian
Cra
shes
per
Mill
ion
re
sid
ents
Serious Pedestrian Crash Rate by CityAnnual Fatal/Incapacitating Pedestrian Crashes per capita for cities pop. >10,000, 2011 - 2015
Gladstone
Gresham
Portland
Tigard
Clackamas
Multnomah
Portland
Washington

Metro State of Safety 2018 Report Section 5 – Pedestrians
43
By Month
Month
2011-2015 Annual Pedestrian Crashes
All Injury Serious
January 53 11.0
February 41 7.2
March 35 5.4
April 29 4.2
May 30 4.0
June 27 4.6
July 30 3.8
August 30 6.0
September 33 5.8
October 46 6.6
November 50 8.0
December 53 8.2
12 MONTHS 457 74.8
Figure 5-4
Figure 5-4 presents the annual average number of Serious crashes by month. Fall and winter months
generally have more Serious Pedestrian crashes, coinciding with the darkest months.
11.0
7.2
5.4
4.2 4.04.6
3.8
6.0 5.86.6
8.0 8.2
0
2
4
6
8
10
12
An
nu
al S
eri
ou
s C
rash
es
Serious Pedestrian Crashes by MonthAnnual Fatal/Incapacitating Pedestrian Crashes, 2011 - 2015

Metro State of Safety 2018 Report Section 5 – Pedestrians
44
By Time of Day Figure 5-5
Serious Crashes by Day of Week and Hour Annual Fatal/Incapacitating Pedestrian Crashes, 2011 - 2015
Hour
Sun
Mon
Tue
Wed
Thu
Fri
Sat
Hour
Average Wkday
Average Wkend
12 AM 0.2 0.0 0.0 0.0 0.2 0.4 0.8 12 AM 0.1 0.5
1 AM 0.6 0.0 0.2 0.0 0.0 0.0 0.0 1 AM 0.0 0.3
2 AM 1.0 0.0 0.0 0.2 0.2 0.4 0.4 2 AM 0.2 0.7
3 AM 0.2 0.2 0.2 0.0 0.0 0.2 0.2 3 AM 0.1 0.2
4 AM 0.2 0.0 0.0 0.0 0.0 0.0 0.0 4 AM 0.0 0.1
5 AM 0.0 0.4 0.0 0.6 0.4 0.0 0.2 5 AM 0.3 0.1
6 AM 0.0 0.2 0.8 0.6 0.2 0.6 0.2 6 AM 0.5 0.1
7 AM 0.2 0.0 0.2 0.4 0.2 0.2 0.0 7 AM 0.2 0.1
8 AM 0.0 1.0 0.2 0.2 0.0 0.8 0.0 8 AM 0.4 0.0
9 AM 0.6 0.0 0.2 0.2 0.4 0.2 0.2 9 AM 0.2 0.4
10 AM 0.0 0.0 0.0 0.2 0.0 0.0 0.4 10 AM 0.0 0.2
11 AM 0.2 0.4 0.2 0.4 0.6 0.8 0.4 11 AM 0.5 0.3
12 PM 0.0 0.4 0.0 0.2 0.2 0.0 0.2 12 PM 0.2 0.1
1 PM 0.0 0.2 0.4 0.4 0.2 0.4 0.4 1 PM 0.3 0.2
2 PM 0.4 0.8 0.4 0.2 0.8 0.4 0.4 2 PM 0.5 0.4
3 PM 0.4 1.2 1.2 0.6 1.2 1.2 0.8 3 PM 1.1 0.6
4 PM 0.2 0.6 0.6 1.2 0.6 0.8 0.6 4 PM 0.8 0.4
5 PM 0.6 1.0 1.6 1.0 1.0 0.6 0.0 5 PM 1.0 0.3
6 PM 0.6 0.8 1.2 1.2 1.4 1.8 1.6 6 PM 1.3 1.1
7 PM 0.8 0.2 0.8 0.8 1.8 1.2 2.2 7 PM 1.0 1.5
8 PM 0.8 0.2 1.4 0.4 0.6 0.6 0.8 8 PM 0.6 0.8
9 PM 0.8 1.0 0.4 0.4 0.8 0.6 0.6 9 PM 0.6 0.7
10 PM 0.6 0.6 0.2 0.2 1.0 0.8 0.6 10 PM 0.6 0.6
11 PM 0.2 0.0 0.4 0.2 0.6 0.6 0.4 11 PM 0.4 0.3
Sun Mon Tue Wed Thu Fri Sat Average Wkday
Average Wkend
All Day 8.6 9.2 10.6 9.6 12.4 12.6 11.4
All Day
10.9 10.0
Figure 5-5 presents the rate of Serious Pedestrian crashes by day of the week and hour of the day using
a “heat map” format. Dark cells indicate the highest relative crash time periods; light cells indicate the
lowest relative crash time periods. The average weekday and weekend day are summarized on the right
side of the figure, while each day is summarized and compared at the bottom of the figure.
The weekday late afternoon and evening peak hours produce the highest number of Serious Pedestrian
crashes. A larger proportion of evening crashes are evident as compared to all crashes. Late Friday
night/early Saturday morning and late Saturday night show somewhat high rates of Serious Pedestrian
crashes. Thursday, Friday, and Saturday have the highest rates of Serious Pedestrian crashes,
predominantly evening crashes.

Metro State of Safety 2018 Report Section 5 – Pedestrians
45
By Weather
2011-2015 Annual Pedestrian Crashes
Weather Serious Crashes
Cloudy/Clear 53.6
Rain/Fog 19.6
Sleet/Snow 0.2
Unknown 1.4
METRO 74.8
The majority (72%) of Serious Pedestrian crashes
occurred in clear or cloudy conditions (Figure 5-6),
as compared to 80% for all crashes (Figure 2-16).
By Road Surface Condition
2011-2015 Annual Pedestrian Crashes
Road Condition Serious Crashes
Dry 48.4
Ice/Snow 0.4
Wet 25.0
Unknown 1.0
METRO 74.8
The majority (65%) of Serious Pedestrian crashes
occurred in dry conditions (Figure 5-7), as
compared to 73% for all crashes (Figure 2-17).
By Lighting
2011-2015 Annual Pedestrian Crashes
Lighting Serious Crashes
Daylight 27.2
Dawn/Dusk 8.4
Night - Dark 9.6
Night - Lit 29.6
Unknown 0.0
METRO 74.8
Only 36% of Serious Pedestrian crashes
occurred in daylight (Figure 5-8), as compared
to 59% for all crashes (Figure 2-18). Serious
Pedestrian crashes are significantly more likely
after dark as compared to other modes.
Daylight36%
Dawn/Dusk11%
Night - Dark13%
Night - Lit40%
Serious Pedestrian Crashes by LightingFatal/Incapacitating Pedestrian Crashes, 2011 - 2015
Dry65%
Ice/Snow1%
Wet33%
Unknown1%
Serious Pedestrian Crashes by Road SurfaceFatal/Incapacitating Pedestrian Crashes, 2011 - 2015
Cloudy/Clear72%
Rain/Fog26%
Sleet/Snow0%
Other/ Unknown
2%
Serious Pedestrian Crashes by WeatherFatal/Incapacitating Pedestrian Crashes , 2011 - 2015
Figure 5-6
Figure 5-7
Figure 5-8

Metro State of Safety 2018 Report Section 5 – Pedestrians
46
By Roadway Classification
Roadway
Classification
Total
Road-
Miles Annual VMT
(2015)
2011-2015 Annual Pedestrian Crashes
Serious Serious per Road-Mile
Serious per 100M VMT
Arterial 772 4,281,000,000 57.6 0.075 1.35
Collector 994 1,081,000,000 12.0 0.012 1.11
Local 4,565 620,000,000* 5.2 0.001 0.84
METRO 6,331 5,982,000,000 74.8 0.012 --
* VMT for local streets is a low-confidence estimate
Figures 5-9 and 5-10
As with overall crashes, the region’s Serious Pedestrian crashes occur primarily on the arterials,
accounting for 77% of these crashes. Figure 5-9 presents the distribution of Serious Pedestrian crashes
by roadway classification. As can be seen in Figure 5-10, which presents the rate of Serious Pedestrian
crashes per mile of roadway, arterial roadways are about 6 times as likely as collectors per mile to be
the location of a Serious Pedestrian crash, and more than 65 times as likely as local streets per mile to
be the location of a Serious Pedestrian crash.
As can be seen in Figure 5-11, when normalized by
motor vehicle traffic volume, the Serious
Pedestrian crash rate on arterials is still higher
than on collectors. A reliable estimate of vehicle
miles travelled was not available for local streets.
Many transit routes follow arterial roadways,
increasing the need for people to cross these
roadways safely.
Arterial, 57.6, 77%
Collector, 12.0, 16%
Local, 5.2, 7%
Serious Pedestrian Crashes by Roadway Class
Annual Fatal/Incapacitating Pedestrian Crashes, 2011 - 2015
0.075
0.012 0.001
Arterial Collector Local
0.00
0.01
0.02
0.03
0.04
0.05
0.06
0.07
0.08
Seri
ou
s P
ed
est
rian
Cra
she
sp
er
Mile
of
Ro
ad
Serious Pedestrian Crash Rate by Roadway Class
Annual Fatal/Incapacitating crashes per road mile, 2011 - 2015
1.35
1.11
Arterial Collector
0.0
0.2
0.4
0.6
0.8
1.0
1.2
1.4
1.6
Seri
ou
s P
ed
estr
ian
Cra
shes
per
10
0M
VM
T
Serious Pedestrian Crash Rate by Roadway Class
Annual Fatal/Incapacitating crashes per VMT, 2011 - 2015
Figure 5-11

Metro State of Safety 2018 Report Section 5 – Pedestrians
47
By Number of Lanes
Number of
Lanes*
Total Road-
Miles
2011-2015 Annual Pedestrian Crashes
Serious Serious per Road-Mile
Serious per 100M VMT
1 – 3 Lanes 1,427 27.0 0.019 0.91
4+ Lanes 340 47.4 0.140 1.73
METRO 1,766 74.4 0.042 1.31
* Arterial and Collector roadways only
Figures 5-12 and 5-13
The influence of street width is consistent with the influence of roadway classification (Figure 5-12).
Wider roadways are the location of a disproportionate number of Serious Pedestrian crashes in relation
to both their share of the overall system (Figure 5-13) and the vehicle-miles travelled they serve (Figure
5-14). The Serious Pedestrian crash rate increases dramatically for roadways with 4 or more lanes. This
effect is in spite of the fact that such arterials often discourage pedestrian travel in the first place,
thereby reducing potential pedestrian exposure.
As can be seen in Figure 5-14, even when
normalized by motor vehicle traffic volume, the
Serious Pedestrian crash rate on wider roadways
is still substantially higher than on narrower roads.
Wider roadways are particularly hazardous to
pedestrians.
Many transit routes follow wider roadways,
increasing the need for people to cross these
roadways safely.
1-3 lanes, 27.0, 36%
4+ lanes, 47.4, 64%
Serious Pedestrian Crashes by Street WidthAnnual Fatal/Incapacitating Pedestrian Crashes, 2011 - 2015
0.019
0.140
1-3 lanes 4+ lanes
0.00
0.02
0.04
0.06
0.08
0.10
0.12
0.14
0.16
An
nu
al S
eri
ou
s P
ed
est
rian
Cra
she
sp
er
Mile
of
Ro
ad
Arterial/Collector Serious Ped Crash Rate by Width
Fatal/Incapac. Pedestrian Crashes per road mile, 2011 - 2015
0.91
1.73
1-3 lanes 4+ lanes
0.0
0.2
0.4
0.6
0.8
1.0
1.2
1.4
1.6
1.8
2.0
An
nu
al S
eri
ou
s P
ed
est
rian
Cra
she
sp
er
10
0M
VM
T
Arterial and Collector Serious Ped Crash Rate by Width
Fatal/Incapacitating Pedestrian Crashes per VMT, 2011 - 2015
Figure 5-14

Metro State of Safety 2018 Report Section 5 – Pedestrians
48
By Contributing Factor
Factor
2011-2015 Annual Crashes (Pedestrian)
All Fatal Injury A Injury B Injury C All Injury Serious
Excessive Speed 10 2.2 3 3 2 10 5
Following Too Close 1 0.0 0 1 0 1 0
Fail to Yield ROW 334 10.4 32 162 127 331 42
Improper Maneuver 18 1.4 1 8 6 17 3
Inattention 16 1.0 2 7 5 16 3
Reckless or Careless 16 1.4 3 8 3 16 5
Aggressive 11 2.2 3 4 2 11 5
Fail to Stop 3 0.0 0 1 2 3 0
Parking Related 1 0.0 0 0 1 1 0
Vehicle Problem 1 0.2 0 0 1 1 0
Alcohol or Drugs 53 11.0 13 20 9 53 24
Hit and Run 18 3.2 2 6 6 17 5
School Zone 6 0.2 0 3 3 6 0
Work Zone 4 0 0 2 2 4 0
METRO 461 21.0 54 218 164 457 75
Figures 5-15 and 5-16
Figures 5-15 and 5-16 present the proportion of Pedestrian crashes by contributing factor for Serious
and Fatal crashes, respectively. Alcohol or Drugs and Fail to Yield ROW are the most common factors.
The determination of contributing factors is described in more detail in Section 7.
These data do not specify whether the driver, the pedestrian, or both were at fault, but fault in
Pedestrian crashes is explored in more detail in Section 7.
7%1%
56%
4% 4% 6% 7%1% 0% 0%
33%
7%1% 0%
0%10%20%30%40%50%60%70%80%90%
Contributing Factor to Serious Pedestrian Crashes
Fatal/Incapacitating Crashes, 2011 - 2015
10%
0%
50%
7% 5% 7% 10%
0% 0% 1%
52%
15%
1% 0%0%
10%20%30%40%50%60%70%80%90%
Contributing Factor to Fatal Pedestrian Crashes2011 - 2015

Metro State of Safety 2018 Report Section 5 – Pedestrians
49
By Pedestrian’s Age and Gender
The age and gender of pedestrians involved in crashes are presented in the following table and Figures
5-17 and 5-18.
Total Male Pedestrians (2011 – 2015) Total Female Pedestrians (2011 – 2015)
Age All Serious Percent Serious All Serious
Percent Serious
≤13 117 24 20.5% 70 6 8.6%
14-17 126 29 23.0% 90 5 5.6%
18-21 113 10 8.8% 96 11 11.5%
22-24 101 17 16.8% 103 5 4.9%
25-29 154 35 22.7% 112 9 8.0%
30-34 105 18 17.1% 65 0 0.0%
35-39 59 21 35.6% 71 1 1.4%
40-44 97 16 16.5% 98 16 16.3%
45-49 110 13 11.8% 55 4 7.3%
50-54 113 21 18.6% 127 25 19.7%
55-59 73 21 28.8% 61 9 14.8%
60-64 61 16 26.2% 62 8 12.9%
65-69 33 9 27.3% 43 12 27.9%
70-74 26 6 23.1% 32 8 25.0%
75-79 23 10 43.5% 15 10 66.7%
80-84 11 2 18.2% 18 4 22.2%
85+ 10 1 10.0% 22 6 27.3%
Unknown 66 1 1.5% 61 6 9.8%
METRO 1,398 270 19.3% 1,201 145 12.1%
Figures 5-17 and 5-18
Male , 65.1%
Female, 34.9%
Pedestrian's Gender in Serious CrashesFatal/Incapacitating Crashes, 2011 - 2015
24
29
1017
35
1821
1613
21 21
169 6
10
21
65
11 5
9
116
4
25
9
8
12
8
4 6
0
5
10
15
20
25
30
35
40
45
50
≤13
14
-17
18
-21
22
-24
25
-29
30
-34
35
-39
40
-44
45
-49
50
-54
55
-59
60
-64
65
-69
70
-74
75
-79
80
-84
85
+
Nu
mb
er
of
Pe
de
stri
ans
inFa
tal/
Inca
pac
itat
ing
Cra
she
s
Pedestrian Age Group
Pedestrian's Gender and Age Group in Serious Crashes, 2011 - 2015
Females
Males

Metro State of Safety 2018 Report Section 6 – Bicyclists
50
Section 6 – Bicyclists (Non-Freeway Crashes)
By Year
Year
Fatal Crashes
(Fatalities) Injury A Crashes
Injury B Crashes
Injury C Crashes
All Injury Crashes
Serious Crashes
2011 4 (4) 28 283 166 481 32
2012 3 (3) 34 357 167 561 37
2013 0 (0) 33 320 132 485 33
2014 1 (1) 37 311 160 509 38
2015 2 (2) 33 262 181 478 35
METRO 10 (10) 165 1,533 806 2,514 175
Figure 6-1
As presented in Figure 6-1, Serious Bicyclist crashes fluctuated over the 5-year period, while Fatal
Bicyclist crashes declined. No clear trend is evident.
4 30 1 2
32
3733
3835
0
5
10
15
20
25
30
35
40
45
2011 2012 2013 2014 2015
Nu
mb
er o
f B
icyc
list
Cra
shes
Serious Bicyclist Crashes by yearAnnual Fatal/Incapacitating Bicyclist Crashes, 2011 - 2015
Fatal
Serious

Metro State of Safety 2018 Report Section 6 – Bicyclists
51
By Sub-Region
Sub-region
2011-2015 Annual Bicyclist Crashes
Fatal Injury A Injury B Injury C All Injury Serious
Clackamas 0.2 3.8 26 13 43 4.0
Portland 1.2 21.0 193 98 314 22.2
Multnomah (excl. Portland)
0.0 2.6 24 15 42 2.6
Washington 0.6 5.6 63 35 104 6.2
METRO 2.0 33.0 306 161 502 35.0
Sub-region Population
(2015) Annual VMT
(2015)
Annual Bicyclist Injury Crashes
Annual Serious Bicyclist Crashes
per 1M residents
per 100M VMT
per 1M residents
per 100M VMT
Clackamas 290,630 1,048,000,000 149 4.1 14 0.4
Portland 620,540 2,096,000,000 505 15.0 36 1.1
Multnomah (excl. Portland)
152,611 548,000,000 273 7.6 17 0.5
Washington 539,448 2,031,000,000 192 5.1 11 0.3
METRO 1,603,229 5,723,000,000 313 8.8 22 0.6
Figure 6-2
With the highest population, transit usage, VMT, and number of bicyclists, Portland has 64% of the
region’s Serious Bicyclist crashes (Figure 6-2). Portland also has the highest rate of Serious Bicyclist
crashes per capita and per VMT. Multnomah (excludes Portland), Clackamas County and Washington
County have lower rates of Serious Bicyclist crashes, which is likely partially due to fewer people cycling.
Clackamas, 4.0, 11%
Portland, 22.2, 64%
Multnomah, 2.6, 7%
Washington, 6.2, 18%
Serious Bicyclist Crashes by Sub-RegionAnnual Fatal/Incapacitating Bicyclist Crashes , 2011 -
2015

Metro State of Safety 2018 Report Section 6 – Bicyclists
52
By City
City
2011-2015 Annual Bicyclist Crashes
Fatal Injury A Injury B Injury C All Injury Serious
Beaverton 0.2 1.4 14 7 22 1.6 Cornelius 0.0 0.2 2 1 2 0.2 Durham 0.0 0.0 0 0 1 0.0 Fairview 0.0 0.0 1 0 1 0.0
Forest Grove 0.0 0.0 4 2 6 0.0 Gladstone 0.0 0.2 2 1 3 0.2 Gresham 0.0 2.0 18 12 32 2.0
Happy Valley 0.0 0.0 2 0 2 0.0 Hillsboro 0.2 1.2 15 11 28 1.4
Johnson City 0.0 0.0 0 0 0 0.0 King City 0.0 0.0 0 0 0 0.0
Lake Oswego 0.0 0.8 2 1 4 0.8 Maywood Park 0.0 0.0 0 0 0 0.0
Milwaukie 0.0 0.8 4 2 7 0.8 Oregon City 0.0 0.4 4 1 6 0.4
Portland 1.2 21.0 193 98 314 22.2 Rivergrove 0.0 0.0 0 0 0 0.0 Sherwood 0.0 0.0 1 1 2 0.0
Tigard 0.0 1.2 9 5 15 1.2 Troutdale 0.0 0.6 2 2 4 0.6 Tualatin 0.0 0.2 5 3 8 0.2
West Linn 0.0 0.0 1 0 2 0.0 Wilsonville 0.0 0.2 1 1 2 0.2
Wood Village 0.0 0.0 1 1 2 0.0 Uninc. Clackamas 0.2 1.4 9 6 16 1.6
Uninc. Multnomah 0.0 0.0 2 0 2 0.0 Uninc. Washington 0.2 1.4 13 6 20 1.6
METRO 2.0 33.0 306 161 502 35.0
While Portland has the largest number of Serious Bicyclist crashes, it is apparent from Figure 6-3 that
there are a several cities with a relatively high rate of Serious Bicyclist crashes per capita. Troutdale,
Milwaukie, and Portland all experienced relatively high rates of Serious Bicyclist crashes between 2011
and 2015.

Metro State of Safety 2018 Report Section 6 – Bicyclists
53
City Population
(2015)
2011-2015 Annual Bicyclist Crashes
All Injury per 1M residents
Serious per 1M residents
Beaverton 96,704 230 16.5 Cornelius 12,389 194 16.1 Durham 1,430 420 0.0 Fairview 9,357 150 0.0
Forest Grove 23,630 254 0.0 Gladstone 11,990 250 16.7 Gresham 111,716 285 17.9
Happy Valley 20,835 115 0.0 Hillsboro 100,109 278 14.0
Johnson City 588 0 0.0 King City 3,817 0 0.0
Lake Oswego 38,156 115 21.0 Maywood Park 809 494 0.0
Milwaukie 21,365 328 37.4 Oregon City 35,004 166 11.4
Portland 620,540 506 35.8 Rivergrove 321 0 0.0 Sherwood 19,012 116 0.0
Tigard 51,642 287 23.2 Troutdale 16,486 267 36.4 Tualatin 26,617 301 7.5
West Linn 26,267 69 0.0 Wilsonville 22,932 96 8.7
Wood Village 4,056 444 0.0 Uninc. Clackamas 113,172 145 14.1
Uninc. Multnomah 10,187 177 0.0 Uninc. Washington 204,098 98 7.8
METRO 1,603,229 313 21.8
Figure 6-3
0
10
20
30
40
50
Milw
auki
e
Tro
utd
ale
Po
rtla
nd
Tiga
rd
Lake
Osw
ego
Gre
sham
Gla
dst
on
e
Bea
vert
on
Co
rnel
ius
Un
inco
rpC
lack
Hill
sbo
ro
Ore
gon
Cit
y
Wils
on
ville
Un
inco
rpW
ash
Tual
atin
Wes
t Li
nn
Fore
st G
rove
Hap
py
Val
ley
Sher
wo
od
Un
inco
rp M
ult
Seri
ou
s B
icyc
list
Cra
shes
per
Mill
ion
res
iden
ts
Serious Bicyclist Crash Rate by CityAnnual Fatal/Incapacitating Bicyclist Crashes per capita for cities pop. >10,000, 2011 - 2015
MilwaukieTroutdalePortlandTigardLake Oswego
Clackamas
Multnomah
Portland
Washington

Metro State of Safety 2018 Report Section 6 – Bicyclists
54
By Month
Month
2011-2015 Annual Bicyclist Crashes
All Injury Serious
January 21 1.4
February 28 2.2
March 33 1.6
April 38 1.0
May 46 2.6
June 48 3.4
July 61 5.0
August 57 4.0
September 60 4.8
October 49 2.6
November 34 3.0
December 28 3.4
12 MONTHS 502 35.0
Figure 6-4
Figure 6-4 presents the annual average number of Serious Bicyclist crashes by month. May through
December generally have more Serious Bicyclist crashes, with the peak corresponding to the summer
months, likely related to the higher number of people cycling in the warm and dry months.
1.4
2.2
1.6
1.0
2.6
3.4
5.0
4.0
4.8
2.63.0
3.4
0
1
2
3
4
5
An
nu
al S
eri
ou
s C
rash
es
Serious Bicyclist Crashes by MonthAnnual Fatal/Incapacitating Bicyclist Crashes, 2011 - 2015

Metro State of Safety 2018 Report Section 6 – Bicyclists
55
By Time of Day Figure 6-5
Serious Crashes by Day of Week and Hour Annual Fatal/Incapacitating Bicyclist Crashes, 2011 - 2015
Average Average
Hour Sun Mon Tue Wed Thu Fri Sat Hour Wkday Wkend
12 AM 0.2 0.0 0.0 0.0 0.0 0.0 0.2 12 AM 0.0 0.2
1 AM 0.2 0.0 0.0 0.0 0.0 0.2 0.4 1 AM 0.0 0.3
2 AM 0.2 0.0 0.0 0.0 0.0 0.0 0.0 2 AM 0.0 0.1
3 AM 0.0 0.0 0.0 0.0 0.2 0.0 0.0 3 AM 0.0 0.0
4 AM 0.0 0.0 0.0 0.0 0.0 0.0 0.0 4 AM 0.0 0.0
5 AM 0.0 0.2 0.0 0.0 0.0 0.0 0.0 5 AM 0.0 0.0
6 AM 0.0 0.0 0.0 0.8 0.2 0.4 0.0 6 AM 0.3 0.0
7 AM 0.0 0.4 0.0 0.8 0.6 0.2 0.0 7 AM 0.4 0.0
8 AM 0.0 0.0 0.0 0.8 0.8 0.4 0.2 8 AM 0.4 0.1
9 AM 0.2 0.2 0.2 0.0 0.4 0.2 0.0 9 AM 0.2 0.1
10 AM 0.0 0.0 0.0 0.6 0.4 0.2 0.4 10 AM 0.2 0.2
11 AM 0.2 0.0 0.0 0.2 0.2 0.4 0.4 11 AM 0.2 0.3
12 PM 0.0 0.2 0.4 0.6 0.8 0.0 0.0 12 PM 0.4 0.0
1 PM 0.0 0.0 0.2 0.4 0.0 0.6 0.2 1 PM 0.2 0.1
2 PM 0.4 0.4 0.2 0.2 0.0 0.8 0.0 2 PM 0.3 0.2
3 PM 0.0 0.4 0.0 0.6 0.4 0.2 0.8 3 PM 0.3 0.4
4 PM 0.4 1.2 0.6 0.8 0.6 0.4 0.0 4 PM 0.7 0.2
5 PM 0.6 0.2 1.0 0.8 1.0 0.4 0.4 5 PM 0.7 0.5
6 PM 0.2 0.4 0.4 0.2 0.6 0.0 0.4 6 PM 0.3 0.3
7 PM 0.0 0.8 0.4 0.0 0.6 0.0 0.0 7 PM 0.4 0.0
8 PM 0.0 0.0 0.0 0.4 0.2 0.0 0.2 8 PM 0.1 0.1
9 PM 0.2 0.2 0.0 0.4 0.4 0.0 0.0 9 PM 0.2 0.1
10 PM 0.0 0.0 0.2 0.2 0.0 0.2 0.4 10 PM 0.1 0.2
11 PM 0.0 0.2 0.0 0.0 0.0 0.0 0.0 11 PM 0.0 0.0
Sun Mon Tue Wed Thu Fri Sat Average Wkday
Average Wkend
All Day 2.8 4.8 3.6 7.8 7.4 4.6 4.0 All Day 5.6 3.4
Figure 6-5 presents the rate of Serious Bicyclist crashes by day of the week and hour of the day using a
“heat map” format. Dark cells indicate the highest relative crash time periods; light cells indicate the
lowest relative crash time periods. The average weekday and weekend day are summarized on the right
side of the figure, while each day is summarized and compared at the bottom of the figure.
The weekday evening peak hours produce the highest number of Serious Bicyclist crashes, mirroring the
pattern for all crashes, with the 4:00 – 5:59 pm as the worst. Wednesday and Thursday are the two days
with the highest number of Bicyclist crashes, which is consistent with the prior report’s data from 2007 –
2009. No other clear trends are evident.

Metro State of Safety 2018 Report Section 6 – Bicyclists
56
By Weather
2011-2015 Annual Bicyclist Crashes
Weather Serious Crashes
Cloudy/Clear 30.6
Rain/Fog 3.6
Sleet/Snow 0.0
Unknown 0.8
METRO 35.0
The majority (88%) of Serious Bicyclist crashes
occurred in clear or cloudy conditions (Figure 6-6),
as compared to 80% for all crashes (Figure 2-16).
By Road Surface Condition
2011-2015 Annual Bicyclist Crashes
Road Condition Serious Crashes
Dry 29.2
Ice/Snow 0.0
Wet 5.4
Unknown 0.4
METRO 35.0
The majority (84%) of Serious Bicyclist crashes
occurred in dry conditions (Figure 6-7), as
compared to 73% for all crashes (Figure 2-17).
By Lighting
2011-2015 Annual Bicyclist Crashes
Lighting Serious Crashes
Daylight 24.4
Dawn/Dusk 2.8
Night - Dark 1.6
Night - Lit 6.2
Unknown 0.0
METRO 35.0
The majority (70%) of Serious Bicyclist
crashes occurred in daylight (Figure 6-8), as
compared to 59% for all crashes (Figure 2-
18).
Cloudy/Clear88%
Rain/Fog10% Sleet/Snow
0%
Other/ Unknown
2%
Serious BicyclistCrashes by WeatherFatal/Incapacitating Bicyclist Crashes , 2011 - 2015
Dry84%
Ice/Snow0%
Wet15%
Unknown1%
Serious Bicyclist Crashes by Road SurfaceFatal/Incapacitating Bicyclist Crashes , 2011 - 2015
Daylight70%
Dawn/Dusk8%
Night - Dark4%
Night - Lit18%
Serious Bicyclist Crashes by LightingFatal/Incapacitating Bicyclist Crashes, 2011 - 2015
Figure 6-6
Figure 6-7
Figure 6-8

Metro State of Safety 2018 Report Section 6 – Bicyclists
57
By Roadway Classification
Roadway Classification
Total Road-Miles
Annual VMT (2015)
2011-2015 Annual Bicyclist Crashes
Serious Serious per Road-Mile
Serious per 100M VMT
Arterial 772 4,281,000,000 22.8 0.030 0.53
Collector 994 1,081,000,000 9.0 0.009 0.83
Local 4,565 620,000,000* 3.2 0.001 0.52
METRO 6,331 5,982,000,000 35.0 0.006 --
* VMT for local streets is a low-confidence estimate
Figures 6-9 and 6-10
As with all crashes, the region’s Serious Bicyclist crashes occur primarily on the arterials, accounting for
65% of these crashes. Figure 6-9 presents the distribution of Serious Bicyclist crashes by roadway
classification. As can be seen in Figure 6-10, which presents the rate of Serious Bicyclist crashes per mile
of roadway, arterial roadways are more than three times as likely than collectors per mile to be the
location of a Serious Bicyclist crash, and more than 40 times as likely than local streets per mile to be the
location of a Serious Bicyclist crash.
As can be seen in Figure 6-11, when normalized by
motor vehicle traffic volume, the Serious Bicyclist
crash rate on collectors is higher than on arterials.
While the reason for this is not clear from the
data, it may be related to a higher use of collector
roads by cyclists relative to traffic volume as
compared to arterials. Vehicle miles travelled was
not available for local streets.
Arterial, 22.8, 65%
Collector, 9.0, 26%
Local, 3.2, 9%
Serious Bicyclist Crashes by Roadway ClassAnnual Fatal/Incapacitating Bicyclist Crashes, 2011 - 2015
0.030
0.0090.001
Arterial Collector Local
0.000
0.005
0.010
0.015
0.020
0.025
0.030
0.035
An
nu
al S
eri
ou
s C
rash
es
pe
r M
ile o
f R
oad
Serious Bicyclist Crash Rate by Roadway Class
Annual Fatal/Incapacitating Crashes per road mile, 2011 - 2015
0.53
0.83
Arterial Collector
0.0
0.1
0.2
0.3
0.4
0.5
0.6
0.7
0.8
0.9
An
nu
al S
erio
us
Cra
shes
per
10
0M
VM
T
Serious Bicyclist Crash Rate by Roadway Class
Annual Fatal/Incapacitating Crashes per VMT, 2011 - 2015
Figure 6-11

Metro State of Safety 2018 Report Section 6 – Bicyclists
58
By Number of Lanes
Number of Lanes
Total Road-Miles
2011-2015 Annual Bicyclist Crashes
Serious Serious per Road-Mile
Serious per 100M VMT
1 – 3 Lanes 1,427 19.6 0.014 0.66
4+ Lanes 340 15.4 0.045 0.56
METRO 1,766 35.0 0.020 0.61
* Arterial and Collector roadways only
Figure 6-12 and 6-13
The influence of street width is consistent with the influence of roadway classification (Figure 6-12).
Wider roadways are the location of a disproportionate number of Serious Bicyclist crashes in relation to
their share of the overall system (Figure 6-13), although the effect is not as pronounced as it is for
Serious Pedestrian crashes. The Serious Bicyclist crash rate per road mile increases dramatically for
roadways with 4 or more lanes. This is a concern, given that in many parts of the region designated
bicycling routes often follow arterial roadways with 4 or more lanes.
As can be seen in Figure 6-14, when normalized by
motor vehicle traffic volume, the Serious Bicyclist
crash rate on narrower roads is higher than on
wider roads. While the reason for this is not clear
from the data, it may be related to a higher use of
narrower roads by cyclists relative to traffic
volume as compared to multi-lane roadways.
1-3 lanes, 19.6, 56%
4+ lanes, 15.4, 44%
Serious Bicyclist Crashes by Street WidthAnnual Fatal/Incapacitating Bicyclist Crashes, 2011 - 2015
0.014
0.045
1-3 lanes 4+ lanes
0.00
0.01
0.02
0.03
0.04
0.05
An
nu
al S
erio
us
Cra
shes
per
Mile
of
Ro
ad
Serious Bicyclist Crashes by Street WidthAnnual Fatal/Incapacitating Crashes per Arterial/Collector road
mile, 2011 - 2015
0.66
0.56
1-3 lanes 4+ lanes
0.0
0.1
0.2
0.3
0.4
0.5
0.6
0.7
An
nu
al S
eri
ou
s C
rash
es
pe
r 1
00
M V
MT
Serious Bicyclist Crashes by Street WidthAnnual Fatal/Incapacitating Crashes per Arterial/Collector VMT,
2011 - 2015
Figure 6-14

Metro State of Safety 2018 Report Section 6 – Bicyclists
59
By Contributing Factor
Factor
2011-2015 Annual Crashes (Bicyclist)
All Fatal Injury A Injury B Injury C All Injury Serious
Excessive Speed 25 0.4 2 16 6 24 2
Following Too Close 13 0.2 0 7 4 11 0
Fail to Yield ROW 417 1.0 28 248 129 406 29
Improper Maneuver 77 0.6 4 41 30 75 5
Inattention 7 0.0 1 4 2 7 1
Reckless or Careless 14 0.4 2 8 3 14 2
Aggressive 35 0.4 2 21 9 32 2
Fail to Stop 10 0.0 0 5 3 8 0
Parking Related 0 0.0 0 0 0 0 0
Vehicle Problem 9 0.0 1 5 3 9 1
Alcohol or Drugs 18 0.8 2 10 4 17 3
Hit and Run 14 0.6 1 8 3 13 1
School Zone 4 0.0 0 2 2 4 0
Work Zone 3 0 1 2 1 3 1
METRO 518 2.0 33 306 161 502 35
Figures 6-15 and 6-16
Figure 6-15 and 6-16 present the proportion of Bicyclist crashes by contributing factor for Serious and
Fatal crashes, respectively. Alcohol or Drugs and Fail to Yield ROW are the most common factors. The
data do not specify whether the driver, the bicyclist, or both were under the influence of alcohol. Other
factors, such as Fail to Yield ROW, Excessive Speed, and Aggressive Driving, are for the driver.
The determination of contributing factors is described in more detail in Section 7.
7%1%
82%
14%
2%7% 7%
0% 0% 2%9%
3% 0% 2%0%
10%20%30%40%50%60%70%80%90%
100%
Contributing Factor to Serious Bicycle CrashesFatal/Incapacitating Crashes, 2011 - 2015
20%10%
50%
30%
0%
20% 20%
0% 0% 0%
40%30%
0% 0%0%
10%20%30%40%50%60%70%80%90%
100%
Contributing Factor to Fatal Bicycle Crashes2011 - 2015

Metro State of Safety 2018 Report Section 6 – Bicyclists
60
By Bicyclist’s Age and Gender
The age and gender of bicyclists involved in Serious crashes are presented in the following table and
Figures 6-17 and 6-18.
Total Male Bicyclists (2011 – 2015) Total Female Bicyclists (2011 – 2015)
Age All Crashes Serious Percent Serious All Crashes Serious
Percent Serious
≤13 98 5 5.1% 39 0 0.0%
14-17 131 1 0.8% 23 0 0.0%
18-21 164 28 17.1% 54 5 9.3%
22-24 236 11 4.7% 81 8 9.9%
25-29 223 19 8.5% 149 10 6.7%
30-34 262 17 6.5% 107 8 7.5%
35-39 150 21 14.0% 66 0 0.0%
40-44 154 9 5.8% 48 4 8.3%
45-49 156 8 5.1% 47 1 2.1%
50-54 116 2 1.7% 28 0 0.0%
55-59 96 5 5.2% 16 1 6.3%
60-64 71 7 9.9% 18 4 22.2%
65-69 20 4 20.0% 2 0 0.0%
70-74 17 0 0.0% 0 0 --
75-79 11 2 18.2% 0 0 --
80-84 0 0 -- 0 0 --
85+ 6 0 0.0% 0 0 --
Unknown 154 0 0.0% 39 0 0.0%
METRO 2065 139 6.7% 717 41 5.7%
Figures 6-17 and 6-18
Male , 77.2%
Female, 22.8%
Bicyclist's Gender in Serious CrashesFatal/Incapacitating Crashes, 2011 - 2015
5 1
28
11
1917
21
9 82 5 7 4
02
0
5
8
10
8
4 1
14
0
5
10
15
20
25
30
35
≤13
14
-17
18
-21
22
-24
25
-29
30
-34
35
-39
40
-44
45
-49
50
-54
55
-59
60
-64
65
-69
70
-74
75
-79
80
-84
85
+
Nu
mb
er
of
Bic
yclis
ts in
Fat
al/I
nca
pac
itat
ing
Cra
she
s
Bicyclist Age Group
Bicyclist's Gender and Age Group in Serious Crashes, 2011 - 2015
Females
Males

Metro State of Safety 2018 Report Section 7 – Crash Type Detail
61
Section 7 – Crash Type Detail In this section, the four crash types identified in Section 2 as most prevalent are reviewed relative to all
crashes in more detail to identify patterns. As documented in Section 2, the most common Serious
crash types were Rear End and Turning, while the most common Fatal crash types were Fixed Object and
Pedestrian. More detail on Rear End, Turning, Fixed Object, and Pedestrian crashes are presented here.
For each crash type, detailed crash information was summarized for all crashes of that type. The
information includes crash severity and contributing factors.
Crash Severity
Every crash is assigned a crash severity based on the most critically injured victim. From worst to best,
the classifications are: Fatal, Injury A, Injury B, Injury C, and PDO (property damage only).
“Serious Crashes” in this report refers to the total number of Fatal and Injury A crashes.
“Injury A” and “Incapacitating injury” are used interchangeably. Incapacitating injuries typically are
injuries that the victim is not able to walk away from. They are synonymous with the term
“Severe injury”
“Injury B” and “Moderate injury” are used interchangeably.
“Injury C” and “Minor injury” are used interchangeably.
“PDO” means property damage only. Crashes must result in $3,000 or more in damages to be counted.

Metro State of Safety 2018 Report Section 7 – Crash Type Detail
62
Contributing Factors
The State Department of Motor Vehicles assigns causes and errors to participants in each crash, along
with identifiers for certain risk factors, including alcohol and drugs. Several causes, errors, and/or
events may apply to any single crash. Based on these causes, errors, and risk factors, crashes were
evaluated for 14 contributing factors. The first cause, three errors, and one event were reviewed for up
to three drivers and one non-motorist per crash, and classified for this analysis as follows:
Defined Contrib. Factor DMV codes included in factor
Cause Codes
Error Codes
Event Codes
Excessive Speed Speed too fast for conditions; Driving in excess of posted speed; Speed racing; Failed to decrease speed for slower moving vehicle; Driving too fast for conditions
1, 30, 31
42, 47, 50, 53
Following Too Close
Following too closely 7 43
Fail to Yield ROW (right-of-way)
Did not yield ROW; Passed stop sign or flashing red; Disregarded traffic signal; Disregarded other traffic control device; Disregarded officer or flagman; Disregarded emergency vehicle; Disregarded Railroad signal or sign or flagman; Failed to obey mandatory turn signal, sign or lane markings; Left turn in front of oncoming traffic; Did not have ROW over pedalcyclist; Did not have ROW; Failed to yield ROW to pedestrian; Passed vehicle stopped at crosswalk for pedestrian
2, 3, 4, 14
3, 4, 20, 21, 23, 24, 25, 27, 28, 29, 33
Improper Maneuver
Drove left of center on two-way road; Improper overtaking; Made improper turn; Other improper driving; Improper change of lanes; Improper use of median or shoulder; Wide turn; Cut corner on turn; Left turn where prohibited; Turned from or into wrong lane; U-turned illegally; Improperly stopped in traffic; Improper signal or failure to signal; Backing improperly (not parking); Improper start from stopped position; Disregarded warning sign, flares, or flashing amber; Passing on a curve, on wrong side, on straight road under unsafe conditions, at intersection, on crest of hill, in no passing zone, or in front of oncoming traffic; Driving on wrong side of road; Driving through safety zone or island; Failed to stop for school bus; Impeding traffic; Straddling or driving on wrong lanes; Improper change of lanes; Wrong way
5, 6, 8, 10, 13,
50
1, 2, 5, 6, 7, 8, 9, 10, 11, 14, 22, 30, 31, 32, 34, 35, 36, 37, 39, 40, 41, 44, 45, 46, 49
Inattention Driver drowsy/fatigued/sleepy; Inattention; Distracted by passenger, animal, cell phone, texting, navigation system, or electronic device
16, 27, 28
16 2, 3, 93, 99, 102, 115, 116
Reckless or Careless
Reckless driving; Careless driving 32, 33 51, 52
Aggressive Excessive Speed or Following too Close, as defined above 1, 7, 30,
31 42, 43,
47, 50, 53
Fail to Stop Failed to avoid stopped or parked vehicle ahead other than school bus 26
Parking Related Improperly parked; Improper start leaving parked position; Improper parking; Opened door into adjacent traffic lane
12, 13, 18, 48
Vehicle Problem Improper or no lights; Driving unsafe vehicle (no other error apparent); Overloading or improper loading of vehicle with cargo or passengers
15, 17, 85
Alcohol or Drugs Alcohol, Drugs
Hit and Run Hit and Run

Metro State of Safety 2018 Report Section 7 – Crash Type Detail
63
All Crash Types
The following table summarizes all crashes in the region by severity and contributing factor, as defined
on the previous page.
Factor
2011-2015 Annual Crashes (All Crashes)
All Fatal Injury A Injury B Injury C All Injury Serious
Excessive Speed 2,897 20.6 68 372 1,019 1,480 89
Following Too Close 7,806 1.4 65 486 3,660 4,212 66
Fail to Yield ROW 7,081 19.2 177 1,227 2,369 3,793 196
Improper Maneuver 4,636 16.4 79 400 1,137 1,633 96
Inattention 1,279 3.0 29 166 533 731 32
Reckless or Careless 1,086 6.8 52 234 375 668 59
Aggressive 9,663 21.2 123 771 4,198 5,114 144
Fail to Stop 8,979 1.6 73 514 4,228 4,817 75
Parking Related 136 0.0 0 4 18 22 0
Vehicle Problem 124 0.8 4 18 35 57 4
Alcohol or Drugs 1,056 34.4 60 215 265 575 94
Hit and Run 1,382 5.0 12 104 452 572 17
School Zone 66 0.2 1 13 26 39 1
Work Zone 177 0.2 5 25 69 99 5
METRO 23,280 60.8 420 2,547 8,545 11,573 481

Metro State of Safety 2018 Report Section 7 – Crash Type Detail
64
Figure 7-1 presents the crash severity distribution of all crashes. Figures 7-2 and 7-3 present the
proportion of crashes by contributing factor for Serious and Fatal crashes, respectively. Each crash may
have several contributing factors.
Figure 7-1
Figures 7-2 and 7-3
Alcohol and Drugs, Aggressive Driving (defined as either Excessive Speed or Following Too Close),
Excessive Speed, and Fail to Yield ROW are the most common contributing factors to Serious crashes in
the region.
FATAL0.3%
INJURY A1.8%
INJURY B10.9%
INJURY C36.7%
PDO50.3%
All Crashes by Severity, 2011 - 2015
23,280 Annual Crashes
18%14%
41%
20%
7%12%
30%
16%
0% 1%
20%
4% 0% 1%0%
10%20%30%40%50%60%70%80%90%
100%
Contributing Factor to Serious CrashesFatal/Incapacitating Crashes, 2011 - 2015
34%
2%
32%27%
5%11%
35%
3% 0% 1%
57%
8%0% 0%
0%10%20%30%40%50%60%70%80%90%
100%
Contributing Factor to Fatal Crashes2011 - 2015

Metro State of Safety 2018 Report Section 7 – Crash Type Detail
65
Rear End Crashes
A Rear End crash results when a vehicle traveling in the same direction or parallel on the same path as
another vehicle, collides with the rear end of a second vehicle. In this type, the direction of travel was
parallel but continuous.
Rear End is the most common crash type in the region, and although it is rarely Fatal it is often Serious.
Rear End crashes constitute 7% of Fatal crashes, 21% of Serious crashes, and 45% of all crashes in the
region.
Factor
2011-2015 Annual Crashes (Rear-End Crashes)
All Fatal Injury A Injury B Injury C All Injury Serious
Excessive Speed 1,591 2.6 18.0 131 727 878 20.6
Following Too Close 7,639 1.4 62.2 470 3,599 4,133 63.6
Fail to Yield ROW 59 0.4 0.6 7 25 33 1.0
Improper Maneuver 455 0.8 5.8 32 184 223 6.6
Inattention 834 0.8 12.0 75 417 505 12.8
Reckless or Careless 412 1.2 11.0 67 209 288 12.2
Aggressive 8,248 3.2 70.8 520 3,865 4,460 74.0
Fail to Stop 8,748 1.4 70.2 503 4,167 4,742 71.6
Parking Related 4 0.0 0.0 0 1 1 0.0
Vehicle Problem 28 0.0 0.8 2 14 18 0.8
Alcohol or Drugs 256 3.0 5.2 36 110 154 8.2
Hit and Run 553 0.8 4.8 32 264 302 5.6
School Zone 21 0.0 0.0 2 11 13 0.0
Work Zone 89 0 1.8 9 42 54 1.8
METRO 10,573 4.4 95.6 661 4,948 5,710 100.0

Metro State of Safety 2018 Report Section 7 – Crash Type Detail
66
Figure 7-4 presents the crash severity distribution of Rear End crashes. Figures 7-5 and 7-6 present the
proportion of crashes by contributing factor for Serious Rear End and Fatal Rear End crashes,
respectively. Each crash may have several contributing factors.
Figure 7-4
Figures 7-5 and 7-6
Rear End crashes are less severe than most crashes, producing a high proportion of Injury C and PDO
crashes. Aggressive Driving, Fail to Stop, Following too Closely, and Excessive Speed are factors in a
substantial proportion of Serious and Fatal Rear End crashes.
FATAL0.0%
INJURY A0.9%
INJURY B6.3%
INJURY C46.8%
PDO46.0%
Rear-End Crashes by Severity, 2011 - 2015
10,573 Annual Crashes
21%
64%
1%7%
13% 12%
74% 72%
0% 1%8% 6%
0% 2%0%
10%20%30%40%50%60%70%80%90%
Contributing Factor to Serious Rear-End Crashes
Fatal/Incapacitating Crashes, 2011 - 2015
59%
32%
9%18% 18%
27%
73%
32%
0% 0%
68%
18%
0% 0%0%
10%20%30%40%50%60%70%80%90%
100%
Contributing Factor to Fatal Rear-End Crashes2011 - 2015

Metro State of Safety 2018 Report Section 7 – Crash Type Detail
67
Turning Crashes
A Turning crash results when one or more vehicles in the act of a turning maneuver is involved in a
collision with another vehicle. It differs from an Angle crash in that Turning crashes involve vehicles
traveling on the same street, whereas Angle crashes involve vehicles traveling on intersecting streets or
driveways.
Turning is the second most common crash type in the region, as well as the most common Serious crash
type. Turning crashes constitute 10% of Fatal crashes, 24% of Serious crashes, and 22% of all crashes in
the region.
Factor
2011-2015 Annual Crashes (Turning Crashes)
All Fatal Injury A Injury B Injury C All Injury Serious
Excessive Speed 173 1.4 6 31 54 92 7
Following Too Close 102 0.0 1 7 39 47 1
Fail to Yield ROW 4,017 3.8 94 668 1,340 2,106 98
Improper Maneuver 1,160 1.8 15 104 301 423 17
Inattention 56 0.2 3 11 19 33 3
Reckless or Careless 123 0.8 9 36 41 87 9
Aggressive 238 1.4 6 34 80 122 8
Fail to Stop 86 0.0 1 3 34 38 1
Parking Related 1 0.0 0 0 0 0 0
Vehicle Problem 17 0.4 1 4 6 12 2
Alcohol or Drugs 102 1.8 6 25 31 63 7
Hit and Run 241 0.0 2 20 66 88 2
School Zone 18 0.0 0 5 6 11 0
Work Zone 25 0.2 1 5 7 13 1
METRO 5,154 5.8 108 758 1,638 2,510 114

Metro State of Safety 2018 Report Section 7 – Crash Type Detail
68
Figure 7-7 presents the crash severity distribution of Turning crashes. Figures 7-8 and 7-9 present the
proportion of crashes by contributing factor for Serious Turning and Fatal Turning crashes, respectively.
Each crash may have several contributing factors.
Figure 7-7
Figures 7-8 and 7-9
Turning crashes have an average rate of severity compared to other crash types. Fail to Yield ROW,
Alcohol or Drugs, and Excessive Speed are often involved in Serious and Fatal Turning crashes.
FATAL0.1%
INJURY A2.1%
INJURY B14.7%
INJURY C31.8%
PDO51.3%
Turning Crashes by Severity, 2011 - 2015
5,154 Annual Crashes
6%1%
86%
15%
3%8% 7%
1% 0% 1%6%
1% 0% 1%0%
10%20%30%40%50%60%70%80%90%
100%
Contributing Factor to Serious Turning CrashesFatal/Incapacitating Crashes, 2011 - 2015
24%
0%
66%
31%
3%
14%
24%
0% 0%7%
31%
0% 0% 3%
0%10%20%30%40%50%60%70%80%90%
100%
Contributing Factor to Fatal Turning Crashes2011 - 2015

Metro State of Safety 2018 Report Section 7 – Crash Type Detail
69
Fixed Object Crashes
A Fixed Object crash results when one vehicle strikes a fixed or other object on or off the roadway.
Fixed Object is the second most common Fatal crash type in the region. Fixed Object crashes constitute
26% of Fatal crashes, 17% of Serious crashes, though only 7% of all crashes in the region.
Factor
2011-2015 Annual Crashes (Fixed Object Crashes)
All Fatal Injury A Injury B Injury C All Injury Serious
Excessive Speed 756 11.2 27.8 136 145 320 39.0
Following Too Close 9 0.0 0.2 2 3 5 0.2
Fail to Yield ROW 31 0.8 1.4 6 5 13 2.2
Improper Maneuver 642 5.0 24.8 98 117 245 29.8
Inattention 216 0.8 7.2 43 46 97 8.0
Reckless or Careless 311 1.8 16.6 71 54 144 18.4
Aggressive 761 11.2 27.8 137 147 323 39.0
Fail to Stop 6 0.0 0.0 1 2 2 0.0
Parking Related 7 0.0 0.0 0 1 1 0.0
Vehicle Problem 33 0.0 0.6 3 6 10 0.6
Alcohol or Drugs 401 11.2 23.6 89 59 183 34.8
Hit and Run 133 0.4 1.2 18 14 33 1.6
School Zone 9 0.0 0.0 2 2 3 0.0
Work Zone 22 0 1.4 4 5 11 1.4
METRO 1,734 15.8 66.6 289 341 712 82.4

Metro State of Safety 2018 Report Section 7 – Crash Type Detail
70
Figure 7-10 presents the crash severity distribution of Fixed Object crashes. Figures 7-11 and 7-12
present the proportion of crashes by contributing factor for Serious Fixed Object and Fatal Fixed Object
crashes, respectively. Each crash may have several contributing factors.
Figure 7-10
Figures 7-11 and 7-12
Fixed Object crashes have a higher rate of severity including fatalities compared to other crash types.
Excessive Speed, Aggressive Driving, and Alcohol or Drugs are often involved in Serious and Fatal Fixed
Object crashes.
FATAL0.9%
INJURY A3.8%
INJURY B16.6%
INJURY C19.6%
PDO59.0%
Fixed Object Crashes by Severity, 2011 - 2015
1,734 Annual Crashes
47%
0% 3%
36%
10%
22%
47%
0% 0% 1%
42%
2% 0% 2%0%
10%20%30%40%50%60%70%80%90%
Contributing Factor to Serious Fixed Object Crashes
Fatal/Incapacitating Crashes, 2011 - 2015
71%
0%5%
32%
5%11%
71%
0% 0% 0%
71%
3% 0% 0%0%
10%20%30%40%50%60%70%80%90%
Contributing Factor to Fatal Fixed Object Crashes2011 - 2015
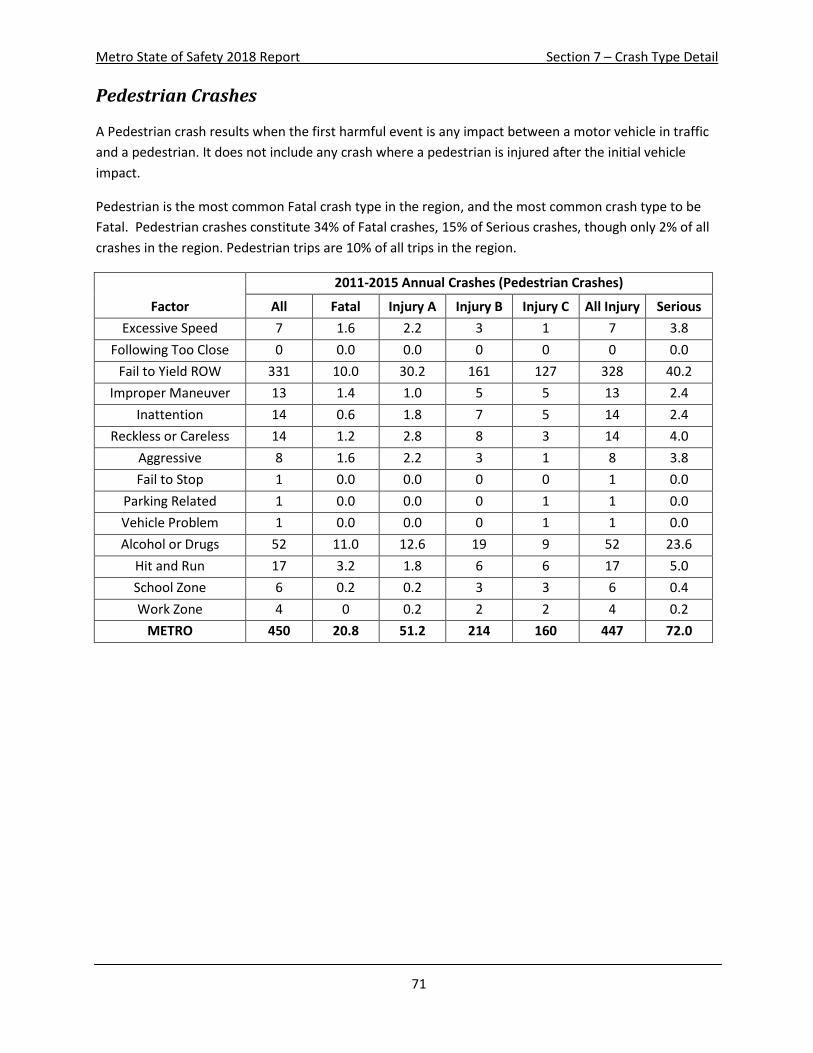
Metro State of Safety 2018 Report Section 7 – Crash Type Detail
71
Pedestrian Crashes
A Pedestrian crash results when the first harmful event is any impact between a motor vehicle in traffic
and a pedestrian. It does not include any crash where a pedestrian is injured after the initial vehicle
impact.
Pedestrian is the most common Fatal crash type in the region, and the most common crash type to be
Fatal. Pedestrian crashes constitute 34% of Fatal crashes, 15% of Serious crashes, though only 2% of all
crashes in the region. Pedestrian trips are 10% of all trips in the region.
Factor
2011-2015 Annual Crashes (Pedestrian Crashes)
All Fatal Injury A Injury B Injury C All Injury Serious
Excessive Speed 7 1.6 2.2 3 1 7 3.8
Following Too Close 0 0.0 0.0 0 0 0 0.0
Fail to Yield ROW 331 10.0 30.2 161 127 328 40.2
Improper Maneuver 13 1.4 1.0 5 5 13 2.4
Inattention 14 0.6 1.8 7 5 14 2.4
Reckless or Careless 14 1.2 2.8 8 3 14 4.0
Aggressive 8 1.6 2.2 3 1 8 3.8
Fail to Stop 1 0.0 0.0 0 0 1 0.0
Parking Related 1 0.0 0.0 0 1 1 0.0
Vehicle Problem 1 0.0 0.0 0 1 1 0.0
Alcohol or Drugs 52 11.0 12.6 19 9 52 23.6
Hit and Run 17 3.2 1.8 6 6 17 5.0
School Zone 6 0.2 0.2 3 3 6 0.4
Work Zone 4 0 0.2 2 2 4 0.2
METRO 450 20.8 51.2 214 160 447 72.0

Metro State of Safety 2018 Report Section 7 – Crash Type Detail
72
Figure 7-13 presents the crash severity distribution of Pedestrian crashes. Figures 7-14 and 7-15 present
the proportion of crashes by contributing factor for Serious Pedestrian and Fatal Pedestrian crashes,
respectively. Further breakdown of the reported error by user follows in Figures 7-16 through 7-19.
Each crash may have several contributing factors.
Figure 7-13
Figures 7-14 and 7-15
Pedestrian crashes have the highest severity of any crash type. A Pedestrian crash is more than 26
times as likely to be fatal than a crash not involving a pedestrian, and more than 110 times as likely to
be fatal as a Rear End crash, the most common crash type. Failure to Yield ROW and Alcohol or Drugs
are the most common contributing factors.
FATAL4.6%
INJURY A11.4%
INJURY B47.6%
INJURY C35.6%
PDO0.8%
Pedestrian Crashes by Severity, 2011 - 2015
450 Annual Crashes
5%0%
56%
3% 3% 6% 5%0% 0% 0%
33%
7%1% 0%
0%10%20%30%40%50%60%70%80%90%
Contributing Factor to Serious Pedestrian Crashes
Fatal/Incapacitating Crashes, 2011 - 2015
8%0%
48%
7% 3% 6% 8%0% 0% 0%
53%
15%
1% 0%0%
10%20%30%40%50%60%70%80%90%
Contributing Factor to Fatal Pedestrian Crashes2011 - 2015

Metro State of Safety 2018 Report Section 7 – Crash Type Detail
73
Additional analysis was done for this crash type to identify how often the driver was reported to be at
fault in Pedestrian crashes and how often the pedestrian was reported to be at fault. For the purposes
of this analysis, those causes, errors, and events defined at the beginning of Section 7 are considered
errors.
Figures 7-16 and 7-17 present the proportion of Pedestrian crashes by reported error source for Serious
Pedestrian and Fatal Pedestrian crashes, respectively.
Figures 7-16 and 7-17
Figures 7-18 and 7-19 present the proportion of crashes by common contributing factor and reported
error source for Serious Pedestrian and Fatal Pedestrian crashes, respectively.
Figures 7-18 and 7-19
Driver, 122, 34%
Both, 29, 8%
Ped, 123, 34%
Neither, 86, 24%
Serious Pedestrian Crashes by Reported Error, 2011 - 2015
360 Total Crashes
Driver, 26, 25%
Both, 14, 14%
Ped, 45, 43%
Neither, 19, 18%
Fatal Pedestrian Crashes by Reported Error, 2011 - 2015
104 Total Crashes
5%
30%
2% 3% 6% 5% 6%
42%
26%
1%
26%
42%33%
7%1% 0%
0%10%20%30%40%50%60%70%80%90%
Reported Error in Serious Pedestrian CrashesFatal/Incapacitating Crashes, 2011 - 2015
Driver Errors Ped Errors Overall
8%
22%
5% 3% 6% 8% 6%
38%
28%
0%
41%
57% 53%
15%
1% 0%0%
10%20%30%40%50%60%70%80%90%
Reported Error in Fatal Pedestrian Crashes2011 - 2015
Driver Errors Ped Errors Overall

Metro State of Safety 2018 Report Section 7 – Crash Type Detail
74
Crash Factor Matrix
The Crash Factor Overllaps matrix, Figure 7-20, shows the percentage Serious crashes for different
factors.

Figure 7-20 % of all % of left that were…
Column A Col.B Col. K
Guide to reading this chart: Starting with the row names in Column A; Column B represents the % of all crashes pertaining to that row in Column A (eg. 62% of all crashes were on an arterial). The columns following Column B are the % of
column A that were also that thing (eg. 18% of arterial crashes [in Column A] were Ped Involved). The columns following Column K [i.e. Ped Involved] are the % of serious crashes that were both that row and column (eg. 55% of serious arterial
crashes were at intersections ). For rows 1-7, Columns K onward represent the injury type of the row rather than serious crashes.
Crash Factor Overlaps - Percentage of Fatal and Serious Injuries by Row, 2011 to 2015
All cra
shes
Fata
lSe
rious
A B C PDOPed In
volve
d
Bike In
volve
d
Auto-o
nly
Moto
rcyc
le In
volve
d
Truck
Invo
lved
Freew
ay
Arteria
l
Collect
or
Loca
l
Inte
rsect
ion
non-Inte
rsect
ion
Angle
Head-on
Rear-e
nd
Turnin
g
Fixed o
bject
Daylig
ht
Darkn
ess- l
it
Darkn
ess- n
o lights
Dawn/ d
usk
Speed In
volve
d
Follo
wed to
o close
ly
Fail t
o yield
ROW
Impro
per maneuve
r
Inat
tentio
n
Reckle
ss/ C
arele
ss
Aggre
ssive
Faile
d to st
op
Alcohol In
volve
d
Drug I
nvolve
d
Hit & R
un
Ro
ws
1-7
All crashes 100% 0.3% 2.1% 1.8% 11% 40% 50% 2% 2% 91% 2% 3% 16% 62% 16% 7% 47% 53% 10% 1% 45% 22% 7% 71% 18% 4% 7% 12% 34% 30% 20% 5% 5% 42% 39% 4% 1% 6%
Fatal 0.3% 100.0% 12.2% 14% 15% 36% 4% 38% 18% 8% 7% 69% 21% 3% 37% 63% 7% 8% 7% 10% 26% 38% 39% 15% 7% 34% 2% 32% 27% 5% 11% 35% 3% 46% 20% 8%
Serious 2.1% 12.6% 88.9% 15% 22% 16% 7% 60% 15% 4% 10% 66% 18% 6% 49% 51% 11% 4% 21% 24% 17% 59% 26% 8% 7% 18% 14% 41% 20% 7% 12% 30% 16% 17% 5% 4%
A 1.8% 1.7% 100.0% 16% 23% 13% 8% 63% 14% 3% 10% 66% 18% 6% 50% 50% 12% 3% 23% 25% 16% 61% 24% 7% 7% 17% 15% 42% 19% 7% 12% 29% 17% 14% 3% 3%
B 11% 0.3% 2.8% 2.5% 26% 9% 12% 71% 7% 3% 12% 63% 19% 6% 55% 45% 15% 2% 26% 30% 11% 67% 21% 5% 7% 15% 19% 48% 16% 7% 9% 30% 20% 8% 1% 4%
C 40% 0.1% 1.1% 1.1% 7% 2% 2% 93% 1% 2% 17% 66% 13% 4% 48% 52% 10% 1% 57% 20% 4% 72% 17% 3% 7% 12% 42% 29% 13% 6% 5% 48% 48% 3% 1% 5%
PDO 50% 0% 0% 96% 1% 4% 16% 59% 16% 8% 45% 55% 9% 0% 42% 23% 9% 71% 17% 4% 7% 12% 31% 28% 26% 5% 4% 39% 36% 4% 1% 7%
Ped Involved 2% 4.7% 16.4% 12.0% 48% 38% 1% 2% 2% 2% 75% 16% 7% 53% 47% 1% 0% 1% 1% 2% 36% 40% 13% 11% 7% 1% 55% 4% 4% 6% 7% 1% 29% 9% 7% % of serious crashes that were also…
Bike Involved 2% 0.4% 6.8% 6.4% 59% 32% 3% 1% 5% 1% 64% 25% 9% 73% 27% 27% 1% 3% 63% 0% 70% 18% 5% 8% 7% 1% 81% 14% 2% 7% 7% 0% 7% 2% 3%
Auto-only 91% 0.1% 1.4% 1.3% 9% 41% 53% 11% 66% 17% 5% 46% 54% 13% 5% 29% 23% 24% 61% 25% 8% 5% 20% 19% 34% 22% 9% 14% 37% 23% 16% 4% 3%
Motorcycle Involved 2% 2.8% 18.0% 15.3% 45% 28% 15% 2% 0% 1% 12% 58% 24% 6% 47% 53% 11% 3% 15% 33% 16% 66% 18% 8% 7% 28% 11% 38% 29% 4% 14% 35% 8% 15% 3% 1%
Truck Involved 3% 0.7% 2.5% 1.8% 10% 29% 62% 8% 10% 6% 25% 64% 8% 3% 43% 57% 8% 10% 28% 22% 9% 64% 24% 8% 5% 26% 17% 32% 31% 6% 13% 41% 18% 18% 3% 2%
Freeway 16% 0.1% 1.3% 1.2% 8% 43% 51% 3% 1% 70% 18% 9% 4% 96% 1% 1% 54% 1% 24% 57% 30% 9% 4% 37% 34% 3% 23% 9% 19% 61% 28% 16% 4% 3%
Arterial 62% 0.3% 2.2% 1.9% 11% 42% 48% 18% 7% 60% 13% 4% 55% 45% 12% 4% 20% 28% 13% 58% 27% 7% 7% 15% 14% 47% 18% 7% 11% 27% 17% 16% 5% 4%
Collector 16% 0.3% 2.5% 2.2% 14% 35% 53% 13% 10% 56% 19% 2% 51% 49% 14% 5% 11% 23% 25% 59% 21% 13% 7% 22% 7% 41% 24% 5% 11% 27% 9% 21% 5% 4%
Local 7% 0.1% 1.8% 1.7% 11% 24% 65% 19% 12% 52% 15% 2% 53% 47% 20% 4% 5% 16% 22% 67% 20% 9% 4% 19% 2% 40% 26% 6% 15% 20% 2% 19% 7% 4%
Intersection 47% 0.2% 2.1% 1.9% 13% 41% 48% 17% 11% 56% 14% 3% 1% 74% 19% 6% 22% 1% 14% 37% 8% 63% 26% 4% 7% 11% 9% 68% 12% 4% 10% 19% 12% 13% 3% 3%
non-Intersection 53% 0.3% 2.0% 1.7% 10% 39% 52% 15% 4% 63% 15% 4% 19% 59% 18% 5% 2% 7% 28% 11% 26% 55% 27% 12% 7% 26% 18% 15% 27% 9% 14% 40% 19% 21% 7% 4%
Angle 10% 0.2% 2.4% 2.2% 17% 41% 46% 2% 17% 66% 13% 3% 1% 67% 22% 10% 92% 8% 71% 23% 2% 4% 7% 0% 94% 3% 3% 9% 8% 0% 10% 2% 1%
Head-on 1% 3.3% 12.1% 9.8% 27% 41% 36% 0% 1% 79% 11% 10% 2% 69% 23% 5% 11% 89% 55% 19% 15% 11% 29% 1% 4% 89% 10% 18% 30% 1% 29% 12% 3%
Rear-end 45% 0.0% 0.9% 0.9% 6% 50% 46% 1% 1% 83% 11% 5% 26% 63% 10% 1% 32% 68% 70% 20% 3% 6% 21% 64% 1% 7% 13% 12% 74% 72% 7% 2% 6%
Turning 22% 0.1% 2.2% 2.1% 15% 36% 51% 1% 20% 58% 20% 3% 1% 78% 18% 4% 76% 24% 71% 18% 4% 6% 6% 1% 86% 15% 3% 8% 7% 1% 6% 1% 1%
Fixed object 7% 0.9% 4.8% 4.0% 17% 21% 59% 2% 0% 83% 14% 2% 14% 52% 27% 7% 24% 76% 39% 40% 17% 5% 47% 0% 3% 36% 10% 22% 47% 0% 37% 10% 2%
Daylight 71% 0.1% 1.7% 1.6% 11% 41% 50% 10% 9% 62% 17% 4% 9% 66% 19% 6% 52% 48% 14% 4% 25% 29% 11% 14% 17% 44% 19% 7% 9% 29% 20% 5% 3% 2%
Darkness- lit 18% 0.6% 3.0% 2.5% 13% 39% 49% 25% 5% 58% 10% 3% 11% 69% 15% 4% 48% 52% 10% 3% 16% 17% 26% 25% 8% 38% 18% 7% 20% 31% 10% 39% 6% 7%
Darkness- no lights 4% 1.1% 4.5% 3.6% 15% 31% 54% 24% 4% 55% 15% 4% 11% 54% 29% 6% 26% 75% 3% 7% 7% 11% 35% 32% 4% 21% 32% 6% 15% 34% 4% 41% 12% 6%
Dawn/ dusk 7% 0.2% 2.0% 1.7% 10% 41% 50% 26% 9% 48% 16% 2% 6% 72% 19% 3% 50% 50% 7% 6% 20% 23% 12% 15% 13% 44% 20% 7% 10% 26% 14% 15% 4% 4%
Speed Involved 12% 0.7% 3.1% 2.5% 13% 39% 49% 6% 3% 65% 22% 5% 20% 53% 22% 6% 28% 72% 4% 6% 23% 8% 44% 45% 35% 14% 6% 12% 10% 18% 3% 23% 100% 4% 35% 9% 5%
Followed too closely 34% 0.0% 0.8% 0.8% 6% 50% 46% 1% 0% 83% 11% 5% 24% 65% 10% 1% 33% 67% 0% 0% 96% 2% 0% 75% 16% 2% 6% 17% 1% 2% 11% 8% 100% 76% 3% 1% 5%
Fail to yield ROW 30% 0.3% 2.8% 2.5% 18% 38% 46% 22% 15% 49% 13% 3% 1% 75% 19% 5% 82% 18% 26% 0% 1% 50% 1% 64% 25% 4% 7% 5% 0% 4% 3% 7% 5% 0% 11% 2% 2%
Improper maneuver 20% 0.4% 2.1% 1.8% 9% 27% 65% 3% 5% 66% 21% 6% 12% 59% 22% 7% 30% 70% 2% 17% 7% 18% 31% 57% 23% 13% 7% 17% 2% 9% 5% 15% 18% 3% 23% 6% 4%
Inattention 5% 0.2% 2.5% 2.4% 13% 47% 43% 10% 2% 77% 8% 3% 14% 68% 14% 5% 30% 70% 6% 6% 40% 9% 25% 60% 25% 7% 7% 9% 22% 20% 16% 23% 28% 32% 7% 2% 0%
Reckless/ Careless 5% 0.6% 5.4% 4.9% 23% 42% 39% 8% 4% 68% 17% 4% 16% 60% 17% 7% 39% 61% 9% 5% 21% 5% 31% 42% 42% 10% 6% 35% 9% 24% 24% 13% 42% 10% 44% 12% 6%
Aggressive 42% 0.2% 1.5% 1.3% 8% 47% 47% 4% 2% 74% 17% 5% 20% 59% 17% 4% 31% 69% 3% 4% 51% 5% 27% 57% 27% 9% 6% 62% 46% 7% 12% 6% 17% 37% 22% 6% 5%
Failed to stop 39% 0.0% 0.8% 0.8% 6% 50% 46% 1% 0% 88% 8% 4% 18% 71% 10% 1% 38% 62% 0% 0% 96% 1% 0% 75% 16% 2% 6% 5% 67% 1% 4% 14% 8% 71% 4% 1% 1%
Alcohol Involved 4% 2.9% 8.6% 6.0% 22% 30% 46% 27% 3% 56% 13% 4% 9% 63% 22% 6% 38% 62% 7% 6% 8% 8% 37% 16% 58% 19% 6% 37% 3% 26% 27% 3% 31% 38% 4% 14% 8%
Drug Involved 1% 7.1% 13.1% 7.5% 18% 33% 44% 29% 3% 57% 10% 3% 8% 65% 19% 9% 29% 71% 4% 10% 11% 4% 38% 39% 35% 21% 5% 37% 3% 20% 26% 3% 32% 38% 3% 51% 11%
Hit & Run 6% 0.4% 1.2% 0.9% 8% 34% 59% 29% 7% 58% 6% 2% 7% 65% 21% 7% 41% 59% 5% 3% 33% 9% 9% 30% 50% 13% 7% 27% 19% 28% 20% 2% 21% 41% 23% 38% 14%
Ro
ws
1-7


![[SAFETY MANUAL] Safety Manual - Fresno State](https://img.dokumen.tips/doc/110x75/619b3e164287c02ce855dca4/safety-manual-safety-manual-fresno-state.jpg)