Embed Size (px)
Citation preview

METRO REGIONAL TRANSIT AUTHORITY
AUDIT REPORT
For the year ended December 31, 2010
Charles E. Harris & Associates, Inc. Certified Public Accountants and Government Consultants


88 East Broad Street, Fifth Floor, Columbus, Ohio 43215‐3506 Phone: 614‐466‐4514 or 800‐282‐0370 Fax: 614‐466‐4490
www. auditor.state.oh.us
Board of Trustees Metro Regional Transit Authority 416 Kenmore Boulevard Akron, Ohio 44301 We have reviewed the Report of Independent Accountants of the Metro Regional Transit Authority, Summit County, prepared by Charles E. Harris & Associates, Inc., for the audit period January 1, 2010 through December 31, 2010. Based upon this review, we have accepted these reports in lieu of the audit required by Section 117.11, Revised Code. The Auditor of State did not audit the accompanying financial statements and, accordingly, we are unable to express, and do not express an opinion on them. Our review was made in reference to the applicable sections of legislative criteria, as reflected by the Ohio Constitution, and the Revised Code, policies, procedures and guidelines of the Auditor of State, regulations and grant requirements. The Metro Regional Transit Authority is responsible for compliance with these laws and regulations. Dave Yost Auditor of State February 21, 2012

This page intentionally left blank.

- i -
Metro Regional Transit Authority
SUMMIT COUNTY, OHIO AUDIT REPORT
For the Year Ended December 31, 2010
TABLE OF CONTENTS
Page
Opinion on Supplementary Schedule of Federal Awards Expenditures 1
Schedule of Federal Awards Expenditures 2 Notes to the Schedule of Federal Awards Expenditures 3 Independent Accountant’s Report on Internal Control over Financial Reporting and on Compliance and Other Matters Required by
Government Auditing Standards 4-5 Independent Accountants’ Report on Compliance with Requirements Applicable to Each Major Program and on Internal Control over Compliance Required by OMB Circular A-133 6-7
Schedule of Findings 8-9
Schedule of Prior Audit Findings 10

This page intentionally left blank.

1
Rockefeller Building
614 W Superior Ave Ste 1242
Cleveland OH 44113-1306
Charles E. Harris & Associates, Inc. Office phone - (216) 575-1630
Certified Public Accountants Fax - (216) 436-2411
OPINION ON SUPPLEMENTARY SCHEDULE
OF FEDERAL AWARDS EXPENDITURES
Metro Regional Transit Authority
Summit County
416 Kenmore Blvd.
Akron, Ohio 44301
To the Board of Trustees:
We have audited the financial statements of the Metro Regional Transportation Authority,
Summit County (the Authority) as of and for the year ended December 31, 2010, and have
issued our report thereon dated June 21, 2011. These financial statements are the
responsibility of the Authority’s management. Our responsibility is to express an opinion on
these financial statements based on our audit.
We conducted our audit in accordance with auditing standards generally accepted in the
United States of America and the standards applicable to financial audits conducted in
Government Auditing Standards issued by the Comptroller General of the United States.
Those standards require that we plan and perform the audit to obtain reasonable assurance
about whether the financial statements are free of material misstatement. An audit includes
examining, on a test basis, evidence supporting the amounts and disclosures in the financial
statements. An audit also includes assessing the accounting principals used and significant
estimates made by management, as well as evaluating the overall financial statement
presentation. We believe that our audit provides a reasonable basis for our opinion.
Our audit was performed for the purpose of forming opinions on the financial statements of
the Metro Regional Transportation Authority, Summit County that collectively comprise the
basic financial statements. The accompanying Schedule of Federal Awards Expenditures is
presented for purposes of additional analysis as required by the U.S. Office of Management
and Budget, Circular A-133, Audit of States, Local Governments, and Non-Profit Organizations,
and is not a required part of the financial statements. The information in that schedule has
been subjected to the auditing procedures applied in the audit of the financial statements and,
in our opinion, is fairly presented in all material respects in relation to the financial statements
taken as a whole.
Charles E. Harris & Associates, Inc.
June 21, 2011

Metro Regional Transit AuthoritySchedule of Federal Awards ExpendituresFor the Year Ended December 31, 2010
Federal Grantor/Pass Through Grantor Grant CFDA Program Program Title Number Number Expenditures
U.S. Department of TransportationFederal Transit Administration
Federal Transit Cluster Direct Program:
Urbanized Area Formula Program OH-57-X017 20.507 26,665$ OH-55-0003 20.507 228,141 OH-04-0024 20.507 135,130 OH-04-0063 20.507 500,000 OH-37-X055 20.507 123,465 OH-90-X686 20.507 5,723,200 OH-90-X643 20.507 507,077
ARRA- Urbanized Area Formula Program OH-96-X014 20.507 2,739,214
Pass Through Ohio Department of TransportationUrbanized Area Formula Program OH-70-X002 20.507 317,132
Total Federal Transit Cluster 10,300,024
Total U. S. Department of Transportation 10,300,024
U.S. Department of EnergyPass through Ohio Department of Development
ARRA - State Energy Program ARRA-SEP-10-13 81.041 1,000,000
Total Federal Financial Assistance . 11,300,024$
See accompanying Notes to the Schedule of Federal Awards Expenditures
2

3
Metro Regional Transit Authority Notes to the Schedule of Federal Awards Expenditures
For the Year Ended December 31, 2010 1. General
The accompanying schedule of federal awards expenditures is a summary of the activity of Metro Regional Transit Authority’s federal awards programs. The schedule has been prepared on the accrual basis of accounting.
2. Matching
Certain federal programs require that the Authority contribute non-federal funds (matching funds) to support the federally-funded programs. The expenditure of non-federal funds is not included on this schedule

4
Rockefeller Building 614 W Superior Ave Ste 1242 Cleveland OH 44113-1306
Charles E. Harris & Associates, Inc. Office phone - (216) 575-1630 Certified Public Accountants Fax - (216) 436-2411
INDEPENDENT ACCOUNTANTS’ REPORT ON INTERNAL CONTROL OVER FINANCIAL REPORTING AND ON COMPLIANCE AND OTHER MATTERS REQUIRED BY
GOVERNMENT AUDITING STANDARDS Metro Regional Transit Authority Summit County 416 Kenmore Blvd. Akron, Ohio 44301 To the Board of Trustees: We have audited the financial statements of the METRO Regional Transit Authority, Summit County Ohio (the Authority) as of and for the year ended December 31, 2010, and have issued our report thereon dated June 21, 2011. We conducted our audit in accordance with auditing standards generally accepted in the United States of America and the standards applicable to financial audits contained in Government Auditing Standards, issued by the Comptroller General of the United States.
Internal Controls Over Financial Reporting In planning and performing our audit, we considered the Authority’s internal control over financial reporting as a basis for designing our audit procedures for the purpose of expressing our opinions on the financial statements, but not for the purpose of opining on the effectiveness of the Authority’s internal control over financial reporting. Accordingly, we have not opined on the effectiveness of the Authority’s internal control over financial reporting. Our consideration of internal control over financial reporting was for the limited purpose described in the preceding paragraph and was not designed to identify all deficiencies in internal control over financial reporting that might be significant deficiencies or material weaknesses. Therefore, we cannot assure that we have identified all deficiencies, significant deficiencies or material weaknesses. However, as described in the accompanying schedule of findings, we identified a certain deficiency in internal control over financial reporting that we consider to be a material weakness. A deficiency in internal control exists when the design or operation of a control does not allow management or employees, when performing their assigned functions, to prevent, or detect and timely correct misstatements. A material weakness is a deficiency, or a combination of deficiencies, in internal control such that there is a reasonable possibility that a material misstatement of the entity’s financial statements will not be prevented, or detected and timely corrected. We consider finding 2010-001 described in the accompanying schedule of findings to be a material weakness.

5
Compliance and Other Matters As part of reasonably assuring whether the Authority’s financial statements are free of material misstatement, we tested its compliance with certain provisions of laws, regulations, contracts, and grant agreements, noncompliance with which could directly and materially affect the determination of financial statement amounts. However, providing an opinion on compliance with those provisions was not an objective of our audit and, accordingly, we do not express such an opinion. The results of our tests disclosed no instances of noncompliance or other matters we must report under Government Auditing Standards. The Authority’s response to the finding identified in our audit is described in the accompanying schedule of findings. We did not audit the Authority’s response and, accordingly, we express no opinion on it. We intend this report solely for the information and use of management, the audit committee, the Board of Trustees, federal awarding agencies and pass-through entities and others within the Authority. We intend it for no one other than these specified parties.
Charles E. Harris & Associates, Inc. June 21, 2011

6
Rockefeller Building 614 W Superior Ave Ste 1242 Cleveland OH 44113-1306
Charles E. Harris & Associates, Inc. Office phone - (216) 575-1630 Certified Public Accountants Fax - (216) 436-2411
INDEPENDENT ACCOUNTANTS’ REPORT ON COMPLIANCE WITH REQUIREMENTS
APPLICABLE TO EACH MAJOR PROGRAM AND ON INTERNAL CONTROL OVER COMPLIANCE REQUIRED BY OMB CIRCULAR A-133
Metro Regional Transportation Authority Summit County 416 Kenmore Blvd. Akron, Ohio 44301 To the Board of Trustees: Compliance We have audited the compliance of the Metro Regional Transit Authority, Summit County, Ohio (the Authority) with the types of compliance requirements described in U.S. Office of Management and Budget (OMB) Circular A-133 Compliance Supplement that are applicable to its major federal programs for the year ended December 31, 2010. The Authority’s major federal programs are identified in the summary of auditor’s results section of the accompanying schedule of findings. Compliance with the requirements of laws, regulations, contracts and grants applicable to its major federal programs is the responsibility of the Authority’s management. Our responsibility is to express an opinion on the Authority’s compliance based on our audit. We conducted our audit of compliance in accordance with auditing standards generally accepted in the United States of America; the standards applicable to financial audits contained in Government Auditing Standards, issued by the Comptroller General of the United States; and OMB Circular A-133, Audits of States, Local Governments, and Non-Profit Organizations. Those standards and OMB Circular A-133 require that we plan and perform the audit to obtain reasonable assurance about whether noncompliance with the types of compliance requirements referred to above that could have a direct and material effect on a major federal program occurred. An audit includes examining, on a test basis, evidence about the Authority’s compliance with those requirements and performing such other procedures as we considered necessary in the circumstances. We believe that our audit provides a reasonable basis for our opinion. Our audit does not provide a legal determination on the Authority’s compliance with those requirements. In our opinion, the Authority complied, in all material respects, with the requirements referred to above that are applicable to its major federal programs for the year ended December 31, 2010.
Internal Control Over Compliance
The Authority’s management is responsible for establishing and maintaining effective internal control over compliance with the requirements of laws, regulations, contracts, and grants applicable to federal programs. In planning and performing our audit, we considered the Authority’s internal control over compliance with requirements that could directly and materially affect a major federal program in order to determine our auditing procedures for the purpose of opining on compliance in accordance with OMB Circular A-133, but not for the purpose of opining on the effectiveness of internal control over compliance. Accordingly, we have not opined on the effectiveness of the Authority’s internal control over compliance.

7
A deficiency in internal control over compliance exists when the design or operation of a control over compliance does not allow management or employees, when performing their assigned functions, to prevent, or to timely detect and correct, noncompliance with a federal program compliance requirement. A material weakness in internal control over compliance is a deficiency, or combination of deficiencies, in internal control over compliance, such that there is a reasonable possibility that material noncompliance with a federal program compliance requirement will not be prevented, or timely detected and corrected. Our consideration of internal control over compliance was for the limited purpose described in the first paragraph of this section and would not necessarily identify all deficiencies in internal control over compliance that might be deficiencies, significant deficiencies or material weaknesses. We did not identify any deficiencies in internal control over compliance that we consider to be material weaknesses, as defined above. We intend this report solely for the information and use of the audit committee, management, the Board of Trustees, federal awarding agencies and pass-through entities. It is not intended for anyone other than these specified parties.
Charles E. Harris & Associates, Inc. June 21, 2010

SCHEDULE OF FINDINGS
OMB CIRCULAR A-133 SECTION .505
METRO REGIONAL TRANSIT AUTHORITY
SUMMIT COUNTY
DECEMBER 31, 2010
1. SUMMARY OF AUDITOR'S RESULTS
(d)(1)(i) Type of Financial Statement Unqualified
Opinion
(d)(1)(ii) Were there any material control Yes
weaknesses reported at
the financial statement level
(GAGAS)?
(d)(1)(ii) Were there any significant No
deficiencies reported at the financial
statement level (GAGAS)?
(d)(1)(iii) Was there any reported material No
non-compliance at the financial
statement level (GAGAS)?
(d)(1)(iv) Were there any material internal No
control weaknesses
reported for major federal
programs?
(d)(1)(iv) Were there any significant No
deficiencies reported for major
federal programs?
(d)(1)(v) Type of Major Programs' Unqualified
Compliance Opinion
(d)(1)(vi) Are there any reportable findings No
under Section .510
(d)(1)(vii) Major Programs: Federal Transit Administration Cluster:
Urbanized Area Formula Prog. CFDA# 20.507
State Energy Program CFDA# 81.041
(d)(1)(viii) Dollar Threshold: Type A\B Type A: > $339,000
Programs Type B: all others
(d)(1)(ix) Low Risk Auditee? No
8

SCHEDULE OF FINDINGS - (continued)
OMB CIRCULAR A-133 SECTION .505
METRO REGIONAL TRANSIT AUTHORITY
SUMMIT COUNTY
DECEMBER 31, 2010
2. FINDINGS RELATED TO THE FINANCIAL STATEMENTS
REQUIRED TO BE REPORTED IN ACCORDANCE WITH GAGAS
3. FINDINGS FOR FEDERAL AWARDS
None.
FINDING NUMBER 2010-001 MATERIAL WEAKNESS
A fixed assets management system ensures that policies and procedures are in place to safeguard
assets and maintains the integrity of financial statement information. These procedures should
include: authorizing and recording disposals and transfers of assets: recording purchases as additions
at the time items are received: tagging assets to ensure that each asset is in the appropriate location
and described accurately in the Authority's capital asset list. The serial numbers, along with item
description and location, will be added to an equipment register which will be updated annually. Also,
fixed asset sub-ledgers should be maintained detailing all Authority-owned assets and the
corresponding depreciation for the current year and in total. This sub-ledger should trace to the
balances that are listed in the trial balance system.
During our testing of capital assets, we noted that depreciation was not always calculated correctly in
the sub-ledger and that the sub-ledger did not trace to the trial balance system, thus requiring
adjustments. We noted some assets with accumulated depreciation in excess of cost. In addition we
noted a five year old asset with twenty four years of useful life that was fully depreciated. Lastly, we
noted that the Authority's capital assets threshhold is $5,000, however, the Authority depreciates
assets that are below the threshhold. These amounts were corrected in the financial statements and
the Authority's records.
We recommend that the Authority coordinate its effort to maintain a complete and accurate calculation
of depreciation and the implementation of policies and procedures which address reporting to the
Finance Director for updating Authority-wide records. These records should calculate each asset's
depreciation and be recorded in the ledger, which should trace to the trial balance. Also, depreciation
should be posted correctly to the depreciation expense line item in the trial balance system and not be
calculated on assets below the capitalization threshhold.
Management stated they will institute procedures to better track depreciation.
Management Response:
9

10
METRO REGIONAL TRANSIT AUTHORITY SUMMIT COUNTY, OHIO
December 31, 2010
SCHEDULE OF PRIOR AUDIT FINDINGS
Not Corrected, Partially Corrected; Significantly Different Corrective Action Taken; or Finding No Longer
Finding Finding Fully Valid: Explain: Per ADAM 2001-10- Number Summary Corrected? Disclose the current year finding in
this schedule
2009-01 Material Weakness- No Not Corrected, repeated as Capital Assets Item 2010-01

Comprehensive Annual Financial Report
SUMMIT COUNTY416 Kenmore Blvd. • Akron, Ohio • 44301
for the year ending December 31, 2010

This page intentionally left blank.

METRO Regional Transit Authority
COMPREHENSIVE ANNUAL FINANCIAL REPORT
For the Fiscal Year Ended December 31, 2010
Saundra Foster Robert K. Pfaff President, Executive Director/ Board of Trustees Secretary-Treasurer
Prepared by:
The General Administration Department Dean J. Harris, CPA
Director of Finance/Assistant Secretary-Treasurer
Summit County, Ohio

METRO Regional Transit Authority
COMPREHENSIVE ANNUAL FINANCIAL REPORT For the Fiscal Year Ended December 31, 2010
TABLE OF CONTENTS PAGE Introductory Section Letter of Transmittal . . . . . . . . . . . . . . . . . . . . . . . . . . . . . . . . 1 Certificate of Achievement Award in Financial Reporting . . . . . . . . . . . . 3 Board of Trustees and Administration . . . . . . . . . . . . . . . . . . . . . . . 4 Organization Chart . . . . . . . . . . . . . . . . . . . . . . . . . . . . . . . . . 5 Reporting Entity . . . . . . . . . . . . . . . . . . . . . . . . . . . . . . . . . . 7 Economic Condition and Outlook . . . . . . . . . . . . . . . . . . . . . . . . . 8 Major Initiatives. . . . . . . . . . . . . . . . . . . . . . . . . . . . . . . . . . . 9 Financial Information . . . . . . . . . . . . . . . . . . . . . . . . . . . . . . . . 10 Other Information . . . . . . . . . . . . . . . . . . . . . . . . . . . . . . . . . . 13
Financial Section Independent Auditors’ Report . . . . . . . . . . . . . . . . . . . . . . . . . . . 15 Management Discussion and Analysis . . . . . . . . . . . . . . . . . . . . . . . 17 Financial Statements: Statement of Net Assets . . . . . . . . . . . . . . . . . . . . . . . . . . . 23 Statement of Revenues, Expenses and Changes in Net Assets . . . . . . 25 Statement of Cash Flows . . . . . . . . . . . . . . . . . . . . . . . . . . 26 Notes to Financial Statements . . . . . . . . . . . . . . . . . . . . . . . 27
Statistical Section Financial Trend Information Net Assets/Fund Balances by Component . . . . . . . . . . . . . . . . . . . . . 41 Changes in Net Assets/Fund Balances . . . . . . . . . . . . . . . . . . . . . . . 42 Revenues and Operating Assistance – Comparison to Industry Trend Data . . . . . . . . . . . . . . . . . . . . 44 Operating Expenses – Comparison to Industry Trend Data . . . . . . . . . . . . . . . . . . . . . 45 Passenger Fares vs. Operating Expenses (Graph) . . . . . . . . . . . . . . . . . . 46 Sales Tax – Comparison to other Regional Transit Authorities in Ohio . . . . . . . . . . . . . . . . . . . . . . . . . . . . . . . . . . . 47
i

Revenue Capacity Information Revenues by Source . . . . . . . . . . . . . . . . . . . . . . . . . . . . . . . . 48 Revenues by Source (Graph) . . . . . . . . . . . . . . . . . . . . . . . . . . . . 49 Expenses by Object Class . . . . . . . . . . . . . . . . . . . . . . . . . . . . . 50 Debt Capacity Information Operating Expenses per Vehicle Hour (Graph) . . . . . . . . . . . . . . . . . . . 51 Demographic and Economic Information Demographic Statistics . . . . . . . . . . . . . . . . . . . . . . . . . . . . . . 52 Personal Income (Graph) . . . . . . . . . . . . . . . . . . . . . . . . . . . . . . 53 Largest Employers . . . . . . . . . . . . . . . . . . . . . . . . . . . . . . . . . 54 Operating Information Operating Statistics . . . . . . . . . . . . . . . . . . . . . . . . . . . . . . . . . 55 Fare Rate Structure . . . . . . . . . . . . . . . . . . . . . . . . . . . . . . . . . 57 Miscellaneous Statistics . . . . . . . . . . . . . . . . . . . . . . . . . . . . . . . 58
ii

This Page Left Intentionally Blank
iii

Introductory Section
Board of Trustees
Mr. Scott C. MeyerVice President
Ms. Saundra FosterPresident
Mr. Bernard Bear Ms. Elizabeth Britton

Introductory Section – 2010
The Introductory Section includes the Authority’s transmittal letter, the Certificate of Achievement for Excellence in Financial Reporting, and a Reporting Entity Profile.


The Government of Finance Officers Association of the United States and Canada (GFOA) awarded a Certificate of Achievement for Excellence in Financial Reporting to METRO Regional Transit Authority for its comprehensive annual financial report for the fiscal year ended December 31, 2009. This was the eleventh consecutive year that METRO has achieved this prestigious award. In order to be awarded a Certificate of Achievement, a government unit must publish an easily readable and efficiently organized comprehensive annual financial report. This report must satisfy both generally accepted accounting principles and applicable legal requirements. A Certificate of Achievement is valid for a period of one year only. We believe that our current comprehensive annual financial report continues to meet the Certificate of Achievement Program’s requirements and we are submitting it to the GFOA to determine its eligibility for another certificate. This report would not have been possible without the determination and high standards of the entire staff of the Accounting Department. METRO wishes to thank all who contributed to this project. Robert K. Pfaff, Dean J. Harris Executive Director/ Director of Finance Secretary-Treasurer Assistant Secretary-Treasurer
2

3

METRO Regional Transit Authority
Board of Trustees and Administration as of December 31, 2010
Members of the Board of Trustees
Representing the City of Akron
Bernard Bear Saundra M. Foster Barbara O’Malley Elizabeth Britton James D Switzer
Open
Representing the County of Summit
Paul Shiplett Heather Heslop Licata
Scott C. Meyer
Representing the City of Barberton
David T. Incorvati
Representing the City of Cuyahoga Falls
Stephan Kremer
Representing the City of Stow
William Lutz
Administration
Robert K. Pfaff, Executive Director/Secretary-Treasurer Dean J. Harris, Director of Finance/Assistant Secretary-Treasurer
Charles R. Rector, Director of Operations Jim Miller, Director of Maintenance
Sue Rice, Director of Human Resources Molly Becker, Director of Communication & Marketing
Bambi Miller, Director of Customer Service Catondra Noye, Director of Planning
Mark Pry, Director of Safety & Security
4

5

SUMMIT COUNTY, OHIO
Summit County is located in the northeastern portion of the State of Ohio and was named because it was the highest point along the Erie-Ohio canal. The County consists of twenty-two municipalities (cities and villages) and nine townships. The seat of the county government is the City of Akron.
6

REPORTING ENTITY
General METRO’s reporting entity has been defined in accordance with Governmental Accounting Standards Board (GASB) Statement No. 14. Accordingly, the financial statements contained within this comprehensive annual financial report include only the accounts and transactions of METRO. A discussion of METRO’s reporting entity is included in Note 1 to the financial statements. METRO was created under Chapter 306 of the Ohio Revised Code by resolution of the City of Akron, Ohio adopted originally in 1972 and amended on January 28, 1991 to transform the three-city transit system to a countywide transit system. METRO’s service area covers 419.92 square miles in Summit County. Express service to downtown Cleveland, Ohio is also provided.
Operations and Funding Voters approved a ¼ of 1 percent continuous sales and use tax in November 1990 that permitted METRO to expand to a countywide service. In March 2008 the voters approved an additional ¼ of 1 percent continuous sales and use tax to maintain service levels. Facilities METRO has five facilities that are located at: * 416 Kenmore Boulevard - METRO’s main administration and maintenance facility. * 631 South Broadway – an intermodal facility located in downtown Akron that provides
ticket sales and customer information, passenger amenities, and the facility includes a Greyhound terminal. The facility also provides connection to Portage Area Regional Transportation Authority and the Stark Area Regional Transit Authority
* 2340 Romig Road –Transfer Center (Southwest Akron) * 465 Ghent Road – James Fisher Park and Ride lot (West Akron) * 2600 Creekside Drive – Park and Ride lot (Twinsburg) Services METRO provides fixed route and demand response (SCAT) service in the County of Summit, Ohio and Express Service into downtown Cleveland, Ohio.
Management, Board of Trustees METRO is managed by a Board of Trustees, which is vested by Ohio law with the powers necessary to manage METRO. The legislation and agreements establishing METRO provide for a twelve-member board serving three-year terms. The Board members are appointed by five different governmental agencies. The City of Akron has six seats, the County of Summit has three, and the cities of Barberton, Cuyahoga Falls and Stow have one each.
7

Administration The administration of METRO, subject to the policies and supervision of its Board of Trustees, is directed by an Executive Director. The Executive Director is under contract to the Board of Trustees. The Executive Director selects the remaining senior administrative staff. An organizational chart, which depicts the key functional responsibilities, is shown on page 5 of this Introductory Section.
ECONOMIC CONDITION AND OUTLOOK
General Summit County (METRO’s primary service area) is located in northeast Ohio, and the City of Akron is located near the center of the county and is the county sear. The Primary Akron Metropolitan Statistical Area (PMSA) consists of Summit and Portage Counties. The, 2000 PMSA population was 694,960. Summit County represents 78% of the two counties total. Summit County is served by diversified transportation facilities. Interstate I-77 runs north and south through the County while I-76 crosses east and west through the County. The Ohio Turnpike crosses the northern portion of the county. A total of five interstate highways, one U.S. highway and seventeen state highways are located in the County. The Summit County unemployment rate for 2010 was 9.92%, compared with a national average of 9.6%. Once known as the “Rubber Capital of the World” Akron has moved forward into the world of liquid crystal and polymer research, development, and technology. More than 400 companies in the area are at work on one aspect or another of polymers, creating what is now referred to as the “Polymer Valley." The University of Akron supports the industry with both a College of Polymer Engineering and a specialized laboratory and research facility accessible by Akron area business partners. Population Population in METRO’s principal service area since 1960 has been as follows: YEAR AKRON SUMMIT COUNTY 1960 290,351 513,569 1970 275,425 553,371 1980 238,177 524,472
1990 223,019 514,990 2000 217,074 542,899 2010 (est) 199,110 541,781
8

Employment The following table shows comparative unemployment statistics for Summit County, the State of Ohio and the United States for the last five years:
Year Summit County Ohio U.S.
2006 5.2% 5.5% 4.6%2007 5.4% 5.6% 4.6%2008 9.2% 6.5% 5.8%2009 9.8% 10.2% 9.3%2010 9.9% 10.1% 9.6%
Average Unemployment Rates (last five years)
MAJOR INITIATIVES
Recent Developments Highlights of the 2010 year of operations include the following: * Completed the replacement of roofs for two bus storage barns. * Installed two solar arrays with a combined maximum production of 833 kilowatts. * updated the second floor offices with new skylights, walls and carpet. * Completed the second phase of the parking lot repaving. * Took delivery of ten 40-foot Gillig low floor diesel buses and METRO’s first diesel-
electric Hybrid bus. * Took delivery of twenty <30-foot demand response diesel buses. * Replaced four bus hoists in the maintenance garage. * Updated the computer system with new virtual servers, desktop computer, printers and
wireless access. * Added an addition 50 parking spaces to our James Fisher Park and Ride lot. * Replaced the backup generator. * Provided 4,798,745 line service passenger trips on METRO. * Provided 227,949 demand response passenger trips on SCAT.
Future Projects METRO continues to implement its current long-range plan. This plan was developed to provide METRO with a strategy for implementing capital and operational projects. The five-year portion of the long-range plan includes:
9

Continue the rehabilitation of the maintenance facilities, including replacing the bus servicing and bus washing building. Replace up to forty-nine 35 to 40 foot low floor buses. There are 6 forty foot and 6 thirty-five foot low floor diesel buses, 3 forty foot Hybrid buses and 26 forty foot low floor CNG buses scheduled for delivery in 2011. Replace up to seventy Paratransit buses; the next order of 10 is scheduled for delivery in 2011.
FINANCIAL INFORMATION
Internal Control Structure The management of METRO is responsible for establishing and maintaining an internal control structure designed to ensure that METRO’s assets are protected from loss, theft, or misuse. Its responsibility is also to ensure that accurate accounting data is compiled to allow for the preparation of financial statements in conformity with accounting principles generally accepted in the United States of America. In developing and evaluating METRO’s accounting system, emphasis is placed on the adequacy of internal controls. Internal accounting controls are designed to provide reasonable, but not absolute, assurance regarding the protection of assets against loss from unauthorized use or disposition, and the reliability of financial records used to prepare financial statements. The concept of “reasonable assurance” recognizes that the cost of the control should not exceed the benefits likely to be derived and that the evaluation of costs and benefits require estimates and judgments by management. All internal control evaluations occur within the above framework. Management believes that METRO’s internal accounting controls adequately safeguard assets and provide reasonable assurance of proper recording of financial transactions. Management also believes that the data, as presented herein, is accurate in all material respects, that it presents fairly the financial position, results of operations and cash flows of METRO, and that all disclosures necessary to enable the reader to obtain an understanding of METRO’s financial affairs have been included. Basis of Accounting METRO accounting records are maintained on the accrual basis. The activities are accounted for in a single enterprise (Proprietary-type) fund.
10

Budgetary Controls The annual accrual-basis operating budget and capital budget are proposed by METRO management and adopted by the Board of Trustees in a public meeting. The annual budget is prepared using overall guidelines established after consideration of METRO’s long-range financial plan. All capital and operating items exceeding $100,000 receive Board approval prior to purchase. The long-range plan, updated annually, projects sources over the next five years and establishes service levels and growth commensurate with such revenue limits. METRO maintains budgetary control by not permitting total operating expenses and expenditures for individual capital projects to exceed their appropriations without approval by the Board of Trustees. Management ensures that expenses and capital expenditures stay within the total appropriation. On a monthly basis, the Board reviews budget variations. It is the responsibility of each department to administer its operations in such a manner as to ensure that the use of funds is consistent with the goals and programs authorized by the Board of Trustees.
Financial Operating Results
Revenues METRO’s revenues are classified by source and described as shown below:
2010 2009 2008
Sales Tax $34,521,101 $33,616,287 $25,052,152Passenger Fares 4,004,439 3,758,642 4,745,301Federal Assistance 4,123,465 3,655,202 4,548,257State Assistance 829,767 1,003,295 1,017,883Interest Income 55,230 14,130 110,763Auxiliary Transportation Revenue 363,317 275,014 266,370Non-transportation Revenue 448,785 333,086 261,706
TOTAL $44,346,104 $42,655,656 $36,002,432
Revenue by Source
Sales Tax revenues increased over last year. This is a sales and use tax of ½ of 1% on all goods and services sold in Summit County. In 2008 the voters of Summit County approved an increase on the sales tax rate from ¼ to ½ percent. There is no limit on its duration. The additional sales tax collection began in July 2008.
11

Passenger fares are comprised of farebox revenues, tickets sales, special transit fares, a contract with the Department of Jobs and Family Services to provide transportation for TANF clients, and a contract with the Akron Board of Education. METRO also has additional contracts with local governmental agencies to provide Paratransit service. The increase in passenger fares in 2010 can be attributed to a decrease in use of discounted tickets and passes. In 2009 ridership dropped from 2008 which decreased farebox revenue. Federal assistance funds are received from the Federal Transit Administration for certain items that are classified as capital assistance. Capital assistance, as defined by the FTA, includes preventive maintenance, leases, planning, and other operating items that are part of capital projects. The level of funds received in 2010 was slightly higher compared to 2009 due to a decrease in funding for preventive maintenance. State assistance funds are received from the Ohio Department of Transportation for capital, Elderly and Handicapped one-half fare program, and fuel tax refunds. The amounts in 2010 were slightly lower compared to 2009 due to a decrease in state funding assistance. Auxiliary Transportation Revenue consists of advertising and miscellaneous revenue. Auxiliary revenue in 2010 was slightly higher compared to 2009. This was due to an increase in rates for advertising.
Non-Transportation Revenue consists primarily of revenue from the sales of obsolete assets, gain/loss from disposal of assets and all other miscellaneous revenue In 2010 there was increase compared to 2009 due to revenue from rental of space at METRO’s new Intermodal facility.
Operating Expenses
2010 2009 2008
Labor $14,808,947 $14,424,006 $12,809,410Fringe Benefits 9,359,814 8,463,897 8,086,016Materials and Supplies 5,676,943 5,405,463 5,519,828Services 2,331,548 2,342,761 1,307,801Utilities 573,273 582,685 536,138Casualty and Liability 1,264,872 975,060 850,567Taxes 250,354 229,918 218,819Purchased Transportation 1,209,177 1,057,824 1,147,559Interest Expense 24,072 19,050 44,784Miscellaneous 441,111 355,603 305,665
35,940,111$ 33,856,267$ 30,826,587$
Operating Expenses by Object Class
Total operating expenses, excluding depreciation, increased in 2010 by 6.15% and 9.83% in 2009. These increases in expenses are largely due to increases in wages, fringe benefits, liability insurance and services.
12
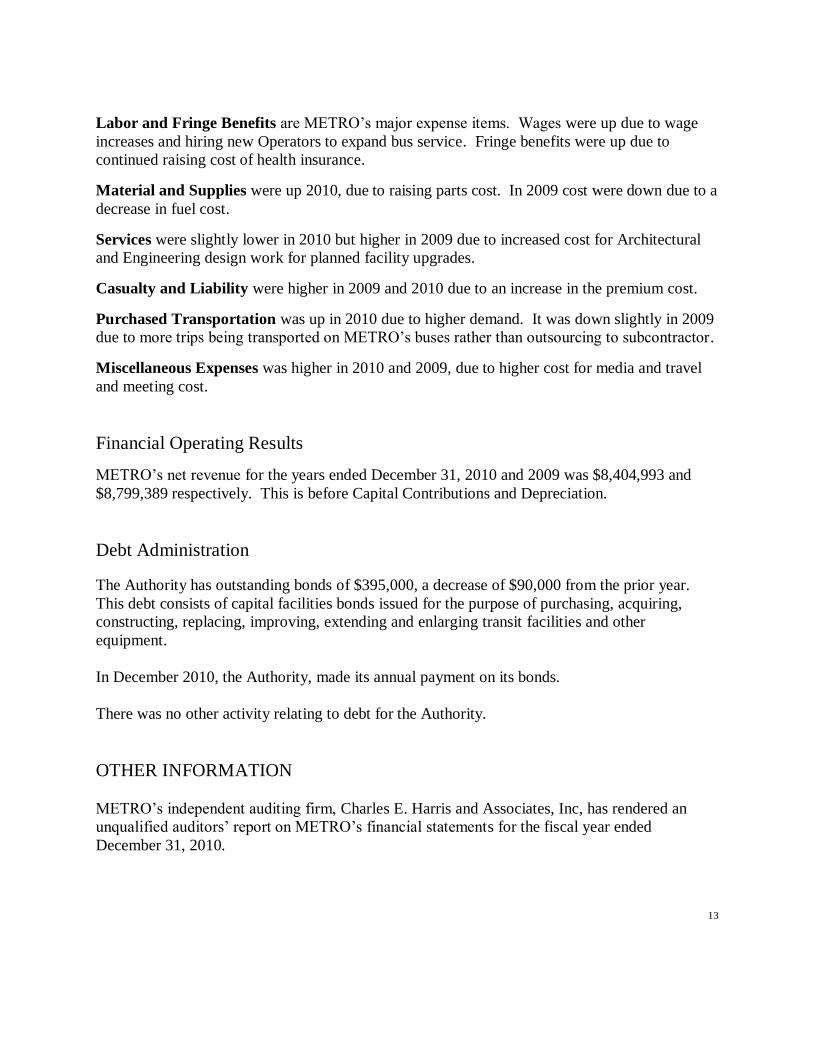
Labor and Fringe Benefits are METRO’s major expense items. Wages were up due to wage
increases and hiring new Operators to expand bus service. Fringe benefits were up due to
continued raising cost of health insurance.
Material and Supplies were up 2010, due to raising parts cost. In 2009 cost were down due to a
decrease in fuel cost.
Services were slightly lower in 2010 but higher in 2009 due to increased cost for Architectural
and Engineering design work for planned facility upgrades.
Casualty and Liability were higher in 2009 and 2010 due to an increase in the premium cost.
Purchased Transportation was up in 2010 due to higher demand. It was down slightly in 2009
due to more trips being transported on METRO’s buses rather than outsourcing to subcontractor.
Miscellaneous Expenses was higher in 2010 and 2009, due to higher cost for media and travel
and meeting cost.
Financial Operating Results
METRO’s net revenue for the years ended December 31, 2010 and 2009 was $8,404,993 and
$8,799,389 respectively. This is before Capital Contributions and Depreciation.
Debt Administration
The Authority has outstanding bonds of $395,000, a decrease of $90,000 from the prior year.
This debt consists of capital facilities bonds issued for the purpose of purchasing, acquiring,
constructing, replacing, improving, extending and enlarging transit facilities and other
equipment.
In December 2010, the Authority, made its annual payment on its bonds.
There was no other activity relating to debt for the Authority.
OTHER INFORMATION
METRO’s independent auditing firm, Charles E. Harris and Associates, Inc, has rendered an
unqualified auditors’ report on METRO’s financial statements for the fiscal year ended
December 31, 2010.
13
METRO also participates in the Federal single audit program, which consists of a single audit of
all federally funded programs administrated by METRO. As a requirement for continued
funding eligibility, participation in the single audit program is mandatory for most local
governments, including METRO. The single audit performed by Charles E. Harris and
Associates, Inc met the requirements set forth by the State of Ohio and the Federal Single Audit
Act of 1984 (as amended) and related OMB Circular A-133. The independent auditors’ report
issued thereon noted no instances of direct and material noncompliance by METRO with
applicable State or Federal laws or regulations for the fiscal year ended December 31, 2010.
Certificate of Achievement Program
It is the intention of METRO’s management to submit this and future CAFR’s for review under
the GFOA’s “Certificate of Achievement for Excellence in Financial Reporting” program.
Management believes the current report conforms to the program requirements and expects that
participation will result in continued improvement in METRO’s financial reporting in future
years.
14

This Page Left Intentionally Blank
15

This page intentionally left blank.

Financial Section
Board of Trustees
Mr. Stephan KremerMs. Heather Heslop Licata Mr. David Incorvati Mr. William Lutz
Financial Section – 2010 The Financial Section includes the Independent Auditor’s Report, Management’s Discussion and Analysis (MD&A), the Basic Financial Statements, Notes to the Financial Statements, other Required Supplementary Information (RSI) and other financial schedules.

Rockefeller Building 614 W Superior Ave Ste 1242 Cleveland OH 44113-1306
Charles E. Harris & Associates, Inc. Office phone - (216) 575-1630 Certified Public Accountants Fax - (216) 436-2411
REPORT OF INDEPENDENT ACCOUNTANTS Metro Regional Transit Authority Summit County 416 Kenmore Blvd. Akron, Ohio 44301 To the Board of Trustees: We have audited the accompanying financial statements of the Metro Regional Transit Authority, Summit County, Ohio (the Authority) as of and for the years ended December 31, 2010 and 2009, as listed in the table of contents. These financial statements are the responsibility of the Authority's management. Our responsibility is to express an opinion on these financial statements based on our audit. We conducted our audit in accordance with auditing standards generally accepted in the United States of America and the standards applicable to financial audits contained in Government Auditing Standards, issued by the Comptroller General of the United States. Those standards require that we plan and perform the audit to obtain reasonable assurance about whether the basic financial statements are free of material misstatement. An audit includes examining, on a test basis, evidence supporting the amounts and disclosures in the basic financial statements. An audit also includes assessing the accounting principles used and significant estimates made by management, as well as evaluating the overall financial statement presentation. We believe that our audit provides a reasonable basis for our opinion. In our opinion, the financial statements referred to above present fairly, in all material respects, the financial position of the Authority, as of December 31, 2010 and 2009, and the respective changes in financial position and cash flows for the years then ended in conformity with accounting principles generally accepted in the United States of America. Management’s discussion and analysis is not a required part of the basic financial statements, but is supplementary information the Governmental Accounting Standards Board requires. We have applied certain limited procedures, which consisted principally on inquiries of management regarding the methods of measurement and presentation of the required supplementary information. However, we did not audit the information and express no opinion on it.
In accordance with Government Auditing Standards, we have also issued our report dated June 21, 2011, on our consideration of the Authority’s internal control over financial reporting and our tests of its compliance with certain provisions of laws, regulations, contracts, grant agreements and other matters. While we did not opine on the internal control over financial reporting or on compliance, that report describes the scope of our testing of internal control over financial reporting and compliance and results of that testing. That report is an integral part of an audit performed in accordance with Government Auditing Standards. You should read it in conjunction with this report in considering the results of our audit.
15

Our audit was conducted for the purpose of forming opinions on the financial statements that collectively comprise the Authority’s basic financial statements. The introductory section and statistical tables are presented for the purpose of additional analysis and are not a required part of the financial statements. They have not been subjected to the auditing procedures applied in the audit of the basic financial statements, and accordingly, we express no opinion on them.
Charles E. Harris & Associates, Inc. June 21, 2011
16

METRO REGIONAL TRANSIT AUTHORITY
MANAGEMENT DISCUSSION AND ANALYSIS
Year Ended December 31, 2010
As financial management of the METRO Regional Transit Authority (the Authority”), we offer
readers of these financial statements this narrative overview and analysis of the financial
activities of the Authority for the fiscal year ended December 31, 2010. This discussion and
analysis is designed to assist the reader in focusing on the significant financial issues and
activities and to identify any significant changes in financial position. We encourage readers to
consider the information presented here in conjunction with the financial statements as a whole.
Financial Highlights
• The Authority has net assets of $73.1 million. These net assets result from the difference
between total assets of $78.1 million and total liabilities of $5.1 million.
• Current assets of $22.5 million primarily consist of non-restricted Cash and Cash Equivalents
of $14.2 million; Sales and Use Tax receivable of $4.7 million and long-term investments of
$1.7 million.
• Current liabilities of $4.4 million primarily consist of Accrued Compensation and taxes payable
of $1.6 million and accrued taxes of $1.1 million.
• Long-Term Debt consists mainly of bonds of $0.3 million or 5.9% of the total liabilities
balance of $5.1 million.
METRO’s overall financial position is in a very good position. With the passage of an additional
sales tax in 2008 METRO was able to increase revenue while maintaining a strong fiscal control
over cost. These two factors have allowed METRO to slightly increase service while also
rebuilding our fund balance.
Basic Financial Statements and Presentation
The financial statements presented by the Authority are the Balance Sheet, the Statement of
Revenues, Expenses and Changes in Net Assets and the Statement of Cash Flows. These
statements are presented using the economic resources measurement focus and the accrual basis
of accounting. The Authority is structured as single enterprise fund with revenues recognized
when earned and measurable, not when received. Expenses are recognized when they are
incurred, not when paid. Capital assets, except land, are capitalized and depreciated over their
estimated useful lives.
17

METRO REGIONAL TRANSIT AUTHORITY
MANAGEMENT DISCUSSION AND ANALYSIS (CONT’D)
Year Ended December 31, 2010
Basic Financial Statements and Presentation (Cont’d)
The Balance Sheet presents information on all the Authority’s assets and liabilities, with the
difference between the two reported as net assets. Over time, increases and decreases in net
assets may serve as a useful indicator of whether the financial position of the Authority is
improving or deteriorating. Net assets increase when revenues exceed expenses. Increases in
assets without a corresponding increase to liabilities results in increased net assets, which
indicate improved financial position.
The Statement of Revenues, Expenses and Changes in Net Assets presents information showing
how the Authority’s net assets changed during the year. This statement summarizes operating
revenues and expenses along with non-operating revenues and expenses. In addition, this
statement lists capital grant revenues received from federal, state and local governments.
The Statement of Cash Flows allows financial statement users to assess the Authority’s adequacy
or ability to generate sufficient cash flows to meet its obligations in a timely manner. The
statement is classified into four categories 1) Cash flows from operating activities, 2) Cash flows
from non-capital financing activities, 3) Cash flows from capital and related financing activities,
and 4) Cash flows from investing activities.
Notes to the Financial Statements
The notes provide additional information that is essential to a full understanding of the data
provided in the basic financial statements. The Notes to the Financial Statements can be found
on pages 27-39 of this report.
18

METRO REGIONAL TRANSIT AUTHORITY
MANAGEMENT DISCUSSION AND ANALYSIS (CONT’D)
Year Ended December 31, 2010
Financial Analysis of the Authority
Condensed Summary of Net Assets
2010 2009 2008
Current and other assets 22,570,054$ 20,000,698$ 12,106,464$
Capital assets, net of accumulated depreciation 55,623,863 50,222,003 47,922,867
Total assets 78,193,917 70,222,701 60,029,331
Current liabilities 4,395,874 3,631,215 3,819,495
Non-current liabilities 5,092,387 791,977 904,402
Total liabilities 9,488,261 4,423,192 4,723,897
Net assets:
Invested in capital assets, Net of related debt 55,228,863 49,737,003 47,352,867
Unrestricted net assets 17,872,667 16,062,506 7,952,567
Total net assets 73,101,530$ 65,799,509$ 55,305,434$
By far, the largest portion of the Authority’s net assets reflect investment in capital assets (e.g.,
line service and Paratransit buses, operating facilities including our Administrative/Maintenance
office, Intermodal transit Center, transfer center and our banked railroad property) less any
related debt used to acquire those assets that is still outstanding. The Authority uses these capital
assets to provide public transportation service for Summit County citizens. These assets are not
available to liquidate liabilities or to cover other spending.
19

METRO REGIONAL TRANSIT AUTHORITY
MANAGEMENT DISCUSSION AND ANALYSIS (CONT’D)
Year Ended December 31, 2010
Condensed Summary of Revenues, Expenses and Changes in Net Assets
2010 2009 2008
OPERATING REVENUES:
Passenger fares 4,004,439$ 3,758,642$ 3,867,029$
Advertising and concessions 363,317 275,014 266,370
Total Operating Revenues 4,367,756$ 4,033,656$ 4,133,399$
OPERATING EXPENSES
Labor 14,808,947$ 14,424,006$ 12,809,410$
Fringe benefits 9,359,814 8,463,897 8,086,016
Materials and supplies 5,676,943 5,405,463 5,519,828
Services 2,331,548 2,342,761 1,307,801
Utilities 573,273 582,685 536,138
Casualty and liability 1,264,872 975,060 850,567
Taxes 250,354 229,918 218,819
Purchased transportation service 1,209,177 1,057,824 1,147,559
Miscellaneous 441,111 355,603 305,665
Total Operating Expenses excluding depreciation 35,916,039$ 33,837,217$ 30,781,803$
(31,548,283)$ (29,803,561)$ (26,648,404)$
Depreciation Expense (6,237,556) (6,446,278) (5,937,844)
OPERATING LOSS (37,785,839)$ (36,249,839)$ (32,586,248)$
NON-OPERATING REVENUES (EXPENSES):
Sales tax revenue 34,521,101$ 33,616,287$ 25,052,152$
Federal operating grants and reimbursements 4,123,465 3,655,202 4,548,257
State operating grants and special fare assistance 829,767 1,003,295 1,017,883
Student fare and other assistance 1,099,910 1,033,958 878,272
Interest income 55,230 14,130 110,763
Interest expense (24,072) (19,050) (44,784)
Gain (Loss) from disposal of assets 6,990 22,533 8,809
Other 441,795 310,553 252,897
Total Non-Operating Revenues - net 41,054,186$ 39,636,908$ 31,824,249$
CAPITAL GRANT REVENUE
Federal Capital Grant 6,059,733$ 7,107,006$ 10,742,855$
State Capital Grant - - 1,534,616
Local Capital Grant - - 2,235,000
Total Capital Grants 6,059,733$ 7,107,006$ 14,512,471$
CHANGE IN NET ASSETS 9,328,080 10,494,075 13,750,472
Net Assets, Beginning Balance 65,799,509$ 55,305,434$ 41,554,962$
Prior Period Adjustment (2,026,059) - -
Net Assets, Ending Balance 73,101,530$ 65,799,509$ 55,305,434$
OPERATING LOSS BEFORE DEPRECIATION
20

METRO REGIONAL TRANSIT AUTHORITY
MANAGEMENT DISCUSSION AND ANALYSIS (CONT’D)
Year Ended December 31, 2010
The Authority’s operating revenues increased $334,100 to $4.4 million in 2010. This 8.2%
increase is a result from an increase in passenger fares. While 2009 had a decrease of $99,743
from a decrease in passenger fares. Operating expenses, excluding depreciation, increased by
$2.1 million in 2010 and $3.1 million in 2009. The main increase in both years came from
increases in wages, benefits and services. Depreciation expense decreased by $0.2 million in
2010 and increased by $.5 million in 2009.
The increase in non-operating revenues of $1.4 million for 2010 and $7.8 million in 2009 is
related to the increase in collection of sales tax compared to presiding years.
Condensed Summary of Cash Flows
Net cash used for operating activities increased by $93,992 in 2010 as a result of an increase in
expenses for wages and benefits a decrease in expenses for goods and services. In 2009 cash
flow operating activities increased by $3.7 million due to increased cost for wages, benefits and
the cost goods and services Net cash from non-capital activity decreased by $1.3 million in
2010 due to increased federal grant assistance, while they increased by $7.6 in 2009. Cash and
cash equivalents increased in 2010 by $2.2 million and increased in 2009 by $9.8 million.
CASH FLOWS FROM OPERATING ACTIVITIES: 2010 2009 2008
Cash received from customers 4,028,244$ 3,634,718$ 4,360,468$
Cash received from others for miscellaneous services 805,112 275,014 252,897
Cash payments to suppliers for goods and services (10,991,962) (19,817,621) (18,305,063)
Cash payments to employees for services (24,088,330) (14,245,055) (12,739,162)
Net cash used in operating activities (30,246,936) (30,152,944) (26,430,860)
CASH FLOWS FROM NONCAPITAL FINANCING ACTIVITIES
Sales taxes received 34,521,101 35,774,513 27,980,733
Operating grants and other assistance received 5,681,513 5,692,455 5,899,432
Net cash provided by non-capital financing activities 40,202,614 41,466,968 33,880,165
CASH FLOWS FROM CAPITAL AND RELATED FINANCING
ACTIVITIES:
Capital grants received 6,059,733 7,107,006 7,877,777
Acquisition and construction of capital assets (13,782,301) (8,569,607) (15,379,598)
Principal paid on bonds (90,000) (85,000) (80,000)
Interest paid on bonds (11,662) (19,050) (44,784)
Net cash provided by capital and related financing activities (7,824,230) (1,566,651) (7,626,605)
CASH FLOWS FROM INVESTING ACTIVITIES:
Interest received from investments 55,230 14,130 110,763
Net cash provided by investing activities 55,230 14,130 110,763
NET INCREASE IN CASH AND CASH EQUIVALENTS 2,186,678 9,761,503 (66,537)
CASH AND CASH EQUIVALENTS, BEGINNING OF YEAR 12,055,965 2,294,462 2,360,999
CASH AND CASH EQUIVALENTS, END OF YEAR 14,242,643$ 12,055,965$ 2,294,462$
21

METRO REGIONAL TRANSIT AUTHORITY
MANAGEMENT DISCUSSION AND ANALYSIS (CONT’D)
Year Ended December 31, 2010
Capital Asset and Debt Administration
Capital Assets
The Authority’s investment in capital assets amounts to $55.6 million, net of accumulated
depreciation as of December 31, 2010, an increase of $5.4 million compared to 2009. Capital
assets include land and land improvements, revenue producing and service equipment, buildings
and structures, shop equipment, office furnishings and computer equipment
Additional information on capital asset activity can be found in note 5 to the financial statements.
Long-term Debt
The Authority has outstanding bonds of $395,000 a decrease of $90,000 from the prior year. This
debt consists solely of capital facilities bonds issued for the purpose of purchasing, acquiring,
constructing, replacing, improving, extending and enlarging transit facilities and other
equipment. The bonds were authorized to be issued and sold under resolutions passed by the
Board of Trustees. The bonds are general obligations of the Authority. During 2010 the
Authority had no new debt activity except for payments made for interest and principal.
Additional information on long-term debt activity can be found in note 4 to the financial
statements.
Requests for Information
This financial report is designed to provide a general overview of the Authority’s finances for all
those with an interest in its finances. Questions concerning any of the information provided in
this report or requests for additional financial information should be addressed to the Director of
Finance, METRO Regional Transit Authority, 416 Kenmore Boulevard, Akron, OH 44301.
22

ASSETS 2010 2009
CURRENT ASSETS:
Cash and cash equivalents 14,242,643$ 12,055,965$
Investments 1,680,235 1,151,810
Receivables:
Sales taxes 4,689,846 4,707,015
Trade and other 475,368 499,173
Materials and supplies inventory 822,327 1,036,161
Prepaid expenses 583,335 446,336
Total current assets 22,493,754 19,896,460
PROPERTY, FACILITIES AND EQUIPMENT
Land 3,765,689 3,765,689
Buildings and building improvements 40,287,567 33,796,360
Infrastructure 4,383,657 3,895,436
Right-of-ways 10,653,206 10,653,206
Transportation equipment 44,088,497 40,619,095
Other equipment 8,027,063 9,449,520
Total 111,205,679 102,179,306
Less: Accumulated depreciation (55,581,816) (51,957,303)
Property, facilities and equipment - net 55,623,863 50,222,003
OTHER ASSETS
Other assets 76,300 104,238
Total non-current assets 55,700,163 50,326,241
TOTAL ASSETS 78,193,917$ 70,222,701$
(Continued)
See accompanying notes to the financial statements.
METRO REGIONAL TRANSIT AUTHORITY
STATEMENT OF NET ASSETS
DECEMBER 31, 2010
23

LIABILITIES AND NET ASSETS 2010 2009
CURRENT LIABILITIES:
Bonds payable - current maturities 95,000$ 90,000$
Accrued interest payable 1,941 1,194
Accounts payable 962,635 425,629
Accrued payroll 1,693,648 1,374,460
Accrued payroll taxes 1,122,469 1,110,872
Other liabilities 520,181 629,060
Total current liabilities 4,395,874$ 3,631,215$
NONCURRENT LIABILITIES:
Bonds payable 300,000$ 395,000$
Deferred Capital grant 1,000 1,000
Deferred Revenue 395,513 395,977
Total noncurrent liabilities 696,513$ 791,977$
Total liabilities 5,092,387$ 4,423,192$
NET ASSETS:
Invested in Capital Assets, Net of Related Debt 55,228,863$ 49,737,003$
Unrestricted 17,872,667 16,062,506
Total net assets 73,101,530 65,799,509
TOTAL LIABILITIES AND NET ASSETS 78,193,917$ 70,222,701$
See accompanying notes to the financial statements.
METRO REGIONAL TRANSIT AUTHORITY
STATEMENT OF NET ASSETS (Continued)
DECEMBER 31, 2010
24

2010 2009
OPERATING REVENUES:
Passenger fares 4,004,439$ 3,758,642$
Advertising and concessions 363,317 275,014
Total operating revenues 4,367,756$ 4,033,656$
OPERATING EXPENSES
Labor 14,808,947$ 14,424,006$
Fringe benefits 9,359,814 8,463,897
Materials and supplies 5,676,943 5,405,463
Services 2,331,548 2,342,761
Utilities 573,273 582,685
Casualty and liability 1,264,872 975,060
Taxes 250,354 229,918
Purchased transportation service 1,209,177 1,057,824
Miscellaneous 441,111 355,603
Total operating expenses excluding depreciation 35,916,039$ 33,837,217$
OPERATING LOSS BEFORE DEPRECIATION EXPENSE (31,548,283) (29,803,561)
DEPRECIATION EXPENSE:
On assets acquired with capital grants 6,215,570$ 6,432,232$
On other assets 21,986 14,046
Total depreciation expense 6,237,556 6,446,278
OPERATING LOSS (37,785,839)$ (36,249,839)$
NON-OPERATING REVENUES (EXPENSES):
Sales tax revenue 34,521,101$ 33,616,287$
Federal operating grants and reimbursements 4,123,465 3,655,202
State operating grants, reimbursements,
and special fare assistance 829,767 1,003,295
Student fare and other assistance 1,099,910 1,033,958
Interest income 55,230 14,130
Interest expense (24,072) (19,050)
Gain (Loss) from disposal of assets 6,990 22,533
Other 441,795 310,553
Total Non-Operating Revenues - net 41,054,186$ 39,636,908$
NET INCOME/(LOSS) BEFORE CAPITAL CONTRIBUTIONS 3,268,347 3,387,069
CAPITAL CONTRIBUTIONS 6,059,733 7,107,006
Increase (decrease) in Net Assets 9,328,080$ 10,494,075$
Net Assets, Beginning Balance 65,799,509$ 55,305,434$
Prior Period Adjustment (2,026,059) -
Net Assets, Ending Balance 73,101,530$ 65,799,509$
See accompanying notes to the financial statements.
METRO REGIONAL TRANSIT AUTHORITY
STATEMENT OF REVENUES, EXPENSES AND CHANGES IN NET ASSETS
FOR THE YEAR ENDED DECEMBER 31, 2010
25

2010 2009
CASH FLOWS FROM OPERATING ACTIVITIES:
Cash received from customers 4,028,244$ 3,634,718$
Cash received from others for miscellaneous services 805,112 275,014
Cash payments to suppliers for goods and services (10,991,962) (19,817,621)
Cash payments to employees for services (24,088,330) (14,245,055)
Net cash used in operating activities (30,246,936)$ (30,152,944)$
CASH FLOWS FROM NONCAPITAL FINANCING ACTIVITIES
Sales taxes received 34,521,101$ 35,774,513$
Operating grants and other assistance received 5,681,513 5,692,455
Net cash provided by non-capital financing activities 40,202,614$ 41,466,968$
CASH FLOWS FROM CAPITAL AND RELATED FINANCING
ACTIVITIES:
Capital grants received 6,059,733$ 7,107,006$
Acquisition and construction of capital assets (13,782,301) (8,569,607)
Principal paid on bonds (90,000) (85,000)
Interest paid on bonds (11,662) (19,050)
Net cash provided (used) by capital and related financing activities (7,824,230)$ (1,566,651)$
CASH FLOWS FROM INVESTING ACTIVITIES:
Interest received from investments 55,230$ 14,130$
Net cash provided by investing activities 55,230$ 14,130$
NET INCREASE IN CASH AND CASH EQUIVALENTS 2,186,678$ 9,761,503$
CASH AND CASH EQUIVALENTS, BEGINNING OF YEAR 12,055,965 2,294,462
CASH AND CASH EQUIVALENTS, END OF YEAR 14,242,643$ 12,055,965$
RECONCILIATION OF OPERATING LOSS TO NET CASH USED
IN OPERATING ACTIVITIES:
Operating loss (37,785,839)$ (36,249,839)$
Adjustment to reconcile operating loss to net cash used
in operating activities:
Depreciation 6,237,556 6,446,278
Cash received from others for miscellaneous services 441,795 310,553
Change in assets and liabilities:
Accounts receivable-trade 23,805 (123,924)
Materials and supplies inventory 213,834 58,053
Prepaid expenses (136,999) (409,305)
Accounts payable 537,006 4,895
Accrued payroll 319,188 (332,478)
Accrued payroll taxes 11,597 106,275
Other current liabilities (108,879) 36,548
NET CASH USED IN OPERATING ACTIVITIES (30,246,936)$ (30,152,944)$
See accompanying notes to the financial statements.
METRO REGIONAL TRANSIT AUTHORITY
STATEMENT OF CASH FLOWS
FOR THE YEAR ENDED DECEMBER 31, 2010
26

METRO REGIONAL TRANSIT AUTHORITY
NOTES TO FINANCIAL STATEMENTS
For the Year Ended December 31, 2010
1. ORGANIZATION AND SIGNIFICANT ACCOUNTING POLICIES
Organization – METRO Regional Transit Authority (“METRO” or the “Authority”) was
created pursuant to Sections 306.30 through 306.71 of the Ohio Revised Code for the
purpose of providing public transportation in Summit County, Ohio. As a political
subdivision it is distinct from, and is not an agency of, the State of Ohio or any other local
governmental unit. The Authority is not subject to federal or state income taxes.
Under Ohio law, the Authority is authorized to levy a sales and use tax for transit purposes,
including both capital improvement and operating expenses, at the rate of .25 percent, .5
percent, 1 percent, or 1.5 percent if approved by a majority of the electors residing within the
territorial boundaries of the Authority. Such a sales and use tax is in addition to the sales and
use taxes levied by the State of Ohio and summit County. During 1990, the voters of
Summit County approved a 0.25 percent sales and use tax with no limit on its duration. In
2008 the voters of Summit County approved an additional 0.25 percent sales and use tax with
no limit on its duration for a total of 0.5 percent.
The Authority is managed by a 12-member Board of Trustees and provides virtually all mass
transportation within Summit County.
Reporting Entity – The Authority has adopted the provisions of Statement No. 14 of the
Governmental Accounting Standards Board (“GASB”) regarding the definition of the
financial reporting entity. Accordingly, the accompanying financial statements include only
the accounts and transactions of the Authority. Under the criteria specified in Statement No.
14, the Authority has no component units nor is it considered a component unit of any other
entity.
These conclusions regarding the financial reporting entity are based on the concept of
financial accountability. The Authority is not financially accountable for any other
organization nor is any other organization accountable for the Authority. This is evidenced
by the fact that the Authority is a legally and fiscally separate and distinct organization under
the provisions of the Ohio Revised Code.
Basis of Accounting – The Authority follows the accrual basis of accounting, whereby
revenues and expenses are recognized in the period earned or incurred. The measurement
focus is on determination of net income, financial position and cash flows. All transactions
are accounted for in a single enterprise fund.
27

METRO REGIONAL TRANSIT AUTHORITY
NOTES TO FINANCIAL STATEMENTS (CONT’D)
For the Year Ended December 31, 2010
1. ORGANIZATION AND SIGNIFICANT ACCOUNTING POLICIES (Cont’d)
In accordance with Statement No. 20 of the GASB, “Accounting and Financial Reporting for
Proprietary Funds and Other Governmental Entities that use Proprietary Fund Accounting,”
the Authority has elected not to apply the provisions of the Statements and Interpretations of
the Financial Accounting Standards Board issued after November 30, 1989.
Nonexchange Transactions - The Authority has also complied with the provisions of
Statement No. 33 of the Governmental Accounting Standards Board (“GASB”) regarding the
Accounting and Financial Reporting for Nonexchange Transactions. This statement requires
that capital contributions be recognized as revenue. Accordingly, during the years ended
December 31, 2010 and 2009, $6,059,733 and $7,107,006 in capital contributions were
recognized as revenue in the Statement of Revenues, Expenses and Changes in Net Assets
for the Authority.
In 2005, the Authority implemented a financial reporting model, as required by the
provisions of the Governmental Accounting Standards Board (GASB) Statement No. 34,
Basic Financial Statements and Management’s Discussion and Analysis for State and Local
Governments, as amended and interpreted.
The Authority will continue applying all applicable pronouncements issued by the GASB.
Cash and Cash Equivalents – For purposes of the statement of cash flows, the Authority
considers all highly liquid investments (including restricted assets) with a maturity, at date of
purchase, of three months or less to be cash equivalents. Cash and cash equivalents are
carried at cost, which approximates fair value.
Investments – The Authority’s investments are stated at fair value.
Materials and Supplies Inventory – Materials and supplies inventory is stated at cost (average
cost method). Inventory generally consists of maintenance parts and supplies for rolling
stock and other transportation equipment.
28

METRO REGIONAL TRANSIT AUTHORITY
NOTES TO FINANCIAL STATEMENTS (CONT’D)
For the Year Ended December 31, 2010
1. ORGANIZATION AND SIGNIFICANT ACCOUNTING POLICIES (Cont’d)
Use of Estimates – The preparation of financial statements in conformity with accounting
principles generally accepted in the United States of America requires management to make
estimates and assumptions that affect reported amounts of assets, liabilities, revenues and
expenses, at and during the reported period. Actual results could differ from those estimates.
Property, Facilities and Equipment – Property, facilities and equipment are stated at historical
cost. The cost of maintenance and repairs is charged to operations as incurred. Property over
$5,000 is capitalized.
Depreciation is computed using the straight-line method over the estimated useful lives of the
respective assets, as follows:
Description Years
Building and Building Improvements 20-40
Infrastructure 20-30
Transportation equipment 5-12
Other equipment 3-10
Net Assets - Equity displayed in three components as follows:
Invested in Capital Assets, Net of Related Debt – This consists of capital assets, net of
accumulated depreciation, less the outstanding balances of any bonds, notes, or other
borrowings that are attributable to the acquisition, construction, or improvements of
those assets.
Restricted – This consists of net assets that are legally restricted by outside parties or by
law through constitutional provisions or enabling legislation. When both restricted and
unrestricted resources are available for use, generally it is the Authority’s policy to use
restricted resources first, then unrestricted resources when they are needed.
Unrestricted – This consists of net assets that do not meet the definition of “restricted”
or “invested in capital assets, net of related debt.”
29

METRO REGIONAL TRANSIT AUTHORITY
NOTES TO FINANCIAL STATEMENTS (CONT’D)
For the Year Ended December 31, 2010
1. ORGANIZATION AND SIGNIFICANT ACCOUNTING POLICIES (Cont’d)
Classifications of Revenues
The Authority has classified its revenues as either operating or non-operating. Operating
revenue includes activities that have the characteristics of exchange transactions including
passenger fares, advertising, and concession revenue. Non-operating revenue includes
activities that have the characteristics of non-exchange transactions, such as sales tax
proceeds and most federal, state, and local grants and contracts.
Recognition of Revenue and Receivables
The Federal Transit Administration (“FTA”) and the Ohio Department of Transportation
(“ODOT”) provide financial assistance and make grants directly to the Authority for
operations and acquisition of property and equipment. Operating grants and special fare
assistance awards made on the basis of entitlement periods are recorded as grant receivables
and revenue over the entitlement period.
Capital grants for the acquisition of property and equipment (reimbursement type grants) are
recorded as revenue when the expenditure has been made and the revenue is available.
Capital grant funds received in advance of project costs being incurred are deferred.
Compensated Absences – The Authority accrues vacation as earned by its employees.
Because rights to sick pay do not vest, the Authority recognizes such costs when they are
incurred.
30

METRO REGIONAL TRANSIT AUTHORITY
NOTES TO FINANCIAL STATEMENTS (CONT’D)
For the Year Ended December 31, 2010
2. DEPOSITS AND INVESTMENTS
The investment and deposit of Authority monies are governed by the provisions of the Ohio
Revised Code. In accordance with these statutes, only banks located in Ohio and domestic
building and loan associations are eligible to hold public deposits. The statutes also permit
the Authority to invest in certificates of deposit, savings accounts, money market accounts,
the State Treasurer’s investment pool (“STAROhio”), and obligations of the United States
government and certain agencies thereof. The Authority may also enter into repurchase
agreements with eligible depository or any eligible security dealer who is a member of the
National Association of Securities Dealer for a period not exceeding 30 days.
Deposits
Custodial credit risk is the risk that, in the event of a bank failure, the Authority’s deposits
may not be returned. According to state law, public depositories must give security for all
public funds on deposit in excess of those funds that are insured by the federal deposit
insurance corporation (FDIC) or by any other agency or instrumentality of the federal
government. These institutions may either specifically collateralize individual accounts in
lieu of amounts insured by the FDIC, or may pledge a pool of government securities valued
at least 105% of the total value of public monies on deposit at the institution. The
Authority’s policy is to deposit money with financial institutions that are able to abide by
laws governing insurance and collateral of public funds.
The Authority is prohibited from investing in any financial instrument, contract, or obligation
whose value or return is based upon or linked to another asset or index, or both, separate
from the financial instruments, contract, or obligation itself (Commonly known as a
“derivative”). The Authority is also prohibited from investing in reverse repurchase
agreements.
At December 31, 2010, the carrying amount of the Authority’s deposits was $5,015,820 and
the bank balance was $5,089,852, $257,785 of which was covered by the FDIC and
$4,832,067 of which was uninsured and uncollateralized as defined by the GASB. At
December 31, 2009, the carrying amount of the Authority’s deposits was $4,934,066 and the
bank balance was $5,080,638, $258,786 of which was covered by the FDIC and $4,821,582
of which was uninsured and uncollateralized as defined by the GASB. The uncollateralized
deposits were, however, covered by a pledged collateral pool not held in the Authority’s
name, as permitted under Ohio law. At December 31, 2010, the Authority had $1,825 in petty
cash. 31

METRO REGIONAL TRANSIT AUTHORITY
NOTES TO FINANCIAL STATEMENTS (CONT’D)
For the Year Ended December 31, 2010
3. DEPOSITS AND INVESTMENTS (Cont’d)
Investments
Investments at December 31, 2010 are summarized as follows:
Investment Percentage
Rating Fair Maturities Of Total
Moody Description Value In Months (0-6) Investment
Aaa Repurchase Agreements $9,225,000 $9,225,000 85%
Aaa Money Market $186,879 $186,879 2%
Aaa U.S. Treasury Bonds 437,795 75,094 4%
Aaa U.S. Treasury Notes 805,444 437,622 7%
Aaa FNMA 250,115 0 2%
$10,905,233 $9,924,595 100%
Investments at December 31, 2009 are summarized as follows:
Investment Percentage
Rating Fair Maturities Of Total
Moody Description Value In Months (0-6) Investment
Aaa Repurchase Agreements $7,393,524 $7,393,524 89%
Aaa U.S. Treasury Bonds 386,090 127,162 5%
Aaa U.S. Treasury Notes 492,270 335,007 6%
$8,271,884 $7,855,693 100%
Based on the criteria described in GASB Statement No. 40, “Deposit and Investment Risk
Disclosures”.
32

METRO REGIONAL TRANSIT AUTHORITY
NOTES TO FINANCIAL STATEMENTS (CONT’D)
For the Year Ended December 31, 2010
3. DEPOSITS AND INVESTMENTS (Cont’d)
Custodial credit risk: an investment is the risk that in the event of failure of the
counter-party, the Authority will not be able to recover the value of its investments or
collateral securities that are in the possession of an outside party. The Authority’s
$9,225,000 investments in repurchase agreements are held in the Authority’s name by
its custodian (agent).
Interest rate risk: the Authority has no investment policy that addresses interest rate
risk. State statute requires that an investment mature within five years from the date
of purchase, unless matched to a specific obligation or debt of the Authority, and that
an investment must be purchased with the expectation that it will be held to maturity.
Credit risk: the possibility that an issuer or other counter-party to an investment will
not fulfill its obligation. The Authority’s investment policy limits investments to,
among others, obligations of the U.S. government or agencies thereof.
4. BONDS AND LOAN PAYABLE
Average Balance Balance
Interest January December Due Within
Issue Rate 1, 2010 Additions Reductions 31, 2010 One Year
General obligations
bonds 20044.03% $ 485,000 -$ $ 90,000 $ 395,000 $ 95,000
In June 2004, the Authority issued general obligation bonds, which are tax-exempt
and have annual maturity dates through 2014. These bonds were used to refinance
bonds issued in June 1992 and to provide additional funds to cover the local share for
capital projects. The proceeds were deposited into a trust fund for the purpose paying
the 1992 bonds and, therefore are excluded from the financial statements. The
refinance resulted in an accounting gain of $39,948 and an economic gain of $30,090.
33

METRO REGIONAL TRANSIT AUTHORITY
NOTES TO FINANCIAL STATEMENTS (CONT’D)
For the Year Ended December 31, 2010
4. BONDS AND LOAN PAYABLE (Cont’d)
The annual requirements to pay principal and interest on the general obligation bonds
and loan outstanding at December 31, 2010 are as follows:
Principal Interest
2011 $ 95,000 $ 19,275
2012 95,000 15,000
2013 100,000 10,250
2014 105,000 5,250
Total $ 395,000 $ 49,775
5. CAPITAL ASSETS
Capital asset activity for the year ended December 31, 2010 is as follows:
Balance Balance
Description 1/1/2010 Additions Disposals 12/31/2010
Capital Assets Not Being Depreciated
Land $ 3,765,689 $ - $ - $ 3,765,689
Right-of-ways 10,653,206 - - 10,653,206
Total Capital Assets Not Being
Depreciated 14,418,895 - - 14,418,895
Capital Assets Being Depreciated:
Building & Building Improvements 33,796,360 6,741,231 (250,024) 40,287,567
Infrastructure 3,895,436 488,221 - 4,383,657
Transportation Equipment 40,619,096 5,753,036 (2,283,635) 44,088,497
Other Equipment 9,449,521 799,813 (2,222,271) 8,027,063
Total Capital Assets Being
Depreciated 87,760,413 13,782,301 (4,755,930) 96,786,784
Less Accumulated Depreciation:
Building & Building Improvements 18,783,983 1,523,430 (237,405) 20,070,008
Infrastructure 2,190,199 376,374 - 2,566,573
Transportation Equipment 24,631,059 3,653,604 (2,138,235) 26,146,428
Other Equipment 6,352,064 684,148 (237,405) 6,798,807
Total Accumulated Depreciation 51,957,305 6,237,556 (2,613,045) 55,581,816
Total Capital Assets Being
Depreciated, Net 35,803,108 41,204,968
Total Capital Assets, Net 50,222,003$ 55,623,863$
34

METRO REGIONAL TRANSIT AUTHORITY
NOTES TO FINANCIAL STATEMENTS (CONT’D)
For the Year Ended December 31, 2010
6. PURCHASED TRANSPORTATION SERVICES
During 2010 and 2009, the Authority had a contract with a local taxi company to
provide transit services within Summit County for elderly and handicapped persons.
Expenses under this contract amounted to $1,209,177 and $1,057,824, in 2010 and
2009. All passenger fares related to these transit services are collected by the
Authority and recorded as revenue.
7. EMPLOYEE RETIREMENT PLANS
The Authority participates in the Ohio Public Employees Retirement System
(OPERS). OPERS administers three separate pension plans. The Traditional Pension
Plan is a cost-sharing, multiple-employer defined benefit pension plan. The Member
Directed Plan is a defined contribution plan in which the member invests both
member and employer contributions (employer contributions vest over five years at
20 percent per year). Under the Member-Directed Plan, members accumulate
retirement assets equal to the value of member and (vested) employer contributions
plus any investment earnings. The Combined Plan is a cost-sharing, multiple
employer defined benefit pension plan that has elements of both a defined benefit and
a defined contribution plan. Under the Combined Plan, employer contributions are
invested by the retirement system to provide a formula, retirement benefit similar in
nature to, but less than, the Traditional Pension Plan benefit. Member contributions,
the investment of which is self-directed by the members, accumulate retirement assets
in a manner similar to the Member-Directed Plan.
OPERS provides retirement, disability, survivor and death benefits and annual cost
of-living adjustments to members of the Traditional Pension and the Combined plans.
Members of the Member-Directed Plan do not qualify for ancillary benefits.
Authority to establish and amend benefits is provided in Chapter 145 of the Ohio
Revised Code. OPERS issues a stand-alone financial report that may be obtained by
writing to OPERS, 277 E. Town Street, Columbus, OH 43215-4642 or by calling
(614) 222-5601 or (800) 222-7377.
35

METRO REGIONAL TRANSIT AUTHORITY
NOTES TO FINANCIAL STATEMENTS (CONT’D)
For the Year Ended December 31, 2010
7. EMPLOYEE RETIREMENT PLANS (Cont’d)
The Ohio Revised Code provides statutory authority for member and employer
contributions. For the year ended December 31, 2010, the members of all three plans
were required to contribute 10.00 percent of their annual covered salaries. The
Authority’s contribution rate of 14.00 percent was allocated to fund pension benefits
for members of the Traditional Plan and the Combined Plan. The pension allocation
for the Traditional Plan was 8.50 percent from January 1 through February 28, 2010
and 9.00 percent from March 1 through December 31, 2010. The pension allocation
for the Combined Plan was 9.27 percent from January 1 through February 28, 2010
and 9.77 percent from March 1 through December 31, 2010. The Authority’s
required pension contributions for the Traditional Pension and Combined plans for
the years ended December 31, 2010, 2009, and 2008 were $2,312,597, $2,201,561,
and $2,055,486, respectively; 100 percent has been contributed for 2010, 2009 and
2008.
Plan Description - The Ohio Public Employees Retirement System (OPERS)
administers three separate pension plans; the Traditional Pension Plan is a cost
sharing, multiple-employer defined benefit pension plan; the Member-Directed Plan
is a defined contribution plan; and the Combined Plan is a cost-sharing, multiple
employer defined pension plan that has elements of both a defined benefit and a
defined contribution plan.
OPERS maintains a cost-sharing, multiple-employer defined benefit postemployment
healthcare plan, which includes a medical plan, prescription drug program, and
Medicare Part B premium reimbursement, to qualifying members of both the
Traditional Pension and the Combined plans. Members of the Member Directed Plan
do not qualify for ancillary benefits, including post-employment health care coverage.
In order to qualify for post-employment health care coverage, age and service retirees
under the Traditional Pension and Combined plans must have ten or more years of
qualifying Ohio service credit. Health care coverage for disability benefit recipients
and qualified survivor benefit recipients is available. The health care coverage
provided by OPERS meets the definition of an Other Post-Employment Benefit
(OPEB) as described is GASB Statement No. 45.
36

METRO REGIONAL TRANSIT AUTHORITY
NOTES TO FINANCIAL STATEMENTS (CONT’D)
For the Year Ended December 31, 2010
7. EMPLOYEE RETIREMENT PLANS (Cont’d)
The Ohio Revised Code permits, but does not mandate, OPERS to provide OPEB
benefits to its eligible members and beneficiaries. Authority to establish and amend
benefits is provided in Chapter 145 of the Ohio Revised Code. OPERS issues a
stand-alone financial report that may be obtained by writing to OPERS, 277 E. Town
Street, Columbus, OH 43215-4642 or by calling (614) 222-5601 or (800) 222-7377.
Funding Policy - The Ohio Revised Code provides the statutory authority requiring
public employers to fund post-retirement health care through their contributions to
OPERS. A portion of each employer’s contribution to OPERS is set aside for the
funding of post-retirement health care benefits. The 2010 local government employer
contribution rate was 14.00 percent of covered payroll. The Ohio Revised Code
currently limits the employer contribution to a rate not to exceed 14.00 percent of
covered payroll for local government employers. Active members do not make
contributions to the OPEB Plan.
OPERS Post-employment Health Care plan was established under, and is
administered in accordance with, Internal Revenue Code 401(h). Each year, the
OPERS Board of Trustees determines the portion of the employer contribution rate
that will be set aside for funding of post employment health care benefits. The
portion of employer contributions allocated to health care for members in the
Traditional Plan was 5.50 percent from January 1 through February 28, 2010 and 5.00
percent from March 1 through December 31, 2010. The portion of employer
contributions allocated to health care for members in the Combined Plan was 4.73
percent from January 1 through February 28, 2010 and 4.23 percent from March 1
through December 31, 2010. The OPERS Board of Trustees is also authorized to
establish rules for the payment of a portion of the health care benefits provided, by
the retiree or their surviving beneficiaries. Payment amounts vary depending on the
number of covered dependents and the coverage selected. The Authority’s actual
employer contributions for December 31, 2010 which were used to fund post-
employment benefits were $908,619; 100 percent has been contributed for 2010.
The Health Care Preservation Plan (HCPP) adopted by the OPERS Board of Trustees
on September 9, 2004, was effective January 1, 2007. Member and employer
contribution rates increased as of January 1, 2006, January 1, 2007, and January 1,
2008, which allowed additional funds to be allocated to the health care plan.
37

METRO REGIONAL TRANSIT AUTHORITY
NOTES TO FINANCIAL STATEMENTS (CONT’D)
For the Year Ended December 31, 2010
8. FEDERAL AND STATE GRANTS, REIMBURSEMENTS AND SPECIAL FARE
ASSISTANCE
Grants, reimbursements and special fare assistance in the statements of revenues and
expenses for the years ended December 31, consist of the following:
2010 2009
FEDERAL:
FTA Maintenance and Other Assistance $ 4,123,465 $ 3,655,202
FTA Capital Contribution 6,059,733 7,107,006
Total 10,183,198$ 10,762,208$
STATE:ODOT Maintenance and Other Assistance $ 589,880 $ 781,303
ODOT Fuel Tax Reimbursement 239,887 221,992
ODOT Capital Contribution 1,099,910 1,033,958
Total 1,929,677$ 2,037,253$
9. RISK MANAGEMENT
Since December 31, 1994, the Authority has been a member of the Ohio Transit Risk
Pool, a joint self-insurance pool, created pursuant to Section 2744.081 of the Ohio
Revised Code. OTRP has been in existence since 1994 and operates pursuant to By-
Laws and a Board of Trustees. OTRP provides self-insurance through risk retention
and the purchase of property and liability coverage from A-rated, or greater,
commercial carriers.
During the loss year of 2010, OTRP provided to the Authority commercial property
coverage with limits of $200,000,000. The pool retained the first $100,000 of these
losses. For auto-physical damage the pool provided $50,000,000 in coverage and
retained $250,000. For auto liability the pool provided $7,500,000. For crime the
pool provided $4,000,000 in coverage. For general liability, E&O and EBL the pool
provided $5,000,000. For each of these lines the pool retained $1,000,000.
METRO’s deductible for all claims was $5,000 for 2010 and $50,000 for 2009
(except for the Authority the auto physical damage, which was $25,000.)
38

METRO REGIONAL TRANSIT AUTHORITY
NOTES TO FINANCIAL STATEMENTS (CONT’D)
For the Year Ended December 31, 2010
9. RISK MANAGEMENT (Cont’d)
OTRP provides to the Treasurer of the Authority a bond as is required by Ohio law.
As of January 1, 2010, the Authority has met all obligations to OTRP. There are no
special assessments being billed at this time and no known loss developments which
would lead to a special assessment.
The Authority pays OTRP through an initial contribution for purchased insurance and
quarterly payments for their self insured loss and administrative costs. The
Authority’s contribution percentage for 2010 was 32.015% in the primary layer and
24.685% in the secondary layer.
10. RESTATEMENT
In 2010, beginning net assets were restated by $2,026,059 for errors in recording
accumulated depreciation.
39

This page intentionally left blank.

Statistical Section
Board of Trustees
Ms. Barbara O’Malley Mr. Paul V. Shiplett Mr. James D. Switzer Mr. Robert K. PfaffExecutive Director/Secretary-Treasurer

Statistical Section – 2010
The Statistical Section includes Financial Trend
Information, Revenue Capacity Information, Operating
Information, Debt Capacity Information, and Demographic
and Economic Information.
Financial Trends and Revenue Capacity pages 41‐50
These schedules indicate how the Authority’s performance and conditions have changed over a ten year time frame. Also
contained in these schedules is information to help the reader understand the Authority’s most significant revenue sources.
Debt Capacity page 51 These schedules indicate the Authority’s debt service.
Economic and Demographic Information pages 52‐54
These schedules contain economic and demographic indicators to
help the reader understand the environment within which the
Authority’s financial activities take place.
Operating Information pages 55‐58
These schedules contain data to help the reader understand how the information in the Authority’s financial report relates to the
services the Authority provides and the activities it performs.
Financial Trend Information
2010
(Unaudited) Table 1 – Net Assets and Fund Balances Table 2 – Changes in Net Assets and Changes in Fund Balances Table 3 – Revenues and Operating Assistance – Comparison to Industry Trend Data
Table 4 – Operating Expenses – Comparison to Industry Trend Data
Table 5 – Passenger Fares vs. Operating Expenses (Graph) Table 6 – Sales Tax: Comparison to other Regional Transit
Authorities in Ohio

TABLE 1
2010 2009 2008 2007 2006
NET ASSETS
Invested in Capital Assets 55,228,863$ 49,737,003$ 47,352,867$ 37,831,113$ 38,662,489$
Restricted
Unrestricted (Deficits) 17,872,667 16,062,506 7,952,567 3,723,849 4,891,107
TOTAL NET ASSETS 73,101,530$ 65,799,509$ 55,305,434$ 41,554,962$ 43,553,596$
2005 2004 2003
NET ASSETS
Invested in Capital Assets 39,524,117$ 42,117,832$ 46,448,258$
Restricted 36,116
Unrestricted (Deficits) 5,422,392 5,689,448 3,491,500
TOTAL NET ASSETS 44,946,509$ 47,807,280$ 49,975,874$
Source: METRO's audited annual financial statements
Note: Information prior to 2003 not available
41
METRO Regional Transit Authority
NET ASSETS/FUND BALANCES BY COMPONENT
(Unaudited)
FOR THE LAST EIGHT FISCAL YEARS

TABLE 22010 2009 2008 2007 2006
OPERATING REVENUES:
Passenger fares 4,004,439$ 3,758,642$ 3,867,029$ 3,696,452$ 3,470,873$
Charter revenue - - - 9,731 11,452
Advertising and concessions 363,317 275,014 266,370 359,479 353,961
TOTAL OPERATING REVENUE 4,367,756$ 4,033,656$ 4,133,399$ 4,065,662$ 3,836,286$
OPERATING EXPENSES
Labor 14,808,947$ 14,424,006$ 12,809,410$ 12,814,016$ 12,695,931$
Fringe benefits 9,359,814 8,463,897 8,086,016 7,451,164 7,048,865
Materials and supplies 5,676,943 5,405,463 5,519,828 4,567,606 4,529,963
Services 2,331,548 2,342,761 1,307,801 1,342,851 1,069,850
Utilities 573,273 582,685 536,138 468,205 652,651
Casualty and liability 1,264,872 975,060 850,567 1,309,673 1,066,711
Taxes 250,354 229,918 218,819 221,687 196,644
Purchased transportation service 1,209,177 1,057,824 1,147,559 1,143,753 1,061,558
Miscellaneous 441,111 355,603 305,665 174,336 178,361 TOTAL OPERATING EXPENSES
BEFORE DEPRECIATION EXPENSE 35,916,039$ 33,837,217$ 30,781,803$ 29,493,291$ 28,500,534$ OPERATING LOSS
BEFORE DEPRECIATION EXPENSE (31,548,283)$ (29,803,561)$ (26,648,404)$ (25,427,629)$ (24,664,248)$ Depreciation expense 6,237,556 6,446,278 5,937,844 4,842,469 5,704,175
OPERATING LOSS (37,785,839)$ (36,249,839)$ (32,586,248)$ (30,270,098)$ (30,368,423)$
NON-OPERATING REVENUES (EXPENSES)
Sales tax revenue 34,521,101$ 33,616,287$ 25,052,152$ 18,503,004$ 18,144,910$
Federal operating grants and reimbursements 4,123,465 3,655,202 4,548,257 4,570,868 4,507,059
State operating grants and special fare assistance 829,767 1,003,295 1,017,883 1,076,387 1,079,041
Student fare and other assistance 1,099,910 1,033,958 878,272 825,967 1,082,313
Investment loss 0 0 0 0 0
Interest income 55,230 14,130 110,763 176,229 235,685
Interest expense (24,072) (19,050) (44,784) (44,556) (55,596)
Gain (Loss) from disposal of assets 6,990 22,533 8,809 2,849 24,580
Other 441,795 310,553 252,897 170,428 204,136NON-OPERATING REVENUES/EXPENSES - NET 41,054,186$ 39,636,908$ 31,824,249$ 25,281,176$ 25,222,128$
CAPITAL GRANT REVENUE
Federal Capital Grant 6,059,733$ 7,107,006$ 10,742,855$ 2,808,870$ 3,658,132$ State Capital Grant 0 0 1,534,616 181,418 95,250Local Contributions 0 0 2,235,000 0 0TOTAL CAPITAL GRANTS 6,059,733$ 7,107,006$ 14,512,471$ 2,990,288$ 3,753,382$
CHANGE IN NET ASSETS/FUND BALANCES 9,328,080$ 10,494,075$ 13,750,472$ (1,998,634)$ (1,392,913)$ Net Assets, Beginning Balance 65,799,509 55,305,434 41,554,962 43,553,596 47,807,280Prior Period Auditor Adjustment (2,026,059) 0 0 0 0Net Assets, Ending Balance 73,101,530$ 65,799,509$ 55,305,434$ 41,554,962$ 43,553,596$
Source: METRO's audited annual financial statements 42
METRO Regional Transit AuthorityCHANGES IN NET ASSETS/FUND BALANCES
FOR THE LAST TEN FISCAL YEARS(Unaudited)

TABLE 2 (continued)2005 2004 2003 2002 2001
OPERATING REVENUES:
Passenger fares 3,514,296$ 2,955,934$ 3,282,581$ 3,378,867$ 3,534,850$
Charter revenue 94,133 195,569 203,248 176,812 180,596
Advertising and concessions 306,435 299,535 354,381 298,843 274,868 TOTAL OPERATING REVENUE 3,914,864$ 3,451,038$ 3,840,210$ 3,854,522$ 3,990,314$
OPERATING EXPENSES
Labor 12,599,824$ 12,779,273$ 12,915,126$ 13,098,078$ 13,189,822$
Fringe benefits 7,479,976 7,206,629 7,141,771 6,283,020 6,027,924
Materials and supplies 3,561,216 3,000,077 3,163,939 3,064,413 3,103,817
Services 1,131,184 1,111,932 1,207,788 940,454 1,169,490
Utilities 536,629 426,072 404,700 417,332 485,770
Casualty and liability 1,225,109 1,188,010 890,037 762,078 542,239
Taxes 181,661 180,145 167,216 158,551 174,354
Purchased transportation service 1,076,844 1,051,375 1,887,041 2,265,605 1,914,939
Miscellaneous 169,364 237,345 264,521 333,715 551,201 TOTAL OPERATING EXPENSES
BEFORE DEPRECIATION EXPENSE 27,961,807$ 27,180,858$ 28,042,139$ 27,323,246$ 27,159,556$ OPERATING LOSS
FOR THE LAST TEN FISCAL YEARSCHANGES IN NET ASSETS/FUND BALANCES
METRO Regional Transit Authority
(Unaudited)
BEFORE DEPRECIATION EXPENSE (24,046,943)$ (23,729,820)$ (24,201,929)$ (23,468,724)$ (23,169,242)$ Depreciation expense 6,504,003 6,203,140 6,173,717 5,554,611 5,493,068
OPERATING LOSS (30,550,946)$ (29,932,960)$ (30,375,646)$ (29,023,335)$ (28,662,310)$
NON-OPERATING REVENUES (EXPENSES)
Sales tax revenue 17,929,848$ 17,784,103$ 17,167,953$ 16,652,028$ 16,471,661$
Federal operating grants and reimbursements 4,556,093 4,808,598 5,062,561 3,098,114 2,723,040
State operating grants and special fare assistance 1,327,249 1,382,307 1,305,676 1,699,085 1,965,532
Student fare and other assistance 1,031,175 928,393 1,666,411 1,331,874 1,250,698
Investment loss (37,568) (17,611) (16,996) 6,566 17,769
Interest income 130,247 64,670 46,650 68,835 167,902
Interest expense (65,652) (95,211) (107,085) (115,415) (129,805)
Gain (Loss) from disposal of assets 8,977 (640,912) (229,860) (70,757) 0
Other 95,132 191,851 218,215 187,473 (368,079)NON-OPERATING REVENUES/EXPENSES - NET 24,975,501$ 24,406,188$ 25,113,525$ 22,857,803$ 22,098,718$
CAPITAL GRANT REVENUE
Federal Capital Grant 2,714,674$ 3,358,178$ 7,479,162$ 9,815,766$ 7,007,638$
State Capital Grant 0 0 0 0 0
Local Contributions 0 0 0 0 0TOTAL CAPITAL GRANTS 2,714,674$ 3,358,178$ 7,479,162$ 9,815,766$ 7,007,638$
CHANGE IN NET ASSETS/FUND BALANCES (2,860,771)$ (2,168,594)$ 2,217,041$ 3,650,234$ 444,046$ Net Assets, Beginning Balance 50,668,051 52,836,645 50,619,604 46,969,370 46,525,324Prior Period Auditor Adjustment 0 0 0 0 0Net Assets, Ending Balance 47,807,280$ 50,668,051$ 52,836,645$ 50,619,604$ 46,969,370$
Source: METRO's audited annual financial statements 43

TABLE 3
TRANSPORTATION INDUSTRY (1):
OPERATING AND OTHER REVENUE TOTAL YEAR PASSENGER OTHER (2) TOTAL LOCAL STATE FEDERAL TOTAL REVENUES
2001 32.5% 17.3% 49.8% 20.1% 25.2% 4.9% 50.2% 100.0%2002 32.5% 17.3% 49.8% 21.6% 23.7% 4.9% 50.2% 100.0%2003 32.5% 17.3% 49.8% 21.6% 23.7% 4.9% 50.2% 100.0%2004 32.9% 16.7% 49.6% 20.8% 22.6% 7.0% 50.4% 100.0%2005 32.4% 15.7% 48.1% 21.0% 23.6% 7.3% 51.9% 100.0%2006 33.2% 15.2% 48.4% 21.1% 22.8% 7.7% 51.6% 100.0%2007 31.4% 6.5% 37.9% 31.0% 23.6% 7.5% 62.1% 100.0%2008 31.3% 6.4% 37.7% 29.5% 25.8% 7.0% 62.3% 100.0%2009 31.5% 5.8% 37.4% 29.0% 25.3% 8.2% 62.6% 100.0%
2010 *
METRO Regional Transit Authority
OPERATING AND OTHER REVENUE TOTAL YEAR PASSENGER OTHER (2) TOTAL LOCAL STATE FEDERAL TOTAL REVENUES
2001 12.9% 3.5% 16.4% 63.4% 7.3% 12.9% 83.6% 100.0%2002 12.6% 2.7% 15.3% 65.9% 7.3% 11.5% 84.7% 100.0%2003 11.2% 2.7% 13.9% 62.8% 6.3% 17.0% 86.1% 100.0%2004 10.3% 2.6% 12.9% 65.4% 4.8% 16.8% 87.1% 100.0%2005 12.1% 2.0% 14.2% 65.5% 4.6% 15.7% 85.8% 100.0%2006 11.9% 2.8% 14.7% 66.1% 3.7% 15.5% 85.3% 100.0%2007 12.6% 2.4% 15.0% 65.8% 3.7% 15.6% 85.0% 100.0%2008 10.7% 1.8% 12.5% 72.0% 2.8% 12.6% 87.5% 100.0%2009 8.6% 1.4% 10.0% 79.4% 2.3% 8.4% 90.0% 100.0%2010 9.0% 1.9% 10.9% 77.9% 1.9% 9.3% 89.1% 100.0%
(1) Source: The American Public Transit Association, "APTA 2011 Transit Fact Book - Table 20"(2) Includes auxiliary transportation revenues, interest, and other non-transportation revenues* Information not available
44
OPERATING ASSISTANCE
OPERATING ASSISTANCE
METRO Regional Transit AuthorityRevenue and Operating Assistance - Comparison to Industry Trend Data
Last Ten Years(Unaudited)

TABLE 4
TRANSPORTATION INDUSTRY (1):Labor & Material & Casualty & Purchased Total
Year Fringes Supplies Services Utilities Liability Transportation Other Expenses
2001 69.5% 10.1% 5.9% 3.3% 2.1% 12.7% -3.4% 100.0%2002 70.3% 9.1% 6.2% 3.1% 2.5% 12.0% -3.2% 100.0%2003 69.1% 9.1% 6.0% 3.0% 2.6% 13.4% -3.2% 100.0%2004 68.7% 9.1% 5.8% 3.0% 2.6% 13.4% -2.6% 100.0%2005 66.9% 10.1% 5.8% 3.2% 2.5% 13.8% -2.3% 100.0%2006 66.1% 11.3% 5.9% 3.2% 2.5% 13.4% -2.4% 100.0%2007 65.8% 11.6% 6.1% 3.4% 2.4% 13.0% -2.3% 100.0%2008 63.9% 12.8% 6.3% 3.4% 2.2% 13.7% -2.3% 100.0%2009 64.8% 11.3% 6.6% 3.5% 2.3% 14.0% -2.5% 100.0%
2010 *
METRO Regional Transit Authority (2)
Labor & Material & Casualty & Purchased TotalYear Fringes Supplies Services Utilities Liability Transportation Other Expenses
2001 68.9% 11.2% 4.2% 1.7% 1.9% 6.9% 5.2% 100.0%2002 70.5% 11.1% 3.4% 1.5% 2.8% 8.2% 2.5% 100.0%2003 71.3% 11.2% 4.3% 1.4% 3.2% 6.7% 1.9% 100.0%2004 73.3% 11.0% 4.1% 1.6% 4.4% 3.9% 1.7% 100.0%2005 71.6% 12.7% 4.0% 1.9% 4.4% 3.8% 1.6% 100.0%2006 69.3% 15.7% 3.8% 2.3% 3.7% 3.7% 1.5% 100.0%2007 68.6% 15.5% 4.5% 1.6% 4.4% 3.9% 1.5% 100.0%2008 67.8% 17.9% 4.2% 1.7% 2.8% 3.7% 1.9% 100.0%2009 67.6% 16.0% 6.9% 1.7% 2.9% 3.1% 1.8% 100.0%2010 67.2% 15.8% 6.5% 1.6% 3.5% 3.4% 2.0% 100.0%
(1) Source: The American Public Transit Association, "APTA 2011 Transit Fact Book - Table 18"(2) Source: METRO's annual financial audited statements* Information not available
45
METRO Regional Transit AuthorityOperating Expenses - Comparison to Industry Trend Data
Last Ten Years(Unaudited)

METRO Regional Transit Authority TABLE 5
46

TAB
LE 6
Syst
emR
ate
Dat
e Im
pose
d20
0120
0220
0320
0420
0520
0620
0720
08*
2009
2010
GC
RTA
1.00
%O
ct 1
, 197
515
7,82
3,88
815
6,73
5,48
615
8,65
3,95
716
7,89
4,94
916
7,16
5,30
716
9,26
2,43
817
3,16
1,23
017
0,70
7,69
815
5,28
2,82
816
3,22
0,64
9C
OTA
0.50
%Ja
n 1,
200
841
,601
,224
41,3
34,5
2343
,205
,469
44,9
40,8
0344
,741
,979
46,3
71,6
7447
,598
,995
88,2
46,0
2187
,819
,553
91,9
61,8
90La
ketra
n0.
25%
Aug
1, 1
988
7,17
5,59
67,
202,
698
7,44
0,52
97,
637,
135
7,55
2,50
97,
728,
333
7,91
3,16
17,
744,
815
7,15
7,30
67,
240,
999
WR
TA0.
25%
Apr
1, 2
009
4,16
7,21
46,
732,
485
GD
RTA
0.50
%Ju
l 1, 1
980
31,9
68,7
2831
,433
,081
32,2
90,3
2632
,783
,222
32,9
23,9
8532
,363
,030
32,1
85,3
7032
,149
,806
29,3
41,6
9730
,150
,943
PAR
TA0.
25%
Feb
1, 2
002
2,56
4,17
43,
281,
207
3,39
0,06
13,
412,
879
3,58
3,44
53,
705,
852
3,77
5,72
63,
608,
868
3,91
4,53
7SA
RTA
0.25
%Ju
l 1, 1
997
10,1
75,5
4110
,607
,899
10,6
89,9
6411
,371
,235
11,2
87,3
3311
,525
,065
11,7
85,6
9111
,696
,465
10,4
10,5
8111
,016
,628
MET
RO
0.50
%Ju
l 1, 2
008
16,0
78,1
5716
,484
,481
16,9
95,5
1417
,605
,364
17,7
49,8
4517
,989
,459
18,3
06,1
5524
,848
,457
32,8
29,0
0134
,194
,603
Sour
ce:
Fig
ures
show
n ar
e fr
om re
cord
s of t
he R
even
ue A
ccou
ntin
g D
ivis
ion
of th
e O
hio
Dep
artm
ent o
f Tax
atio
nN
ote:
T
hese
figu
res a
re n
et o
f the
1%
adm
inis
tratio
n fe
e.
The
se a
mou
nts a
re b
ased
on
mon
th sa
les t
ax c
olle
cted
, the
dis
tribu
tion
occu
rs tw
o m
onth
s fol
low
ing
the
colle
ctio
n m
onth
.
N
umbe
rs a
re o
n a
cash
bas
is.
* C
OTA
incr
ease
d th
e sa
les t
ax p
erce
nt fr
om .2
5% to
.50%
on
Janu
ary
1, 2
008
* M
ETR
O in
crea
sed
the
sale
s tax
per
cent
from
.25%
to .5
0% o
n Ju
ly 1
, 200
8
47
Last
Ten
Yea
rsSa
les T
ax -
Com
paris
on to
oth
er R
egio
nal T
rans
it A
utho
ritie
s in
Ohi
o
MET
RO
Reg
iona
l Tra
nsit
Aut
horit
y
(Una
udite
d)

Revenue Capacity Information
2010 (Unaudited)
Table 7 – Revenues by Source Table 8 – Revenues by Source (Graph) Table 9 – Expenses by Object Class

TAB
LE 7
Ope
ratin
g R
even
ues
2001
2002
2003
2004
2005
2006
2007
2008
2009
2010
Pass
enge
rs F
ares
$3,5
34,8
50$3
,378
,867
$3,2
82,5
81$2
,955
,934
$3,5
14,2
96$3
,470
,873
$3,6
96,4
52$3
,867
,029
$3,7
58,6
42$4
,004
,439
Cha
rter F
ares
180,
596
176,
812
203,
248
195,
569
94,1
3311
,452
9,73
10
00
Adv
ertis
ing
274,
868
298,
843
354,
381
299,
535
306,
435
353,
961
359,
479
266,
370
275,
014
363,
317
Tota
l ope
ratin
g re
venu
es4,
241,
901
3,99
0,31
43,
854,
522
3,84
0,21
03,
451,
038
3,91
4,86
43,
836,
286
4,06
5,66
24,
133,
399
4,36
7,75
6
Non
-ope
ratin
g R
even
ues
Sale
s Tax
reve
nue
16,4
71,6
6116
,652
,028
17,1
67,9
5317
,784
,103
17,9
29,8
4818
,144
,910
18,5
03,0
0425
,052
,152
33,6
16,2
8734
,521
,101
Fede
ral g
rant
s2,
723,
040
3,09
8,11
45,
062,
561
4,80
8,59
84,
556,
093
4,50
7,05
94,
570,
868
4,54
8,25
73,
655,
202
4,12
3,46
5St
ate
gran
ts1,
965,
532
1,69
9,08
51,
305,
676
1,38
2,30
71,
327,
249
1,07
9,04
11,
076,
387
1,01
7,88
3
1,00
3,29
5
829,
767
Stud
ent f
ares
ass
ista
nce
1,25
0,69
81,
331,
874
1,66
6,41
192
8,39
31,
031,
175
1,08
2,31
382
5,96
787
8,27
21,
033,
958
1,09
9,91
0In
tere
st in
com
e18
5,67
175
,401
29,6
5430
,063
92,6
7923
5,68
517
6,22
911
0,76
314
,130
55,2
30G
ain
(loss
) fro
m d
ispo
sal o
f ass
ets
00
-229
,860
(640
,912
)8,
977
24,5
802,
849
8,80
922
,533
6,99
0O
ther
non
-tran
spor
tatio
n re
venu
e20
2,07
518
7,47
321
8,21
520
8,84
795
,132
204,
136
170,
428
252,
897
310,
553
441,
795
Tota
l non
-ope
ratin
g re
venu
es23
,805
,554
22,7
98,6
7723
,043
,975
25,2
20,6
1024
,501
,399
25,0
41,1
5325
,277
,724
25,3
25,7
3231
,869
,033
41,0
78,2
58
Tota
l Rev
enue
s$2
8,04
7,45
5$2
6,78
8,99
1$2
6,89
8,49
7$2
9,06
0,82
0$2
7,95
2,43
7$2
8,95
6,01
7$2
9,11
4,01
0$2
9,39
1,39
4$3
6,00
2,43
2$4
5,44
6,01
4
Sour
ce: M
ETR
O's
inde
pend
ently
aud
ited
annu
al fi
nanc
ial s
tate
men
ts
48
MET
RO
Reg
iona
l Tra
nsit
Aut
horit
yR
even
ues b
y So
urce
- La
st T
en Y
ears
(Una
udite
d)

METRO Regional Transit Authority TABLE 8
49

TAB
LE 9
Ope
ratin
g Ex
pens
es20
01*
2002
2003
2004
2005
2006
2007
2008
2009
2010
Labo
r$1
3,18
9,82
2$1
3,09
8,07
8$1
2,91
5,12
6$1
2,77
9,27
3$1
2,59
9,82
4$1
2,69
5,93
1$1
2,81
4,01
6$1
2,80
9,41
0$1
4,42
4,00
6$1
4,80
8,94
7Fr
inge
Ben
efits
6,02
7,92
46,
283,
020
7,14
1,77
17,
206,
629
7,47
9,97
67,
048,
865
7,45
1,16
48,
086,
016
8,46
3,89
79,
359,
814
Mat
eria
ls a
nd S
uppl
ies
3,10
3,81
73,
064,
413
3,16
3,93
93,
000,
077
3,56
1,21
64,
529,
963
4,56
7,60
65,
519,
828
5,40
5,46
35,
676,
943
Serv
ices
1,16
9,49
094
0,45
41,
207,
788
1,11
1,93
21,
131,
184
1,06
9,85
01,
342,
851
1,30
7,80
12,
342,
761
2,33
1,54
8U
tiliti
es48
5,77
041
7,33
240
4,70
042
6,07
253
6,62
965
2,65
146
8,20
553
6,13
858
2,68
557
3,27
3C
asua
lty a
nd L
iabi
lity
542,
239
762,
078
890,
037
1,18
8,01
01,
225,
109
1,06
6,71
11,
309,
673
850,
567
975,
060
1,26
4,87
2Ta
xes
174,
354
158,
551
167,
216
180,
145
181,
661
196,
644
221,
687
218,
819
229,
918
250,
354
Purc
hase
d Tr
ansp
orta
tion
1,91
4,93
92,
265,
605
1,88
7,04
11,
051,
375
1,07
6,84
41,
061,
558
1,14
3,75
31,
147,
559
1,05
7,82
41,
209,
177
Inte
rest
Exp
ense
129,
805
115,
415
107,
085
95,2
1165
,652
55,5
9644
,556
44,7
8419
,050
24,0
72M
isce
llane
ous *
1,12
1,35
540
4,47
226
4,52
123
7,34
516
9,36
417
8,36
117
4,33
630
5,66
535
5,60
344
1,11
1
Tota
l27
,828
,613
27,8
59,5
1527
,509
,418
28,1
49,2
2427
,276
,069
28,0
27,4
5928
,556
,130
29,5
37,8
4730
,826
,587
35,9
40,1
11
Dep
reci
atio
n4,
680,
867
5,49
3,06
85,
554,
611
6,17
3,71
76,
203,
140
5,70
4,17
54,
842,
469
5,93
7,84
46,
446,
278
6,23
7,55
6
Tota
l Exp
ense
s$3
1,65
7,80
8$3
2,54
0,38
2$3
3,00
2,48
6$3
3,70
3,83
5$3
3,44
9,78
6$3
4,23
0,59
9$3
4,26
0,30
5$3
4,38
0,31
6$3
6,76
4,43
1$4
2,17
7,66
7
Sour
ce: M
ETR
O's
audi
ted
annu
al fi
nanc
ial s
tate
men
ts
* M
isce
llane
ous i
n 20
01 in
clud
es th
e co
st o
f a c
ompr
ehen
sive
tran
spor
tatio
n st
udy
(the
Maj
or In
vest
men
t Stu
dy P
roje
ct).
50
MET
RO
Reg
iona
l Tra
nsit
Aut
horit
yEx
pens
es b
y O
bjec
t Cla
ss -
Last
Ten
yea
rs(U
naud
ited)

Debt Capacity Information
2010 (Unaudited)
Table 10 – Debt Service

Tabl
e 1
0
NET
REV
ENU
EB
ON
DA
VA
ILA
BLE
FO
RB
ON
DD
EBT
CO
VER
AG
EY
EAR
REV
ENU
ES (1
)EX
PEN
SES
(2)
DEB
T SE
RV
ICE
DEB
T (3
)PO
PULA
TIO
N (6
)PE
R C
API
TAL
RA
TIO
2001
$26,
788,
991
$27,
859,
515
($1,
070,
524)
$2,0
25,0
0054
5,17
9$3
.71
(0.5
3)20
0226
,898
,497
27,5
09,4
18(6
10,9
21)
1,79
0,00
054
5,77
1$3
.28
(0.3
4)20
0329
,060
,820
28,1
49,2
2491
1,59
62,
402,
029
(4)
545,
637
$4.4
00.
3820
0427
,952
,437
27,2
76,0
6967
6,36
82,
117,
029
(5)
545,
545
$3.8
80.
3220
0528
,956
,017
28,0
27,4
5992
8,55
81,
782,
029
545,
347
$3.2
70.
5220
0629
,114
,010
28,5
56,1
3055
7,88
01,
005,
000
545,
931
$1.8
40.
5620
0729
,391
,394
29,5
37,8
47(1
46,4
53)
650,
000
543,
899
$1.2
0(0
.23)
(Una
udite
d)
Deb
t Ser
vice
MET
RO
Reg
iona
l Tra
nsit
Aut
horit
y
2007
29,3
91,3
9429
,537
,847
(146
,453
)65
0,00
054
3,89
9$1
.20
(0.2
3)20
0836
,002
,432
30,8
26,5
875,
175,
845
570,
000
542,
562
$1.0
59.
0820
0943
,689
,614
33,8
56,2
679,
833,
347
485,
000
542,
405
$0.8
920
.27
2010
45,4
46,0
1435
,940
,111
9,50
5,90
339
5,00
054
1,78
1$0
.73
24.0
7
(1) G
ross
reve
nue
incl
udes
inte
rest
, fed
eral
& st
ate
gran
ts, s
peci
al fa
re a
ssis
tanc
e an
d ot
her n
on-o
pera
ting
reve
nue.
(2) T
otal
exp
ense
s is e
xclu
sive
of d
epre
ciat
ion.
(3) T
otal
prin
cipa
l due
on
all o
utst
andi
ng d
ebt.
(4) I
n 20
03 M
ETR
O e
nter
ed in
to a
no
inte
rest
loan
agr
eem
ent w
ith th
e St
ate
of O
hio,
Dep
artm
ent o
f Tra
nspo
rtatio
n fo
r a
St
ate
Infr
astru
ctur
e B
ank
(SIB
) loa
n of
$44
2,02
9 w
hich
was
pai
d in
full
in 2
005.
(5) I
n 20
04 M
ETR
O re
finan
ce th
e re
mai
ning
bal
ance
of b
onds
issu
ed in
199
2 an
d in
crea
sed
the
bond
deb
t by
$430
,000
. B
onds
are
pay
able
thro
ugh
2014
.(6
) U.S
. Bur
eau
of C
ensu
s, B
urea
u of
Lab
or S
tatis
tics
51

Demographic & Economic Information
2010
(Unaudited) Table 11 – Demographic Statistics Table 12 – Personal Income (graph) Table 13 – Largest Employers

TABLE 11
Per Capita K - 12 School UnemploymentYear Population Income Enrollment Rate
(1) (2) (3) (4)
2001 545,179 $30,420 84,595 4.6%2002 545,771 30,903 84,331 6.0%2003 545,637 31,900 84,064 6.2%2004 545,545 33,095 83,555 6.1%2005 545,347 34,375 83,231 5.7%2006 545,931 35,979 82,122 5.2%2007 543,899 37,612 80,682 5.4%2008 542,562 38,940 80,598 6.2%2009 542,405 38,001 75,791 9.8%2010 541,781 * * 9.9%
METRO Regional Transit AuthorityDemographic Statistics
(Unaudited)Last Ten Years
Note: All information is presented for Summit County, Ohio
Sources: (1) U.S. Bureau of Census, Bureau of Labor Statistics
(2) Bureau of Economic Analysis
(3) Ohio Department of Education - enrollment data
(4) Bureau of Labor Statistics
* Information not available
52

METRO Regional Transit Authority TABLE 12
Source: Bureau of Economic Analysis Note: Personal Income ($000)
53

TAB
LE 1
3
Com
pany
/Org
aniz
atio
nEm
ploy
ees
Com
pany
/Org
aniz
atio
nEm
ploy
ees
Sum
ma
Hea
lth S
yste
m10
,000
Sum
ma
Hea
lth S
yste
m6,
104
Akr
on G
ener
al H
ealth
Sys
tem
4,27
7A
kron
Gen
eral
Hea
lth S
yste
m4,
263
Sum
mit
Cou
nty
3,46
8Th
e G
oody
ear T
ire &
Rub
ber C
o.3,
502
Akr
on S
choo
l Dis
trict
3,09
5Su
mm
it C
ount
y3,
470
Goo
dyea
r Tire
& R
ubbe
r Com
pany
3,00
0A
kron
Sch
ool D
istri
ct3,
050
Uni
vers
ity o
f Akr
on A
kron
2,84
5Th
e U
nive
rsity
of A
kron
2,84
7A
kron
Gen
eral
Med
ical
Cen
ter
2,82
0A
kron
Gen
eral
Med
ical
Cen
ter
2,82
0Fi
rstE
nerg
y C
orp
2,70
8Fi
rstM
erit
Cor
pora
tion
2,69
7Fi
rstM
erit
Cor
pora
tion
2,69
5A
kron
Chi
ldre
n's H
ospi
tal
2,56
9A
kron
Chi
ldre
n's H
ospi
tal
2,68
1C
ity o
f Akr
on2,
520
Tim
e W
arne
r Cab
le N
EO2,
440
Ass
ocia
ted
Mat
eria
ls In
c.2,
500
City
of A
kron
Akr
on2,
150
Firs
tEne
rgy
Cor
p.2,
416
Ster
ling
Jew
eler
s, In
c.2,
045
Jo-A
nn F
abric
& C
raft
Stor
es2,
202
Littl
e Ti
kes C
o.1,
800
Die
bold
Inc.
Can
ton
2,00
2A
cme
Fres
h M
arke
ts1,
650
Ster
ling
Jew
eler
s Inc
.1,
923
Alls
tate
Insu
ranc
e C
o.1,
625
Alls
tate
Insu
ranc
e C
o.1,
627
Sour
ces:
Akr
on C
ham
ber o
f Com
mer
ce (2
009
and
2007
)
54
Not
e: In
form
atio
n fo
r 201
0, 2
008
and
prio
r to
2007
not
ava
ilabl
e
2009
2007
MET
RO
Reg
iona
l Tra
nsit
Aut
horit
ySu
mm
it C
ount
y, O
hio
- Lar
gest
Em
ploy
ers
(Una
udite
d)

Operating Information
2010 (Unaudited)
Table 14 – Operating Statistics Table 15 – Fare Rate Structure Table 16 – Miscellaneous Statistics

TAB
LE 1
4
2001
2002
2003
2004
2005
2006
2007
2008
2009
2010
Syst
em R
ider
ship
(1)
Mot
or B
us6,
021,
569
6,39
5,45
75,
988,
354
5,56
2,40
65,
534,
269
5,61
2,01
15,
290,
612
5,50
1,36
74,
792,
622
4,79
8,74
5D
eman
d R
espo
nse
333,
200
322,
995
262,
240
216,
252
179,
652
153,
336
212,
144
214,
000
230,
808
227,
949
Ave
rage
Wee
kday
Sys
tem
Rid
ersh
ip (1
)M
otor
Bus
20,8
9022
,631
21,0
3719
,210
19,4
6619
,795
18,4
9019
,033
16,3
4216
,507
Dem
and
Res
pons
e1,
568
1,25
31,
016
828
695
596
826
827
889
885
Tota
l Veh
icle
Mile
s (1)
Mot
or B
us4,
428,
731
4,32
0,25
13,
871,
124
3,36
3,80
63,
196,
718
3,11
0,54
13,
306,
374
3,35
1,37
93,
762,
514
3,78
6,75
7
MET
RO
Reg
iona
l Tra
nsit
Aut
horit
yO
pera
ting
Stat
istic
s - L
ast T
en Y
ears
(Una
udite
d)
Dem
and
Res
pons
e2,
200,
408
2,18
6,58
52,
304,
272
2,22
0,85
42,
090,
668
1,57
1,29
51,
491,
104
1,51
1,48
01,
853,
843
1,45
1,97
3
Tota
l Rev
enue
Mile
s (1)
Mot
or B
us3,
884,
900
3,66
6,10
33,
437,
344
2,93
0,04
62,
702,
622
2,64
7,39
32,
665,
098
2,67
2,51
23,
020,
065
3,05
7,42
8D
eman
d R
espo
nse
2,04
6,39
72,
025,
375
1,91
2,27
82,
005,
785
1,83
1,63
11,
418,
170
1,37
3,63
81,
368,
460
1,62
0,67
11,
213,
859
Pass
enge
r Mile
s (1)
Mot
or B
us24
,194
,261
26,3
12,9
4021
,941
,968
20,6
41,9
5721
,215
,058
21,4
32,5
9521
,488
,616
22,1
71,4
0819
,521
,871
19,7
20,8
79D
eman
d R
espo
nse
1,92
7,54
21,
744,
793
1,43
1,63
299
9,20
81,
158,
916
947,
262
1,23
7,76
61,
399,
324
1,38
1,93
91,
218,
265
(Continued) 55

2001
2002
2003
2004
2005
2006
2007
2008
2009
2010
Full
Tim
e Em
ploy
ees (
1)35
635
433
632
232
632
631
232
435
234
9
Tota
l Veh
icle
Hou
rs (1
)M
otor
Bus
314,
316
293,
198
283,
704
261,
818
260,
734
255,
174
255,
508
251,
552
266,
762
284,
619
Dem
and
Res
pons
e15
7,40
215
0,52
713
6,34
313
1,57
813
1,03
811
1,83
211
8,48
811
1,92
011
9,16
512
7,55
9
Tota
l Veh
icle
Rev
enue
Hou
rs (1
)M
otor
Bus
270,
475
240,
642
248,
158
229,
084
229,
008
228,
469
226,
734
226,
397
240,
127
256,
792
Dem
and
Res
pons
e15
1,99
314
5,55
413
1,73
612
6,20
512
5,18
510
7,11
211
2,69
210
4,79
610
2,53
910
4,28
8
Veh
icle
Acc
iden
ts a
vera
ge p
er m
onth
(2)
Mt
B
(Una
udite
d)
MET
RO
Reg
iona
l Tra
nsit
Aut
horit
yO
pera
ting
Stat
istic
s - L
ast T
en Y
ears
(Con
tinue
d)
Mot
or B
us2.
52.
02.
03.
62.
17.
76.
85.
87.
36.
8D
eman
d R
espo
nse
2.3
2.6
2.0
1.5
1.8
1.5
2.1
2.4
2.3
1.2
Mile
s bet
wee
n R
oadc
alls
(2)
3,69
14,
269
4,19
83,
538
2,62
94,
391
4,22
62,
650
3,33
43,
140
Tota
l Rev
enue
Veh
icle
s (1)
Mot
or B
us15
213
713
513
712
211
710
911
112
513
9D
eman
d R
espo
nse
176
163
156
144
148
152
145
139
150
167
(1) M
ETR
O's
annu
al "
Nat
iona
l Tra
nsit
Dat
abas
e" a
s rep
orte
d to
Fed
eral
Tra
nsit
Adm
inis
tratio
n
(2) M
ETR
O's
Mon
thly
Per
form
ance
repo
rt
Not
e: D
eman
d R
espo
nse
incl
udes
dire
ctly
ope
rate
d an
d pu
rcha
sed
trans
porta
tion
56

TABLE 15
Cash fares
General 1.25$ Senior / Disability 0.50 North Coast Express 5.00 SCAT 2.00 SCAT ADA 2.50
Tickets/Passes
10 Ride Pass - North Coast Express 33.00$ SCAT Ticket 20.00 Day Pass 2.50 31 Day Pass General $50.00 Senior / Disability 30.00
Source: METRO's Fare resolution passed by the Board of Trustees on March 25, 2009
57
METRO Regional Transit AuthorityFare Rate Structure as of December 31, 2010

TABLE 16
Date METRO was created August 26, 1969
Form of Government AppointedBoard of Trustees
Number of Trustees 12
Type of tax support 1/2 of 1 percent sales and use tax
for Summit County
Size of service area (Square miles) 419.92
Population of County (2010) 541,781
Miles of routes 442.4
Number of buses (Directly Operated) Motor bus 139 Demand Response 97
Number of routes 36
Customer Service information calls answered (2010) 265,239
SCAT Reservation Clerks calls answered (2010) 227,949
58
METRO Regional Transit AuthorityMiscellaneous Statistics
(Unaudited)

-1-
Rockefeller Building
614 W Superior Ave Ste1242
Cleveland OH 44113-1306
Charles E. Harris & Associates, Inc. Phone - (216) 575-1630
Certified Public Accountants Fax - (216) 436-2411
INDEPENDENT ACCOUNTANTS’ REPORT ON
APPLYING AGREED UPON PROCEDURES
Metro Regional Transit Authority Summit County 416 Kenmore Boulevard Akron, Ohio 44301 To the Board of Trustees: We understand that the Metro Regional Transit Authority (the Authority) is eligible to receive grants under Section 9 of the Urban Mass Transportation Act of 1964, as amended, and in connection therewith, the Authority is required to report certain information to the Federal Transit Administration (FTA). The FTA has established the following standards with regard to the data reported to it in the Federal Funding Allocation Statistics Form (FFA-10) of the Authority’s annual National Transit Database
(NTD) report:
A system is place and maintained for recording data in accordance with NTD definitions. The correct data are being measured and no systematic errors exist.
A system is in place to record data on a continuing basis and the data gathering is an
ongoing effort.
Source documents are available to support the reported data and are maintained for FTA review and audit for a minimum of three years following the FTA’s receipt of the NTD
report. The data are fully documented and securely stored.
A system of internal controls is in place to ensure the data collection process is accurate and that the recording system and reported comments are not altered. Documents are reviewed and signed by a supervisor, as required.
The data collection methods are those suggested by the FTA or meet FTA requirements.
The deadhead miles, computed as the difference between the reported total actual vehicle
miles data and the reported total actual vehicle revenue miles data, appear to be accurate.
Data are consistent with prior reporting periods and other facts known about the Authority’s operations.

-2-
We have applied the procedures to the data contained in the accompanying Federal Funding Allocation Statistics Form (FFA-10) for the fiscal year ended December 31, 2010. Such procedures, which were agreed to and specified by FTA in the Declarations section of the 2010
Reporting Manual and were agreed to by the Authority, were applied to assist you in evaluating whether the Authority complied with the standards described in the second paragraph of this report and that the information included in the NTD report Federal Funding Allocation Statistics Form (FFA-10) for the fiscal year ended December 31, 2010 is presented in conformity with the requirements of the Uniform System of Accounts and Records and Reporting System; Final Rule, as specified in 49 CFR Part 630, Federal Register, January 15, 1993 and as presented in the 2010
Reporting Manual. This engagement to apply agreed upon procedures was performed in accordance with attestation standards established by the American Institute of Certified Public Accountants. The sufficiency of the procedures is solely the responsibility of the specified users of the report. Consequently, we make no representation regarding the sufficiency of the procedures described above either for the purpose for which this report has been requested or for any other purpose. This report is intended solely for your information and FTA and should not be used by those who did not participate in determining the procedures. The procedures were applied separately to each of the information systems used to develop the reported vehicle revenue miles, fixed guideway directional route miles, passenger miles, and operating expenses of the Authority for the fiscal year ended December 31, 2010 for each of the following modes:
Motor Bus-directly operated Demand Responsive-directly operated
Demand Responsive-purchased transportation
The following information and finding came to our attention as a result of performing the procedures described in the Attachment to this report: None We were not engaged to and did not conduct an examination, the objective of which would be the expression of an opinion on the Federal Funding Allocation Statistics Form (FFA-10). Accordingly, we do not express such an opinion. Also, we do not express an opinion on the Authority’s system of internal control taken as a whole. In performing the procedures, no matters came to our attention that caused us to believe that the information included in the NTD report on the Federal Funding Allocation Statistics Form (FFA-10) for the fiscal year-ended December 31, 2010 is not presented in conformity with the requirements of the Uniform System of Accounts and Records and Reporting System; Final Rule, as specified in 49 CFR Part 630, Federal Register, January 15, 1993 and as presented in the 2010
Reporting Manual. Had we performed additional procedures, other matters might have come to our attention that would have been reported to you. This report relates only to the information described above and does not extend to the Authority’s
financial statements taken as a whole, or the forms in the Authority’s NTD report, other than the
Federal Funding Allocation Statistics Form (FFA-10), for any date or period.

-3-
This report is intended solely for the information and use of the Authority’s management, the Ohio
Auditor of State and federal awarding agencies and is not intended to be and should not be used by anyone other than these specified parties.
Charles E. Harris & Associates, Inc. June 21, 2011

88 East Broad Street, Fifth Floor, Columbus, Ohio 43215‐3506 Phone: 614‐466‐4514 or 800‐282‐0370 Fax: 614‐466‐4490
www.auditor.state.oh.us
METRO REGIONAL TRANSIT AUTHORITY
SUMMIT COUNTY
CLERK’S CERTIFICATION This is a true and correct copy of the report which is required to be filed in the Office of the Auditor of State pursuant to Section 117.26, Revised Code, and which is filed in Columbus, Ohio.
CLERK OF THE BUREAU CERTIFIED MARCH 8, 2012