Embed Size (px)
Citation preview
External Panel Review Draft MeI RCD Appendices to Volume I- August 10, 2009
1 2 3 4 5 6 7 8 9
10 11 12 13 14 15 16 17 18 19 20 21 22 23 24 25 26 27 28 29 30 31 32 33 34 35 36
Methyl Iodide (Iodomethane)
RISK CHARACTERIZATION DOCUMENT FOR INHALATION EXPOSURE
Appendices to Volume I (Health Risk Assessment)
External Panel Review Draft
Medical Toxicology Branch Department of Pesticide Regulation
California Environmental Protection Agency
August 2009

External Panel Review Draft MeI RCD Appendices to Volume I- August 10, 2009
1 2 3 4 5 6 7 8 9
10 11 12 13 14
Appendices to Volume I:
Appendix A. Review of Physiologically Based Pharmacokinetic Model for Human Equivalent Concentration
Appendix B. Calculations
Appendix C. U.S. Environmental Protection Agency Risk Assessment

External Panel Review Draft MeI RCD Appendices to Volume I- August 10, 2009
1 2 3 4 5 6 7 8 9
10 11 12 13 14 15 16 17 18 19 20 21 22 23 24 25 26 27 28 29 30 31 32 33 34 35 36 37 38 39 40 41 42 43 44
Appendix A. Review of Physiologically Based Pharmacokinetic Model For Human Equivalent Concentration
Nu-may R. Reed, Ph.D., D.A.B.T., Staff Toxicologist Health Assessment Section Medical Toxicology Branch
A-1
External Panel Review Draft MeI RCD Appendices to Volume I- August 10, 2009
1 2 3 4 5 6 7 8 9
10 11 12 13 14 15 16 17 18 19 20 21 22 23 24 25 26 27 28 29 30 31 32 33 34 35 36 37
Table of Contents I. Introduction ................................................................................................................................ 4 II. Fetal Death in Rabbit................................................................................................................. 4
II.A. Model and Parameters........................................................................................................ 6 II.A.1. Alveolar Ventilation Rate (QAC) ................................................................................. 6 II.A.2. Maternal versus Fetal Iodide Levels .......................................................................... 11 II.A.3. Fetal Thyroid Iodide Level......................................................................................... 15 II.A.4. Human Fetal Stage ..................................................................................................... 18 II.A.5. Time Course Profile ................................................................................................... 19 II.A.6. Summary .................................................................................................................... 19
II.B. Dose Metric ...................................................................................................................... 22 II.B.1. Single Day 2 ppm NOEL ........................................................................................... 22 II.B.2. HEC Dose Metric ....................................................................................................... 23
II.C. HECs................................................................................................................................. 25 II.C.1. General Population HEC............................................................................................ 25 II.C.2. Occupational HEC...................................................................................................... 28 II.C.3. Summary .................................................................................................................... 29
III. Nasal Effects .......................................................................................................................... 31 III.A. Model and Parameters..................................................................................................... 31 III.B. Dose Metric..................................................................................................................... 33
III.B.1. Regional Olfactory GSH........................................................................................... 33 III.B.2. Threshold GSH Depletion......................................................................................... 33
III.C. HECs ............................................................................................................................... 38 III.C.1. General Population HEC........................................................................................... 38 III.C.2. Occupational HEC .................................................................................................... 38 III.C.3. Summary ................................................................................................................... 40
IV. Neurotoxicity.......................................................................................................................... 42 IV.A. Model and Parameters..................................................................................................... 42 IV.B. Dose Metric ..................................................................................................................... 42 IV.C. HECs ............................................................................................................................... 43
IV.C.1 General Population HEC............................................................................................ 44 IV.C.2. Occupational HEC..................................................................................................... 46 IV.C.3. Summary ................................................................................................................... 46
V. Summary of All Acute HECs .................................................................................................. 48 VI. References.............................................................................................................................. 49
A-2

External Panel Review Draft MeI RCD Appendices to Volume I- August 10, 2009
1 2 3 4 5 6 7 8 9
10 11 12 13 14 15 16 17 18 19 20 21 22 23 24 25 26 27 28 29 30 31 32 33 34 35 36 37 38 39
List of Tables
Table A-1. Modeled versus measured rabbit serum iodide concentrations after repeated 20 ppm MeI (6 hour/day) exposure .................................................................................. 10
Table A-2. Modeled fetal-to-maternal serum iodide (F/M) ratio in rabbits and human exposed to MeI.................................................................................................................. 12
Table A-3. Plasma iodide concentration in human maternal and cord blood at delivery ............ 13 Table A-4. List of 24-hour HECs for rabbit fetal death endpoint ................................................ 26 Table A-5. Average level of GSH in rat nasal epithelium............................................................ 37 Table A-6. Modeled brain MeI AUC of human exposures at 2.2 to 10 ppm for 24 hours .......... 44 Table A-7. Acute HECs for MeI based on fetal death, nasal effects, and neurotoxicity.............. 48
List of Figures Figure A-1. Diagram of MeI PBPK model .................................................................................... 5 Figure A-2. Modeled versus measured data in rabbits................................................................... 8 Figure A-3. Model rabbits at QAC 12 and 20 L-hr/kg3/4 ............................................................... 9 Figure A-4. Modeled human serum iodide concentration at 0.15 and 3.4 ppm MeI for
24 hours............................................................................................................................. 14 Figure A-5. Modeled iodide tissue distribution in rabbits at 2 ppm MeI for 6 hours .................. 16 Figure A-6. Modeled iodide concentration in human fetal thyroid follicles at
0.15 - 3.4 ppm MeI ........................................................................................................... 17 Figure A-7. Modeled rabbit MeI concentrations and AUC (area under the curve) from
2 ppm MeI exposure, 6 hours/day..................................................................................... 20 Figure A-8. Modeled rabbit iodide concentrations and AUC (area under the curve) from
2 ppm MeI exposure, 6 hrs/day......................................................................................... 21 Figure A-9. The 24-hour HEC based on maternal serum iodide dose metrics ............................ 27 Figure A-10. The 8-hour occupational HEC based on maternal serum iodide dose metrics....... 30 Figure A-11. Modeled versus measured data in rats .................................................................... 32 Figure A-12. Modeled rat olfactory GSH level from 21 ppm (6 hr) MeI exposure .................... 34 Figure A-13. The 24-hour HEC of 2.2 ppm based on 25% olfactory GSH depletion ................. 39 Figure A-14. The 8-hour occupational HEC of 2.8 ppm based on 25% olfactory GSH
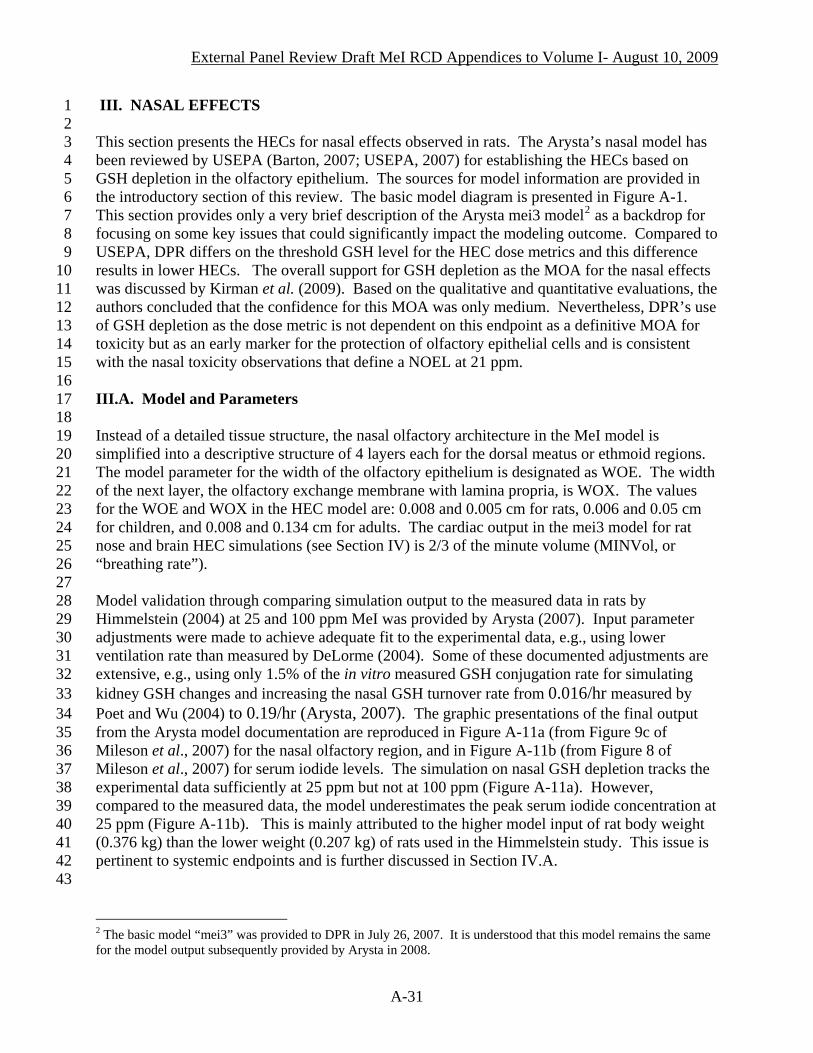
depletion............................................................................................................................ 41 Figure A-15. Modeled 24-hour HEC based on brain MeI AUC.................................................. 45 Figure A-16. The 8-hour-only HEC of 9.7 ppm based on brain MeI AUC ................................. 47
A-3

External Panel Review Draft MeI RCD Appendices to Volume I- August 10, 2009
I. INTRODUCTION 1 2 3 4 5 6 7 8 9
10 11 12 13 14 15 16 17 18 19 20 21 22 23 24 25 26 27 28 29 30 31 32
This review on acute Human Equivalent Concentrations (HECs) of methyl iodide (MeI) derived from Physiologically Based Pharmacokinetic (PBPK) modeling pertains to three sets of endpoints: 1) fetal death in rabbits from maternal exposure, 2) nasal olfactory epithelial degeneration in rats, and 3) neurotoxicity in rats. Data and discussions already presented in Volume I are briefly mentioned but not repeated here in detail. For deriving the HECs, the PBPK model is expected to account for interspecies pharmacokinetic differences. A diagram of the basic model taken directly from Arysta (2007) is included in Figure A-1. The same basic PBPK model structure is used for all three endpoints but the rat model contains an enhanced nose compartment for simulating the nasal endpoint HECs. It is also used for the neurotoxicity endpoint. The same basic model and endpoints are also used by U.S. Environmental Protection Agency (USEPA). However, the final HECs presented in this review differ from USEPA (2007) due to different modeling baselines and dose metrics. They are highlighted herein. The iterative PBPK model runs presented in this review were conducted by Arysta (2008a, b, c, d, e, f). To avoid confusion, instead of the term “bystander” used in the Arysta modeling reports that was applicable to both “bystander” and “resident” in Volume I and II, the term “General Population” is used in this Appendix for anyone who does not receive occupational exposure as being a part of the work task associated with the MeI use. This review also includes discussions of occupational HECs that consider a worker’s 16-hour MeI exposure as a member of the general public in addition to the 8-hour work exposure in the Arysta model. They are termed as “8-hour occupational HEC” or “8-hour HEC” in short. In this review document, sources for detailed information on the Arysta model are cited. The rabbit and rat model codes were initially submitted by Arysta (2007). The source codes and model input and output for the specific model iterations presented in this review are in Arysta (2008a, b, c, d, e, f). Additional model description can also be found in Sweeney et al. (2009) which became publicly available after the DPR model review. Further information related to supporting data for the model construct and application previously submitted to DPR are also published within an entire issue of the Journal of Inhalation Toxicology (2009 issue 6, volume 21); many of these articles are added to the citations in Volume I for additional sources of information. For ease of cross reference between this review and Volume I, the same literature citation designation is used throughout both documents. This may mean, for example, a publication is designated as “b” while it is “a” for the same authors in the same year appearing later in sequence or not be used at all in this review.
33 34 35 36 37 38 39 40 41 42 43 44 45
II. FETAL DEATH IN RABBIT Aspects of the modeling framework that are important to establishing the HEC specifically for the fetal death endpoint include input parameters and model validation and the dose metric(s) for the HEC. A key issue in selecting the dose metric for the HEC is the exposure duration and
A-4

External Panel Review Draft MeI RCD Appendices to Volume I- August 10, 2009
1
2 3 4 5
Figure A-1. Diagram of MeI PBPK model. Taken directly from Arysta (2007).
A-5

External Panel Review Draft MeI RCD Appendices to Volume I- August 10, 2009
1 2 3 4 5 6 7 8 9
10 11 12 13 14 15 16 17 18 19 20 21 22 23 24 25 26 27 28 29 30 31 32
frequency associated with the NOEL. These essential determinants are discussed before the final presentation of the HEC. II.A. Model and Parameters The rabbit model was reviewed by USEPA (2007) for establishing HECs corresponding to a NOEL of 10 ppm, 5-fold higher than the 2 ppm established by DPR. The model description, codes, and parameters are in Arysta (2007) and Mileson et al. (2007). They are subsequently published in open literature (Sweeney et al., 2009). This section provides only a very brief description of the model, mainly as a backdrop for focusing on some key issues that could significantly impact the modeling outcome. Comparison of model output to the experimentally measured values is used to calibrate and adjust input variables for model fit. The iodide level in blood is designated as “plasma” in all Arysta model runs, while it is referred to as “serum” in toxicity studies. To simplify, “serum” is used in this review for the model output. Key determining variables involved in the initial model fit to data from NaI exposures in the study by Morris et al. (2004) (see: Table 50 and Section III.J.2. of Volume I) are: placental and maternal uptake, urinary elimination rate, and maternal and fetal iodide transfer (Mileson et al., 2007). The model documentation stated that further parameter adjustments (unspecified) to fit data from the MeI study by Sloter (2005a, b) compromised the fit to the Morris data. Mileson et al. (2007) further speculated that model parameters that may be iodide concentration-dependent (e.g., transfer between maternal and fetal blood) may need dose-dependent correction but this adjustment was not carried out due to the modeler’s conclusion that the current model provided a reasonable fit. The specific input parameters and simulation patterns highlighted below are identified for their importance to biological considerations in establishing the HEC and their potential to significantly impact the model outcome. Validation against measured data is included in these discussions. II.A.1. Alveolar Ventilation Rate (QAC)
33 34 35 36 37 38 39 40 41 42 43
Rabbit simulation The Arysta pregnant rabbit HEC model initially used the QAC of 12 L-hr/kg3/4 from non-pregnant rabbits. This is only approximately 70% of the pulmonary ventilation rate measured by DeLorme (2004) for non-pregnant females during 18.5 ppm MeI exposure. On the other hand, a higher QAC of 20 L-hr/kg3/4 for GD20-30 rabbits was used for comparing model output to experimental data from the Sloter studies (Sloter 2005a, b) in which rabbits received MeI on GD23-26. The justification for the use of a lower QAC in single day simulation is as a “health protective” or “conservative” input for the HEC determination (Mileson et al., 2007) and for targeting an early pregnancy stage (Mileson, 2008). Nevertheless, DPR considers it more important that a biologically valid parameter is used in PBPK modeling.
A-6

External Panel Review Draft MeI RCD Appendices to Volume I- August 10, 2009
The illustration of the model fit to the data from the Sloter studies is provided by Mileson et al. (2007) and given in Figure A-2a (a single exposure in 24 hours) and A-2b (4 repeated daily MeI exposures). These figures are taken directly from Figures 4a, b in Mileson et al. (2007). The model showed reasonable fit to the 3 data points for fetal serum levels within 24 hours but underestimated the maternal data, especially at hour 3. The fit for both maternal and fetal data became poorer as time progressed (Figure A-2b). No experimental data are available for model validation beyond a few days. The poor model fit in time indicates increasing uncertainty for extending the model beyond 24 hours, especially for accommodating the assumption by Mileson et al. (2007) that the NOEL should represent a single-day incremental exposure after the steady state of fetal blood iodide is reached on day 13. This issue on defining a single-day HEC corresponding to the NOEL is discussed in Section II.B.1.
1 2 3 4 5 6 7 8 9
10 11 12 13 14 15 16 17 18 19 20 21 22 23 24 25 26 27 28 29 30 31 32 33 34 35 36 37 38 39 40 41 42 43 44 45 46
Table A-1 presents the model output at 20 ppm MeI exposure but using the non-pregnant 12 L-hr/kg3/4 QAC. As expected, the lower QAC results in further deviation from the experimental measurements. During the first 24 hours, the maternal serum iodide concentrations were only 32 - 53% of the measured values. The fetal concentrations were lower at hour 3 (48% of measured values) and hour 6 (66% of measured values), but caught up with the measured values at hour 24. Thus, the use of lower QAC would significantly impact the HEC especially when maternal serum iodide is used as the dose metric. A comparison of HECs is available in Table A-4. After being informed of the above concerns by DPR, Arysta provided a revised model simulation using the QAC of 20 L-hr/kg3/4 in September 2008 (Arysta, 2008e). This model output became available when DPR’s model review was near its completion and the majority of model presentations from the lower QAC runs were already in place, and only at 2 ppm. DPR did not consider it necessary to delay the review process by requesting further model runs from Arysta (i.e., at 20 ppm) nor invest substantial resources to re-do a different set of basic model behavior illustrations. The value of QAC is clearly labeled for all data presented in this review. It should be emphasized that the DPR preferred 20 L-hr/kg3/4 QAC is used for generating model runs for DPR’s final HECs for this endpoint. They are presented in Section II.C. The lower QAC was used in the final single-day HEC modeled by USEPA (USEPA, 2007; Mileson, 2008) at the NOEL of 10 ppm. Model output at 20 ppm using 20 L-hr/kg3/4 QAC was recently provided by Rodriguez (2009) as a part of USEPA’s comments to the March 2009 draft of this DPR model review. The graphic comparisons of model fit at both QACs are presented in Figure A-3, taken directly from Rodriguez (2009). The modeled maternal serum iodide was 67 - 91% of the measured values in the 24 hours. The modeled fetal serum iodide was 95% of measured level at hour 3, but exceeded the measured levels by 31% at hour 6 and 81.3% at hour 24. Thus, the higher estimation of fetal serum iodide profile would be a concern if it is used as the dose metric for HEC determination. While data are not directly available for any AUC comparison, the use of lower QAC might be somewhat justified for USEPA’s HEC based on the fetal serum iodide dose metric because of the better model fit than at the higher QAC (Rodriguez, 2009). However, the issue remains regarding the physiological incongruity of using a low non-pregnant QAC for the window of vulnerability during GD23-26. Apparently the inability to achieve a good fit at both maternal and fetal serum iodide levels is beyond the adjustment of QAC parameter and is further evident from the standpoint of fetal-to-maternal (F/M) iodide ratio as presented in the next section.
A-7

External Panel Review Draft MeI RCD Appendices to Volume I- August 10, 2009
1 Figure A-2a
2 3 4
Figure A-2b
5 6 7 8 9
10 11
Figure A-2. Modeled versus measured data in rabbits (Taken from Mileson et al., 2007, Figure 4a and 4b). The measured data are from Sloter, 2005a. The “full model” in 4a includes both alveolar and nasal MeI uptakes. Lines: simulations; Symbols: experimental data. The QAC for this simulation is 20 L-hr/kg3/4. Using the lower QAC of 12 L-hr/kg3/4 would result in much poorer model fit than demonstrated here (see Table A-1).
A-8

External Panel Review Draft MeI RCD Appendices to Volume I- August 10, 2009
1 2 3 4 5 6
Figure A-3. Model rabbits at QAC 12 and 20 L-hr/kg3/4 (Taken from Rodriguez, 2009, Figure
1). The measured data (points) were from Sloter, 2005a. QAC at 20 L-hr/kg3/4 was used in the top simulation (lines) while 12 L-hr/kg3/4 was used in the bottom simulation (lines).
A-9
External Panel Review Draft MeI RCD Appendices to Volume I- August 10, 2009
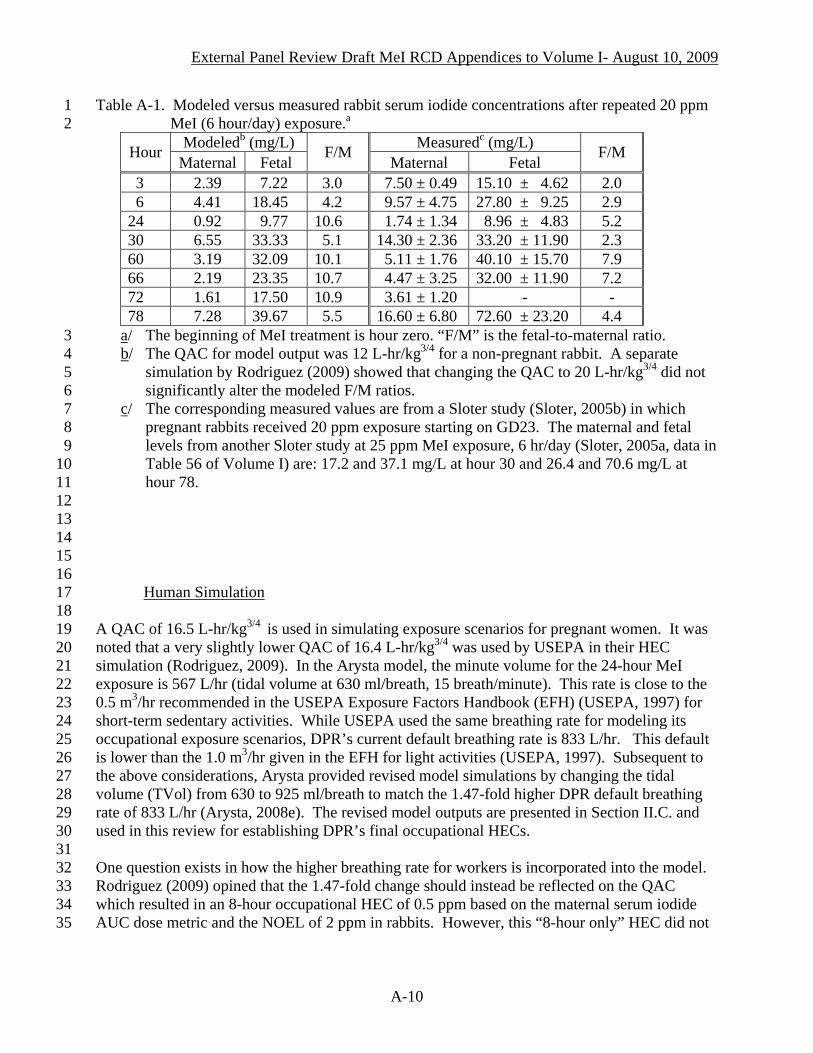
Table A-1. Modeled versus measured rabbit serum iodide concentrations after repeated 20 ppm MeI (6 hour/day) exposure.
1 2 a
Modeledb (mg/L) Measuredc (mg/L) Hour Maternal Fetal
F/M Maternal Fetal
F/M
3 2.39 7.22 3.0 7.50 ± 0.49 15.10 ± 4.62 2.0 6 4.41 18.45 4.2 9.57 ± 4.75 27.80 ± 9.25 2.9 24 0.92 9.77 10.6 1.74 ± 1.34 8.96 ± 4.83 5.2 30 6.55 33.33 5.1 14.30 ± 2.36 33.20 ± 11.90 2.3 60 3.19 32.09 10.1 5.11 ± 1.76 40.10 ± 15.70 7.9 66 2.19 23.35 10.7 4.47 ± 3.25 32.00 ± 11.90 7.2 72 1.61 17.50 10.9 3.61 ± 1.20 - - 78 7.28 39.67 5.5 16.60 ± 6.80 72.60 ± 23.20 4.4
3 a/ The beginning of MeI treatment is hour zero. “F/M” is the fetal-to-maternal ratio. b/ The QAC for model output was 12 L-hr/kg3/4 for a non-pregnant rabbit. A separate
simulation by Rodriguez (2009) showed that changing the QAC to 20 L-hr/kg4 5 6
3/4 did not significantly alter the modeled F/M ratios.
7 8 9
10 11 12 13 14 15 16
c/ The corresponding measured values are from a Sloter study (Sloter, 2005b) in which pregnant rabbits received 20 ppm exposure starting on GD23. The maternal and fetal levels from another Sloter study at 25 ppm MeI exposure, 6 hr/day (Sloter, 2005a, data in Table 56 of Volume I) are: 17.2 and 37.1 mg/L at hour 30 and 26.4 and 70.6 mg/L at hour 78.
17 18 19 20 21 22 23 24 25 26 27 28 29 30 31 32 33 34 35
Human Simulation A QAC of 16.5 L-hr/kg3/4 is used in simulating exposure scenarios for pregnant women. It was noted that a very slightly lower QAC of 16.4 L-hr/kg3/4 was used by USEPA in their HEC simulation (Rodriguez, 2009). In the Arysta model, the minute volume for the 24-hour MeI exposure is 567 L/hr (tidal volume at 630 ml/breath, 15 breath/minute). This rate is close to the 0.5 m3/hr recommended in the USEPA Exposure Factors Handbook (EFH) (USEPA, 1997) for short-term sedentary activities. While USEPA used the same breathing rate for modeling its occupational exposure scenarios, DPR’s current default breathing rate is 833 L/hr. This default is lower than the 1.0 m3/hr given in the EFH for light activities (USEPA, 1997). Subsequent to the above considerations, Arysta provided revised model simulations by changing the tidal volume (TVol) from 630 to 925 ml/breath to match the 1.47-fold higher DPR default breathing rate of 833 L/hr (Arysta, 2008e). The revised model outputs are presented in Section II.C. and used in this review for establishing DPR’s final occupational HECs. One question exists in how the higher breathing rate for workers is incorporated into the model. Rodriguez (2009) opined that the 1.47-fold change should instead be reflected on the QAC which resulted in an 8-hour occupational HEC of 0.5 ppm based on the maternal serum iodide AUC dose metric and the NOEL of 2 ppm in rabbits. However, this “8-hour only” HEC did not
A-10
External Panel Review Draft MeI RCD Appendices to Volume I- August 10, 2009
1 2 3 4 5 6 7 8 9
10 11 12
account for the 16 hours of additional exposure for these workers as a member of the general public at the HEC of 0.24 ppm. II.A.2. Maternal versus Fetal Iodide Levels The transfer between maternal and fetal iodide was one of the three key factors that determined the maternal and fetal serum iodide profile (Sweeney et al., 2009). The other two factors were placental and mammary uptake and urinary elimination rate. In the model, CLTRANS1C denotes placenta to fetus transfer and CLTRANS2C denotes fetus to placenta transfer. General illustrative model outputs for both rabbits and humans are presented in Table A-2 and discussed below in the context of their respective simulations.
13 14 15 16 17 18 19 20 21 22 23 24 25 26 27 28 29 30 31 32 33 34 35 36 37 38 39 40 41 42
Rabbit Simulation
The rabbit model used CLTRANS1C of 0.07 L/hr-kg0.75 and CLTRANS2C of 0.015 L/hr-kg0.75. The resultant fetal-to-maternal serum iodide ratios (F/M) are compared to the two sets of experimental data. The first comparison is to the measurements by Sloter (2005b) after 20 ppm MeI exposure. As shown in Table A-1, at the same MeI exposure level, the modeled F/M ratios are higher than the experimental data at all time points. A separate simulation by Rodriguez (2009) showed that changing the QAC to 20 L-hr/kg3/4 did not significantly alter the modeled F/M ratios. The second comparison is to the measurements from a NaI study by Morris et al. (2004). Although these data are used for model adjustment, the resultant F/M ratios at 2 and 10 ppm MeI exposure (Table A-2) show significant overestimation of the relative distribution of iodide to the fetal blood. The blood F/M ratios between 2 - 24 hours after a single i.v. injection of NaI on GD25 from Morris et al. (2004) are 2.6-5.8 at 0.75 mg/kg and 1.6-2.8 at 10 mg/kg (Table 58 in Volume I). The ratios from model output during the similar period are 3.1-8.2 at 2 ppm MeI and 3.4-10.0 at 10 ppm MeI exposure (Table A-2). Although the NaI study and MeI simulation differ in many respects (NaI given via i.v. versus MeI given via inhalation), the F/M comparison is possible since the NaI dose range in the Morris study was designed to encompass the range of iodide from toxicologically relevant MeI exposure levels. In this case, the range of total amount of iodide in the simulated 2-10 ppm MeI exposure is 1.5-7.6 mg/kg/day MeI, or 1.3-6.8 mg/kg/day iodide at 100% MeI inhalation absorption. The comparison is of value because it is based on the level of iodide in circulation and not the external NaI or MeI dose. No other experimental data are available for similar validation comparisons. The general pattern is a higher simulated F/M ratio than the results from the two model calibration studies, even within the first 24 hours of MeI exposure. This indicates that a more holistic adjustment of transfer rates and other input parameters within the model construct would be desirable especially if fetal serum iodide is used as the dose metric for the HEC.
A-11

External Panel Review Draft MeI RCD Appendices to Volume I- August 10, 2009
Table A-2. Modeled fetal-to-maternal serum iodide (F/M) ratio in rabbits and humans exposed to MeI.
1 2 a
Modeleda – Rabbits Modeleda – Humans 2 ppm 10 ppm 3.7 ppm Hour
M F F/M M F F/M M F F/M
3 0.16 0.50 3.1 0.94 3.20 3.4 0.53 0.53 1.0 6 0.21 0.91 4.4 1.57 6.98 4.5 0.95 0.95 1.0 24 0.06 0.50 8.2 0.41 4.14 10.0 2.20 2.06 0.9 30 0.29 1.44 5.0 2.72 14.2 5.2 1.36 1.40 1.0 60 0.20 1.63 8.1 1.53 15.5 10.2 0.11 0.17 1.6 66 0.18 1.47 8.0 1.13 11.9 10.5 0.071 0.13 1.8 72 0.17 1.33 8.0 0.89 9.40 10.6 0.049 0.097 2.0 78 0.42 2.33 5.5 3.38 19.7 5.8 0.037 0.078 2.1 96 0.20 1.63 8.1 0.93 9.94 10.6 0.021 0.049 2.4 a/ Data from Mileson et al., 2007. “M” and “F” are mg/L iodide concentrations in maternal
and fetal serum, respectively. The rabbit simulation represents daily 6 hours of MeI exposure for 4 days using the lower QAC of 12 L-hr/kg
3 4 5 6 7 8 9
10 11 12
3/4. The human simulation represents a single 24-hour MeI exposure.
13 14 15 16 17 18 19 20 21 22 23 24 25 26 27 28 29 30 31 32 33 34
Human Simulation The ratio of cord-to-maternal blood iodide concentration was reported in an earlier study by Cottino et al. (1972) with 18 women who received iodomethylsparteine through i.v. injection at termed delivery. The time between the injection and delivery ranged from 15 minutes to 48 hours, and the paired cord-to-maternal blood iodide concentration ranged from 0.5 to 3.4. More recently, Rayburn et al. (2007) conducted a survey on plasma iodide concentration of paired maternal and cord blood at delivery (Table 51 in Volume I). These data are subsequently published in the open literature (Rayburn et al., 2008). The surveyed subjects did not have any documented exposure to any test substances nor povidone iodine. The results are summarized in Table A-3. The average cord-to-maternal blood iodide ratio of 1.2 from this study was used to adjust the CLTRANS1C (placenta to fetus) and CLTRANS2C (fetus to placenta) parameters to 0.15 and 0.12 L/hr-kg0.75 respectively in the model (Mileson et al., 2007; Barton, 2007). Mileson et al. (2007) considered this 1.2 ratio as “conservative” compared to using the pre-term ratio of 0.9. In this consideration, Arysta regarded the 0.9 ratio as a possibly better alternative for representing the end-of-first-trimester stage which they assumed to be the window of vulnerability to MeI toxicity and thus the target for their HEC simulation. However, it is DPR’s view that even if the end of first trimester is the only target period for fetal death from MeI exposure, data are unavailable for determining how well iodide levels collected from deliveries during gestation week 29 – 36 may represent the early gestation stage when excess iodide is introduced through exposure to MeI. The related issue of fetal stage at the weight of 0.27 kg is a subject of separate discussion in Section II.A.4.
A-12

External Panel Review Draft MeI RCD Appendices to Volume I- August 10, 2009
Table A-3. Plasma iodide concentration in human maternal and cord blood at delivery.a 1 Blood Iodide (µg/dL) Cord-to-Maternal Delivery N Maternal Cord Ratio Range
Pre-term (29-36 week) 29b 1.6±0.4 1.4±0.5 0.9±0.4 0.35 – 2.11 Term (37-41 week) 92 1.5±0.5 1.7±0.7 1.3±0.8 0.35 – 5.4 All subjects 121b 1.5±0.7 1.6±0.7 1.2±0.7 0.35 – 5.4 a/ Data as reported by Rayburn et al. (2007) 2
3 4 5 6 7 8 9
10 11 12 13 14 15 16 17 18 19 20 21 22 23 24 25 26 27 28 29 30 31 32 33 34 35 36 37 38 39 40 41
b/ Excludes 2 data pairs both at gestation week 33 delivery. One pair with extreme cord blood concentration suspected as contamination, resulted in a cord-to-maternal ratio of 255.9. The other with high maternal blood concentration reported as requiring antiarrhythmic therapy, resulted in a cord-to-maternal ratio of 0.41. They are not included in the statistical analysis.
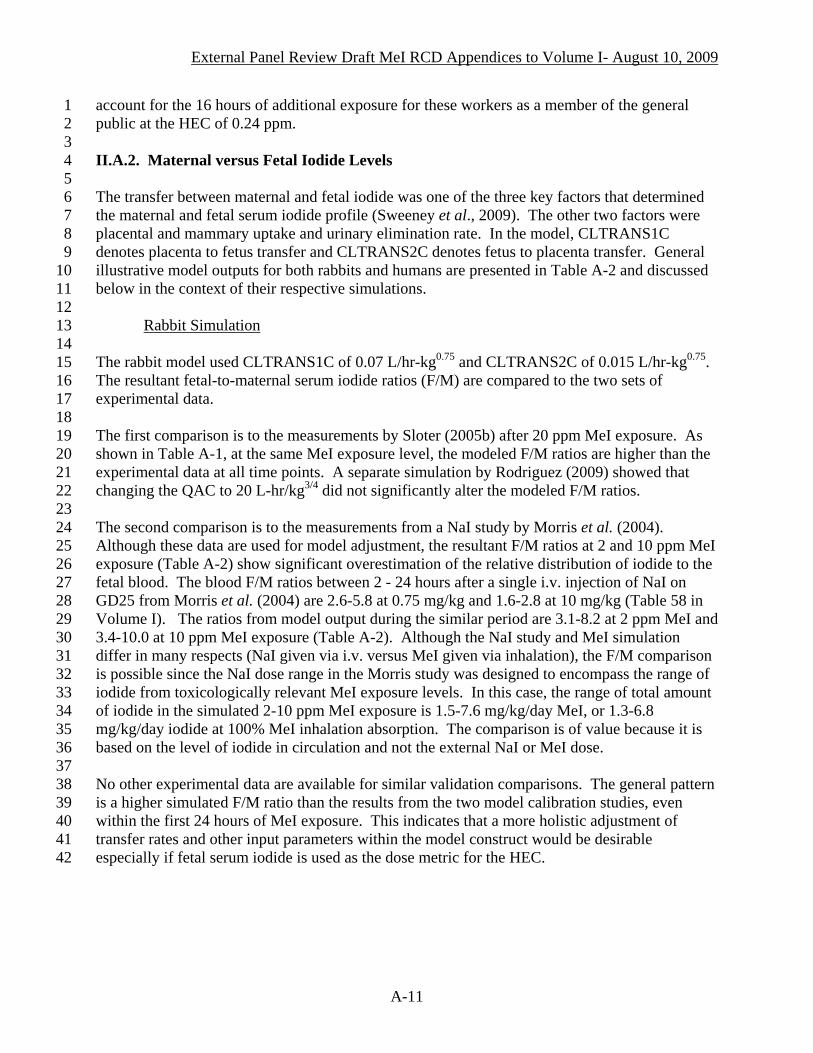
Another important observation regarding the F/M ratio is that it is dynamic, not a fixed value. This can be demonstrated in two scenarios: by comparing simulation results from two MeI exposure levels and by following the time of diminishing serum iodide concentrations after MeI exposure. Figure A-4 illustrates the first scenario at 0.15 and 3.4 ppm MeI exposure levels. These levels are parts of a large set of simulations from Arysta (2008c) and are used here only for illustration purposes. While the fetal iodide concentration is consistently higher than the maternal level at 0.15 ppm MeI exposure, this relationship is reversed near the peak concentration at 3.4 ppm MeI. Table A-2 illustrates the second scenario at 3.7 ppm MeI exposure. The F/M ratio gradually increases with decreasing serum iodide level after the end of 24 hours of exposure, from 1.0 within hour 24 to 2.1 - 2.4 by hour 78 - 96. The higher simulated F/M ratio is of interest because the corresponding serum iodide levels are down at the range reported by Rayburn et al. (2007) but with 2-fold higher F/M ratio in the simulation output. The discrepancy raises uncertainty about how well either the Rayburn study or the model can describe the dynamics of iodide distribution between maternal and fetal compartments after MeI exposure. Overall, data in both rabbits and humans indicate greater uncertainty at the fetal compartment level. In the rabbit model, the F/M ratios did not compare well with measured data at 20 ppm MeI. Nor did they compare well with data from the only available NaI study. In the human model, it is uncertain how well data from the Rayburn study can adequately represent the modeled MeI exposure scenarios, specifically regarding the unmatched gestation stage (i.e., applying data from beyond gestation week 29 to model the end of the first trimester stage) and the iodide exposure status (i.e., applying data from non-iodide exposure conditions to substantially high excess iodide exposure scenarios). The simulation shows that the ratio is not constant after MeI exposure and can be much higher than the targeted ratio at a comparable range of serum iodide concentrations in the Rayburn study.
A-13
External Panel Review Draft MeI RCD Appendices to Volume I- August 10, 2009
1
Serum Iodide Concentration - Human 24 hr 0.15 ppm MeI
0.00
0.02
0.04
0.06
0.08
0.10
0 24 48 72 96
Time (hr)
Ser
um Io
dide
Con
c (m
g/L)
Mat'al
Fetal
2
Serum Iodide Concentration - Human 24 hr 3.4 ppm MeI
0.00
0.25
0.50
0.75
1.00
1.25
1.50
1.75
2.00
2.25
0 24 48 72 96
Time (hr)
Ser
um Io
dide
Con
c (m
g/L)
Mat'al
Fetal
3 4 5
Figure A-4. Modeled human serum iodide concentration at 0.15 and 3.4 ppm MeI for 24 hours. Data from Arysta (2008c).
A-14
External Panel Review Draft MeI RCD Appendices to Volume I- August 10, 2009
1 2 3 4 5 6 7 8 9
10 11 12 13 14 15 16 17 18 19 20 21 22 23 24 25 26 27 28 29 30 31 32 33 34 35 36 37
II.A.3. Fetal Thyroid Iodide Level Arysta used data from the Morris et al. (2004) rabbit study with NaI as starting points for modeling iodide disposition variables. The stated model assumption was that when blood kinetics are accurately predicted, tissue-specific parameters are sufficiently accurate without needing further adjustment (Mileson et al., 2007). Although the modeling focuses on the serum MeI and iodide profiles, iodide distribution to fetal thyroid is of specific interest because fetal thyroid is the target tissue of the Arysta proposed mode of action (MOA) (Arysta, 2007). However, since no single MOA for fetal death can be clearly supported (Section IV.A.1.a. of Volume I), the following discussion is mainly on the concerns for the extremely high iodide accumulation in this biologically relevant tissue, and not necessarily for considerations that would directly influence the HEC dose metric selection. The Morris study showed that within 24 hours of NaI injection on GD25, fetal thyroid did not accumulate iodide as compared to levels in fetal trachea. In fact, at 0.75 and 10 mg/kg NaI, fetal thyroid iodide level is substantially lower than the maternal level (Table 58 and Figure 4 in Volume I). Thus, it is surprising that the model predicted a 4.2 mg/L peak iodide level in fetal thyroid follicles at the end of the 6 hour MeI exposure, a level that is 217-fold higher than the maternal level at 0.02 mg/L (Figure A-5). The fetal-to-maternal ratio is further increased to 513-fold after 18 hours of no exposure. Regarding the ratio of fetal to maternal iodide in rabbit thyroid follicles, model output from different sets of runs indicated that compared to the ratio of 217 at the end of 6-hour of 2 ppm MeI exposure, the ratio is 37 at 20 ppm MeI (maternal 0.4 mg/L, fetal 14.9 mg/L) and 68 at 10 ppm (maternal 0.14 mg/L, fetal 9.8 mg/L) MeI. Thus, within the 2 to 20 ppm MeI range, the iodide concentrations in fetal thyroid follicles are substantially higher than the maternal, contrary to the lack of fetal thyroid iodide accumulation reported in the Morris study from NaI iv injection. Further comparison to rabbit data cannot be made due to the difference in dosing regimen and the NaI versus MeI exposure. The human model shows an even more distinct pattern of iodide accumulation to the fetal thyroid follicles and at a much higher level than rabbits (Figure A-6). For a single 24-hour exposure to 0.15 – 3.4 ppm MeI, the fetal thyroid iodide saturates at 208 mg/L. Unlike the decline in rabbits after the exposure (Figure A-5), this level remains unchanged in human fetal thyroid after MeI exposure, for at least up to hour 96; i.e., 3 days after the exposure. This plateau is 50-fold above the already seemingly high modeled rabbit fetal thyroid level at the end of 6-hour exposure. Within the human model, the fetal plateau is 1,800-fold higher than the maternal level at the end of the 24-hour exposure to 0.15 ppm MeI.
A-15

External Panel Review Draft MeI RCD Appendices to Volume I- August 10, 2009
1
2 3 4 5 6
Tissue Iodide Concentration - Rabbit 6-hr 2 ppm MeI
0.00
1.00
2.00
3.00
4.00
5.00
0 6 12 18 24
Time (hr)
Iodi
de C
once
ntra
tion
(mg/
L)
Figure A-5. Modeled iodide tissue distribution in rabbits at 2 ppm MeI for 6 hours (simulation
using the lower QAC of 12 L-hr/kg3/4). Data from Arysta (2008c). “T-follicles”: thyroid follicles. The reduced figure at upper right corner magnified the maternal patterns. The maternal profiles are enlarged at the upper right box.
Fetal T-Follicles
Fetal Serum
Mat'al serum
Mat'al Brain
Mat'al T-Follicles
Tissue Iodide Concentration - Rabbit 6-hr 2 ppm MeI
0.00
0.10
0.20
0 6 12 18 24
Time (hr)
Iodi
de C
onc
(mg/
L)
A-16

External Panel Review Draft MeI RCD Appendices to Volume I- August 10, 2009
1 2 3 4 5 6 7 8 9
10 11 12 13 14 15 16 17 18 19 20 21 22 23 24 25 26 27 28
Fetal Thyroid Follicles - Human 24 hr MeI
0.00
50.00
100.00
150.00
200.00
250.00
0 24 48 72 96
Time (hr)
Thyr
oid
Folli
cle
Iodi
de C
onc
(mg/
L)
3.4 ppm
2.8 ppm
1.5 ppm
0.86 ppm
0.78 ppm
0.7 ppm
0.38 ppm
0.15 ppm
Figure A-6. Modeled iodide concentration in human fetal thyroid follicles at 0.15 - 3.4 ppm
MeI. Data from Arysta (2008c).
A-17

External Panel Review Draft MeI RCD Appendices to Volume I- August 10, 2009
The high predicted level of iodide in human fetal thyroid can be a serious concern. On the one hand, its high simulated level may merely indicate the need to further adjust the model construct or parameters. The model documentation mentioned that the lack of modeling stability in predicting fetal thyroid iodide resulted in abandoning the initial attempt to use it as the dose metric for HEC determination (Arysta, 2007). On the other hand, although no tissue distribution data from MeI exposure are available for validation, these high levels could have some likelihood of reality since the model description stated that the iodide transfer rates were derived based on the fit to human fetal thyroid iodide levels as used in the models for perchlorate risk assessment (Gargas et al., 2005).
1 2 3 4 5 6 7 8 9
10 11 12 13 14 15 16 17 18 19 20 21 22 23 24 25 26 27 28 29 30 31 32 33 34 35 36 37 38 39 40 41 42
Further investigate may be needed for applying the basic human iodide submodel used for assessing the thyroid inhibition by perchlorate to scenarios of excess iodide from MeI exposures. This is desirable even if merely to ensure that the higher level of iodide sequestered into fetal thyroid would not significantly impact the dose metric selection for the HEC modeling. More importantly, if such high fetal thyroid iodide is indeed reflective of human consequence from MeI exposure, its human fetal health implication would be of great concern at the range of 0.15 – 3.4 ppm MeI demonstrated in Figure A-6. In fact, by applying USEPA’s default uncertainty factor of 30 to their acute HEC of 4.5 ppm MeI (for 50% GSH depletion in nasal tissue) (USEPA, 2007), the acute RfC would be 0.15 ppm, exactly the level illustrated in Figure A-6. II.A.4. Human Fetal Stage The human model is represented by a maternal body weight of 61.1 kg and a fetal weight of 0.27 kg (i.e., a single fetus at maternal weight fraction “VFETC”of 0.0044). The model targets the stage of fetal thyroid ontogeny (Mileson, 2008). Human free T4 and T3 in cord blood begin to increase in gestation week (GW) 12, and the iodide uptake to follicular cells begins to increase in GW18-20 (Howdeshell, 2002). However, fetal thyroid vulnerability should not be limited only to the onset of its ontogeny. The development of iodide autoregulation takes place much later, during GW36-40 (Fuse, 1996; Howdeshell, 2002). Thus, human fetal thyroid vulnerability would not be limited to the end of the first trimester, even when the model is used in the context of the MOA proposed by Arysta (2007), i.e., excess fetal iodide perturbs fetal thyroid function as in a typical Wolf-Chaikoff effect. Instead, the period of vulnerability would extend to any time before the full development of thyroid autoregulation (Fisher and Klein, 1981). It is also important to consider the impact of MeI exposure at a higher VFETC for the gestation period beyond the end of the first trimester because there is no compelling evidence for a single proposed MOA. In this case, assuming the applicability of the low normalized sensitivity coefficient1 for VFETC (given as “<0.05” in Table 11 of Mileson et al., 2007), a 5- to 10-fold higher value for the VFETC (from 0.27 kg, or 0.6 pounds, to 3 to 6 pound fetuses) for later gestation period may still be significant. A more precise estimate on the effect of VFETC was provided in the Arysta comments to DPR March 2009 draft Volume I (Arysta, 2009). A 10-fold higher VFETC would result in decreased iodide level by 12% in the maternal but 42% in the
1 Normalized sensitivity coefficient (SC) is the change to the predicted dose metrics from changes in model parameter values. It is calculated as the ratio of fractional change in the model prediction to 1% change in the model parameter.
A-18

External Panel Review Draft MeI RCD Appendices to Volume I- August 10, 2009
1 2 3 4 5 6 7 8 9
10 11 12 13 14 15 16 17 18 19 20 21 22 23 24 25 26 27 28 29
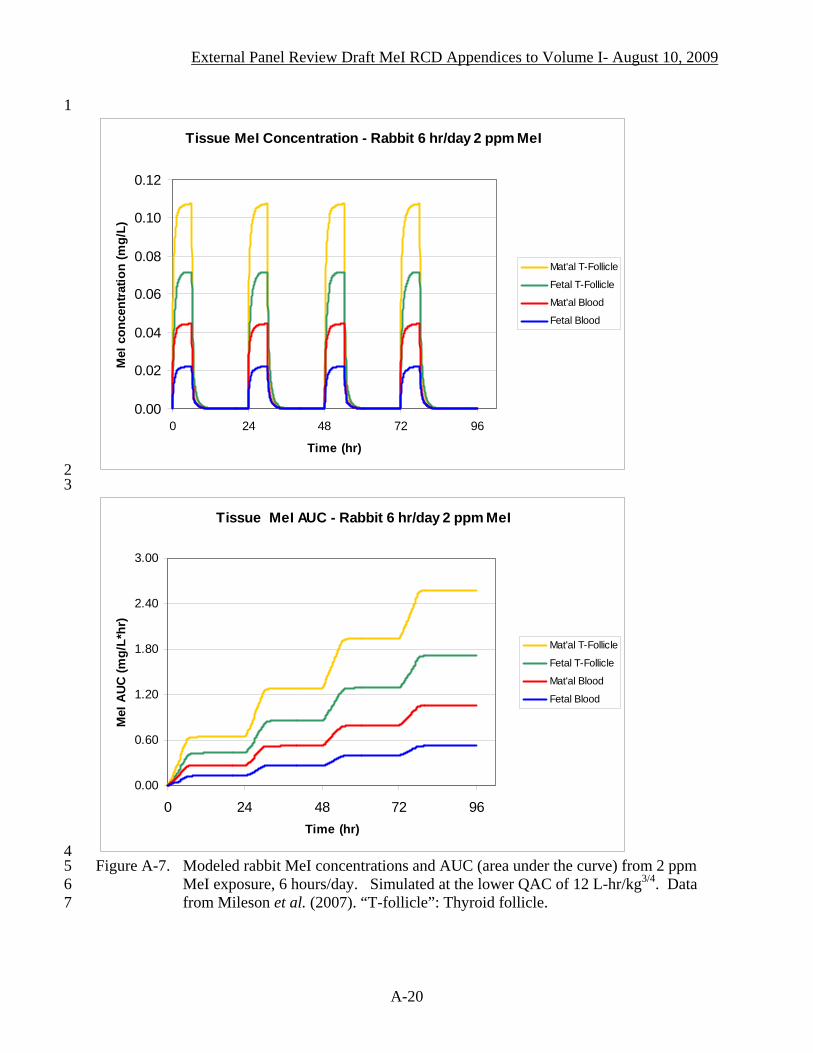
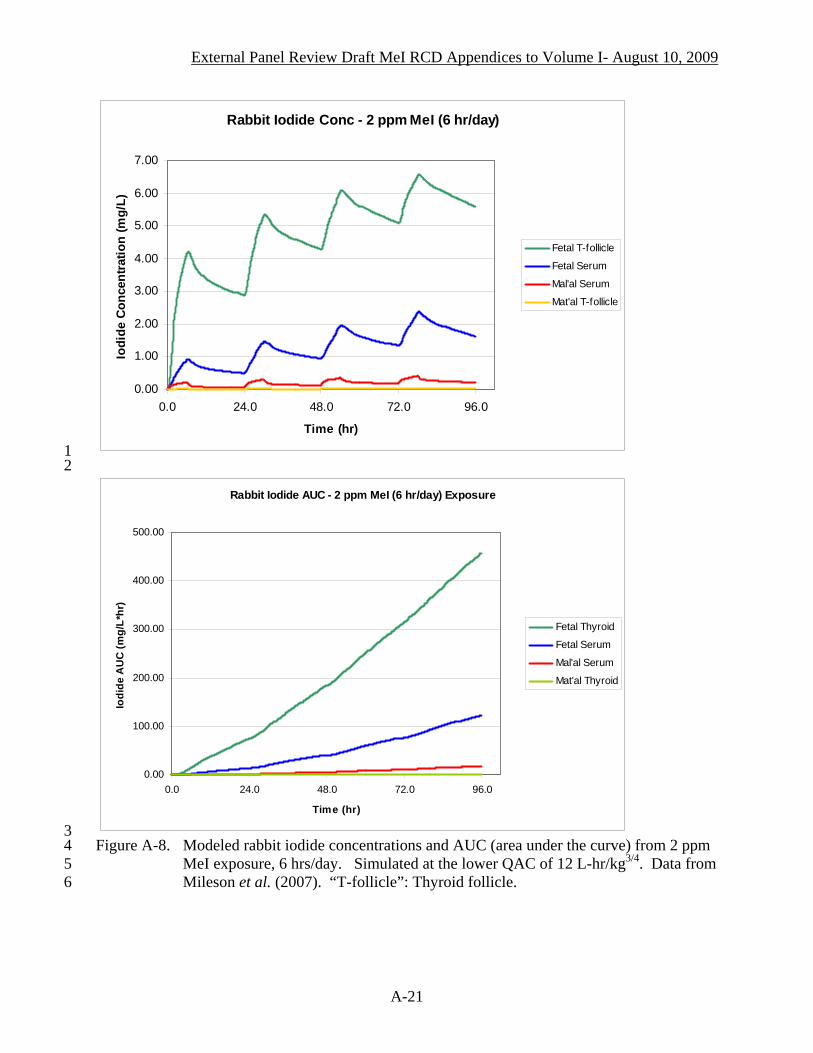
fetal serum at 0.24 ppm MeI exposure. Given the uncertainties regarding the choice of fetal stage in modeling, its huge impact on the fetal dose metric would also support the use the maternal instead of fetal serum iodide dose metric in HEC determination. II.A.5. Time Course Profile Patterns from multiple days of exposure for the dose metrics of interest provide the necessary context for simulating single-day HECs. The general patterns of blood and thyroid distribution of MeI and iodide in rabbits after multiple days of 2 ppm MeI exposure (6 hr/day) are illustrated in Figure A-7 for MeI and Figure A-8 for iodide. Figure A-7 shows that the concentration of MeI diminishes after the 6 hours of exposure without a day-to-day accumulation. Figure A-8 shows that the rise of serum iodide from the first 6 hours of exposure does not return to the baseline by the end of 24 hours. Simulations for humans also follow the similar pattern. Corresponding comparison of maternal and fetal output in rabbits (i.e., comparing blood to blood, thyroid to thyroid) shows that the maternal is higher for the MeI profiles whereas the fetal is higher for the iodide profiles. II.A.6. Summary Available data for adjusting the input variables are limited, with experimental data only available at approximately 10-fold above the modeled 2 ppm and with high variability. The fundamental issue concerning modeling fetal death based on surviving fetal data remains unresolved. When compared to available experimental data, the model output shows some discrepancy within the first 24 hours of exposure and to a greater extent beyond the one-day period. In general, the model output shows greater iodide in rabbit fetal serum relative to the maternal level than experimentally reported. This may indicate a greater uncertainty for using rabbit fetal serum iodide as dose metric for HECs. Other questions remain for some biological considerations (e.g., fetal stages) and simulation outcomes (e.g., extremely high fetal thyroid iodide level). The dose metric selection is discussed in the subsequent section.
A-19
External Panel Review Draft MeI RCD Appendices to Volume I- August 10, 2009
1
Tissue MeI Concentration - Rabbit 6 hr/day 2 ppm MeI
0.00
0.02
0.04
0.06
0.08
0.10
0.12
0 24 48 72 96
Time (hr)
MeI
con
cent
ratio
n (m
g/L)
Mat'al T-Follicle
Fetal T-Follicle
Mat'al Blood
Fetal Blood
2 3
Tissue MeI AUC - Rabbit 6 hr/day 2 ppm MeI
0.00
0.60
1.20
1.80
2.40
3.00
0 24 48 72 96Time (hr)
MeI
AU
C (m
g/L*
hr)
Mat'al T-Follicle
Fetal T-Follicle
Mat'al Blood
Fetal Blood
4 5 6 7
Figure A-7. Modeled rabbit MeI concentrations and AUC (area under the curve) from 2 ppm MeI exposure, 6 hours/day. Simulated at the lower QAC of 12 L-hr/kg3/4. Data from Mileson et al. (2007). “T-follicle”: Thyroid follicle.
A-20
External Panel Review Draft MeI RCD Appendices to Volume I- August 10, 2009
Rabbit Iodide Conc - 2 ppm MeI (6 hr/day)
0.00
1.00
2.00
3.00
4.00
5.00
6.00
7.00
0.0 24.0 48.0 72.0 96.0
Time (hr)
Iodi
de C
once
ntra
tion
(mg/
L)
Fetal T-follicle
Fetal Serum
Mal'al Serum
Mat'al T-follicle
1 2
Rabbit Iodide AUC - 2 ppm MeI (6 hr/day) Exposure
0.00
100.00
200.00
300.00
400.00
500.00
0.0 24.0 48.0 72.0 96.0
Time (hr)
Iodi
de A
UC
(mg/
L*hr
)
Fetal Thyroid
Fetal Serum
Mal'al Serum
Mat'al Thyroid
3 4 5 6
Figure A-8. Modeled rabbit iodide concentrations and AUC (area under the curve) from 2 ppm MeI exposure, 6 hrs/day. Simulated at the lower QAC of 12 L-hr/kg3/4. Data from Mileson et al. (2007). “T-follicle”: Thyroid follicle.
A-21

External Panel Review Draft MeI RCD Appendices to Volume I- August 10, 2009
1 2 3 4 5 6 7 8 9
10 11 12 13 14 15 16 17 18 19 20 21 22 23 24 25 26 27 28 29 30 31 32 33 34 35 36 37 38 39 40 41 42 43 44 45
II.B. Dose Metric Appropriate selection of dose metric(s) is essential to the application of a PBPK model for establishing the HEC. Considerations for the dose metric determination for the fetal death endpoint include the exposure scenario associated with the NOEL and the model output parameter(s) that best reflect the pattern of human exposure without tending toward underestimation. No candidate target tissue marker beyond blood level of MeI or iodide can be identified without a clearly supported MOA, especially for immediately after the second 6 hr/day exposure (i.e., hour 30). II.B.1. Single Day 2 ppm NOEL One key question in modeling the HEC for fetal death is how to derive a single-day HEC based on the 2 ppm NOEL established in a study when pregnant rabbits received MeI exposure during GD6-28. The two possible assumptions for the NOEL are: 1) a single- day exposure, and 2) a single-day incremental exposure. The first assumption was used by USEPA to model HEC at a NOEL of 10 ppm (Barton, 2007). The second assumption is proposed by Mileson et al. (2007) for modeling the HEC at the 2 ppm NOEL, i.e., the one-day increment of the area under curve (AUC) for fetal serum iodide after its steady state is achieved on day 13 of repeated exposure (i.e., AUCday14 - AUCday13). On the human side of the equation, the AUC is extended over 96 hours to accommodate the iodide clearance subsequent to a 24-hour exposure (i.e., AUCday 0-4). Thus, this second assumption can be expressed as “human AUCday0-4 = rabbit [AUCday14 - AUCday13]”. In this review, several aspects of MeI toxicity data are considered for determining the most appropriate frequency of exposure for modeling the HEC based on the 2 ppm NOEL. The dilemma is due to the lack of data to determine the dose-response relationship for less than the 23 days (GD6-28) of exposure from which the current 2 ppm NOEL is established. There are no data for estimating what might be the NOEL had pregnant rabbits been exposed to MeI for only a few days. However, it has been demonstrated that an 8 – 9 days of 20 ppm MeI exposure prior to GD22 (i.e., GD6-14 or GD15-22) did not result in pre-natal fetal death (Table 55 in Volume I). Thus, there is no support for modeling HEC based on 14 days of MeI exposure (i.e., rabbit [AUCday14 - AUCday13]). It has also been demonstrated that during GD23-26, fetal death is evident at hour 30, immediately after the second 6-hour daily exposure to 20 - 25 ppm MeI (Tables 55, 56, and 57 in Volume I). Although the incidence was not statistically significant, it is unequivocally recognized as biologically significant for identify the window of vulnerability. Thus, it is reasonable to model the HEC based on a single- day exposure. There are also no data for assessing the dose-response relation for 1 - 2 days of MeI exposure and establishing a NOEL other than the current 2 ppm benchmark. The only studies within this duration are conducted at a single MeI concentration 10- to 13-fold higher than 2 ppm. These studies, in which test animals are killed right after the second day of exposure, would also not be sufficient for characterizing the full magnitude of response because enough time has not been given for the manifestation of fetal effects.
A-22

External Panel Review Draft MeI RCD Appendices to Volume I- August 10, 2009
1 2 3 4 5 6 7 8 9
10 11 12 13 14 15 16 17 18 19 20 21 22 23 24 25 26 27 28 29 30 31 32 33 34 35 36 37 38 39 40 41 42 43 44 45 46
Given the lack of data, DPR follows the conventional default for assessing developmental effects and assumes that these effects can occur as a result of a single exposure event within a specific window of vulnerability corresponding to a specific vulnerable developmental stage (USEPA, 1991). This guideline was also acknowledged and followed in Arysta’s risk assessment (Mileson et al., 2009). In addition to the support from fetal death immediately after the second 6 hours of MeI exposure, support for the single-day exposure assumption is also provided by the profiles on GSH depletion as presented in Section IV.A.1.a. of Volume I (including Table 59 and Figure 5). Significant GSH depletion in fetal blood was detected as early as after one 6-hour 20-ppm exposure. There is no clear evidence that the level of GSH at 62% of controls is further reduced significantly with additional repeated exposure, at least within the available measurement time point, i.e., Table 59 in Volume I which shows a range of 55 to 72% of controls after 2- to 4-day of exposure. Moreover, in vitro study with neural cell cultures showed a very quick decline of GSH that reaches the maximum depletion 15 minutes after a 5-minute exposure to MeI (Chamberlain et al., 1999) while cell death did not begin until 6 hours after the exposure, near the time for full GSH recovery. Thus, for a possible MOA that involves oxidative stress and with delayed onset of cytotoxicity and cell death, a single-day exposure would also be reasonable for HEC determination. In summary, with insufficient support for a single predominant MOA within the time frame of 30 or less hours, it is prudent to model the HEC at the 2 ppm NOEL based on a single-day exposure for both rabbits and humans. II.B.2. HEC Dose Metric The 8 possible dose metrics are the permutations of maternal or fetal blood levels of MeI or iodide at their peak (or steady state) concentration or area under the curve (AUC). For the fetal compartment, fetal circulating MeI can be a possible dose metric because its presence is supported by the detection of S-methylcysteine hemoglobin adducts in the fetal blood. However, no experimental data are available for model validation. Fetal circulating iodide is a viable candidate dose metric because experimental data in rabbits are available. However, the use of this dose metric should be viewed with caution for several reasons. First, all the experimental measurements used for model validation are from fetuses that survived the MeI exposure, a direct opposite outcome to the endpoint targeted for modeling. Secondly, the model predicted iodide F/M (fetal-to-maternal) ratios are generally higher than those experimentally measured in rabbits (Section II.A.2.). The proportionally higher simulated distribution to the rabbit fetal blood may result in underestimation of risk by setting a higher benchmark for modeling the HEC than can be supported. Moreover, the 0.9 - 1.3 cord-to-maternal ratios from the survey by Rayburn et al. (2007) (see: Table A-3) has been cited as support for lower fetal iodide load in humans than in rabbits (Mileson et al., 2007). However, the range of human cord-to-maternal ratio is wide with 12 of the 121 sets at or above 2 (the highest ratio of 5.4), significantly overlapping the average F/M ratio in rabbits. An earlier study by Cottino et al. (1972) also showed a wide blood ratio (0.5 - 3.4) among 18 women who received iodomethylsparteine for 15 minutes to 18 hours at termed delivery. Moreover, the issue of appropriate human fetal stage for modeling the HEC also brought out the question of the applicability of Rayburn study data. While this remains a question of interest, it should be
A-23

External Panel Review Draft MeI RCD Appendices to Volume I- August 10, 2009
1 2 3 4 5 6 7 8 9
10 11 12 13 14 15 16 17 18 19 20 21 22 23 24 25 26 27 28 29 30 31 32 33 34 35 36 37 38 39 40 41 42 43 44 45 46
remembered that a significantly higher fetal body weight model input parameter would have a much greater impact on the predicted human iodide levels in the fetal than maternal serum, thus proportionally raising the HEC based on fetal serum iodide dose metric. Finally, the baselines for the data on F/M ratio between rabbits and humans are dissimilar. The maternal levels reported in the Rayburn study (2007) are from subjects with no known excess iodide exposure, with the plasma iodide ranging from 0.003 to 0.05 mg/L (or, 0.3 to 5.6 μg/dL as reported). Whereas, the rabbit maternal iodide concentration from MeI exposure is 460 – 4,700 fold higher, ranging from 14 to 26 mg/L (Table 56 and 57 in Volume I). Additional discussion on dynamic changes in the F/M ratio has been presented in Section II.A.2. No other data, including fetal iodide distribution in rats, are available for supporting the argument of wide interspecies sensitivity to excess iodide. Thus, while species specific distribution of iodide to fetus remains a valid pharmacokinetic consideration, fetal serum iodide should not be the definitive dose metric for HEC, especially when it yields higher HECs than all other valid dose metrics and presumes on a MOA that cannot be sufficiently supported. The use of the maternal MeI or iodide dose metric has the advantage of focusing more on the total internal dose of exposure without the additional uncertainties of further modeling to the fetal distribution level. They are more suitable dose metrics when no single MOA can be supported. The potential disadvantage of the maternal MeI dose metric is that no measurement data are available for model validation. Moreover, its level is only a small fraction of iodide due to its rapid transformation and thus can be potentially more subject to accuracy concerns for reflecting the pattern of total MeI exposure. In contrast, USEPA (2007) agreed with Arysta’s proposed MOA that fetal thyroid perturbation from excess iodide is the definitive MOA for rabbit fetal death (see: Section IV.A.1.a. of Volume I). However, maternal instead of fetal serum iodide was initially chosen by USEPA as the dose metric due to the inadequacy of fetal versus maternal iodide data in humans. Following the completion of a study by Rayburn et al. (2007) that surveyed iodide levels in human maternal and cord blood, USEPA determined that the data on human maternal-to-fetal iodide distribution was sufficient for changing the HEC dose metric from maternal to fetal iodide (Barton, 2007). The choice of peak concentration versus AUC is an important consideration, especially because the NOEL determined in rabbits consists of only 6 hours of exposure while both the general public and workers are expected to be exposed for 24 hours. Although workers associated with the use of MeI may only receive 8 hours of exposure during work, if they also live within the exposed community, they can be expected to receive further MeI exposure at the ambient level for the remaining 16 hours. The cumulative dose from 6- versus 24-hour MeI exposure durations between rabbits and humans can be accounted for by the AUC dose metric but not by the peak concentration, especially if the steady state of the selected dose metric is reached before the end of the specified exposure duration or the protracted decline after the exposure is to be accounted for. In conclusion, the overall evidence presented in this and previous sections indicate that maternal iodide dose metric is more reliable compared to the fetal iodide picture for reflecting the maternal MeI exposure status on which the rabbit NOEL was based. Maternal dose metrics are
A-24

External Panel Review Draft MeI RCD Appendices to Volume I- August 10, 2009
1 2 3 4 5 6 7 8 9
10 11 12 13 14 15 16 17 18 19 20 21 22 23 24 25 26 27 28 29 30 31 32 33 34 35 36 37 38 39 40 41 42 43 44 45 46
also more reliable than fetal dose metric for interspecies comparisons without contending with the uncertainties of an exclusive MOA based fetal thyroid perturbation from excess iodide, and the apparent higher simulated fetal to maternal serum iodide ratio in rabbits. Finally, the decision for using maternal serum iodide AUC dose metric is also supported by the overall conclusion by Sweeney et al. (2009). Although coming from somewhat different points of consideration, the model authors stated that the “… confidence in the PBPK model predictions for the reproductive/development effects of iodide in rabbits is considered moderate using fetal iodide and high using maternal iodide…”. The HEC should be based on the equivalence AUC between a single 6-hour 2 ppm MeI exposure in rabbits and a single 24-hour MeI exposure in humans (i.e., referred to by Arysta model output as “bystanders”). Workers are expected to continue receiving exposure at the MeI level as a member of the general public after receiving occupational exposure during work hours. II.C. HECs The rabbit model uses meidpr2.csl and meidpr2cmd files provided by Arysta (2007). Three sets of HEC simulation runs were conducted in 2008. These include: 1) output for the general population (Arysta’s “bystander’s”) HECs (Arysta, 2008a, b) and their subsequent correction (Arysta, 2008c); 2) output for occupational (Arysta’s “worker’s”) exposure HECs (Arysta, 2008d); and 3) output for using higher rabbit QAC reflective of the GD23-26 window of vulnerability (Arysta, 2008e). HECs are modeled for a single day of exposure to the 2 ppm (6 hours/day) NOEL in rabbits based on fetal death endpoint. II.C.1. General Population HEC Although maternal iodide AUC is selected as the dose metric for HEC determination, HECs based on all 8 dose metrics (i.e., permutation of peak concentration or AUC of MeI or iodide in maternal or fetal blood) are presented below for demonstrating their overall impact to the HEC. The HEC is determined by matching the rabbit and human values of a given dose metric. When the dose metric is based on the peak concentrations, it is taken from immediately after the cessation of exposure (i.e., hour 6 for rabbits, hour 24 for humans) and before their decline thereafter (Figure A-7 and A-8). When the dose metric is based on AUCs, the duration coverage is 24 hours for rabbits and 96 hours for humans to account for the elimination time. Thus, the rabbit 24-hour AUC from a 6-hour exposure is matched to the human 96-hour AUC from a 24-hour exposure. The corresponding graphic depictions are presented later, in Figures A-9 in conjunction with presenting the selected HEC. The initial sets of HECs were modeled based on a rabbit QAC of 12 L-hr/kg3/4. Subsequent to DPR’s consideration regarding the biological uncertainties in using model input parameters that are not reflective of the GD23-26 window of vulnerability, Arysta re-submitted a new set of HEC model runs for a single MeI exposure using a QAC of 20 L-hr/kg3/4 and the same maternal body weight of 4.1 kg, and fetal weight of 0.046 kg (Arysta, 2008e). The final sets of HECs are presented in Table A-4. The earlier set of HECs based on the low rabbit QAC are included in strikethrough form to demonstrate the impact of the 1.7-fold increase in QAC. The HECs based
A-25

External Panel Review Draft MeI RCD Appendices to Volume I- August 10, 2009
1 2 3 4 5 6 7 8 9
10 11 12
on iodide profile are proportionally increased while the change is much less based on the MeI profile. The lower sensitivity of MeI output parameters is likely due to the rapid equilibration with tissues (Arysta, 2009). This strengthens the previous conclusion of modeling HEC based on maternal serum iodide instead of the maternal MeI profile. Table A-4. List of 24-hour HECs for rabbit fetal death endpointa Dose metric Maternal MeI Fetal MeI Maternal Iodide Fetal Iodide Peak 2.8 2.9 ppm 3.4 4.1 ppm 0.38 0.58 ppm 1.5 2.4 ppm AUC 0.7 0.73 ppm 0.86 1.0 ppm 0.15 0.24 ppm 0.78 1.3 ppm a/ The HEC is modeled for the NOEL of 2 ppm (6 hr/day) MeI, using the QAC of 20 L-hr/kg3/4
for rabbit late stage pregnancy. The strike-through HECs are modeled for early pregnancy at QAC of 12 L-hr/kg
13 14 15 16 17 18 19 20 21 22 23 24 25 26 27 28 29 30 31 32 33 34 35 36 37 38 39 40 41 42 43
3/4, given only for illustration purposes. Table A-4 shows that within the same output parameters (i.e., serum MeI or iodide), the HECs are generally lower based on maternal than fetal dose metrics. The greatest difference is in modeling for maternal rather than fetal serum iodide. The model input that resulted in a much greater accumulation of iodide from maternal to fetal blood for rabbit than humans contributes significantly to this overall 4- to 5-fold higher HEC. The generally lower HECs based on AUC than peak concentration is reflective of the 6- versus 24-hour exposure between rabbits and humans. The determination of HEC through matching rabbit and human simulation results can be illustrated in Figure A-9 for two maternal serum iodide dose metrics; i.e., AUC and peak concentration. All the 24-hour MeI levels listed in Table A-4 are included in Figure A-9. In Figure A-9a for maternal serum iodide AUC, the 0.24 ppm HEC is based on the equivalent AUC level between the 96-hour human AUC (at 3.66 mg/L*hr) after a 24- hour exposure to 0.24 ppm MeI (the lowest simulation curve) and the 24-hour rabbit AUC (at 3.72 mg/L*hr) after a 6-hour exposure to 2 ppm MeI (thick black curve). Similarly in Figure A-9b for maternal serum iodide peak concentration, the 0.58 ppm HEC is based on the equivalent peak level between human peak at hour 24 (0.31 mg/L) and rabbit peak at hour 6 (0.31 mg/L). An interesting overarching observation regarding the implication of rabbit fetal iodide accumulation on the final HEC for fetal death endpoint is noted here. This apparently unique feature in rabbit fetus versus rats and humans was repeatedly cited by Arysta (Arysta, 2007;
A-26

External Panel Review Draft MeI RCD Appendices to Volume I- August 10, 2009
1
2 3 4
Figure A-9a
Figure A-9b
Figure A-9. The 24-hour HEC based on maternal serum iodide dose metrics. Rabbit NOEL for
late gestation period (thick black line) is compared to the 24-hour HECs at: a) 0.24 ppm HEC based on AUC, b) 0.58 ppm HEC based on peak concentration. Data from Arysta (2008e). Areas of interest are enlarged in the insets.
5 6 7 8 9
A-27

External Panel Review Draft MeI RCD Appendices to Volume I- August 10, 2009
Mileson et al., 2009; Kirman et al., 2009) as support for their fetal thyroid perturbation MOA due to excess iodide from MeI exposure, for presuming greater sensitivity of rabbit than human fetuses to MeI, and consequently for supporting the use of the fetal serum iodide dose metric for establishing HEC. However, these implications bring out many issues for which data are unavailable to resolve. First of all, Mileson et al. (2009) characterized the normal rabbit fetal iodide accumulation as 9- to 11- fold higher than the maternal. This was based on serum iodide data from the control groups in the MeI study by Sloter (2005b) (see also Table 43 of Volume I). With MeI exposure, this F/M ratio is reduced to approximately 2-fold (Sloter, 2005b; Mileson et al., 2009). The physiological significance for this dramatic change to rabbit fetal thyroid at the MeI NOEL is unclear. As to the implication of greater rabbit sensitivity than humans, it is noted that the physiological range of fetal blood iodide is 0.12 - 0.22 mg/L in rabbits (Table 43, Volume I) and 0.014 - 0.017 mg/L in humans (Rayburn et al., 2007). This approximately 8- to 16- fold higher rabbit level would indicate a higher requirement for iodide or greater tolerance for its excess, but in itself offers no support that rabbits are thereby “more sensitive” to excess fetal iodide from MeI. If anything, the higher baseline in rabbits might suggest less sensitivity at a given amount of iodide increase from MeI. In this regard, the modeled peak rabbit fetal iodide is 1.4 mg/L at the end of 6-hour exposure to 2 ppm MeI, a 6- to 12-fold above the baseline for rabbit fetuses, but nearly 100-fold above the baseline human cord blood level. On the other hand, at the HEC of 0.24 ppm (Table A-4; based on DPR’s maternal iodide dose metric) the modeled peak fetal iodide of 0.15 mg/L is 10-fold higher than the human baseline. This is within the same ratio of increase over baseline in rabbit fetuses at the NOEL of 2 ppm. If equal multiplier over baseline is of biological significance, this observation could provide additional support for the 0.24 ppm HEC derived from maternal serum iodide dose metric (see Table A-4).
1 2 3 4 5 6 7 8 9
10 11 12 13 14 15 16 17 18 19 20 21 22 23 24 25 26 27 28 29 30 31 32 33 34 35 36 37 38 39 40 41 42 43 44 45 46
MeI at 0.24 ppm represents the HEC at the most pertinent dose metric and is the final 24-hour HEC for assessing the risk of the general public. An ideal portrayal of the total amount of maternal exposure to MeI would include also the portion of MeI that is not yet converted to iodide. However, the MeI level is relatively insignificant since the rate of conversion to iodide is rapid such that the peak level of MeI is 35-fold below the peak iodide level at the end of the 24 hours of exposure. II.C.2. Occupational HEC As stated under Section II.A.1, a 567 L/hr (or minute volume of 9.45 L/min) sedentary (or resting) breathing rate is used for modeling the HEC for the general public presented in the previous section. For worker’s occupational exposure, a 1.47-fold higher DPR default breathing rate of 833 L/hr is used to model the 8-hour occupational HEC. This is achieved by Arysta through changing the tidal volume (TVol) from 630 to 925 ml/breath while keeping the same 15 breath/minute. Based on the same selected HEC dose metric as for the 0.24 ppm 24-hour HEC, the 8-hour occupational HEC provided by Arysta is 0.22 ppm. The relationships between the 8-hour occupational HECs, the rabbit 2 ppm NOEL, and the 24-hour HECs for the general public are presented in Figure A-10a. An additional day of the 8-hour exposure cycle is included to illustrate the pattern within two 24-hour cycles. The 8-hour occupational HEC curve approximates the curve for the 24-hour HEC shortly beyond hour 24. This indicates that a
A-28

External Panel Review Draft MeI RCD Appendices to Volume I- August 10, 2009
1 2 3 4 5 6 7 8 9
10 11 12 13 14 15 16 17 18 19 20 21 22 23 24
single-day modeling of AUC can be adequate for the 8-hour HEC determination. Alternatively, Rodriguez (2009) noted that without the additional 16 hours exposure for the worker as a member of the general public the 8-hour HEC is 0.5 ppm. Although the peak maternal serum iodide concentration is not a chosen dose metric for the HEC, a question may be raised regarding the sufficiency of a single-day simulation for such a scenario. Simulation over multiple 8-hour exposure days showed that the peak concentration increases only by 2% from the second to the third day of exposure (data not shown). Thus, had the peak concentration been selected as the final HEC dose metric, it would be more appropriate to match the peak rabbit iodide concentration to the peak on the second-day peak human 8-hour exposure. As shown in Figure A-10b, this second-day peak was considered in establishing the HEC of 0.35 ppm based on maternal peak serum iodide concentration. II.C.3. Summary USEPA derived a 24-hour HEC at 7.4 ppm and an 8-hour occupational HEC at 23 ppm. These are based on the NOEL of 10 ppm (6 hr/day) in rabbits, the dose metric of fetal serum iodide AUC, and sedentary breathing rate of 567 L/hr. DPR’s 24-hour HEC is 0.24 ppm and 8-hour occupational HEC is 0.22 ppm. These are based on the NOEL of 2 ppm (6 hr/day) in rabbits, the dose metric of maternal serum iodide AUC, and DPR’s default breathing rate of 833 L/hr (i.e., 83% of USEPA’s recommended “light activity” rate) for occupational exposures. It is noted that for workers, an additional 16 hours of MeI exposure as members of the general public (or “resident”) would increase the maternal serum iodide AUC and exceed the maternal serum iodide benchmark in rabbits at the NOEL of 2 ppm.
A-29

External Panel Review Draft MeI RCD Appendices to Volume I- August 10, 2009
1 Figure A-10a
Materal Serum Iodide AUC - Occupational 8 hr MeI
0.0
1.0
2.0
3.0
4.0
5.0
6.0
0 8 16 24 32 40 48
Time (hr)
Seru
m Io
dide
AUC
(mg/
L*hr
)
Rabbit 2 ppm 6 hrHEC 0.22 ppm 8 hrHEC 0.24 ppm 24 hr
2 3 4
Figure A-10b
Materal Serum Iodide Concentration - Occupational 8 hr MeI
0.00
0.05
0.10
0.15
0.20
0.25
0.30
0.35
0 8 16 24 32 40 48
Time (hr)
Seru
m Io
dide
Con
c (m
g/L)
Rabbit 2 ppm 6 hrHEC 0.35 ppm 8 hrHEC 0.58 ppm 24 hr
5 6 7 8 9
Figure A-10. The 8-hour occupational HEC based on maternal serum iodide dose metrics. Rabbit NOEL for late gestation period (thick black line) is compared to the HECs at: a) 0.22 ppm HEC based on AUC, b) 0.35 ppm HEC based on peak concentration. Data from Arysta (2008e).
A-30
External Panel Review Draft MeI RCD Appendices to Volume I- August 10, 2009
III. NASAL EFFECTS 1 2 3 4 5 6 7 8 9
10 11 12 13 14 15 16 17 18 19 20 21 22 23 24 25 26 27 28 29 30 31 32 33 34 35 36 37 38 39 40 41 42 43
This section presents the HECs for nasal effects observed in rats. The Arysta’s nasal model has been reviewed by USEPA (Barton, 2007; USEPA, 2007) for establishing the HECs based on GSH depletion in the olfactory epithelium. The sources for model information are provided in the introductory section of this review. The basic model diagram is presented in Figure A-1. This section provides only a very brief description of the Arysta mei3 model2 as a backdrop for focusing on some key issues that could significantly impact the modeling outcome. Compared to USEPA, DPR differs on the threshold GSH level for the HEC dose metrics and this difference results in lower HECs. The overall support for GSH depletion as the MOA for the nasal effects was discussed by Kirman et al. (2009). Based on the qualitative and quantitative evaluations, the authors concluded that the confidence for this MOA was only medium. Nevertheless, DPR’s use of GSH depletion as the dose metric is not dependent on this endpoint as a definitive MOA for toxicity but as an early marker for the protection of olfactory epithelial cells and is consistent with the nasal toxicity observations that define a NOEL at 21 ppm. III.A. Model and Parameters Instead of a detailed tissue structure, the nasal olfactory architecture in the MeI model is simplified into a descriptive structure of 4 layers each for the dorsal meatus or ethmoid regions. The model parameter for the width of the olfactory epithelium is designated as WOE. The width of the next layer, the olfactory exchange membrane with lamina propria, is WOX. The values for the WOE and WOX in the HEC model are: 0.008 and 0.005 cm for rats, 0.006 and 0.05 cm for children, and 0.008 and 0.134 cm for adults. The cardiac output in the mei3 model for rat nose and brain HEC simulations (see Section IV) is 2/3 of the minute volume (MINVol, or “breathing rate”). Model validation through comparing simulation output to the measured data in rats by Himmelstein (2004) at 25 and 100 ppm MeI was provided by Arysta (2007). Input parameter adjustments were made to achieve adequate fit to the experimental data, e.g., using lower ventilation rate than measured by DeLorme (2004). Some of these documented adjustments are extensive, e.g., using only 1.5% of the in vitro measured GSH conjugation rate for simulating kidney GSH changes and increasing the nasal GSH turnover rate from 0.016/hr measured by Poet and Wu (2004) to 0.19/hr (Arysta, 2007). The graphic presentations of the final output from the Arysta model documentation are reproduced in Figure A-11a (from Figure 9c of Mileson et al., 2007) for the nasal olfactory region, and in Figure A-11b (from Figure 8 of Mileson et al., 2007) for serum iodide levels. The simulation on nasal GSH depletion tracks the experimental data sufficiently at 25 ppm but not at 100 ppm (Figure A-11a). However, compared to the measured data, the model underestimates the peak serum iodide concentration at 25 ppm (Figure A-11b). This is mainly attributed to the higher model input of rat body weight (0.376 kg) than the lower weight (0.207 kg) of rats used in the Himmelstein study. This issue is pertinent to systemic endpoints and is further discussed in Section IV.A.
2 The basic model “mei3” was provided to DPR in July 26, 2007. It is understood that this model remains the same for the model output subsequently provided by Arysta in 2008.
A-31

External Panel Review Draft MeI RCD Appendices to Volume I- August 10, 2009
1 Figure A-11a
2 3 4 5 6
Figure A-11b
7 8 9
10 11 12
Figure A-11. Modeled versus measured data in rats. a) GSH concentrations at dorsal meatus and ethmoid olfactory regions (from Mileson et al., 2007, Figure 9c); b) Blood iodide concentrations (from Mileson et al., 2007, Figure 8). Lines: simulations; Symbols: experimental data from Himmelstein, 2004 with 6 hr/day exposure at 25 and 100 ppm MeI.
A-32

External Panel Review Draft MeI RCD Appendices to Volume I- August 10, 2009
III.B. Dose Metric 1 2 3 4 5 6 7 8 9
10 11 12 13 14 15 16 17 18 19 20 21 22 23 24 25 26 27 28 29 30 31 32 33 34 35 36 37 38 39 40 41 42 43
Based on the apparent relationship between GSH depletion and cellular degeneration in the olfactory epithelium as presented in Section IV.A.1.b of Volume I, DPR concluded that GSH depletion is a likely early event for the nasal effect and agreed with USEPA that the depletion at the dorsal olfactory epithelium can be the dose metric for modeling the nasal effect HECs. III.B.1. Regional Olfactory GSH Since the experimental measurements in rats did not differentiate the tissue layers, HEC modeling is limited to interspecies comparison based on the average regional GSH concentrations. The averaging should consist of only the 4 layers of each meatus or ethmoid region and not the innermost blood exchange layer because the interspecies WOX (values given in previous section) are quite different between rats and humans and between human age groups (Barton, 2007). Due to the relatively greater thickness of the basement exchange layer in humans, including this layer in the human HEC model would largely reflect the GSH level at this layer and not at the four outer architectural olfactory epithelial layers that are in closer contact with MeI and that have greater GSH depletion. Figure A-12 shows the modeled GSH level for each of the 4 layers in the dorsal meatus (“gsdoe11, gsdoe 21, gsdoe31, gsdoe41), the basement exchange layer (“gsdoex1”), and the regional 4-layer average for both meatus (“ave gsdoe1”) and ethmoid (“ave gsdoe2”) regions for rats at the NOEL of 21 ppm exposure for 6 hours (Kirkpatrick, 2002b). Because of the interspecies anatomical differences (i.e., no rat “ethmoid” equivalence in humans), it is reasonable that the GSH dose metric in humans is matched to the dorsal meatus region in rats (i.e., “ave gsdoe1”) for the HEC simulation (USEPA, 2007). III.B.2. Threshold GSH Depletion The key issue for the HEC dose metric based on nasal effects is the benchmark level of GSH depletion. Without elaboration, USEPA (2007) modeled the HEC based on a 50% depletion benchmark, the same level as proposed by Arysta (Sweeney et al., 2005; Sweeney and Gargas, 2005; Arysta, 2006, 2007). In contrast, this DPR review concludes that a benchmark at 25% depletion can better represent a level of no effects. The issue exists because no available study with MeI exposure includes both the measurement of GSH levels and side-by-side histopathological observations at or near the NOEL. The support provided by Arysta (Sweeney et al., 2005; Arysta, 2006, 2007) for the 50% benchmark as equivalent to “no effect level” is mainly based on data for other chemicals and in other target tissues. These data generally include chemicals that require metabolic activation (e.g., esterase activity for ethyl acrylate by Frederick et al., 1992; cytochrome P450 activity for naphthalene by Plopper et al., 2001 and Phimister et al., 2004; Lin et al., 2006); observations in cells other than the olfactory epithelium (Clara cells by Plopper et al., 2001; Phimister et al., 2004); cellular effects that may not be directly indicated by non-protein sulfhydryl depletion (ethyl acrylate by Frederick et al., 1992), and toxicity endpoints beyond the initial cellular
A-33

External Panel Review Draft MeI RCD Appendices to Volume I- August 10, 2009
Rat Olfactory GSH Concentration - 21 ppm MeI (6 hrs)
0.00
0.50
1.00
1.50
2.00
2.50
3.00
3.50
4.00
0 4 8 12 16 20 24
Time (hr)
GSH
con
cent
ratio
n (m
M)
gsdoe11gsdoe21gsdoe31gsdoe41gsdoex1avg gsdoe2avg gsdoe1
1
Fraction of Initial GSH in Rat Olfactory - 21 ppm MeI (6 hrs)
0.50
0.60
0.70
0.80
0.90
1.00
0 4 8 12 16 20 24
Time (hr)
Frac
tion
of In
itial
GSH
Con
cent
ratio
n
ave gsdoe2ave gsdoe1
2 3 4 5 6 7
Figure A-12. Modeled rat olfactory GSH level from 21 ppm (6 hr) MeI exposure. Top: GSH level. Bottom: Fraction of initial GSH. The “gsdoe11”, “gsdoe21”, “gsdoe31”, and “gsdoe41” were the 4 meatus layers, the “ave gsdoe1” was their average. The “gsdoex1” was the basement exchange layer. The “ave gsdoe2” was the average of the ethmoid layers. Model output from Arysta (2008c).
A-34

External Panel Review Draft MeI RCD Appendices to Volume I- August 10, 2009
degeneration and are associated with tumor formation (cell proliferation by propylene oxide by Rios-Blanco et al., 2003; Lee et al., 2005).
1 2 3 4 5 6 7 8 9
10 11 12 13 14 15 16 17 18 19 20 21 22 23 24 25 26 27 28 29 30 31 32 33 34 35 36 37 38 39 40 41 42 43 44 45
In addition, three studies were specifically cited in Sweeney et al. (2005) as providing the support for the 50% benchmark for MeI. The first citation was a report by Biaglow et al. (1986) that investigated the enhancement of therapeutic response of tumor tissues to nitro radiation or chemotherapeutic drugs, i.e., misomidazole and SR-2508. The report mentioned that only 10-20% GSH depletion can cause liver damage but “spontaneous peroxidative damage… can occur with other3 normal tissue when GSH reaches 50% of control”. The second citation was a report by Frederick et al. (1992) regarding the application of a PBPK/PD model to oral dosing of ethyl acrylate for estimating its delivery dose associated with forestomach tumorigenicity in rats. Nevertheless, the nasal tissue was not among the 14 sites for which measured metabolic binding of ethyl acrylate to thiol was available for the model. In addition, a pattern of GSH circadian rhythm was attributed to this report. However, no data were presented. The third citation was a report by Plopper et al. (2001) which referred to a threshold of 75% depletion of intracellular GSH pool for irreversible organelle changes in mouse Clara cells at the distal conducting airway through conjugation of reactive metabolites of naphthalene after i.v. injection. DPR concluded that none of these 3 reports provided substantive support for the 50% benchmark in nasal olfactory epithelium. At best, the aforementioned statement by Biaglow et al. (1986) would indicate that the 50% depletion is not a clear “no effect” level but a level of “beginning to show effects”, i.e., close to a “low-effect” level. A diurnal variation of GSH as much as 50% in some tissues was mentioned as support for the 50% benchmark. However, if this wide diurnal fluctuation is indeed reflective of the baseline pattern of GSH levels in the olfactory epithelium, it can arguably support a modeling benchmark substantially below 50% to account for the possible heightened vulnerability during the low GSH state within a 24-hour period. More importantly, the evidence for inadequate health protectiveness of 50% GSH depletion as benchmark for establishing the HEC can be found within the MeI database. Three MeI datasets are available to bridge the observation of histopathological tissue damage at 100 ppm to an estimated GSH depletion bordering 50%. The 100 ppm is above the LOEL of 70 ppm from which the 21 ppm NOEL used in nasal HEC modeling was established (Kirkpatrick, 2002b). The first dataset by Himmelstein (2004) provides time-course GSH measurements from 2 days of exposure while the remaining two datasets by Chamberlain et al. (1998a) and Reed et al. (1995) provide the time-to-effects at 100 ppm.
• Data on nasal GSH levels from the Himmelstein study are summarized in Table A-5. Note that the percentage given in this table is relative to the corresponding controls which fluctuate with time. Thus, they may not reflect the level of changes in GSH concentration from one time point to the next. At 100 ppm, olfactory GSH depletion at hour 1 was 48% on day 1 of exposure and merely 8% on day 2 of exposure. Peak depletion at hour 6 was 74% on day 1 and 56% on day 2.
• The Chamberlain et al. (1998a) study showed that slight olfactory epithelium
degeneration was evident within 24 hours of a 2-hour exposure (Table 10 in Volume I).
3 specified as non-liver tissues (Biaglow et al., 1986)
A-35

External Panel Review Draft MeI RCD Appendices to Volume I- August 10, 2009
1 2 3 4 5 6 7 8 9
10 11 12 13 14 15 16 17 18 19 20 21 22 23 24 25 26 27 28 29 30 31 32 33 34 35 36
Marked degeneration with various degrees of exfoliation occurred with a 4-hour exposure. The authors reported that the non-protein sulfhydryls in the olfactory epithelium and the lung were reduced by approximately 60% one hour after the MeI exposure and remained at this level for the 6 hours of exposure. However, graphic interpretation appeared to show a little less reduction at hour 1 than hour 6.
• The Reed et al. (1995) study with Wistar-derived albino rats showed undulated
appearance at as early as hour 0.5, vacuolation and early degenerative changes at hour 1, clear evidence of destruction and exfoliation at hour 2, degenerated cells attached to damaged epithelium at hour 3, and marked degeneration and damage to transitional epithelium at hour 6 (Table 10 in Volume I). The GSH depletion at the earlier time points may be estimated by interpolating the first day data from the Himmelstein study shown in Table A-5; i.e., approximately 24% depletion at hour 0.5 (between 0% and 48% GSH depletion), 48% at hour 1 as reported, and approximately 60% at hour 2 (between 48% and 72%).
Overall, these data show a high degree of consistency. Even excluding the undulated appearance at hour 0.5 with an estimated 22% GSH depletion, and excluding also the generally lower GSH depletion from the second day data from Himmelstein study, data at hour one showing vacuolation and early degenerative cellular changes can be associated with as low as 48% GSH depletion. Considering the variation at the average of 48% depletion (i.e., or 52.4 ± 18.3% of controls), the 50% depletion cannot be taken as representing a “no-effect” benchmark. Thus, a reasonable approach to establish a “no-effect” benchmark for HECs is simply by estimating the GSH depletion at the NOEL of 21 ppm. Two sets of data are available for this approach. One is from the data reported by Himmelstein (2004) as given in Table A-5. The other is from modeling the GSH level at the NOEL. Table A-5 shows that at 25 ppm MeI, a level slightly above the 21 ppm NOEL, the peak olfactory epithelial GSH depletion at hour 6 is 35 - 42% (i.e., or 65.1 ± 14.0% of the controls for day 1, and 57.8 ± 14.3% for day 2 of MeI exposure). Thus, the expected GSH depletion at 21 ppm would be lower than 35% even without considering its variability. The model output at the 21 ppm NOEL as presented in Figure A-12 shows a 34% average GSH depletion at the meatus region and 25% average depletion at the ethmoid region. Given that the model may slightly underestimate the GSH concentration at the dorsal olfactory region (Figure A-11a), 25% GSH depletion is reasonably close to the upper limit of “no-effect” benchmark.
A-36

External Panel Review Draft MeI RCD Appendices to Volume I- August 10, 2009
Table A-5. Average level of GSH in rat nasal epithelium.a 1 Olfactory Epithelium - % of initial Respiratory Epithelium - % of
initial Hour 25 ppm MeI 100 ppm MeI 25 ppm MeI 100 ppm MeI
0(1st dose) 100.0 (0%) 100.0 (0%) 100 (0%) 100.0 (0%) 1 84.8 (15%) 52.4 (48%) 90.6 (9%) 68.6 (31%) 3 63.4 (37%) 27.6 (72%) 48.9 (51%) 17.2 (82%) 6 65.1 (35%) 24.2 (74%) 52.0 (48%) 14.3 (86%) 9 85.6 (14%) 64.1 (36%) 86.8 (13%) 57.0 (43%) 24(2nd dose) 86.9 (13%) 114.3 (-14%) 120.0 (-20%) 157.8 (-58%) 25 102.5 (-3%) 92.3 (8%) 96.6 (3%) 93.1 (7%) 27 63.0 (37%) 55.5 (44%) 51.2 (49%) 54.6 (45%) 30 57.8 (42%) 44.4 (56%) 57.1 (43%) 43.2 (57%) 33 69.2 (31%) 74.6 (25%) 70.8 (29%) 77.4 (23%) 48 125.4 (-25%) 143.6 (-44%) 95.5 (4%) 129.1 (-29%)
2 3 4 5 6 7 8 9
10 11 12 13 14 15 16 17 18 19 20 21 22 23 24 25 26
a/ Data from Himmelstein, 2004. Rats were exposed to MeI for 6 hours per day for two days. Data presented as average % of the controls. Data expressed as % depletion is given in the parenthesis. Note that the percentage given in this table is relative to the corresponding controls which fluctuate with time. Thus, they may not reflect the level of changes in GSH concentration from one time point to the next.
Two additional observations can be made from data in Table A-5 regarding the pattern of GSH recovery after MeI exposure. First, the on-going GSH replenishment appears to play a significant role in the rapid return to its background level after the end of exposure. This process often surpasses the initial GSH level (as indicated by the negative % of depletion) by hour 24 after a 6-hour exposure. This pattern provides further support for the use of a NOEL established from the repeated dosing study by Kirkpatrick (2002b) to address the risk of acute exposure scenarios. Second, as was pointed out in the review by Sweeney and Gargas (2005), cellular damage through GSH depletion tends to be time-dependent. Thus, considering the prolonged GSH depletion in human 24-hour exposure scenario and the lack of time to recover from day to day, repeated days of exposure may result in a greater severity of cellular damage for which an HEC based on a single day exposure at 25% GSH depletion may not be adequate to protect.
A-37

External Panel Review Draft MeI RCD Appendices to Volume I- August 10, 2009
III.C. HECs 1 2 3 4 5 6 7 8 9
10 11 12 13 14 15 16 17 18 19 20 21 22 23 24 25 26 27 28 29 30 31 32 33 34 35 36 37 38 39 40 41 42
The rat model uses mei3.csl and mei3cmd files submitted to DPR by Arysta (2007). Three sets of HEC simulation runs were conducted by Arysta in 2008. These include: 1) output for the general population (Arysta’s “bystanders”) and occupational (Arysta’s “worker’s”) HECs based on both 25% and 50% GSH depletion (Arysta, 2008b) and their subsequent correction (Arysta, 2008c); 2) output for occupational (Arysta’s “worker’s”) exposure HECs that applied the higher DPR default breathing rate of 833 L/hr but assumed a 40% oral breathing (i.e., only 500 L/hr passes through the nose) (Arysta, 2008d); and 3) repeating output #2 but assumed 0% oral breathing (Arysta, 2008f). HECs are modeled for a single 24-hour day of exposure for the general population and at 8 hours for occupational exposure. III.C.1. General Population HEC Based on a 25% olfactory GSH depletion, the HEC is 2.2 ppm for a 24-hour exposure. Using the same model, USEPA (2007) reported that applying input parameters for children at ages of 3 month-old infants, children at 1, 5, 10, and 15 years old did not result in different HECs than for the adults. The simulations for children were reported as using age appropriate body weight and nasal, and ventilation parameters (values not specified in USEPA report). A same WOE thickness of 0.006 cm was used for all ages, but a slightly lower WOX thickness at 0.05 cm was used for infants and young children, while 0.08 cm was used for older children and adults. Arysta came to the same conclusion of no age differences in HEC by assuming a constant TVol/BWt ratio in age-specific model runs (Mileson et al., 2009). The corresponding pattern of GSH depletion is presented in Figure A-13. The highest level of GSH depletion at the outermost olfactory layer gsdoe11 is 32% (or at a fraction of 0.675) of the initial GSH concentration. The level stays below the 35 – 42% GSH depletion reported in rats at 25 ppm, slightly above the NOEL of 21 ppm. The time to a steady state depletion with less than 0.5% change in the GSH level is not reached until beyond hour 14 of exposure. This indicates the importance of the time factor in the overall risk assessment for this endpoint, i.e., increase in exposure duration is expected to result in greater GSH depletion before a steady state depletion is reached. III.C.2. Occupational HEC In the nasal HEC model performed by Arysta, DPR’s default ventilation rate of 833 L/hr (0.833 m3/hr) was entered as 925 ml/breath at the same resting 15 breath/min rate. This yields a minute volume of 13.88 L/min, or the target breathing rate of 833 L/hr (versus the 1.5-fold lower resting rate of 9.45 L/min or 567 L/hr). The initial HEC modeling assumes only 60% nasal contribution to the total ventilation at this light activity level (Arysta, 2008d). The resultant 500 L/hr air intake through the nose is lower than the 567 L/hr used for the general population HEC simulation with a 100% nasal contribution.
A-38

External Panel Review Draft MeI RCD Appendices to Volume I- August 10, 2009
Human Olfactory GSH Concentration - 2.2 ppm MeI (24 hrs)
0
0.1
0.2
0.3
0.4
0.5
0.6
0.7
0.8
0.9
0 4 8 12 16 20 24
Time (hr)
GSH
con
cent
ratio
n (m
M)
gsdoe11gsdoe21gsdoe31gsdoe41gsdoex1avg gsdoe1
1 2
Fraction of Initial GSH in Human Olfactory - 2.2 ppm MeI (24 hrs)
0.5
0.6
0.7
0.8
0.9
1
0 4 8 12 16 20 24
Time (hr)
Frac
tion
of In
itial
GSH
Con
cent
ratio
n
gsdoe11gsdoe21gsdoe31gsdoe41gsdoex1ave gsdoe1
3 4 5 6 7
Figure A-13. The 24-hour HEC of 2.2 ppm based on 25% olfactory GSH depletion. Include 4 meatus layers (gsdoe11, gsdoe21, gsdoe31, gsdoe41; with gsdoe11 as the outmost layer), basement exchange layer (gsdoex1), and the 4-layer average in meatus (ave gsdoe1). Data from Arysta (2008b, c).
A-39

External Panel Review Draft MeI RCD Appendices to Volume I- August 10, 2009
A study by Wheatley et al. (1991) was cited as basis for the 40% oral contribution assumption. However, the associated data for the 5 subjects in this study are not pertinent for the current MeI model because their lowest initial inspiratory flow of 1 L/s (or 60 L/min; 3,600 L/hr) is already substantially higher than the 833 L/hr. Moreover, the authors reported that the interindividual variability was great, showing one of the 5 subjects had 70% nasal contribution at 120 L/min (7,200 L/hr), an inspiratory level more than 8-fold above the DPR rate for the MeI model input. The study concluded that the oronasal partitioning is related to the ventilation rate and the 60% nasal air flow was attributed to a 1940 publication which only designated the condition as “on exercise”.
1 2 3 4 5 6 7 8 9
10 11 12 13 14 15 16 17 18 19 20 21 22 23 24 25 26 27 28 29 30 31 32 33 34 35 36 37 38 39 40 41 42 43 44 45 46
More recently, Bennett et al. (2003) reported the average nasal contribution among 11 males and 11 females as 79% in females at 23.5 L/min (1,400 L/hr). The DPR’s default of 833 L/hr is still lower than the “20% of maximum physical work level” in this study which showed 80-100% nasal contribution in female subjects. DPR default rate is actually much lower than the USEPA EFH’s recommended average light activity rate of 1,300 L/hr for outdoor workers (USEPA, 1997). Thus, a more appropriate adjustment for oral contribution should be closer to 0 - 10%. This issue was not considered in the USEPA’s model review for the HECs (USEPA, 2007). Within the nasal model construct, the breathing rate alone did not significantly impact the simulated olfactory GSH level. However, in general, physiological accuracy remains to be desirable in PBPK modeling, especially since the same model is used for the next set of HEC based on systemic uptake of MeI. Subsequent model simulation using 100% nasal breathing resulted in an 8-hour occupational HEC of 2.8 ppm (Arysta, 2008f). The GSH profile at this HEC is illustrated in Figure A-14. The modeled recovery after the 8-hour exposure is near completion at the end of a 24-hour cycle. However, because the GSH decline has not reached a plateau by the end of 8 hours, greater depletion can be expected from longer exposure at this MeI level. This HEC also does not account for the remaining 16 hours of exposure at the level of the general population. Nevertheless, because of its similarity to the 24-hour HEC of 2.2 ppm, and the ongoing GSH replenishing, the additional 16-hour exposure after work may not significantly impact this occupational HEC. III.C.3. Summary The USEPA-derived 24-hour HEC is 4.5 ppm and 8-hour occupational HEC is 5.8 ppm. These are based on 50% average GSH depletion from the 4 architectural layers of the dorsal meatus in the olfactory region. By using the benchmark GSH depletion at 25% instead of 50%, the DPR 24-hour HEC is 2.2 ppm. DPR’s 8-hour occupational HEC is 2.8 ppm using DPR’s default breathing rate of 833 L/hr (i.e., 83% of USEPA’s recommended “light activity” rate) for occupational activities, and assuming 100% nasal breathing. Several uncertainties are noted. First, the 25% benchmark GSH depletion does not fully account for the data variability in animal studies from which it is established. Furthermore, the HEC is based on the average GSH depletion over 4 olfactory epithelial modeling structures, underestimating the greater depletion at the outermost cell layer that is in immediate contact with MeI. Finally, the GSH depletion has not reached a plateau at the end of an 8-hour occupational
A-40

External Panel Review Draft MeI RCD Appendices to Volume I- August 10, 2009
1 2 3 4 5 6 7 8 9
10 11 12 13
exposure such that further depletion exceeding the 25% no-effect benchmark is expected if the occupational exposure is extended beyond 8 hours at the 2.8 ppm HEC.
Fraction of Initial GSH in Human Olfactory - 2.8 ppm MeI (8 hrs)
0.5
0.6
0.7
0.8
0.9
1
0 6 12 18 24
Time (hr)
Frac
tion
of In
itial
GS
H Co
ncen
tratio
n
gsdoe11gsdoe21gsdoe31gsdoe41gsdoex1ave gsdoe1
14 15 16 17 18 19
Figure A-14. The 8-hour occupational HEC of 2.8 ppm based on 25% olfactory GSH depletion. During working hours, the breathing rate was 833 L/hr with 0% oral breathing. Include 4 meatus layers (gsdoe11, gsdoe21, gsdoe31, gsdoe41; with gsdoe11 as the outmost layer), basement exchange layer (gsdoex1), and the 4-layer average in meatus (ave gsdoe1). Data from Arysta (2008f).
A-41

External Panel Review Draft MeI RCD Appendices to Volume I- August 10, 2009
IV. NEUROTOXICITY 1 2 3 4 5 6 7 8 9
10 11 12 13 14 15 16 17 18 19 20 21 22 23 24 25 26 27 28 29 30 31 32 33 34 35 36 37 38 39 40 41 42 43 44 45 46
This section presents the establishment of HECs for neurotoxicity following the same format as the nasal effect HEC section. However, the coverage is less extensive due to a general agreement between DPR and USEPA on the selection of the critical NOEL of 27 ppm (Schaefer 2002 and 2003), the limited availability of data on the possible MOA, and the use of same aforementioned rat nose model for HEC simulation. The key difference between the HECs established by DPR and USEPA is in the dose metric selection that resulted in lower HECs. The lack of data to support any possible MOA for neurotoxicity was discussed by Kirman et al. (2009). It should be noted that the authors concluded that the confidence is low for supporting the use of peak brain MeI concentration as dose metric for PBPK modeling. IV.A. Model and Parameters The same PBPK model used for the HEC for nasal effects in rats is used for establishing the neurotoxicity HEC. Model behavior pertinent to the HEC determination is discussed in this section. As discussed in Section III. A., within the model construct, simulation for serum iodide level in rats is affected by the input rat body weight. A supplementary model run using a lower rat body weight was provided by Arysta for illustrating its impact on model outcome (Arysta, 2008f). The comparative analysis showed that the MeI profiles in the blood and brain are not significantly different between input body weights of 0.207 kg (closer resembling the “Himmelstein rat”) and 0.376 kg (used in rat model). This is likely due to the rapid metabolism of MeI after uptake. However, the iodide profiles in the serum and brain are inversely proportional to the two input body weights; i.e., the 1.8-fold lower body weight (i.e., 0.376/0.207 = 1.8) resulted in 1.8-fold higher iodide concentrations. On the other hand, the 2.5-fold blood-to-brain iodide ratio remained the same. A more striking difference in the iodide profile is the 5.5-fold increase in the serum and brain iodide peak concentrations when the 6-hour MeI exposure was increased by 1.3-fold, from 21 to 27 ppm. The 0.226 kg for male rat at the 27 ppm dose group from the Schaefer (2002 and 2003) study was used for the HEC simulation. However, this additional 1.66-fold difference in the body weight parameter (i.e., 0.376/0.226 = 1.66) could not proportionally account for the marked increase in the iodide profile. The exact reason for this model behavior cannot be deciphered merely based on the output from these two simulations. This unresolved uncertainty within the model output provided by Arysta further deters the use of iodide profiles for the HEC determination at the NOEL of 27 ppm. IV.B. Dose Metric USEPA agreed with Arysta’s proposal to use the peak concentration of MeI in the brain as dose metric for neurotoxicity HEC. The argument for the relevance of peak concentration was the assumption that MeI neurotoxicity is similar to the sedative effects of many volatile solvents. However, based on the time lapse between MeI exposure and the changes in neurobehavioral measurements in the Schaefer studies, USEPA cautioned that this assumption could not be
A-42

External Panel Review Draft MeI RCD Appendices to Volume I- August 10, 2009
1 2 3 4 5 6 7 8 9
10 11 12 13 14 15 16 17 18 19 20 21 22 23 24 25 26 27 28 29 30 31 32 33 34 35 36 37 38 39 40 41 42 43 44
substantiated (USEPA, 2007). In reviewing the March 2009 draft of this document, USEPA agreed that the AUC is a more appropriate HEC dose metric (Rodriguez, 2009). Several limitations for the choice of dose metric associated with the 27 ppm NOEL are noted. First, there are no data to show that the 3 hour time point for administering the battery of neurobehavioral tests represents the time to peak effects. There is also no assurance that the severity of neurotoxicity would not increase had the exposure in rats been extended past 6 hours in the study. Neither is there assurance that the NOEL would remain the same had the rats been exposed for 24 hours. The model output generally shows that the brain MeI concentration is proportional to the concentration in the blood. By choosing the brain concentration dose metric, USEPA demonstrated that it is also proportional to the exposure between the NOEL (27 ppm) and the LOEL (93 ppm). However, DPR’s concerns remain about their use of brain MeI concentration instead of its AUC for the HEC dose metric. Since the simulated steady state brain MeI concentration is reached within 30 minutes of exposure, substantial uncertainties exist with the use of peak blood MeI concentration, i.e., without accounting for the longer duration of sustained MeI in human brain. Furthermore, the peak concentration dose metric is inconsistent with the suggested MOA regarding similarity to the anesthetic or sedative effects of chemical solvents. For these effects, it is necessary that the time-dose factor should be accounted for, instead of the dose factor alone. Interestingly, while peak MeI concentration in the brain was used by USEPA as basis for modeling the HEC, it was stated in USEPA’s MeI risk assessment that time-dose relationship as in the “Haber’s law” (i.e., Cn x t = K) should be assumed for all systemic effects (USEPA, 2007). The same “Haber’s law” was also mentioned in the published MeI risk assessment by Arysta (Mileson et al., 2009) as applicable to all systemic effects and yet peak MeI concentration instead of AUC was used for their HEC derivation. Given that the MOA is unknown (Section IV.A.1.c. in Volume I), the AUC of MeI in the brain instead of the MeI peak concentration was used by DPR as the dose metric to account for the time-dose consideration. However, the contribution of iodide to neurotoxicity of MeI cannot be ruled out. Nevertheless, given the aforementioned (Section IV.C.1) modeling uncertainties in its disproportionate increase in rats with increased MeI exposure levels around the NOEL, the dose metric of brain iodide AUC simulated by the model is not suitable here for HEC determination. IV.C. HECs Simulation outputs for a single day of exposure at 24 hours for the general population as well as for 8 hours for occupational exposure were provided by Arysta (2008f). However, these modeling data for HECs are generated based on the brain MeI peak concentration dose metric. No simulation of HEC based on the AUC of brain MeI was provided. Thus, the HECs based on the latter dose metric are extrapolated from the existing modeling datasets, including those simulated for establishing nasal HEC, since the same model is used for both endpoints. The rationale for extrapolation is included in the following presentation of HECs.
A-43

External Panel Review Draft MeI RCD Appendices to Volume I- August 10, 2009
1 2 3 4 5 6 7 8 9
10 11 12 13 14 15 16
IV.C.1. General Population HEC A 24-hour HEC simulation was only provided for 10 ppm MeI based on USEPA’s dose metric of peak brain MeI concentration (Arysta, 2008f). Model outputs from rat nasal HEC simulations are additionally used in estimating the HEC based on brain MeI AUC. The 24-hour MeI AUC in the brain at 2.2, 4.5, and 10 ppm are presented in Table A-6. Table A-6. Modeled brain MeI AUC of human exposures at 2.2 to 10 ppm for 24 hours
Simulation Condition Brain MeI AUC (mg/L* hr) Reference Rat; NOEL 27 ppm 6-hour 0.794 Arysta, 2008f Human; 2.2 ppm 24-hour 0.519 Arysta, 2008b, c Human; 4.5 ppm 24-hour 1.062 Arysta, 2008b, c Human; 10 ppm 24-hour 2.370 Arysta, 2008f
17 18 19 20 21 22 23 24 25 26 27 28 29 30 31 32 33 34 35 36 37
These model outputs show a linear relationship between the brain MeI AUC and the MeI air concentration, with the intercept at -0.00167 and the slope at 0.2365. Thus, a 24-hour HEC of 3.4 ppm would yield a brain MeI AUC of 0.794 mg/L*hr, the same AUC determined for the rat in 24 hours from a 6 hour exposure at the NOEL of 27 ppm. Graphic presentations of these simulations are shown in Figure A-15 for both the AUC and peak concentration of brain MeI. It should be noted that the 0.133 mg/L peak MeI concentration in this simulation from Arysta is 30% higher than the 0.1 mg/L presented by USEPA (Barton, 2007; USEPA, 2007). The exact reason for the difference between the two model simulations is unclear. Using the lower peak MeI concentration from USEPA’s rat model, the HEC would be lower. This was confirmed by a model run by Rodriguez (2009) showing the HEC at 2.8 ppm, approximately 20% lower than 3.4 ppm. Nevertheless, since the reasons for the difference between Arysta and USEPA’s model output remain unknown, the 3.4 ppm is used in DPR risk assessment for the acute neurotoxicity endpoint based on Arysta’s data submission accompanied by a set of modeling information.
A-44
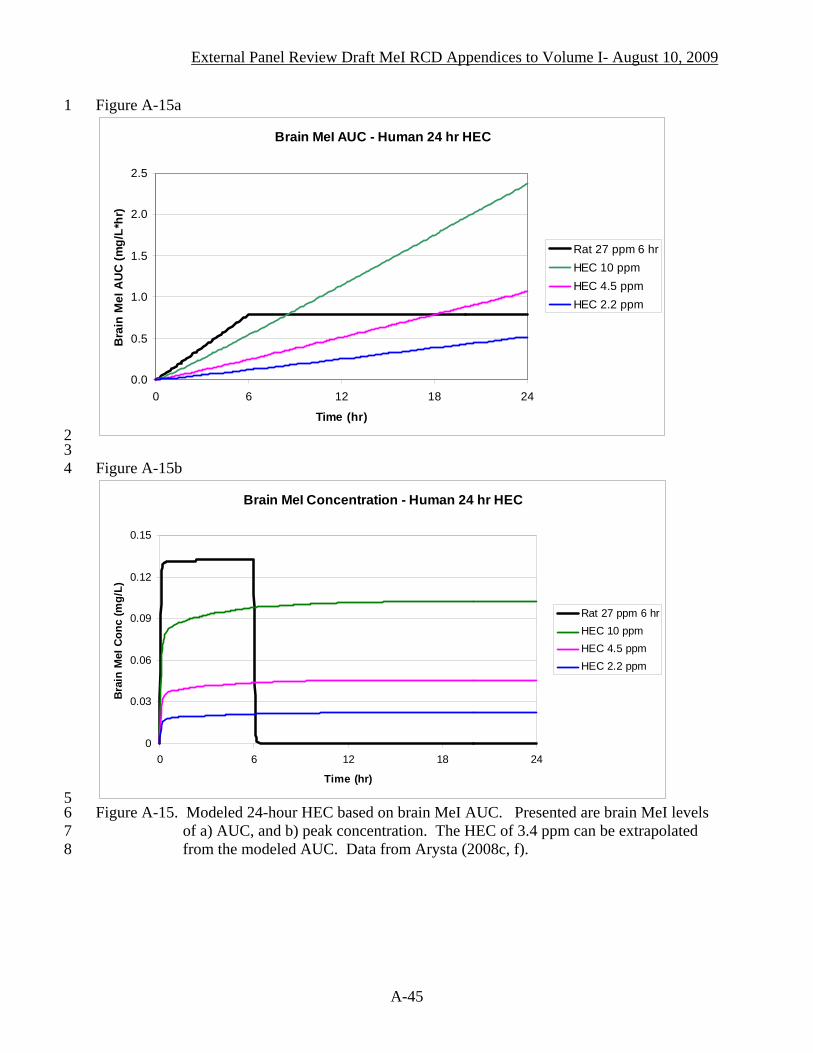
External Panel Review Draft MeI RCD Appendices to Volume I- August 10, 2009
1 Figure A-15a
Brain MeI AUC - Human 24 hr HEC
0.0
0.5
1.0
1.5
2.0
2.5
0 6 12 18 24
Time (hr)
Bra
in M
eI A
UC
(mg/
L*hr
)
Rat 27 ppm 6 hrHEC 10 ppmHEC 4.5 ppmHEC 2.2 ppm
2 3 4
Figure A-15b
Brain MeI Concentration - Human 24 hr HEC
0
0.03
0.06
0.09
0.12
0.15
0 6 12 18 24
Time (hr)
Bra
in M
eI C
onc
(mg/
L)
Rat 27 ppm 6 hrHEC 10 ppmHEC 4.5 ppmHEC 2.2 ppm
5 6 7 8
Figure A-15. Modeled 24-hour HEC based on brain MeI AUC. Presented are brain MeI levels of a) AUC, and b) peak concentration. The HEC of 3.4 ppm can be extrapolated from the modeled AUC. Data from Arysta (2008c, f).
A-45

External Panel Review Draft MeI RCD Appendices to Volume I- August 10, 2009
1 2 3 4 5 6 7 8 9
10 11 12 13 14 15 16 17 18 19 20 21 22 23 24 25 26 27 28 29 30 31 32 33 34 35 36 37
The HEC simulations are based on the parameters for a 70 kg adult with breathing rate of 567 L/hr. It was stated by Sweeney (2008) that based on their sensitivity analysis the HEC for a 6 kg child would be similar to the HEC for a 70 kg adult. According to a later publication by Sweeney et al. (2009), the same ratio of tidal volume (TVol) to body weight was used for adults and children (Sweeney et al., 2009). IV.C.2. Occupational HEC An 8-hour HEC simulation was provided for 9.7 ppm MeI (Arysta, 2008f) based on DPR’s default breathing rate of 833 L/hr, but with no additional 16-hour exposure after work. Similar to the derivation of 24-hour HEC described in the previous section (Section IV.C.1), a comparison can be made to the available modeling results from other Arysta model outputs at different MeI concentrations. Although this HEC was only modeled for an 8-hour period (Figure A-16), a simulation extended over 24 hours also showed that MeI rapidly declined after the cessation of exposure. The HEC based on brain MeI AUC for only 8 hours of exposure is 9.7 ppm. This is approximately 3-fold higher than the 24-hour HEC of 3.4 ppm presented in Section IV.C.1, although the latter was modeled at a lower breathing rate of 567 L/hr. Rodriguez (2009) noted that based on USEPA’s lower simulated brain MeI profile, the 8-hour HEC would be 7.5 ppm. However, the “8-hour only” HEC of 9.7 ppm from Arysta and 7.5 ppm from USEPA do not take into account the additional 16-hour exposure after work. Thus, it is reasonable to set the worker’s 8-hour HEC at 3.4 ppm, the same level for the 24-hour HEC for the general public. This is also approximately one-third of the 9.7 ppm assuming that the 8 hour of exposure is evenly spread out over 24 hours. No other simulations were submitted for further evaluation. IV.C.3. Summary The HEC derived by USEPA is 10 ppm for both 24-hour and 8-hour exposures. This is based on the peak concentration of MeI in the brain. Since the peak is reached within 30 minutes of exposure, the difference in the duration of exposure did not impact the USEPA’s HEC. By using the brain MeI AUC as dose metric, DPR’s HEC for both 24-hour and 8-hour occupational exposure is 3.4 ppm. It is noted that the simulated peak rat brain MeI concentration from Arysta’s simulation is 30% higher than the level reported for the USEPA simulation. Using the lower level from the latter would result in a lower 24-hour HEC of 2.8 ppm.
A-46

External Panel Review Draft MeI RCD Appendices to Volume I- August 10, 2009
1 Figure A-16a
Brain MeI AUC at 8-hr HEC
0
0.1
0.2
0.3
0.4
0.5
0.6
0.7
0.8
0.9
0 4 8 12 16 20 24
Time (hr)
Brai
n M
eI A
UC (m
g/L*
hr)
Rat 27 ppm 6 hrHEC 9.7 ppm 8 hrHEC 2.8 ppm 8 hr
2 3 4
Figure A-16b
Brain MeI Concentration at 8-hr HEC
0
0.02
0.04
0.06
0.08
0.1
0.12
0.14
0.16
0 4 8 12 16 20 24
Time (hr)
Brai
n M
eI C
onc
(mg/
L)
Rat 27 ppm 6 hrHEC 9.7 ppm 8 hrHEC 2.8 ppm 8 hr
5 6 7 8 9
10
Figure A-16. The 8-hour-only HEC of 9.7 ppm based on brain MeI AUC. Presented are brain MeI levels of a) AUC, and b) peak concentration. Data from the 24-hour simulation of 8-hour exposure at 2.8 ppm MeI (nasal HEC simulation) based on the same breathing rate of 833 L/hr are included for comparison. Data from Arysta (2008f).
A-47
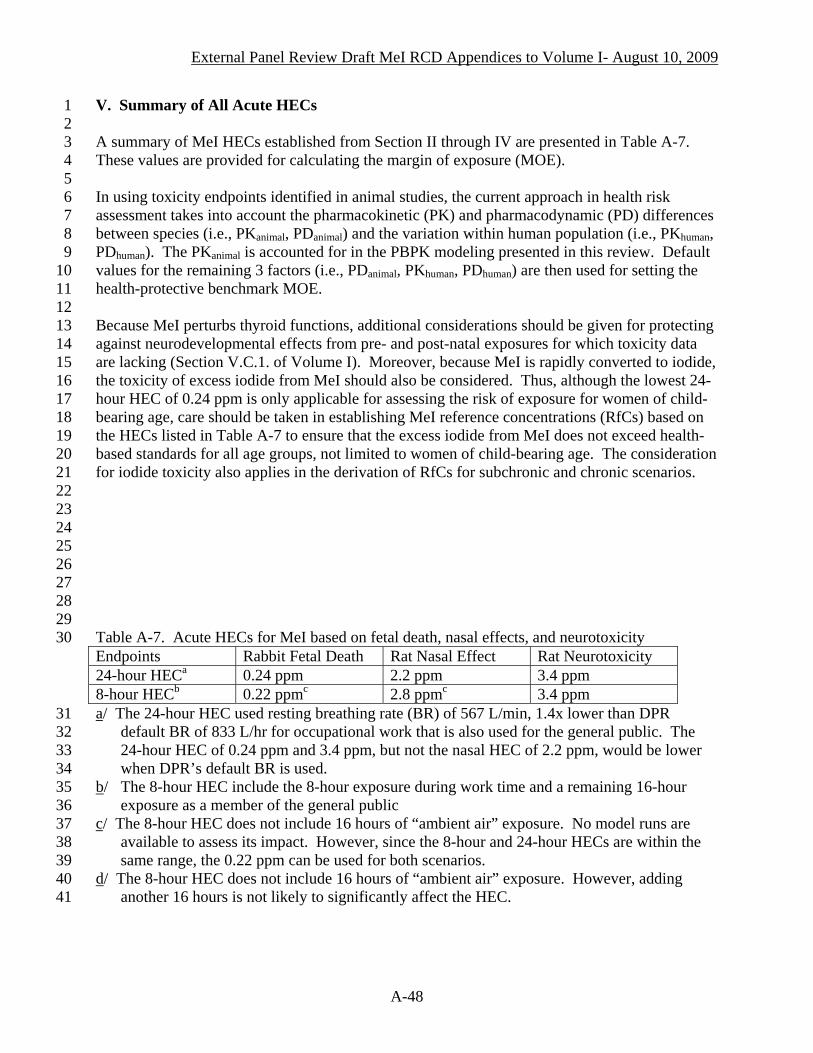
External Panel Review Draft MeI RCD Appendices to Volume I- August 10, 2009
V. Summary of All Acute HECs 1 2 3 4 5 6 7 8 9
10 11 12 13 14 15 16 17 18 19 20 21 22 23 24 25 26 27 28 29 30
A summary of MeI HECs established from Section II through IV are presented in Table A-7. These values are provided for calculating the margin of exposure (MOE). In using toxicity endpoints identified in animal studies, the current approach in health risk assessment takes into account the pharmacokinetic (PK) and pharmacodynamic (PD) differences between species (i.e., PKanimal, PDanimal) and the variation within human population (i.e., PKhuman, PDhuman). The PKanimal is accounted for in the PBPK modeling presented in this review. Default values for the remaining 3 factors (i.e., PDanimal, PKhuman, PDhuman) are then used for setting the health-protective benchmark MOE. Because MeI perturbs thyroid functions, additional considerations should be given for protecting against neurodevelopmental effects from pre- and post-natal exposures for which toxicity data are lacking (Section V.C.1. of Volume I). Moreover, because MeI is rapidly converted to iodide, the toxicity of excess iodide from MeI should also be considered. Thus, although the lowest 24-hour HEC of 0.24 ppm is only applicable for assessing the risk of exposure for women of child-bearing age, care should be taken in establishing MeI reference concentrations (RfCs) based on the HECs listed in Table A-7 to ensure that the excess iodide from MeI does not exceed health-based standards for all age groups, not limited to women of child-bearing age. The consideration for iodide toxicity also applies in the derivation of RfCs for subchronic and chronic scenarios. Table A-7. Acute HECs for MeI based on fetal death, nasal effects, and neurotoxicity Endpoints Rabbit Fetal Death Rat Nasal Effect Rat Neurotoxicity 24-hour HECa 0.24 ppm 2.2 ppm 3.4 ppm 8-hour HECb 0.22 ppmc 2.8 ppmc 3.4 ppm
31 32 33 34
a/ The 24-hour HEC used resting breathing rate (BR) of 567 L/min, 1.4x lower than DPR default BR of 833 L/hr for occupational work that is also used for the general public. The 24-hour HEC of 0.24 ppm and 3.4 ppm, but not the nasal HEC of 2.2 ppm, would be lower when DPR’s default BR is used.
35 36
b/ The 8-hour HEC include the 8-hour exposure during work time and a remaining 16-hour exposure as a member of the general public
37 38 39
c/ The 8-hour HEC does not include 16 hours of “ambient air” exposure. No model runs are available to assess its impact. However, since the 8-hour and 24-hour HECs are within the same range, the 0.22 ppm can be used for both scenarios.
40 41
d/ The 8-hour HEC does not include 16 hours of “ambient air” exposure. However, adding another 16 hours is not likely to significantly affect the HEC.
A-48
External Panel Review Draft MeI RCD Appendices to Volume I- August 10, 2009
VI. REFERENCES 1 2 3 4 5 6 7 8 9
10 11 12 13 14 15 16 17 18 19 20 21 22 23 24 25 26 27 28 29 30 31 32 33 34 35 36 37 38 39 40 41 42 43 44 45
Arysta (Arysta LifeScience North America Corporation). 2006. Iodomethane: Arysta responses
to toxicology issues raised by Department of Pesticide Regulation. April 14, 2006. DPR Vol. 52875-109, #224248.
Arysta (Arysta LifeScience North America Corporation). 2007. Iodomethane: Modes of Action
and Selection of Dose Metrics for Derivation of Human Equivalent Concentrations. July 31, 2007; attached model and output spreadsheets. DPR Vol. 52875-0126, #234436.
Arysta (Arysta LifeScience North America Corporation). 2008a. Iodomethane PBPK model
assessments for DPR. Part 1 of 2; PBPK Output - 2 ppm exposure to rabbits. DPR ID No.: CRR-192894N. Submitted to DPR through Technology Sciences Group Inc., Sacramento. May 12, 2008. DPR Vol. 52875-0132, #239366, #239367.
Arysta (Arysta LifeScience North America Corporation). 2008b. Iodomethane PBPK model
assessments for DPR. Part 1 of 2; PBPK Output - 2 ppm exposure to rabbits. DPR ID No.: CRR-192894N. Submitted to DPR through Technology Sciences Group Inc., Sacramento. May 19, 2008. DPR Vol. 52875-0133, #239567; #239568; #239569.
Arysta (Arysta LifeScience North America Corporation). 2008c. Iodomethane replacement
volumes for previous submissions on PBPK modeling. DPR ID No.: CRR-192894N. Submitted to DPR through Technology Sciences Group Inc., Sacramento. June 23, 2008. With corrected figures, June 23, 2008. DPR Vol. 52875-0133, #239567; #239568; #239569. Same record Vol. and ID as Arysta, 2008b.
Arysta (Arysta LifeScience North America Corporation). 2008d. Iodomethane PBPK modeling
assessment for DPR. PBPK output - Worker HECs Developmental and nasal endpoints. DPR ID No.: CRR-192894N. Submitted to DPR by R. Uhn, Regulatory Consultant for Arysta LifeScience. August 21, 2008. DPR Vol. 52875-0134, #232450.
Arysta (Arysta LifeScience North America Corporation). 2008e. Iodomethane PBPK modeling
assessment for DPR. PBPK output - Updated bystander and worker HECs Developmental endpoint. DPR ID No.: CRR-192894N. Submitted to DPR by R. Uhn, Regulatory Agent for Arysta LifeScience NA. September 15, 2008. DPR Vol. 52875-0135, #242451.
Arysta (Arysta LifeScience North America Corporation). 2008f. Iodomethane PBPK modeling
assessment for DPR. PBPK output - Additional worker HECs for nasal endpoint, additional rat modeling for nasal endpoint, and HECs for neurotoxicity endpoint. DPR ID No.: CRR-192894N. Submitted to DPR by R. Uhn, Regulatory Agent for Arysta LifeScience NA. October 23, 2008. DPR Vol. 52875-0136, #242852.
Arysta (Arysta LifeScience North America Corporation). 2009. Iodomethane: Arysta Life
Science NA Response to the Medical Toxicology Branch’s Methyl Iodide (Iodomethane) Risk Characterization Document for Inhalation Exposure Volume I Health Risk Assessment
A-49

External Panel Review Draft MeI RCD Appendices to Volume I- August 10, 2009
1 2 3 4 5 6 7 8 9
10 11 12 13 14 15 16 17 18 19 20 21 22 23 24 25 26 27 28 29 30 31 32 33 34 35 36 37 38 39 40 41 42 43 44 45
and Volume II Exposure Assessment Issued March 13 2009. Arysta LifeScience North America, LLC, Cary, NC. April 30, 2009.
Barton, H. 2007. Iodomethane: Review of Methyl Iodide PBPK/PD Model. DP Barcode:
D312630; PC Code: 000011. Memorandum to E. Mendez on June 14, 2007. As Appendix A in USEPA, 2007.
Bennett, W. D., K. L. Zeman, and A. M. Jarabek. 2003. Nasal contribution to breathing with
exercise: effect of race and gender. J. Appl. Physiol. 95:497-503. Biaglow, J. E., M. E. Varnes, L. Roizen-Towle, E. P. Clark, E. R. Epp, M. B. Astor, and E. J.
Hall. 1986. Biochemistry of reduction of nitro heterocycles. Biochem. Pharmacol. 35(1):77-90.
Chamberlain, M. P., E. A. Lock, B. A. Gaskell, and C. J. Reed. 1998a. The role of glutathione
S-transferase- and cytochrome P450-dependent metabolism in the olfactory toxicity of methyl iodide in the rat. Arch. Toxicol. 72: 420-428.
Chamberlain, M. P., N. C. Sturgess, E. A. Lock, and C. J. Reed. 1999. Methyl iodide toxicity
in rat cerebellar granule cells in vitro: The role of glutathione. Toxicology 139:27–37. Cottino, F., G. Zoppetti, A. Favero, M. Lombardi, G. Cenderelli, and A. Costa. 1972. Placental
tissue and maternal and cord serum iodine following pharmacological loading. Folia. Endocrinol. 25(4):278-285.
DeLorme, M.P., 2004. Iodomethane: Pulmonary function study in the rabbit. Laboratory Project
ID: DuPont-15453, Exygen Research and E.I. du Pont de Nemours and Company. DPR Vol. 52875-079, #216074.
Fisher, D. A. and A. H. Klein. 1981. Thyroid development and disorders of thyroid function in
the newborn. N. Engl. J. Med. 304(12):702-712. Frederick, C. B., D. W. Potter, M. I. Chang-Mateu, and M. E. Anderson. 1992. A
physiologically based pharmacokinetic and pharmacodynamic model to describe the oral dosing of rats with ethyl acrylate and its implications for risk assessment. Toxicol. Appl. Pharmacol. 114:246-260.
Fuse, Y. 1996. Development of the Hypothalamic-Pituitary-Thyroid Axis in Humans. Reprod.
Fertil. Dev. 8:1-21. Gargas, M. L., L. M. Sweeney, and C. R. Kirman. 2005. Weight of Evidence for Evaluation of
the HEC for Acute Developmental Toxicity of Methyl Iodide. The Sapphire Group, Inc., Dayton, Ohio. Organization Project ID: Project Number 34501. July 8 2005. Submitted by Arysta LifeScience Corporation, San Francisco, CA. DPR Vol. 52875-0101, #219525.
A-50

External Panel Review Draft MeI RCD Appendices to Volume I- August 10, 2009
Himmelstein, M. W. 2004. Iodomethane: In vivo 2-day inhalation mechanistic toxicity study in the rat. Laboratory Project ID: DuPont-14998, E.I. du Pont de Nemours and Company, Exygen Research, and University of Massachusetts Medical School. DPR Vol. 52875-080, #216075.
1 2 3 4 5 6 7 8 9
10 11 12 13 14 15 16 17 18 19 20 21 22 23 24 25 26 27 28 29 30 31 32 33 34 35 36 37 38 39 40 41 42 43 44 45 46
Howdeshell, K. L. 2002. A Model of the Development of the Brain as a Construct of the
Thyroid System. Environ. Health Perspect. 110 (Suppl. 3):337-348. Kirkpatrick, D.T. 2002b. A 13-week inhalation toxicity study (with a four-week interim
necropsy) of iodomethane in albino rats. Study No. WIL-418015, WIL Research Laboratories. DPR Vol. 52875-017, #185692.
Kirman, C.R., L.M. Sweeney, M.L. Gargas, and J.H. Kinzell. 2009. Evaluation of possible
modes of action for acute effects of methyl iodide in laboratory animals. Inhal. Toxicol. 21(6):537-551.
Lee, M. S., T. H. Faller, P. E. Kreuzer, W. Kessler, G. A. Csanady, C. Putz, M. N. Rios-Blanco,
L. H. Pottenger, D. Segerback, S. Osterman-Golkar, J. A. Swenberg, and J. G. Filser. 2005. Propylene oxide in blood and soluble nonprotein thiols in nasal mucosa and other tissues of male Fischer 344/N rats exposed to propylene oxide vapors-relevance of glutathione depletion for propylene oxide-induced rat nasal tumors. Toxicol. Sci. 83(1):177-189.
Lin, C.Y., B. C. Boland1, Y. J. Lee, M. R. Salemi, D. Morin, L. A. Miller, C. G. Plopper, and A.
R. Buckpitt. 2006. Identification of proteins adducted by reactive metabolites of naphthalene and 1-nitronaphthalene in dissected airways of rhesus macaques. Proteomics 2006, 6, 972–982.
Mileson, B. E., L. Sweeney, R. Reiss, M. Gargas, J. Kinzell, and A. Tobia. 2007. Iodomethane
human health risk characterization for California Department of Pesticide Regulation. Arysta Lifescience North America Corporation. Performed by Technology Sciences Group, Inc., Washington D.C. Laboratory Project ID [811-07C]. July 23, 2007 (a revision from June 26, 2007’s document). DPR Vol. 52875-0120, #234202.
Mileson, B. E. 2008. Personal communication. August 1, 2008 email. Mileson, B.E., L.M. Sweeney, M.L. Gargas, and J. Kinzell. 2009. Iodomethane human health
risk characterization. Inhal. Toxicol. 21(6):583-605. Morris, J. E., L. B. Sasser, J. A. Creim, K. D. Thrall, and R. A. Corley. 2004. Studies
supporting the development of a PBPK model for methyl iodide: The pharmacokinetics of sodium iodide (NaI) in pregnant rabbits. Project No. 47542, Battelle, Pacific Northwest Division. DPR Vol. 52875-070, #215234.
Phimister, A. J., M. G. Lee, D. Morin, A. R. Buckpitt, and C. G. Plopper. 2004. Glutathione
depletion is a major determinant of inhaled naphthalene respiratory toxicity and naphthalene metabolism in mice. Toxicol. Sci. 82(1):268-278.
A-51

External Panel Review Draft MeI RCD Appendices to Volume I- August 10, 2009
1 2 3 4 5 6 7 8 9
10 11 12 13 14 15 16 17 18 19 20 21 22 23 24 25 26 27 28 29 30 31 32 33 34 35 36 37 38 39 40 41 42 43 44 45
Plopper, C.G., L. S. Van Winkle, M. V. Fanucchi, S. R. Malburg, S.J. Nishio, A. Chang, and A.
R. Buckpitt. 2001. Early events in naphthalene-induced acute Clara cell toxicity. II. Comparison of glutathione depletion and histopathology by airway location. Am. J. Respir. Cell Mol. Biol. 24(3):272-281.
Poet, T. S. and H. Wu. 2004. Studies supporting the development of a PBPK model for methyl
iodide: In vitro GSH conjugation study in rat, rabbit, and human blood and tissues with methyl iodide. Project No. 47542, Battelle, Pacific Northwest Division. DPR Vol. 52875-070, #215235.
Rayburn, W. F., A. Robinson, L. E. Braverman, X. He, S. Pino, M. L. Gargas, L. M. Sweeney,
and B. E. Mileson. 2007. Iodide concentrations in matched maternal plasma, cord plasma, and amniotic fluid from term and pre-term human pregnancies (Supplemental to MRID No. 46446901).” Department of Obstetrics and Gynecology, Albuquerque, NM; Iodine Research Laboratory, Boston, MA; The Sapphire Group, Dayton, OH; and Technology Sciences Group Inc., Washington, DC. Laboratory Study #: 06-240; Jan. 11, 2007. DPR Vol. 52875-0118, #230153.
Rayburn, W., A. Robinson, L.E. Braverman, X.M. He, S. Pino, M.L. Gargas, and J.H. Kinzell.
2008. Iodide concentrations in matched maternal serum, cord serum and amniotic fluid from preterm and term human pregnancies. Reprod. Toxicol. 25:129–132.
Reed, C. J., B. A. Gaskell, K. K. Banger, and E. A. Lock. 1995. Olfactory toxicity of methyl
iodide in the rat. Arch. Toxicol. 70:51-56. Rios-Blanco, M. N., S. Yamaguchi, M. Dhawan-Robi, W. Kessler, R. Schoonhoven, J. G. Filser,
and J. A. Swenberg. 2003. Effects of propylene oxide exposure on rat nasal respiratory cell proliferation. Toxicol. Sci. 75(2):279-288.
Rodriguez, C. 2009. Memorandum to E. Mendez on “Iodomethane: Review of PBPK modeling
changes made by California Environmental Protection Agency Department of Pesticide Regulation.” United State Environmental Protection Agency, National Center for Computational Toxicology. Research Triangle Park, NC. May 29, 2009.
Schaefer, G. J. 2002. An acute neurotoxicity study of iodomethane in rats. Study No. WIL-418008, WIL Research Laboratories, Inc. DPR Vol. 52875-022, #185700.
Schaefer, G. J. 2003. Amendment to: An acute neurotoxicity study of iodomethane in rats.
Study No. WIL-418008, WIL Research Laboratories, Inc. DPR Vol. 52875-039, #201574. Sloter, E. D. 2005a. A combined baseline/inhalation exposure study of iodomethane-related
fetotoxicity in rabbits. Laboratory Study No. WIL-418031. WIL Research Laboratories, Inc. DPR Vol. 52875-085, #216254.
A-52

External Panel Review Draft MeI RCD Appendices to Volume I- August 10, 2009
1 2 3 4 5 6 7 8 9
10 11 12 13 14 15 16 17 18 19 20 21 22 23 24
Sloter, E. D. 2005b. Mode of action study for iodomethane-related fetotoxicity in rabbits. Laboratory Study No. WIL-418032. WIL Research Laboratories, Inc. DPR Vol. 52875-086, #216255.
Sweeney, L. M., C. R. Kirman, and M. L. Gargas. 2005. Derivation of human toxicity reference
values for methyl iodide using physiologically based pharmacokinetic (PBPK) modeling (Revised report). The Sapphire Group, Inc. Dayton, Ohio. January 13, 2005. Submitted by Arysta LifeScience North America Corporation, San Francisco, California. DPR Vol. 52875-083, #216250.
Sweeney, L. M. and M. L. Gargas. 2005. Reevaluation of the HEC for acute nasal toxicity of
methyl iodide. Supplemental to MRID No. 46446901. The Sapphire Group, Inc. Dayton, Ohio. August 24, 2005. Submitted by Arysta LifeScience North America Corporation, San Francisco, California. DPR Vol. 52875-0104, #219538.
Sweeney, L. 2008. Personal communication via B. Mileson. November, 10, 2008 email. Sweeney, L.M., C.R. Kirman, S.A. Gannon, K.D. Thrall, M.L. Gargas, and J.H. Kinzell. 2009.
Development of a physiologically based pharmacokinetic (PBPK) model for methyl iodide in rats, rabbits, and humans. Inhal. Toxicol. 21(6):552-582.
USEPA (U.S. Environmental Protection Agency). 1991. Guidelines for Developmental Toxicity
Risk Assessment. Federal Register 56(234):63798-63826. EPA/600/FR-91/001, December 1991. Risk Assessment Forum, U.S. Environmental Protection Agency, Washington, DC. http://cfpub.epa.gov/ncea/cfm/nceaguid_human.cfm25
26 27 28 29 30 31 32 33 34 35 36 37 38 39 40 41 42
USEPA (U.S. Environmental Protection Agency). 1997. Exposure Factors Handbook.
EPA/600/P-95/002Fa. US Environmental Protection Agency, Washington DC. August 1997.
USEPA (U.S. Environmental Protection Agency). 2007. Revised HED human health risk
assessment - Iodomethane; DP Barcode: D339055, PC Code: 000011. Memorandum from Elizabeth Mendez to Mary Waller, August 23, 2007. Office of Prevention, Pesticides and Toxic Substances, US Environmental Protection Agency, Washington DC.
USEPA (U.S. Environmental Protection Agency). 2009. U.S. EPA Comments on DPR
iodomethane risk characterization documents. From Debra Edwards, Director of Office of Pesticide Programs USEPA to Marylou N Verder-Carlos, Associate Director of Department of Pesticide Regulation, California Environmental Protection Agency, June 2, 2009.
Wheatley, J. R., T. C. Amis, and L. A. Engel. 1991. Oronasal partitioning of ventilation during
exercise in humans. J. Appl. Physiol. 71:546-551.
A-53
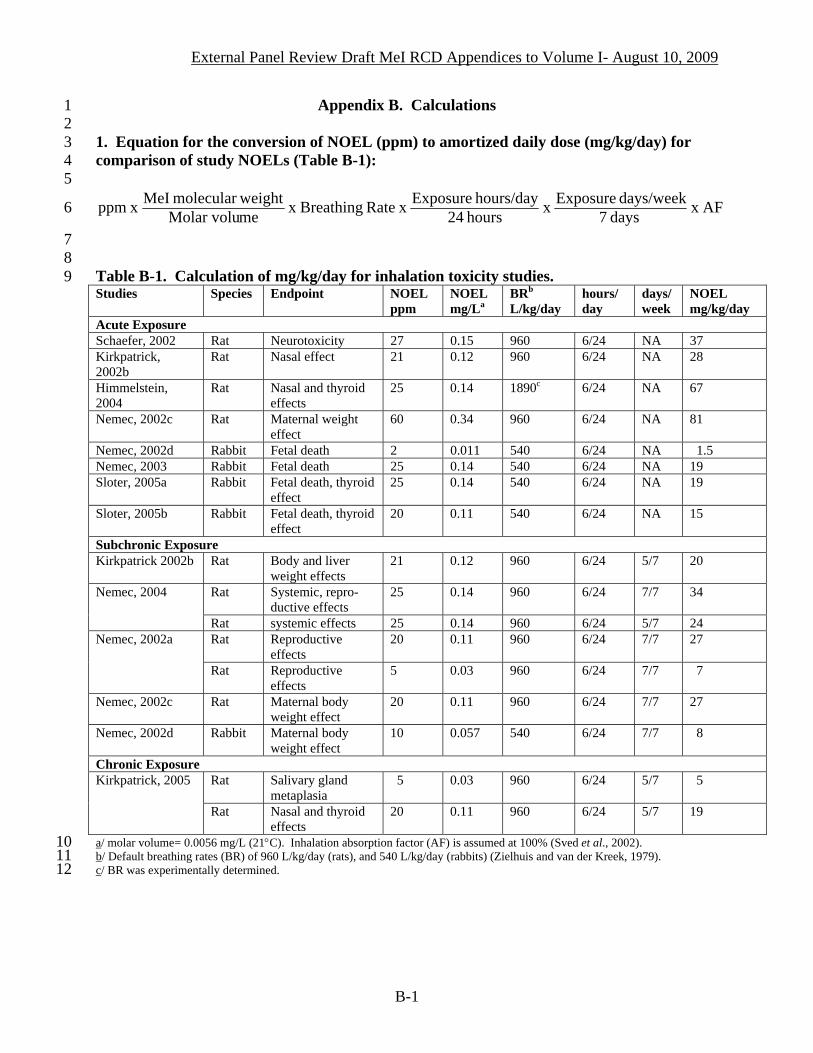
External Panel Review Draft MeI RCD Appendices to Volume I- August 10, 2009
Appendix B. Calculations 1 2 3 4 5
1. Equation for the conversion of NOEL (ppm) to amortized daily dose (mg/kg/day) for comparison of study NOELs (Table B-1):
AF x days 7days/week Exposure x hours 24
hours/day Exposure x Rate Breathing x meMolar voluweightmolecular MeI x ppm6
7 8 9
Table B-1. Calculation of mg/kg/day for inhalation toxicity studies. Studies Species Endpoint NOEL
ppm NOEL mg/La
BRb
L/kg/day hours/ day
days/week
NOEL mg/kg/day
Acute Exposure Schaefer, 2002 Rat Neurotoxicity 27 0.15 960 6/24 NA 37 Kirkpatrick, 2002b
Rat Nasal effect 21 0.12 960 6/24 NA 28
Himmelstein, 2004
Rat Nasal and thyroid effects
25 0.14 1890c 6/24 NA 67
Nemec, 2002c Rat Maternal weight effect
60 0.34 960 6/24 NA 81
Nemec, 2002d Rabbit Fetal death 2 0.011 540 6/24 NA 1.5 Nemec, 2003 Rabbit Fetal death 25 0.14 540 6/24 NA 19 Sloter, 2005a Rabbit Fetal death, thyroid
effect 25 0.14 540 6/24 NA 19
Sloter, 2005b Rabbit Fetal death, thyroid effect
20 0.11 540 6/24 NA 15
Subchronic Exposure Kirkpatrick 2002b Rat Body and liver
weight effects 21 0.12 960 6/24 5/7 20
Rat Systemic, repro-ductive effects
25 0.14 960 6/24 7/7 34 Nemec, 2004
Rat systemic effects 25 0.14 960 6/24 5/7 24 Rat Reproductive
effects 20 0.11 960 6/24 7/7 27 Nemec, 2002a
Rat Reproductive effects
5 0.03 960 6/24 7/7 7
Nemec, 2002c Rat Maternal body weight effect
20 0.11 960 6/24 7/7 27
Nemec, 2002d Rabbit Maternal body weight effect
10 0.057 540 6/24 7/7 8
Chronic Exposure Rat Salivary gland
metaplasia 5 0.03 960 6/24 5/7 5 Kirkpatrick, 2005
Rat Nasal and thyroid effects
20 0.11 960 6/24 5/7 19
10 a/ molar volume= 0.0056 mg/L (21°C). Inhalation absorption factor (AF) is assumed at 100% (Sved et al., 2002). 11 b/ Default breathing rates (BR) of 960 L/kg/day (rats), and 540 L/kg/day (rabbits) (Zielhuis and van der Kreek, 1979). 12 c/ BR was experimentally determined.
B-1
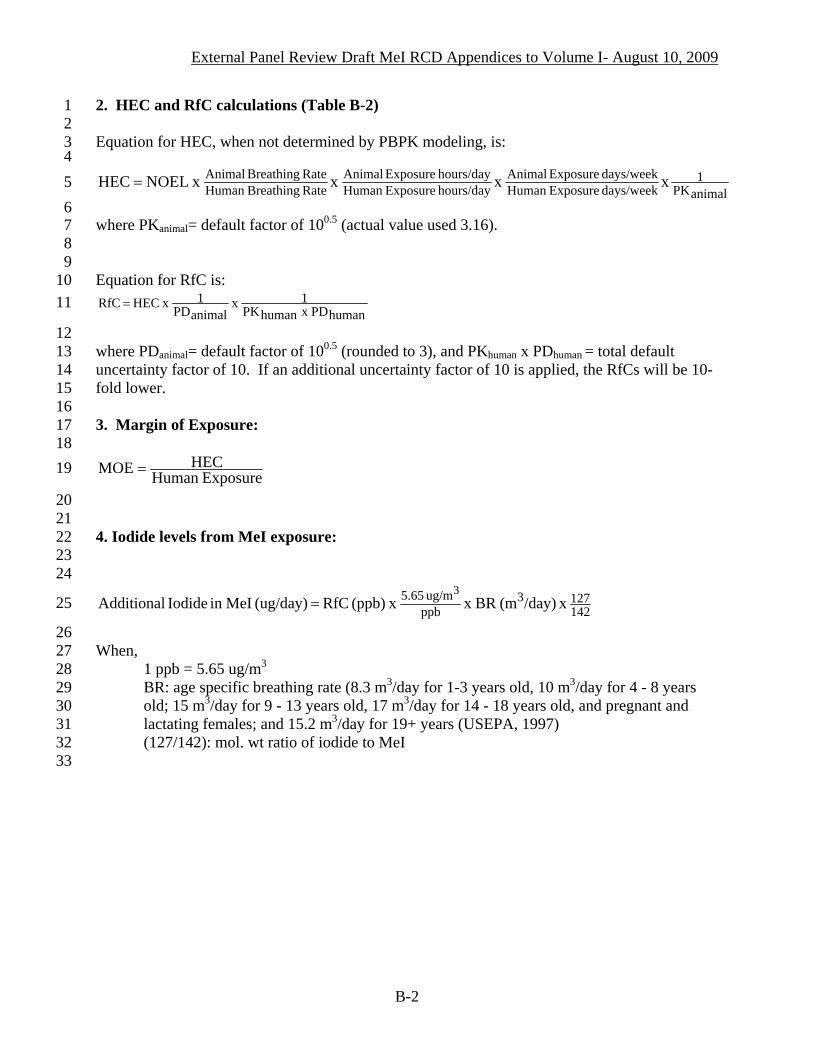
External Panel Review Draft MeI RCD Appendices to Volume I- August 10, 2009
2. HEC and RfC calculations (Table B-2) 1 2 3 4
Equation for HEC, when not determined by PBPK modeling, is:
animalPK1
days/week ExposureHuman days/week Exposure Animal
hours/day ExposureHuman hours/day Exposure Animal
Rate BreathingHuman Rate Breathing Animal xx x x NOEL HEC =5
6 7 8 9
10
where PKanimal= default factor of 100.5 (actual value used 3.16). Equation for RfC is:
humanPD x humanPK1x
animalPD1 x HEC RfC = 11
12 13 14 15 16 17 18
where PDanimal= default factor of 100.5 (rounded to 3), and PKhuman x PDhuman = total default uncertainty factor of 10. If an additional uncertainty factor of 10 is applied, the RfCs will be 10-fold lower. 3. Margin of Exposure:
ExposureHuman HECMOE = 19
20 21 22 23 24
4. Iodide levels from MeI exposure:
1421273
ppbug/m 5.65 x /day)(m BRx x (ppb) RfC (ug/day) MeIin Iodide Additional
3= 25
26 27 28 29 30 31 32 33
When, 1 ppb = 5.65 ug/m3
BR: age specific breathing rate (8.3 m3/day for 1-3 years old, 10 m3/day for 4 - 8 years old; 15 m3/day for 9 - 13 years old, 17 m3/day for 14 - 18 years old, and pregnant and lactating females; and 15.2 m3/day for 19+ years (USEPA, 1997) (127/142): mol. wt ratio of iodide to MeI
B-2

External Panel Review Draft MeI RCD Appendices to Volume I- August 10, 2009
Table B-2. Calculation of HECs and RfCs for MeI. 1 Duration/endpoint NOEL
(ppm) BR ratioa
Hours/ Day ratiob
Days/ week ratioc
PK factord
HEC
(ppm) RfC UF=30e
(ppb) Acute Exposure
0.22 (workers)
7 Development effect (Nemec, 2002d)
2 PBPK modeling (maternal plasma iodide AUC)
0.24 (adults, general) 8 2.8 (workers)
93 Nasal effect in rats (Kirkpatrick, 2002b)
21 PBPK modeling (25% GSH depletion in olfactory
epithelium) 2.2 (general population) 73
Neurotoxicity in rats (Schaefer, 2002)
37 PBPK modeling (brain methyl iodide AUC) 3.4 (all groups) 113
Subchronic Exposure 0.96/0.28 6/8 7/7
100.5 4.1 (workers) 136 Reproductive effects
in rats (Nemec, 2002a)
5
0.96/0.28 6/24 7/7 100.5 1.4 (non-worker adults) 45
0.96/0.28 6/8 7/7 100.5 16.3 (workers) 542
0.96/0.28 6/24 7/7 100.5 5.4 (non-worker adults) 181
0.96/0.45 6/24 7/7 100.5 3.4 (children) 100
Systemic effects in rats (Nemec, 2002a)
20
0.96/0.59 6/24 7/7 100.5 2.6 (infants) 86
0.96/0.28 6/8 5/5 100.5 17.1 (workers) 569
0.96/0.28 6/24 5/7 100.5 4.1 (non-worker adults) 136
0.96/0.45 6/24 5/7 100.5 2.4 (children) 81
Systemic effects in rats (Kirkpatrick, 2002b)
21
0.96/0.59 6/24 5/7 100.5 1.9 (infants) 64
Chronic Exposure 0.96/0.28 6/8 5/5 100.5 4.1 (workers) 136
0.96/0.28 6/24 5/7 100.5 1.0 (non-worker adults) 32
0.96/0.45 6/24 5/7 100.5 0.6 (children) 19
Salivary gland metaplasia in rats (Kirkpatrick, 2005)
5
0.96/0.59 6/24 5/7 100.5 0.5 (infants) 15
Lifetime Exposure 0.96/0.28 6/8 5/5 100.5 16.3 (workers) 542 Thyroid tumors
(Kirkpatrick, 2005) 20
0.96/0.28 6/24 5/7 100.5 3.9 (non-worker adults)
129
a/ For DPR methodology, default breathing rates are: 0.96 m3/kg/day for rats and 0.54 m3/kg/day for rabbits (Zielhuis and van der Kreek, 1979); 0.28 m
2 3 4
3/kg/day for adult, 0.45 m3/kg/day for children 3-5 years old, and 0.59 m3/kg/day for infants (Andrews and Patterson, 2000).
5 b/ Workers and non-workers are assumed to be exposed for 8 hours/day and 24 hours/day, respectively. 6 7
c/ Workers and non-workers are assumed to be exposed daily. For experiments conducted with exposures for 5 days/week, the HECs are reduced (i.e., by a 5/7 factor) because it is reasonable to assume a lower HEC for daily repeated exposure.
8 d/ PKanimal factor=3.16 e/ UF of 30 =3 (pharmacodynamic factor PDanimal) x 10 (intraspecies factor PDhuman x PKhuman). Note that the total UF for acute
RfC is 30 because the interspecies PK difference is accounted for by PBPK modeling. The factor of 3 for PD9
10 11 12
animal is an approximation of 100.5, or 3.16. Thus, the total UF for subchronic, chronic, and lifetime RfCs is 100 if calculated from the NOEL because it includes the default interspecies PK difference (PKanimal) of 100.5, or 3.16-fold.
B-3
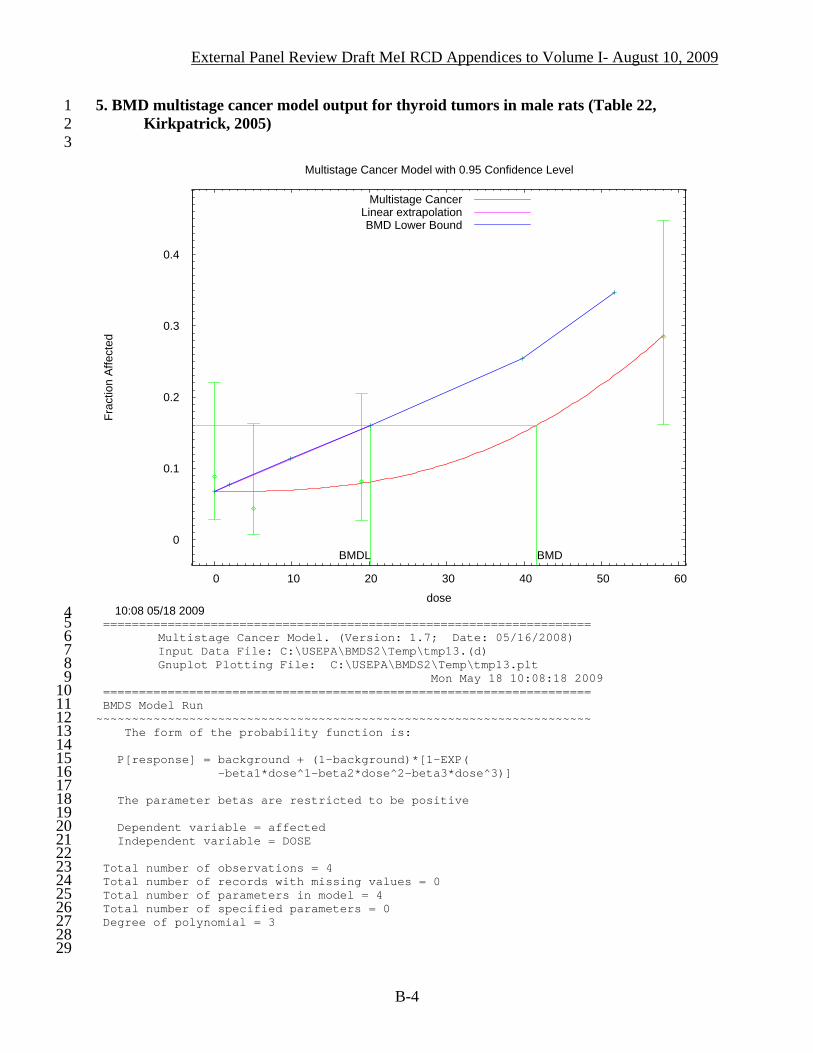
External Panel Review Draft MeI RCD Appendices to Volume I- August 10, 2009
5. BMD multistage cancer model output for thyroid tumors in male rats (Table 22, Kirkpatrick, 2005)
1 2 3
0
0.1
0.2
0.3
0.4
0 10 20 30 40 50 60
Frac
tion
Affe
cted
dose
Multistage Cancer Model with 0.95 Confidence Level
10:08 05/18 2009
BMDBMDL
Multistage CancerLinear extrapolationBMD Lower Bound
4 5 6 7 8 9
10 11 12 13 14 15 16 17 18 19 20 21 22 23 24 25 26 27 28 29
==================================================================== Multistage Cancer Model. (Version: 1.7; Date: 05/16/2008) Input Data File: C:\USEPA\BMDS2\Temp\tmp13.(d) Gnuplot Plotting File: C:\USEPA\BMDS2\Temp\tmp13.plt Mon May 18 10:08:18 2009 ==================================================================== BMDS Model Run ~~~~~~~~~~~~~~~~~~~~~~~~~~~~~~~~~~~~~~~~~~~~~~~~~~~~~~~~~~~~~~~~~~~~~ The form of the probability function is: P[response] = background + (1-background)*[1-EXP( -beta1*dose^1-beta2*dose^2-beta3*dose^3)] The parameter betas are restricted to be positive Dependent variable = affected Independent variable = DOSE Total number of observations = 4 Total number of records with missing values = 0 Total number of parameters in model = 4 Total number of specified parameters = 0 Degree of polynomial = 3
B-4

External Panel Review Draft MeI RCD Appendices to Volume I- August 10, 2009
1 2 3 4 5 6 7 8 9
10 11 12 13 14 15 16 17 18 19 20 21 22 23 24 25 26 27 28 29 30 31 32 33 34 35 36 37 38 39 40 41 42 43 44 45 46 47 48 49 50 51 52 53 54 55 56 57 58 59 60 61 62 63
Maximum number of iterations = 250 Relative Function Convergence has been set to: 2.22045e-016 Parameter Convergence has been set to: 1.49012e-008 **** We are sorry but Relative Function and Parameter Convergence are currently unavailable in this model. Please keep checking the web sight for model updates which will eventually incorporate these convergence criterion. Default values used. **** Default Initial Parameter Values Background = 0.0625262 Beta(1) = 0 Beta(2) = 8.05112e-005 Beta(3) = 0 Asymptotic Correlation Matrix of Parameter Estimates ( *** The model parameter(s) -Beta(1) have been estimated at a boundary point, or have been specified by the user, and do not appear in the correlation matrix ) Background Beta(2) Beta(3) Background 1 -0.62 0.59 Beta(2) -0.62 1 -1 Beta(3) 0.59 -1 1 Parameter Estimates 95.0% Wald Confidence Interval Variable Estimate Std. Err. Lower Conf. Limit Upper Conf. Limit Background 0.0675944 * * * Beta(1) 0 * * * Beta(2) 1.32052e-005 * * * Beta(3) 1.14016e-006 * * * * - Indicates that this value is not calculated. Analysis of Deviance Table Model Log(likelihood) # Param's Deviance Test d.f. P-value Full model -60.6616 4 Fitted model -61.0351 3 0.746884 1 0.3875 Reduced model -66.9693 1 12.6153 3 0.005547 AIC: 128.07 Goodness of Fit Scaled Dose Est._Prob. Expected Observed Size Residual ------------------------------------------------------------------------ 0.0000 0.0676 3.042 4.000 45 0.569 5.0000 0.0680 3.062 2.000 45 -0.628 19.0000 0.0793 3.884 4.000 49 0.062 58.0000 0.2860 12.012 12.000 42 -0.004 Chi^2 = 0.72 d.f. = 1 P-value = 0.3953 Benchmark Dose Computation Specified effect = 0.1 Risk Type = Extra risk Confidence level = 0.95 BMD = 41.6607 BMDL = 20.1955 BMDU = 55.3514 Taken together, (20.1955, 55.3514) is a 90% two-sided confidence interval for the BMD Multistage Cancer Slope Factor = 0.00495161
B-5
External Panel Review Draft MeI RCD Appendices to Volume I- August 10, 2009
Appendix C. U.S. Environmental Protection Agency Risk Assessment 1 2 3 4 5
This section is a brief comparison between this RCD and the USEPA risk assessment
(USEPA, 2007). 1. Human Equivalent Concentration 6
7 8 9
10 11 12 13 14 15 16 17 18 19 20 21 22 23 24 25 26 27 28 29 30 31 32 33 34 35 36 37 38 39 40 41 42 43 44 45 46
For acute exposure, DPR and USEPA both use PBPK modeling to derive the HECs.
However there are differences in the selection of the acute fetal death NOEL, MOA, and the dose metrics for PBPK modeling. These differences have been discussed under IV.A.1. Acute Inhalation Toxicity and Appendix A. As a result, DPR determined HECs are lower than those of the USEPA. A comparison of the HECs is presented in Table C-1.
For fetal death, the USEPA HECs are 23 ppm (worker 8 hours) and 7.4 ppm (bystander
24 hours) based on a NOEL of 10 ppm (Nemec, 2002d) and fetal serum iodide AUC after a single day of exposure from PBPK modeling. In comparison, DPR establishes a lower of NOEL at 2 ppm and uses the dose metric of maternal serum iodide AUC after a single day of exposure to derive much lower HECs of 0.22 ppm, and 0.24 ppm, for 8 hours and 24 hours respectively, of adult exposures.
For rat olfactory epithelium degeneration (Kirkpatrick, 2002b), both DPR and USEPA
establish the same NOEL for the study, but the difference lies in the selection of dose metric. USEPA considers a regional average of 50% GSH depletion as the dose metric, and the HECs were 5.8 ppm (workers) and 4.5 ppm (bystander all ages). In comparison, DPR sets the regional average of 25% GSH depletion, resulting in HECs of 2.8 ppm (workers) and 2.2 ppm (bystander and residents).
For both DPR and USEPA, the NOEL and the dose metric for acute neurotoxicity in rats
(Schaefer, 2002) are the same at 27 ppm. The difference is the dose metric with peak brain MeI concentration by USEPA and the AUC of brain MeI by DPR, to establish the HECs. The USEPA HEC is 10 ppm (workers and bystanders), while the DPR HEC is 3.4 ppm (all groups). For the calculation of HECs of systemic effects after repeated MeI exposure, USEPA uses a default RGDR of 1, the ratio of the blood:gas partition coefficient of the chemical for the test species to humans (Hb/g animal/ Hb/g human), to account for the pharmacokinetic differences between species (USEPA, 2007 and 1994). An UF of 3 is then applied to account for the PD differences since the interspecies PK differences have presumably been included in the RGDR, as it is an approximation of the PBPK model. DPR has not adopted the use of the USEPA methodology because of the uncertainty involved. In the case of a default RGDR of 1, no quantitative adjustment for interspecies PK from animals to humans has been made. Alternatively, DPR's methodology seeks to make interspecies exposure adjustment only for the "intake" portion of the exposure scheme, and not the "uptake and tissue distribution" to the target site. For this approach, the “intake” is calculated based on the breathing rate (air "intake") on a per body weight basis (as is the common expression for exposure or dose). This calculation is similar to the estimation of exposure through the diet while the "intake" is the amount of food consumed instead of the air breathed in. DPR recognizes that sufficient data and experience are
C-1

External Panel Review Draft MeI RCD Appendices to Volume I- August 10, 2009
not yet available for a subsequent adjustment down to the "uptake and tissue distribution" portion of the dose estimation that enables an adequate account for all PK aspects of the interspecies difference in a simple dosimetric equation. Thus, DPR maintains the PK factor of 10
1 2 3 4 5 6 7 8 9
10 11 12 13 14
0.5 (Table B-2). Both USEPA and DPR apply a factor of 100.5 for interspecies PD differences and a total 10-fold factor for interindividual PK and PD differences in the human population. As shown in Table C-1 for subchronic and chronic exposures, when the test species is the rat, there are only slight differences between these two approaches in the HECs for adults. It is because mathematically, the total PK correction as the product of breathing rate ratio (0.96 m3/kg/dayrat/0.28 m3/kg/dayhuman) and PK uncertainty factor of 3 equals to 1, the same as the USEPA RGDR default ratio of 1. However, this is not the case for the children and infant HECs. The DPR calculations show much lower values for these groups than for adults. USEPA did not calculate HECs for exposure of young children to MeI. Table C-1. Comparison of HECs between USEPA and DPR.a
USEPA HEC (ppm)
DPR HEC (ppm)
Bystander
Study
Worker By-stander
Worker Adult Child Infant
NOEL and Dose metric comparisons between USEPA and DPR
Acute Toxicity Fetal death in rabbits (Nemec, 2002d)
23 7.4 0.22 0.24 NA NA NOEL: USEPA-10 ppm DPR-2 ppm Dose metric: USEPA-fetal iodide, single day DPR-maternal iodide, single day
Acute nasal effect in rats (Kirkpatrick, 2002b)
5.8 4.5 2.8 2.2 2.2 2.2 NOEL: 21 ppm (same) Dose metric: GSH depletion USEPA-50% DPR- 25%
Neurotoxicity in rats (Schaefer, 2002)
10 10 3.4 3.4 3.4 3.4 NOEL: 27 ppm (same) Dose metric: brain MeI USEPA-peak concentration DPR- AUC
Subchronic Toxicity Reproductive and developmental effect (Nemec, 2002a)
3.75 1.25 4.1 1.4 NA NA NOEL: 5 ppm (same)
Systemic effects (Kirkpatrick, 2002b)
15.75 3.75 17.1 4.1 2.4 1.9 NOEL: 21 ppm (same)
Chronic Toxicity Salivary gland effect (Kirkpatrick, 2005)
3.75 0.89 4.1 1.0 0.6 0.5 NOEL: 5 ppm (same)
15 16
a/ Bolded values are used in the calculation of margins of exposure by DPR. USEPA did not calculate MOEs for repeated exposures; the HECs are included only as a comparison of the RfC methodology.
C-2

External Panel Review Draft MeI RCD Appendices to Volume I- August 10, 2009
1 2 3 4 5 6
For MeI oncogenicity, DPR determines that both a genotoxic and a non-genotoxic mode of action may be involved in the formation of thyroid tumors in rats. Thus, both a threshold (using MOE) and a nonthreshold (using potency factor) are used to assess human exposure. While USEPA concludes that a genotoxic mechanism can not be excluded, the USEPA considers the formation of this tumor type as a threshold effect with the rat as the most sensitive species. 2. Exposure Assessment 7
8 9
10 11 12 13 14 15 16 17 18 19 20
A comparison of DPR’s MeI exposure estimates for workers, bystanders, and residents with those in the USEPA risk assessment is provided in Volume II. Both DPR and USEPA estimate acute exposures, but only DPR provides repeated exposure values in the risk assessment. For occupational acute exposures, among the differences are: replicate samplers were considered as a single replicate (DPR) or as two values (USEPA), measured air concentrations were adjusted (DPR) or not (USEPA) for maximum application rate, and exposure was based on upper-bound value (DPR) versus maximum measured value (USEPA). The end result is that DPR estimates are similar to USEPA for applicators and hole punchers for drip irrigation, but higher values, as much as 3.4-fold, for other workers as shown for tarp monitor for shank injection (Table C-2). Table C-2. Comparison of acute exposures between USEPA and DPR.a
Scenarios DPR ppm
USEPA ppm
Workers (No PPE) Shallow shank-tarped soil fumigation (broadcast and bedded) Applicators (using shanks, 10-12")
1.51 1.03
Shovelmen and Shovelers 1.09 0.76 Tarp Monitors 3.75 1.11 Tarp Hole punchers, cutters, and removers
0.16 0.07
Planters 0.01 0.007 Drip irrigation fumigation (tarped-bed) Applicator 0.25 0.24 Hole Puncher 0.02 0.02 Planter 0.01 0.007 Bystandersb ppm at 30 meters from field ppm at 25 meters from field Drip irrigation 0.6 0.24 Shank injection, raised bed 0.3 0.32 Shank injection, flat fume 0.4 0.23
21 a/ Values from Volume II. 22 23 24 25
b/ 24-hour TWA air concentration.
C-3

External Panel Review Draft MeI RCD Appendices to Volume I- August 10, 2009
1 2 3 4 5 6 7 8 9
10 11 12 13 14 15 16 17 18 19 20 21
For bystander exposures, the difference in MeI air concentrations arises from the use of different models and modeling assumptions, and selection of field studies. USEPA uses both the ISCST3 model and the Probabilistic Exposure and Risk model for Fumigants (PERFUM) to evaluate distributional bystander exposure from data derived from fumigation studies conducted in California, Florida, and Michigan, and to estimate the buffer zone distances (USEPA, 2007). DPR estimates the air concentrations using the ISCST3 model using only California data. In modeling, USEPA adopts the whole field, probabilistic approach, while DPR applied the maximum direction approach. A comparison of 24-hour time-weighted average air concentrations (at 30 meters for DPR and 25 meters for USEPA values) for a 40 acre field, shows similar values for raised bed shank injection, but 2 to 3 fold higher for flat fume shank injection and drip irrigation, respectively (Table C-2). Both USEPA and DPR conclude that MeI would not be expected to contaminate the ground or surface water. USEPA conducts a qualitative drinking water assessment because MeI is water soluble, and may be found in ground water and surface water if the treated soil is exposed when there is rain (USEPA, 2007). Tier II PRZM/EXAMS for surface water and Tier I SCIGROW for ground water are used to estimate MeI concentration in the drinking water. While no residue levels were provided, USEPA concludes that MeI would not be expected to “adversely impact ground water or surface water.” The DPR evaluation is presented in Volume III. An additional concern for iodide in drinking water is included in the assessment. 3. Risk Characterization 22
23 24 25 26 27 28 29 30 31 32 33 34 35 36 37 38 39 40 41 42 43 44 45 46
The differences in HECs and exposure estimates result in DPR and USEPA reaching
different conclusions regarding the potential risk with MeI acute exposure to workers and bystanders. Using a benchmark of 30 for acceptable risk, the USEPA concludes that MeI registration can be approved with some restrictions on the application rate and field size, and requirements (USEPA, 2007 and 2008). DPR reaches the opposite conclusion with a benchmark of 300 for acute exposure and fetal death endpoint, and a benchmark of 30 for other endpoints and durations.
A more important difference is that DPR recommends a more thorough investigation of
the potential pre- and post-natal developmental neurotoxicity. In the absence of sufficient information, the application of an additional uncertainty factor of 10-fold is necessary because of concerns about inadequacy of toxicity testing on young animals and the potential toxicity from additional iodide from MeI exposure. This factor should be applied toward the MOE benchmark, resulting in a higher benchmark of 300 as well as proportionally lower calculated reference concentrations. Under the section for uncertainty factors, USEPA states that MeI is a non-food use pesticide and consequently, it was not subjected to the Food Quality Protection Act (1996) and the 10x FQPA factor did not apply (USEPA, 2007).
With iodide, DPR is concerned with increased body burden from iodide in the drinking water and after MeI inhalation exposure. While iodide contamination of surface water is unlikely, a screening evaluation estimates an upper-bound level of 18 ppm iodide in the ground water. Iodide levels from MeI inhalation exposure are calculated from the RfCs of the acute toxicity endpoints. From both water and air, the calculated iodide intakes under most cases are
C-4

External Panel Review Draft MeI RCD Appendices to Volume I- August 10, 2009
higher than established health standards for iodide. Thus, the recommended MeI RfCs for any duration should be much lower, at levels not to exceed 1 ppb, for the protection of young children. On the other hand, the USEPA is apparently only concerned with iodide in the air, as a result of MeI degradation after application. This level was considered to be “lower than those expected to cause toxic effects,” but the data to support this statement were not provided in their risk assessment (USEPA, 2007). If an UF of 30 is applied to the USEPA HEC, the RfCs will result in excess iodide exposure much higher than any established health standards (as discussed in Section V.C. of Volume I). For example for the USEPA 24-hr HEC of 7.4 ppm for fetal death endpoint, the RfC is 247 ppb with a corresponding excess iodide body burden of 10,400 µg/day for young children
1 2 3 4 5 6 7 8 9
10 11 12 13
4. For the 4.5 ppm 24-hr HEC for nasal effects, the hypothetical RfC is 150 ppb with the corresponding excess iodide for young children at 6,300 µg/day. The NAS tolerable upper limit (2000) and the ATSDR MRL (2004) are 200-300 µg/day, and 113-153 µg/day, respectively, for 1-3 year old.
4 Total iodide exposure=RfC (ppb) x 5.65 (µg/m3)/ppb x BR (8.3 m3/day for 1-3 year old) x 127/142. The ratio of molecular weight of iodide (127) to MeI (142) is used to account for the weight of iodide in MeI, assuming 100% absorption of MeI and conversion to iodide. BR=breathing rate from USEPA (1997).
C-5