Embed Size (px)
Citation preview
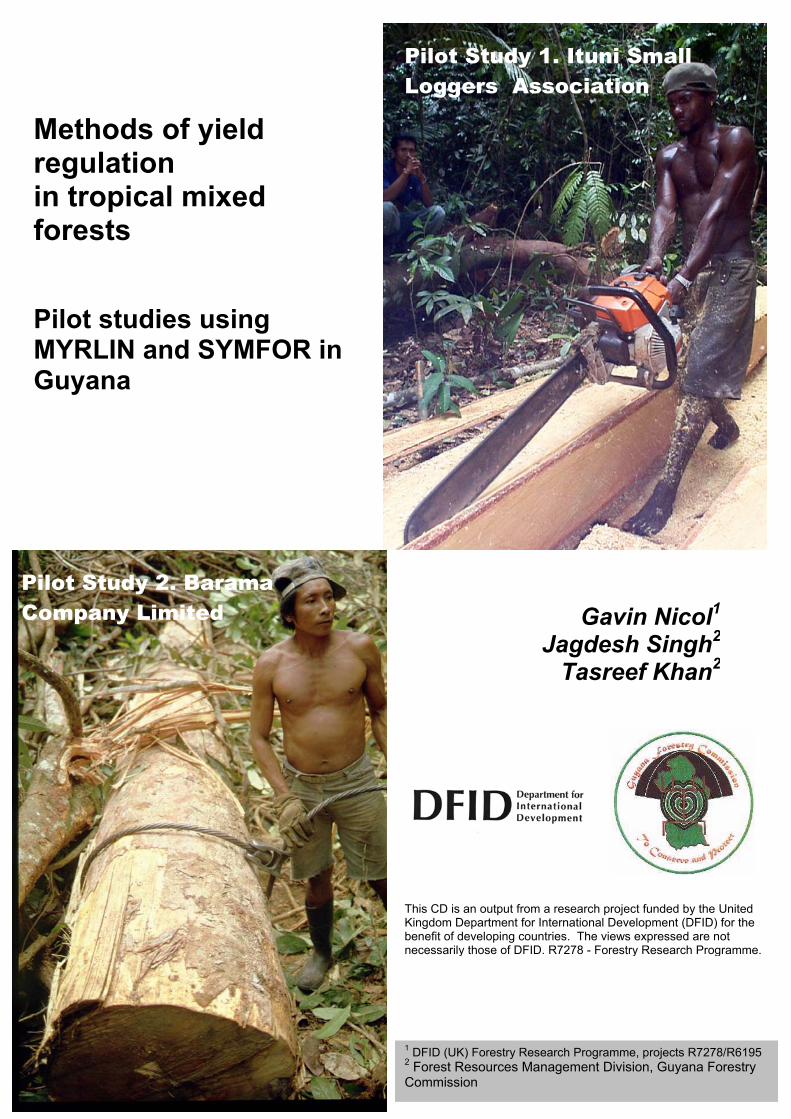
Pilot Study 1. Ituni Small Loggers Association
Methods of yield regulation in tropical mixed forests
Pilot studies using MYRLIN and SYMFOR in Guyana
Pilot Study 2. Barama Company Limited Gavin Nicol1
Jagdesh Singh2
Tasreef Khan2
This CD is an output from a research project funded by the United Kingdom Department for International Development (DFID) for the benefit of developing countries. The views expressed are not necessarily those of DFID. R7278 - Forestry Research Programme.
1 DFID (UK) Forestry Research Programme, projects R7278/R6195 2 Forest Resources Management Division, Guyana Forestry Commission


Contents ACKNOWLEDGEMENTS.................................................................................................... 3 ACRONYMS USED................................................................................................................ 3 SECTION 1. BACKGROUND TO THE STUDIES ....................................................... 4
1.1. INTRODUCTION.......................................................................................................... 4 1.2. OBJECTIVES ............................................................................................................... 4 1.3. MAIN FOCUS GROUPS ................................................................................................ 5
SECTION 2. THE ITUNI SMALL LOGGERS ASSOCIATION STUDY................... 6 2.1. SUMMARY OF ACHIEVEMENTS AND POSSIBLE NEXT STEPS....................................... 6 2.2. BRIEF DESCRIPTION OF THE ITUNI SMALL LOGGERS ASSOCIATION (ISLA) ............ 7
2.2.1. ISLA expressed needs ........................................................................................ 9 2.3. PROFILE OF THE ISLA CONCESSION ....................................................................... 10 2.4. THE MYRLIN TOOLKIT FOR MODELLING TREE GROWTH AND TIMBER YIELD ....... 10 2.5. METHODOLOGY USED TO MEET STUDY OBJECTIVES............................................... 14
2.5.1. Activities towards Objective 1: Sustainable Yield estimation ......................... 14 2.5.2. Activities towards Objective 2: Information, knowledge and skills transfer... 26 2.5.3. Activities towards Objective 3: Applicability to Guyana ................................ 27
2.6. RESULTS AND FINDINGS .......................................................................................... 27 2.6.1. Sustained Yield estimation .............................................................................. 27 2.6.2. Information, Knowledge and Skills Transfer .................................................. 32 2.6.3. Applicability to Guyana .................................................................................. 33
2.7. CONCLUSIONS AND RECOMMENDED NEXT STEPS ................................................... 35 2.7.1. What did the study achieve?............................................................................ 35 2.7.2. Recommended next steps................................................................................. 35
2.8. SUMMARY OF STUDY OUTPUTS AND THEIR DELIVERY........................................... 38 2.9. PHOTOGRAPHS TAKEN BY MR GAVIN NICOL DURING THE ISLA CASE STUDY ..... 39
SECTION 3. THE BARAMA COMPANY STUDY ..................................................... 42 3.1. SUMMARY OF ACHIEVEMENTS AND POSSIBLE NEXT STEPS..................................... 42 3.2. BRIEF DESCRIPTION OF THE BARAMA COMPANY LIMITED (BCL) ......................... 43
3.2.1. Forest Research............................................................................................... 44 3.2.2. The pilot study ................................................................................................. 45
3.3. BRIEF PROFILE OF THE BCL CONCESSION.............................................................. 46 3.4. THE SYMFOR GROWTH AND YIELD MODELLING FRAMEWORK............................. 49 3.5. METHODOLOGY FOR THE STUDY............................................................................. 50
3.5.1. Activities towards Objective 1: Sustainable Yield estimation ......................... 50 3.5.2. Activities towards Objective 2: Information, knowledge and skills transfer... 56 3.5.3. Activities towards Objective 3: Applicability to Guyana ................................ 57
3.6. RESULTS AND FINDINGS .......................................................................................... 58 3.6.1. Sustained Yield estimation .............................................................................. 58 3.6.2. Information, knowledge and skills transfer..................................................... 67 3.6.3. Applicability to Guyana .................................................................................. 68
3.7. CONCLUSIONS AND RECOMMENDED NEXT STEPS ................................................... 69 3.7.1. What did the study achieve?............................................................................ 69 3.7.2. Recommended next steps................................................................................. 70
3.8. SUMMARY OF OUTPUTS AND THEIR DELIVERY........................................................ 71 3.9.PHOTOGRAPHS TAKEN BY MR GAVIN NICOL DURING THE BCL CASE STUDY - 2001 . 72
1

SECTION 4. REPORT OF THE WORKSHOP ON METHODS OF YIELD REGULATION IN GUYANA ............................................................................................. 75
4.1. EXECUTIVE SUMMARY............................................................................................ 75 4.1.1. Summary of Recommendations ....................................................................... 76
4.2. INTRODUCTION........................................................................................................ 77 4.2.1. Aims of the workshop ...................................................................................... 77
4.3. TWO-DAY WORKSHOP AT THE GUYANA FORESTRY COMMISSION......................... 78 4.4. SUMMARY OF PRESENTATIONS AND DISCUSSION POINTS ....................................... 79
4.4.1. Overview of forest management in Guyana in relation to growth and yield studies ......................................................................................................................... 79 4.4.2. Growth and Yield Pilot Study using the MYRLIN toolbox .............................. 79 4.4.3. IWOPLAN - a decision support system to assist management planning......... 80 4.4.4. Overview of forestry in Indonesia with specific reference to growth and yield case studies...................................................................................................................... 80 4.4.5. Growth and Yield Pilot Study using the SYMFOR modelling framework....... 81 4.4.6. Summary of workshop proceedings................................................................. 81 4.4.7. Group discussions ........................................................................................... 82
4.5. HALF-DAY SEMINAR AT THE UNIVERSITY OF GUYANA .......................................... 86 4.6. CONCLUSIONS ......................................................................................................... 87
4.6.1. Did the workshop meet the aims set out in the Introduction? ......................... 87 4.6.2. Summary of next stages ................................................................................... 87
4.7. APPENDICES TO THE WORKSHOP REPORT............................................................... 88 SECTION 5. REFERENCES.......................................................................................... 94
2

Acknowledgements The authors of this report wish to express their appreciation to their colleagues in the organisations collaborating in this study for assistance and support provided throughout the process. While important contributions were made by a number of persons, the content of this report (including any mistakes it may contain) is the sole responsibility of the authors and does not necessarily represent the position of any of the organisations involved. Cover photos: 1. Chainsaw conversion of a log by the Ituni Small Loggers Association; 2. Preparing to extract a log from the BCL forest by skidder (Gavin Nicol 2001/1995)
Acronyms used Acronym Full name AAC Annual Allowable Cut API Aerial Photo-interpretation BA Basal area BCL Barama Company Limited CIDA Canadian International Development Agency CIFOR Centre for Forestry Research dbh diameter at breast height DFID Department for International Development (UK) ECTF Edinburgh Centre for Tropical Forestry FPA Forest Products Association FRP (DFID) Forest Research Programme FRIU (GFC) Forest Resources Information Unit FRMD (GFC) Forest Resources Management Division FRU (GFC) Forest Research Unit GEMFORM Guyana Empirical Forest Management Model GFC Guyana Forestry Commission GSA Guyana School of Agriculture GTZ German Agency for Technical Cooperation ISLA Ituni Small Loggers Association IFP Interim Forestry Project (CIDA-funded, Guyana) ITTO International Tropical Timber Organisation MAI Mean Annual Increment MYRLIN Method of Yield Regulation with Limited Information NARI National Agricultural Research Institute NGO Non Governmental Organisation PSP Permanent Sample Plot SYMFOR Silviculture and Yield Modelling for Tropical Forests TFF Tropical Forest Foundation TSA Timber Sales Agreement UG University of Guyana UNDP United Nations Development Programme UNDP-PROFOR UNDP Programme for Forests D95 The 95 percentile on the cumulative diameter distribution of trees
3

SECTION 1. Background to the studies
1.1. Introduction Two pilot studies focussing on modelling sustained timber yields in Guyana were carried out at the end of 2001, each implemented as a partnership between the Guyana Forestry Commission (GFC), a Guyanese forestry operator, and the Universities of Edinburgh and Oxford in the UK. A separate report is provided for each of these studies in Sections 2 and 3 of this document. The work was supported by the Forestry Research Programme (FRP) of the UK’s Department for International Development (DFID), with contributions to in-country costs from the national study partners1. The studies came about as part of a joint extension phase of two existing FRP projects:
• Humid and Semi-Humid Tropical Forest Yield Regulation with Minimal Data (R7278), and
• Growth and Yield Modelling Framework to Determine Ecological and
Economic Sustainability of Managed Tropical Moist Forest Systems (Growth and Yield Modelling; R6915).
The background to the two studies can be followed through the back-to-office reports of van Gardingen (2000, 2001) and Phillips (2001a), along with documentation from the R7278 project already in progress (Alder and Wright 2000, and Alder et al., 2001). Discussions between the two projects led to a research visit that paved the way for planning the pilot studies (Macqueen, 2001). In September 2001, a three week training programme was undertaken in Oxford and Edinburgh, at which two GFC officers received initial training in the MYRLIN and SYMFOR modelling applications, while working with FRP colleagues to develop a proposal for the studies (Khan and Singh 2002, Phillips and Halfmann 2002, Baker, 2002)2. The training programme was also attended by an Indonesian team that carried out two equivalent studies in East Kalimantan as part of the above FRP projects. This report describes the implementation stage of the two Guyanese pilot studies, along with a report on the workshop held at GFC in March 2002.
1.2. Objectives The objectives of the pilot studies were to:
1. Explore methods for estimating sustainable timber yields in an industrial and a community forestry concession in Guyana, in response to demand from the Guyana Forestry Commission and forest sector.
By applying the MYRLIN and SYMFOR models, based on best available data and realistic management scenarios.
1 The back to office report of Duncan Macqueen (2001) describes the rationale behind the choice of private sector partners. 2 Electronic copies of all principal references cited in this report are contained in the accompanying MYRLIN CD.
4

2. Transfer resulting information, knowledge and skills (as appropriate)
effectively to local, national and international stakeholders. By involving two GFC officers in all stages of the development
and implementation of the pilot studies, by working as closely as possible with the other study partners and
through a project workshop at GFC.
3. To provide an assessment of the possible future roles for the two modelling approaches in the Guyanese context.
By examining the strengths and weaknesses of the modelling applications in relation to their use in the pilot studies.
1.3. Main focus groups The study focused on developing methodologies results and outputs for particular stakeholder groups. These were identified in advance to guide the study process. Primary and secondary focus groups were identified as: Primary: Guyana Forestry Commission (GFC) (Commissioner and technical
staff).
Forest Sector partners: Barama Company Limited (BCL)and the Ituni Small Loggers and Chainsaw Association (ISLA).
UK Department for International Development, Forest Research Programme (DFID/FRP) partners.
Secondary: Other relevant government bodies: Min. Amerindian Affairs,
Environmental Protection Agency.
NGO’s: Forest Products Association (FPA), Tropical Forest Foundation (TFF), Iwokrama. Other multilateral/ donor organisations: e.g. International Tropical Timber Organisation (ITTO), United Nations Development Programme – Programme For Forests (UNDP–PROFOR).
Forestry lecturers and students: University of Guyana (UG) and Guyana School of Agriculture (GSA).
5

SECTION 2. The Ituni Small Loggers Association study This section describes the pilot study carried out in collaboration with the Ituni Small Loggers and chainsaw Association (ISLA). This study used the MYRLIN growth and yield modelling tools developed under FRP project R7282.
2.1. Summary of achievements and possible next steps
The pilot study was a successful collaboration between GFC, the Ituni Small Loggers Association and the UK project team. Other stakeholders were also included by holding a national workshop before the studies were completed. GFC capacity was increased in the area of forest growth and yield estimation, providing two members of staff with the skills and tools to carry out further work of this kind using other datasets as required. The outputs from the study, along with copies of the modelling tools, data sets and background documentation have been placed on a CD to make them as accessible as possible to all stakeholder groups. This will be of particular use to the educational and training sector. Possible next steps include:
1. The process developed in this pilot study can be considered a starting point when carrying out analysis of the ISLA’s new inventory data. The vegetation map produced by the study will be of great use in undertaking this next phase of activity but the preliminary results relating to sustained yields presented in this report cannot be used for ISLA management planning because the dataset used originated outside the ISLA area; (GFC/ISLA)
2. GFC assist ISLA and other companies with sustained yield
estimation on a concession-by-concession basis, using the various tools now at their disposal (MYRLIN, SYMFOR, GEMFORM, Silvicultural Survey analysis). (GFC)
3. Further testing of MYRLIN can take place by its various users,
sharing and comparing experiences through the MYRLIN web-site. Some means for estimating the precision of results should ideally be incorporated into the MYRLIN toolkit if/when funds are available. (MYRLIN users and system developer).
4. The DFID Forest Research Programme should continue dialogue
with GFC over the uptake and application of the models, providing (and/or assisting with the process for identifying) continued support in any areas of particular need that are highlighted by GFC; (FRP).
6
2.2. Brief Description of the Ituni Small Loggers Association (ISLA)
The ISLA is a recently-formed cooperative of around 40 small-scale timber harvesting operators who are working to gain a Woodcutting Lease3 on their combined area of around 33,300 hectares. The Ituni community is under severe economic pressure due to the collapse of the bauxite industry, which was formerly the main source of employment in this area. This situation has tended to promote unregulated and illegal harvesting of forest areas neighbouring the community. The Association’s present area is an amalgamation of the State Forest Permissions4 held by 11 individual members, who still hold exclusive cutting rights to these areas. Association members work for these 11 operators, who share log quotas allocated by GFC. The Association was formed as the first step towards providing a legitimate means for community members to sustain their livelihoods in a cooperative forestry venture. However, in order to be allocated this combined area as a long-term concession, the community must demonstrate the capacity to competently manage it, the immediate indicator of this being the preparation and approval of a forest management plan. Association members harvest a wide variety of timber species, which fall into two main categories – sawlogs and peeler logs. Almost all of the former are converted at stump using chainsaws. Markets are also being developed for piles and for special, high-value timbers such as Letterwood. The location of the concession is shown on the map of Northern Guyana, below. Also shown is the area in which the inventory data used in this study were collected.
3 This provides for exclusive harvesting rights over the area for a defined period of 3 – 10 years (which may be renewed subject to performance). 4 This is an annual license that provides non-exclusive rights to harvest specified produce from an area.
7
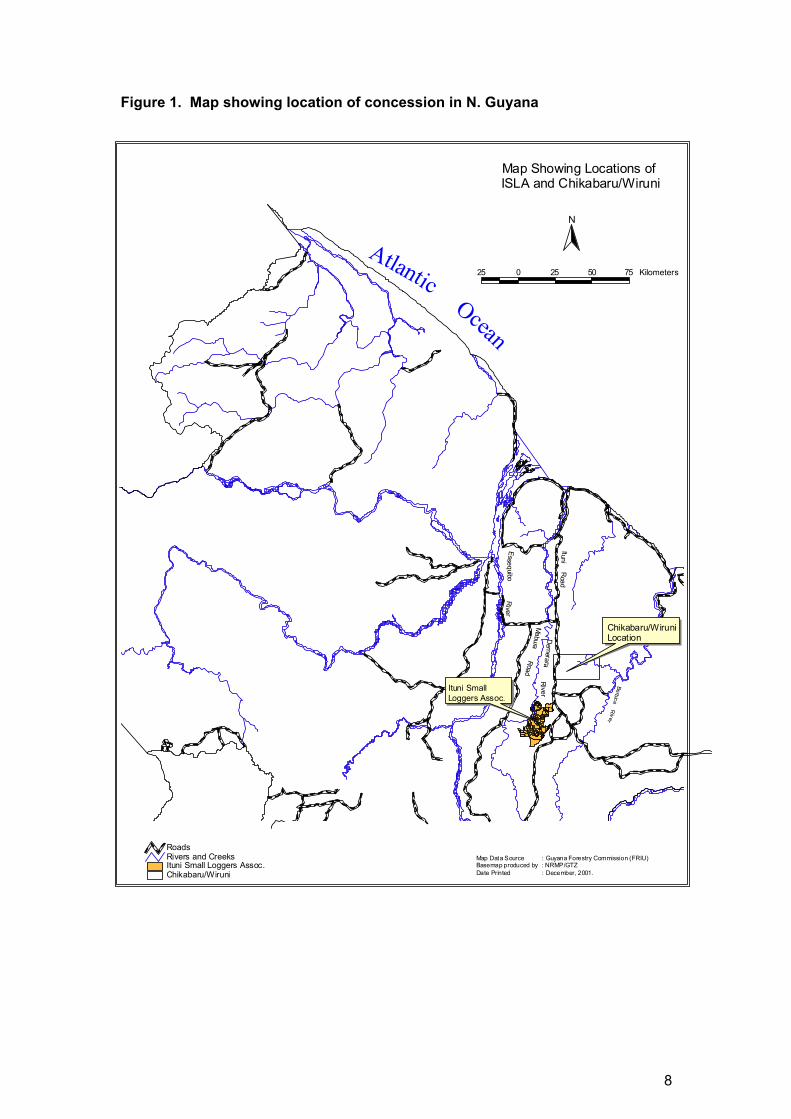
Figure 1. Map showing location of concession in N. Guyana
N
Map Showing Locations of ISLA and Chikabaru/Wiruni
Chikabaru/WiruniItuni Small Loggers Assoc.Rivers and CreeksRoads
Map Data Source : Guyana Forestry Commission (FRIU)Basemap produced by : NRMP/GTZDate Printed : December, 2001.
Ituni SmallLoggers Assoc.
Chikabaru/WiruniLocation
Mabura Road
Ituni Road
Demerara River
Essequibo River
Berbice River
25 0 25 50 75 Kilometers
Atlantic Ocean
8

2.2.1. ISLA expressed needs The following table presents a summary of the needs expressed by the Association during the visit of MacQueen (2001). The original list was refined on the basis of discussions with the various FRP partners, as the Association had made a number of requests that could not be covered by the present study (including the preparation of the Association’s forest management plan). The second column of the table summarises the action considered necessary to meet these needs.
Table 1 Addressing the needs expressed by the Association Outputs desired by ISLA
Action taken
Information on: Forest resources within the concession.
Existing information was compiled including: forest inventory data, forest type maps, production records. A new forest type map was produced from soil data and aerial photographs; this was updated after consultation with ISLA members and limited field reconnaissance.
Sustained yield harvesting options feeding into forest management plan and realistic GFC log quotas. Whether the allocated area is adequate to meet members’ needs.
MYRLIN software was used to summarise inventory data and model possible sustained yield options.
Skills in developing and applying forest planning information.
The FRP team worked closely with the ISLA to ensure that members were involved in the process and understood the purpose of the various activities (it was not possible, within the given time constraints, to carry out formal training).
9
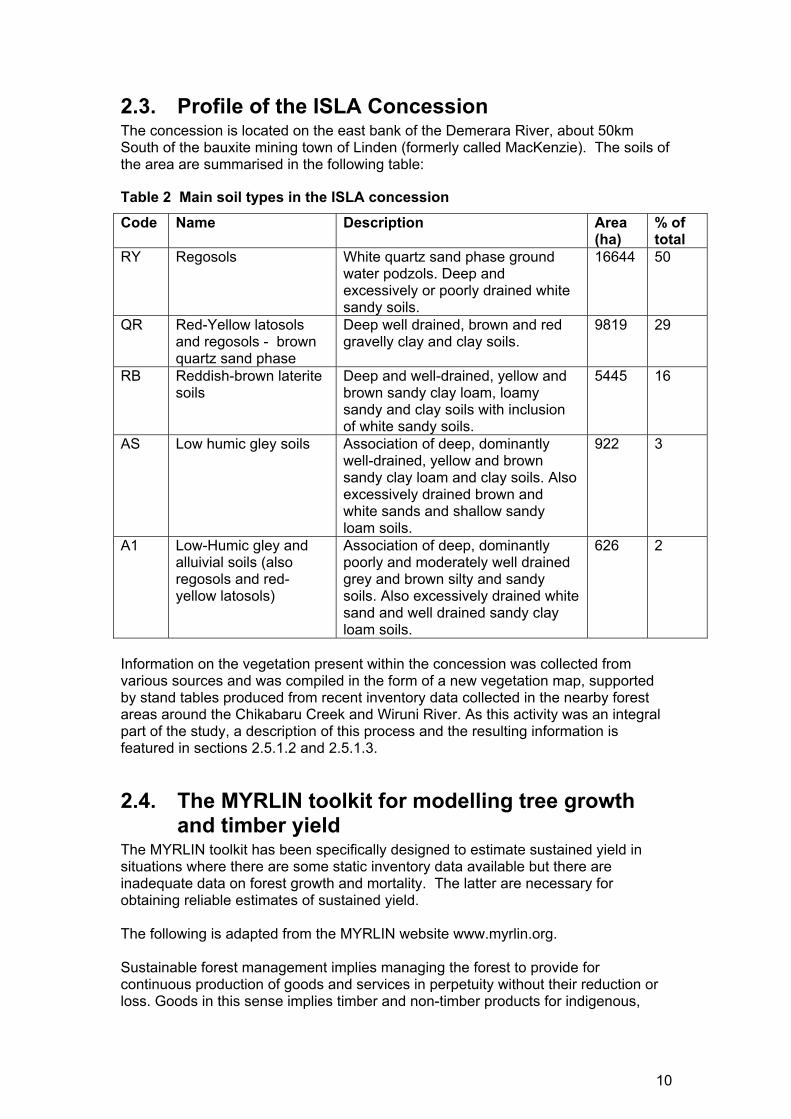
2.3. Profile of the ISLA Concession The concession is located on the east bank of the Demerara River, about 50km South of the bauxite mining town of Linden (formerly called MacKenzie). The soils of the area are summarised in the following table:
Table 2 Main soil types in the ISLA concession Code Name Description Area
(ha) % of total
RY Regosols White quartz sand phase ground water podzols. Deep and excessively or poorly drained white sandy soils.
16644 50
QR Red-Yellow latosols and regosols - brown quartz sand phase
Deep well drained, brown and red gravelly clay and clay soils.
9819 29
RB Reddish-brown laterite soils
Deep and well-drained, yellow and brown sandy clay loam, loamy sandy and clay soils with inclusion of white sandy soils.
5445 16
AS Low humic gley soils Association of deep, dominantly well-drained, yellow and brown sandy clay loam and clay soils. Also excessively drained brown and white sands and shallow sandy loam soils.
922 3
A1 Low-Humic gley and alluivial soils (also regosols and red-yellow latosols)
Association of deep, dominantly poorly and moderately well drained grey and brown silty and sandy soils. Also excessively drained white sand and well drained sandy clay loam soils.
626 2
Information on the vegetation present within the concession was collected from various sources and was compiled in the form of a new vegetation map, supported by stand tables produced from recent inventory data collected in the nearby forest areas around the Chikabaru Creek and Wiruni River. As this activity was an integral part of the study, a description of this process and the resulting information is featured in sections 2.5.1.2 and 2.5.1.3.
2.4. The MYRLIN toolkit for modelling tree growth and timber yield
The MYRLIN toolkit has been specifically designed to estimate sustained yield in situations where there are some static inventory data available but there are inadequate data on forest growth and mortality. The latter are necessary for obtaining reliable estimates of sustained yield. The following is adapted from the MYRLIN website www.myrlin.org. Sustainable forest management implies managing the forest to provide for continuous production of goods and services in perpetuity without their reduction or loss. Goods in this sense implies timber and non-timber products for indigenous,
10

local or commercial use; services include amenity, plant and wildlife conservation, biodiversity, hydrological qualities, soil conservation, carbon sequestration and all other values, whether definable in monetary terms or not, that may be derived from the forest. Increasing production levels of one good or service may reduce the quality or quantity of another. Monitoring and evaluation of sustainability is therefore a complex task. An approach known as Principles, Criteria, Indicators and Verifiers has been developed to assist this process, and is increasingly being applied in forest management.
Figure 2 Factors influencing total forest estate. The Centre for International Forestry Research (CIFOR) has produced manuals, forms and software on this topic which are available to download from the CIFOR website. Standards for sustainable forest management have been published as the Forest Stewardship Council (FSC) Principles and Criteria, or the International Tropical Timber Organization Guidelines for the Sustainable Management of Natural Tropical Forests. Yield regulation is a key part of sustainable forest management (SFM). It defines when, where and how trees should be felled in order meet the criteria for SFM.
Yield regulation involves both a planning and a monitoring component. The planning process specifies the criteria for felling. The monitoring process ensures that these criteria are respected in practice. Yield regulation is the process of specifying and controlling harvesting in forestry so that the combined effect of removals and harvesting damage over a felling cycle do not exceed the accrual of new timber through growth and regeneration. It is the calculation and control of the sustainable yield. It is typically the case in moist tropical forest that management is conducted with limited information about tree growth and dynamics from the immediate locality. At the same time, the structure of the stands is complex, with many species and an irregular distribution of size classes. This situation creates a knowledge deficit that has in the past encouraged the non-sustainable exploitation of tropical forests. However, there are simple guidelines that can be formulated, followed, and effectively monitored that do allow for sustainable management, even where knowledge of growth and yield is limited. Figure 2 above, shows, in simple terms, factors influencing the total forest estate. Growth of standing trees, and natural or artificial regeneration, will add to the total timber stock. Natural mortality due to crowding, decay, insects, fire and wind damage
11

will reduce the stock. The forest area may increase due to additions of new forest land, or habitat changes, for example from grassland to forest. Conversely, the area may decrease due to legal excisions, agricultural encroachment, severe fires, or climatic change. All these factors have to be considered when calculating the volume that may be safely harvested. Harvesting itself is usually associated with logging damage, so that actual removals from the forest will be less than the total losses during the harvesting operation. The MYRLIN toolkit for growth and yield modelling was developed under Forest Research Project R7278 "Yield regulation for tropical moist forests with minimal data". One output from this project is the website http://www.myrlin.org, which can be viewed for a full description of the MYRLIN toolkit in relation to growth and yield estimation in tropical moist forests and broader issues of sustainable forest management5. MYRLIN is concerned with the calculations related to the horizontal arrows in Figure 2 above. Area gains and losses, if known, should be factored in to calculations of forest types and forest classification. If area losses and gains occur whilst a forest is under planned management, then the regulated yield must be revised, together with all associated planning data, to take them into account. Whilst the concept of a sustainable yield of timber is central to SFM, in most cases it is not the only issue that should be considered, as social, ecological and non-timber product benefits will also be involved. The MYRLIN toolbox provides three basic tools for yield regulation in natural forest, as indicated in Figure 3. They cover the formation of stand tables from inventory or stock survey data; the estimation of growth rates and mortality, especially where information from permanent sample plots is limited or absent; projection of the stand table in order to estimate sustainability and future yields; and allocation of harvesting and estimation of annual allowable cut for multiple forest stands. Each tool consists of an Excel file with embedded macros to speed up the calculations.
5 The site is a hypertext MYRLIN manual, also containing downloadable spreadsheet models which exemplify the various methods, along with information and reports from the project workshops and links to many related websites.
12

Figure 3 The MYRLIN process6 as explained by D. Alder.
7
Development cycle for MYRLIN tools
Organise inventory data and species list for MYRLIN#1 (stand table module)
Run MYRLIN#2 to get D95 values and first estimates of increment
Sort and prioritise species.Review ecology & other information Decide species groups.
Write final groups back to MYRLIN#1 species list.Re-run MYRLIN#1 with uniform diameter classes.
Copy stand table data to MYRLIN#3.Copy stratum data from MYRLIN#1.Copy increment estimates from MYRLIN#2.
Run various scenarios with MYRLIN#3Obtain schedules of yieldsObtain AAC estimates
The main functions of the individual MYRLIN workbooks are described below.
Table 3 Main functions of each MYRLIN workbook used in the study MYRLIN tool Function and features Comment MYRLIN #1 Uses static inventory plot data to produce
stand tables (showing the number of stems/ha, Basal Area (BA)/ha and number of stems/km2). These can be stratified by any suitable field in the plot data, as desired. Summaries can therefore be presented for the whole forest or by compartment or block etc. The species-related field used can also be set by the user, enabling the tables to be expressed in terms of individual species, utilisation or ecological group (i.e. by any field contained in the species list).
This workbook was modified as part of the study to accommodate point sampling data. Used for producing the main stand tables in this report.
For profiling the current resource, the data were analysed by Utilisation Group (highlighting Classes 2, 3 and 4)7.
MYRLIN #2 Uses the same tree data as MYRLIN#1 to calculate the 95 percentile of the cumulative diameter at breast height distribution (D95) by species or species group. Estimates annual diameter increment (Dinc) for each species or species group from D95 based on mean regression of data from trees in many regions of tropical forest across the world. Calculates annual mortality rate (AMR) from D95 and Dinc. Species (and/or group) values can be adjusted
The adjustment of species or group diameter increment values is a difficult part of the process and requires practice and confidence.
It can potentially be manipulated to give whatever results are desired.
7 An end-use classification to which all species were assigned at the beginning of the study. The highlighted classes refer to saw-log, peeler and piling species.
13

on the M#2 graph, based on knowledge of their ecological characteristics. This updates the Dinc and AMR (but not D95) values calculated by the macro. Alternatively, known values for some or all species can be input by the user
MYRLIN #3 Calculates annual allowable cut (AAC) and an annual harvest schedule from the initial stand tables (from M#1). These are projected through time using the Dinc and AMR values copied from M#2, net of harvesting prescriptions input as parameters by the user in the “Models” sheet.
If the information is available in the initial tree data, stems of non-merchantable form can be filtered (e.g. using Excel’s Autofilter) to allow an analysis of yield for trees of commercial species, size and quality.
The manner in which MYRLIN was applied in the pilot study is described in the next section.
2.5. Methodology used to meet study objectives This section describes the methodology used for the case study conducted in collaboration with the ISLA, by objective and activity.
2.5.1. Activities towards Objective 1: Sustainable Yield estimation
“To explore methods for estimating sustainable timber yields in an industrial and a community forestry concession in Guyana, in response to demand from the Guyana Forestry Commission and forest sector”.
2.5.1.1. Introduction It is widely known that in Guyana, as elsewhere, differences in soil type and associated terrain and hydrology have major effects on tree growth, mortality and stem form, this has important implications for the timber productivity of any given part of a logging concession. Two main types of available information were therefore required to characterise the present forest resources in the ISLA concession: a) forest composition data that described each of the main productive forest types present within the ISLA concession, and b) information on the distribution and extent of these forest types. The composition data could then be processed using MYRLIN and used to make productivity predictions for each of the main forest types, projected across the area(s) it covered. Because of the absence of permanent sample plot data from the ISLA concession it was recognised from the outset that the study could not make use of the SYMFOR framework8, but would depend instead exclusively on the MYRLIN modelling software.
8 Information on the SYMFOR framework and its application in Guyana is contained in SECTION 3 covering the pilot study report for the Barama Company Limited and in the website www.symfor.org
14

2.5.1.2. Synthesise existing information No recent forest composition data were available for the ISLA area, so a search was made of past inventory work carried out in its general locality. Forest inventory databases of the GFC Forest Resource Information Unit (FRIU) revealed that the following data had been collected in or around the ISLA concession area:
Table 4 Forest inventory data available in and around the ISLA area Inventory Location Date
collectedApproximate Distance from ISLA concession
Number of plots
Number of trees
Reconnaissance survey #18
Kamakabra River
1935 Overlapped with northern part of ISLA
Not known Not known
Left bank Demerara
1968 20 km 10 200 Forest Industries Development Survey (FIDS)
Right bank Demerara
1968 20 km 4 52
Interim Forestry Project
Chikabaru Creek, Wiruni River
1992-4 25 km 696 28029
From this information it was clear that the most representative available dataset for the purposes of the study was that of the Interim Forestry Project (IFP), collected in the early 1990’s. Although this dataset originated outside of the ISLA area, and would therefore be unsuitable for actual forest management planning by the ISLA, it was the most recent, most substantial in size and was collected around 25 km from the ISLA area. These data were therefore selected for the study on the basis that they would enable MYRLIN to be used for initial testing until the ISLA has conducted its own inventory. The IFP forest inventory at Chikabaru/Wiruni involved the establishment of North-South sample lines at more or less regular intervals on both sides of an East-West access road. Sample points were established at 100m intervals at which sample trees were selected based on a sweep with a Basal Area Factor (BAF) 6 wedge prism. Trees of all species and with a minimum diameter at breast height (dbh) of 10 cm were recorded. Each sample tree was also assessed for bole quality (“Risk Class”), this being based on the presence/absence of a fork, sweep or external signs of decay (or combinations of these) in the main bole. Site attributes were recorded at each sample location, the most important being slope, soil type, forest type and disturbance. These data were originally processed by a “DOS” computer program written in the “GW Basic” language, but they were converted into Dbase format (“.dbf”) files in 1999, which could be accessed in MS Excel. Before they were pasted into MYRLIN#1, the plot and tree data were merged into a single “flat file” and the data were thoroughly examined for errors and/or inconsistencies and were corrected accordingly. This included selective checks of the original data sheets where necessary.
9 See below, 441 of these plots were within productive forest types, with 1172 of the sample trees being defect-free. This subset of the data was used for the final analysis.
Table 5
15
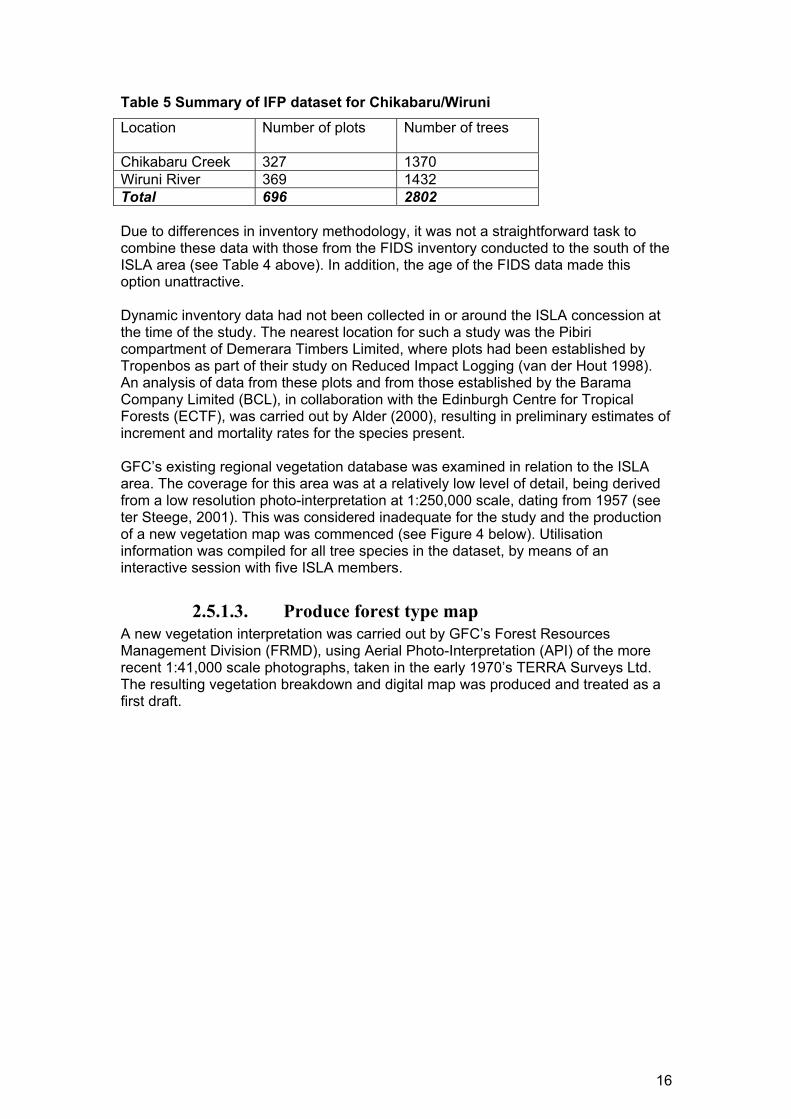
Table 5 Summary of IFP dataset for Chikabaru/Wiruni Location Number of plots Number of trees
Chikabaru Creek 327 1370 Wiruni River 369 1432 Total 696 2802 Due to differences in inventory methodology, it was not a straightforward task to combine these data with those from the FIDS inventory conducted to the south of the ISLA area (see Table 4 above). In addition, the age of the FIDS data made this option unattractive. Dynamic inventory data had not been collected in or around the ISLA concession at the time of the study. The nearest location for such a study was the Pibiri compartment of Demerara Timbers Limited, where plots had been established by Tropenbos as part of their study on Reduced Impact Logging (van der Hout 1998). An analysis of data from these plots and from those established by the Barama Company Limited (BCL), in collaboration with the Edinburgh Centre for Tropical Forests (ECTF), was carried out by Alder (2000), resulting in preliminary estimates of increment and mortality rates for the species present. GFC’s existing regional vegetation database was examined in relation to the ISLA area. The coverage for this area was at a relatively low level of detail, being derived from a low resolution photo-interpretation at 1:250,000 scale, dating from 1957 (see ter Steege, 2001). This was considered inadequate for the study and the production of a new vegetation map was commenced (see Figure 4 below). Utilisation information was compiled for all tree species in the dataset, by means of an interactive session with five ISLA members.
2.5.1.3. Produce forest type map A new vegetation interpretation was carried out by GFC’s Forest Resources Management Division (FRMD), using Aerial Photo-Interpretation (API) of the more recent 1:41,000 scale photographs, taken in the early 1970’s TERRA Surveys Ltd. The resulting vegetation breakdown and digital map was produced and treated as a first draft.
16

Table 6 Initial land status in the ISLA concession (from initial forest resources map).
Cover type (incl FIDS code)
Area (ha)
Area (acres)
% of total conces-
sion
Productive for forestry
(Y/N)
Current use
Comments
1- Mixed forest on undulating broken terrain along main rivers
24,763 61,189 73.3 Y Timber harvesting
Main productive forest type
1(d) - Liane forest
157 389 0.5 N None Limited area
1(h) - Mixed forest on high hills
353 873 1.0 Y None Area too steep to access
2(a) - Wallaba forest
393 972 1.2 Y Limited timber
harvesting
Few patches where Wallaba
is dominant2(c) - Poor Wallaba/Dakama forest
8,095 20,004 24 N Limited timber
harvesting
Area has been degraded due to logging and
fireCompound - - - N Quarry - - - N Laterite
production Total 33,762 83,426 100 %
17

Figure 4 Preliminary vegetation map for ISLA area.
1
2c
1h
2a
1d
Vegetation Map of ISLA
N
Map produced by : Guyana Forestry Comm. (FRIU)Data Source : APIDate printed : March 18, 2002.
2 0 2 4 KilometersForest Types (API)1- Mixed forest on undulating, broken terrain along main rivers2a - Wallaba2c - Poor Wallaba/Dakama Forest1d - Liane Forest1h - Mixed forest on high hil ls
Contours.Creeks.
Two stages were then followed to assess and refine this map, as follows:
18

Stage 1 The map was up-dated by a member of GFC’s forest monitoring staff, who was familiar with the concession area. Subsequently, members of the ISLA were also requested to improve the map by annotating two copies over a period of a week. These inputs lead to modifications arising on account of the following.
1) Changes in the boundaries of types (e.g. an expansion of type 2c – Poor Wallaba/Dakama scrub – into areas previously classed as mixed forest).
2) Inclusion of an area of swamp forest not distinguished in the Aerial Photo-
Interpretation (API). 3) Delineation of several areas known to have been logged in the past or that
are being logged at present. This distinction was most relevant to the high forest types, allowing these to be subdivided for the purposes of data analysis.
Stage 2 A reconnaissance visit carried out by the study team, which lead to the conclusion that the forest type classification could usefully be enhanced to better capture an important variation that was observed. The field visit revealed that significant areas designated as Mixed Forest (Type 1) on the map were distinct in that they occurred on white sand. Though this sub-type was not readily distinguishable from brown sand mixed forest on the aerial photos, spot checks made on the ground suggested that its composition seemed distinct from the mixed forest on brown sands (as would be expected). This observation suggested that this important type was not adequately distinguished by the API-based classification being used. To further support this, available soil maps (particularly those produced by the National Agricultural Research Institute) showed that a substantial proportion of the concession’s high forest areas were growing on white quartz sand soils. It seemed therefore that a large part of the concession contained a mixed forest type growing on white sand. Though Soft Wallaba was present in this forest type, its degree of dominance was reduced to the point where the type could be distinguished from Mixed Forest (type 1, in which soft Wallaba does occur) on the aerial photographs. The initial map only identified two small patches of Wallaba forest. This refinement of the map was consistent with site information in the Interim Forestry Project (IFP) data, in which 67 sample points (10% of the total) were recorded as being in Mixed forest on white sand. As a general rule, Wallaba forest is considered to be the main high forest type occurring on white sand soils in Guyana, while a variety of “Mixed forest” types are seen to occur on other (terra firma) soil types. However, in the case of the ISLA area (and for the purposes of this study), this usual rule of thumb did not adequately account for the main variations in forest composition that were observed. The conclusion made from the above was that information on the distribution of white sand soils needed to be more explicitly factored into the forest classification adopted, since it was likely to be the major determinant of (high) forest composition. As the IFP assessment of “Forest Type” at each sample location was known to have been somewhat subjective (and largely based on soil observations in any case) it was decided that “Soil Type” information would provide the safest basis for selecting IFP inventory plots most representative of the new ISLA classes.
19

The National Agricultural Research Institute (NARI) national soil map at 1:250,000 scale provided semi-detailed information on the main soil types and their distribution, which could be used to split the main Mixed Forest type (type 1) into two sub-types – mixed forest on white sand and mixed forest on other soil types (brown sands, clays and brown laterite soils). It was decided that for the purposes of this study the white sand sub-type could include the small areas of wallaba forests distinguishable on the aerial photographs. By this means a link was established between the final forest type map produced and the forest types which could be distinguished and isolated within the IFP dataset. For this study, Dakama forest (type 2d) Scrub and Savanna (2s) were amalgamated into the class “LOW FOREST”. Additionally, one area of swamp forest – Type 3(a), was drawn on the map by ISLA members, though this was not included in the yield projections. Based on the above process, the classification adopted for this study distinguished forest types on the basis of forest stature, where necessary qualified by soil type, i.e.
1. MIXED10 FOREST (Type 1) ON BROWN SANDS/ CLAYS AND LATERITIC SOILS
2. MIXED FOREST (Type 1/2(a)) ON WHITE SAND
3. LOW FOREST (Type 2(c), 2(d))
4. SWAMP FOREST11 (Type 3(a))
Unfortunately the IFP forest inventory data from Chikabaru/Wiruni did not include plots on clay nor on lateritic soils. For convenience the IFP data for “mixed forest on brown sand soils” were used to represent mixed forest occurring on all “non white sand” soils, including the substantial area of brown lateritic soils in the southern part of the concession. This was recognised as a deficiency, but one which can be purposefully addressed when data are collected within the concession as part of any future inventories within the ISLA area. One additional, unproductive, forest type (FIDS type 1h – “Mixed forest on high hills”) was distinguished in the API on the basis of its high forest stature and presence on several steep outcrops. As well as its steep terrain, this type covered only 1 % of the total, so was of negligible interest for timber production. Given the importance of present forest condition for modelling future timber yields a further distinction was then made between the main high (mixed) forest areas (types 1 and 2) that had already been logged and those that had not. Areas logged in the past (or that were presently being worked) were mapped based on the consultation exercise with the ISLA. The above process led to the following final classification being adopted for stratification of the forest and matching with appropriate IFP data:
10 This is effectively equivalent to “High Forest”, as opposed to “Low Forest” 11 An alternative name consistent with the classification would be “Mixed (or High) Forest on Pagasse Soil”
20

Table 7 Final matching of IFP data with the new vegetation map. VEGETATION MAP INVENTORY DATA
Forest Stature
Soil type
Condition
FINAL TYPES
Forest type
Soil type
Disturb-ance code
Number of sample trees12
High Forest
Brown Sand (3 types) and brown lateritic soils
Logged (as plotted on map)
1. MIXED FOREST ON BROWN SAND/ LATERITIC SOILS – LOGGED
Mixed or Wallaba
Brown Sand
Recent or old logging
84 (65% defect-free)
High Forest
Brown Sand (3 types) and brown lateritic soils
Not Logged (as plotted on map)
2. MIXED FOREST ON BROWN SANDS/ LATERITIC SOILS - NOT LOGGED
Mixed or Wallaba
Brown Sand
All other codes 667 (75% defect-free)
High Forest
White Sand
Logged (as plotted on map)
3. MIXED FOREST ON WHITE SAND – LOGGED
Mixed or Wallaba
White sand
Recent or old logging
53 (50% defect-free)
High Forest
White Sand Not Logged
4. MIXED FOREST ON WHITE SAND – NOT LOGGED
Mixed or Wallaba
White sand
All other codes 368 (51% defect-free)
High Forest
As plotted on map based on API and topography
All (in fact none of these areas had been logged)
5. MIXED FOREST ON HIGH HILLS
No data No data No data Timber yields not projected
Low Forest All (as plotted on map)
All 6. LOW FOREST Dakama, Scrub, Savanna
All (mainly white sand)
All Timber yields not projected
High Forest
(As plotted on map)
All 7. SWAMP FOREST Swamp, Mixed
Pagasse, Flooded
All Timber yields not projected
12 Trees of dbh 10cm+ with “No defect” quality class. The percentage of such trees out of the total is given in brackets.
21

Figure 5 Final vegetation map produced13
N
VEGETATION MAPOF
ITUNI SMALL LOGGERS ASSOCIATION
Map produce by Guyana Forestry Commissionfor Ituni Small Loggers AssociationSource : GFC Regional Vegetat ion Map, 2001 & APIDate Printed : December, 2001
Vegetation TypesLow Forest Mixed Forest on High HillsHigh Forest on BS/LSHigh Forest on White SandSwampHigh Forest on BS/LS - LoggedLow Forest - LoggedHigh Forest on White Sand - Logged
Contours.Creeks.
Scale: 1: 20,000
2 0 2 Kilometers
13 Due to changes during insertion into this document, the 1:20,000 scale quoted on the map should be ignored in favour of the scale bar.
22

Table 8 Final Area breakdown
Forest type Area (Ha) % of area Logged (Ha) Logged %Mixed Forest on Brown Sand/Lateritic Soil 14,752 42.7 1,967 5.7Mixed Forest on White Sand 10,322 29.8 1,504 4.3Low Forest 8,095 23.4 528 1.5Mixed Forest on High Hills 1,341 3.9 - -Swamp 77 0.2 - -Total 34,587 100 3,999 11.6
2.5.1.4. MYRLIN application On further scrutiny it was decided that there were insufficient IFP data from logged forests to justify a separate analysis of these sub-types. The distinction between logged and unlogged forest was therefore not made for the purposes of the MYRLIN projections. The IFP data from unlogged plots (in the two productive forest types) was nonetheless included in the final dataset used to make some allowance for previous harvesting in these types within the ISLA area14. This process resulted in two productive strata - High Forest on Brown Sand/ Lateritic Soil (247 plots) and Mixed Forest on White Sand (194 plots). Data for plots in other forest types were removed from the “Plotdata” worksheet of MYRLIN#1. To ensure that the model had a realistic basis for predicting harvestable volumes, the IFP data were filtered to leave only trees of good stem quality. In terms of the IFP inventory classification, this was taken to be those trees with a “no defect” rating. After these adjustments, a total of 1172 defect-free trees in 441 plots within two strata were available for analysis using MYRLIN. Forest management scenarios modelled Harvesting scenarios were based on the current GFC Forest Management Plan Guidelines and Code of Practice, running the model on a number of scenarios which varied in terms of felling cycle and minimum harvestable tree diameter. The aim of this activity was to use MYRLIN to predict outcomes of management under current guidelines and to explore options for achieving a sustained yield – that is, by lengthening the felling cycle and/or manipulating min diameter limits. The table below summarises the various settings used when running the model; those parameters for which more than one value was used are highlighted in bold italics.
14 These approximations will not be necessary when an inventory of the ISLA has been conducted, since it can be ensured that an adequate number of samples are placed in all important strata, including the previously harvested portion of the forest.
23

Table 9 MYRLIN toolbox elements. MYRLIN tool
Parameters that can be set Values used in the study
Diameter classes in stand table.
10cm+ in 5 cm diameter classes (< 60 cm dbh) and 10 cm classes > 60 cm.
MYRLIN #1
Species/ species groups used in analysis (Data can be pre-filtered before processing, as desired).
All species in data; utilisation groups as determined from ISLA interviews.
PlotData. Read by MYRLIN#2 macro from MYRLIN#1.
Mean stand increment. Mean of each (available) species’ value from Alder (2000) weighted by its basal area in the static data.
MYRLIN #2
Stand 95 percentile dbh. Taken from MYRLIN#3. Stand table information Pasted from MYRLIN#1. D95, Increment and AMR%. 1. Pasted from MYRLIN
#2. 2. Taken from Alder (2000); where species not covered, pasted from M#2.
Felling cycle (yrs). 20,40,60 Damage Factor (damaged volume as a percentage of harvested volume).
100%
Time interval (yrs) – the interval at which the model outputs information as it is runs.
5 years
Time Limit (yrs) – the total number of years to simulate when running the model.
60 years15
Area Tolerance % - determines how precisely the model calculates periodic coupe areas.
0%
Recruitment factor – ratio of trees dying to trees entering the smallest diameter class. If set to 1, the forest size class distribution remains constant over time (if not harvested).
1
MYRLIN #3
Dlim - diameter limit by species or group.
35cm – all species 55cm - all species16
15 It was recommended by senior FRP staff that sixty years was the maximum reliable projection period for MYRLIN. 16 Due to utilization practices, the minimum felling diameter of Soft and Ituri Wallaba was kept at 35cm in both sets of runs
24

Harv% - percentage harvested by species or group (presumably the percentage of merchantable trees or volume available that can be harvested)
Set at 100%, 67% and 33% for commercial species. Non-commercial species set at 0%
Vol/BA, i.e. form height. Set at 10.2 for all species - the mean value developed by Alder (2001) based on recoverable bole volume to 30cm top diameter.
Stratum areas (“Areas” worksheet). Set to the proportion of each stratum for the main series of runs, to give aggregate estimates for an average hectare of ISLA forest.
As part of the MYRLIN process (see section 2.4, above), the initial values for increment and mortality generated by MYRLIN from the inventory data are adjusted (if possible) using additional information the user may have on the ecology of the species/species groups. However, it was known that the work of Alder (2000) had already established estimates of increment and mortality for the majority of the species present in the main inventory dataset (using data from permanent sample plots). This led to an interesting conundrum - how much existing information on the species should be added, given that detailed estimates for increment, mortality and recruitment were already available for all but 18 of the 128 species/species groups17 in the dataset from a site approximately 80 km away? This issue was addressed by sourcing increment and mortality coefficients in two distinct ways:
1) From MYRLIN’s default analysis of the static inventory data alone. 2) From available permanent sample plot (PSP)-derived values (using Alder
2000), supported by MYRLIN default values only for species not covered.
Assuming the estimates arising from PSPs can be regarded as reasonably reliable, a comparison between the results obtained could therefore provide useful insights into the predictive capability of MYRLIN in situations where dynamic (and ecological) data are completely lacking (Case 1, above). AAC and annual coupe harvest estimates were produced under each management scenario using each of the two model calibrations described above. Three criteria were applied to rank the results of the scenarios in order of “optimality”; these were (in order):
1. The overall volume of standing commercial timber must, at the end of the 60 year period, be the same, or greater than, the initial commercial volume (yes/no, supported by the percentage of final standing stock against the initial stock).
2. Total yield over this period (higher is better) 3. Length of cycle (shorter is better)
17 In this context “species” refers to common names, some of which encompass more than one taxonomic species
25

2.5.2. Activities towards Objective 2: Information, knowledge and skills transfer
“To transfer effectively resulting information, knowledge and skills (as appropriate) to local, national and international stakeholders
2.5.2.1. Introduction While recognising its role as a pilot exercise, it was of great importance that the pilot study allowed its partners to gain maximum developmental benefit from the various activities undertaken. The means by which this was achieved are outlined below.
2.5.2.2. Collaboration between the study partners Due to the short duration of the study, efforts were focused on:
• Building GFC capacity by involving its two assigned technical officers in all activities
• Interacting with ISLA and focusing on explaining/discussing the approach and
methods used, rather than on providing training. Emphasis was placed on ensuring ISLA members contributed their knowledge to the study (supplementing minimal data with local knowledge) and in providing them with a clear explanation and demonstration of the methods used. However, within the time available it was not possible to carry out training in how to use the modelling approach. Literature on Community Forestry Management was provided for the ISLA and general advice given on harnessing further support for ISLA initiatives. Two factors were found to largely determine the extent to which this objective could be realised:
• Time: the majority of the study had to be conducted within a fortnight; this placed high demands on the GFC officers and ISLA members participating in the study. For both of these parties the study had to be accomplished along with a large number of competing tasks. A steep learning curve was required for the GFC/FRP team, particularly since the MYRLIN software was still largely untested and undocumented at the time of the study.
• Community capacity: it was not feasible to train members of the association in
the technical aspects of the vegetation mapping/data analysis, nor the particular computing applications and methods used.
To compensate for these factors, two additional means were devised to maximise the effective transfer of useful information, knowledge and skills between the study partners:
• A national workshop was held by GFC and the FRP in March 2002, at which the studies were presented and discussed by a wide range of stakeholders;
• Documents, data files and software developed/applied in the study were
made easily available by means of a MYRLIN CD
26
2.5.3. Activities towards Objective 3: Applicability to Guyana
“To provide an initial assessment of the applicability of the two modelling approaches being used, both for Guyana and for other tropical countries”
2.5.3.1. Introduction An important aspect of the study was to assess how well the modelling approaches were likely to meet the on-going needs of Guyanese stakeholders. As stated earlier, yield modelling in the ISLA study was carried out using static inventory data only and so had to rely on use of the MYRLIN framework alone.
2.5.3.2. Activities A record was kept of the main technical, institutional and other issues affecting the potential of the MYRLIN software to be used for estimating sustained yields in Guyana. These points are discussed in the following sections and conclusions are drawn regarding the possible future role for the MYRLIN toolkit in Guyana.
2.6. Results and findings
2.6.1. Sustained Yield estimation Based on the above stages, the following table summarises, for a 60 year prediction period: a) whether, and the extent to which, the final commercial standing volume matched that at the start of the runs, b) the total yield achieved under each harvesting scenario and c) an indication of the trend in AAC at the end of the period. The first of these criteria was used to indicate the overall sustainability of each harvesting scenario, the other criteria being applied to gain further insights into each apparently sustainable option. All of the MYRLIN runs summarised below are available for closer scrutiny on the MYRLIN CD.
27

Table 10 Summary of results against the sustainability criteria Indicative commercial timber yields
Using MYRLIN-derived values for increment and mortality
Using PSP-derived values
Management Scenario
Felling cycle (years)
Is the initial commercial stock maintained over the 60 years?18
Total yield (m3/ha) over 60 years
General trend in AAC and commercial volume @ yr 60
Is the initial commercial stock maintained over the 60 years?
Total yield (m3/ha) over 60 years
General trend in AAC and commercial volume @ yr 60
a) 33% harvest: 20 NO (55%) 30.2 Declining NO (97%) 39.5 Stable 40 NO (79%) 19.4 Declining YES (139%) 26.1 Rising
35cm minimum dbh
60 NO (93%) 13.7 Stable YES (166%) 18.0 Rising
20 NO (72%) 16.7 Declining YES (125%) 21.1 Rising 40 NO (98%) 10.4 Stable YES (167%) 13.5 Rising
55cm minimum dbh
60 YES (113%) 7.2 Stable YES (193%) 9.1 Rising
b) 67% harvest: 20 NO (26%) 46.1 Stable NO (45%) 58.9 Stable 40 NO (47%) 35.2 Declining NO (80%) 47.1 Stable
35cm minimum dbh
60 NO (64%) 27.3 Declining YES (113%) 36.3 Rising
20 NO (37%) 26.3 Stable NO (65%) 32.6 Rising 40 NO (62%) 19.3 Declining YES (106%) 24.9 Rising
55cm minimum dbh
60 NO (82%) 14.4 Declining YES (143%) 18.5 Rising
b) 100% harvest: 20 NO (15%) 55.0 Stable NO (25%) 68.1 Stable 40 NO (25%) 48.0 Stable NO (42%) 62.8 Stable
35cm minimum dbh
60 NO (38%) 40.9 Declining NO (70%) 64.0 Declining
20 NO (21%) 31.6 Stable NO (39%) 38.4 Rising 40 NO (36%) 26.7 Declining NO (62%) 33.9 Stable
55cm minimum dbh
60 NO (54%) 21.6 Declining NO (98%) 27.5 Stable
In the above table, the most promising scenarios are highlighted in bold italics, based on the criteria set out in the previous section (sustained commercial stock, highest volume, shortest cycle). Several borderline results where yield was over 95% stable are included in these. The mean annual harvesting area was calculated under each logging cycle as follows:
18 The percentages shown in this column represent final standing commercial volume (at year 60) expressed as a percentage of its original value (at year 0). Therefore a figure less than 100% indicates that standing commercial volume has decreased over the 60 year period, a figure above 100% showing that it has increased.
28

Table 11 Mean annual harvesting areas (Gross and Net) under each harvesting cycle
Gross ha/yr Net ha/yr
Forest Type Gross area (ha)
Net area (ha)19 20 40 60 20 40 60
Mixed Forest (Brown Sand) 14752 11064 738 369 246 553 277 184Mixed Forest (White Sand) 10322 7742 516 258 172 387 194 129Total 25074 18806 1254 627 418 940 470 313
It is immediately apparent from Table 10 above that the simulations based on the PSP-derived information predicted considerably higher yields than those derived from MYRLIN #2 only). Though one would expect estimates based on PSP measurements to be more reliable than those generated by the MYRLIN #2 regression process, it must be remembered that the PSP information used is pooled from locations further to the west (the majority of plots being in the Barama Concession), where higher rainfall and forest productivity are to be expected. Simulations based on MYRLIN #2 estimates for growth and mortality, indicated that a polycyclic management system holds the best prospects for achieving sustained yields. This could be achieved by removing a third of commercial volume (trees 35cm +) every sixty years, or of trees 55 cm and above every 40 years (with the Wallaba species harvested at 35 cm and above). The following figures were produced by MYRLIN #3 under these scenarios:
19 Estimated as 75% of the gross area on account of localized areas of difficult terrain and poor accessibility.
29

Figure 6 MYRLIN predictions based on removing 33% of commercial volume (trees 35cm +) on a 60 year felling cycle20
Commercial volume production per average hectare of productive forest
-
5
10
15
20
25
30
35
40
0 2 4 6 8 10 12 14 16 18 20 22 24 26 28 30 32 34 36 38 40 42 44 46 48 50 52 54 56 58 60
Time period (years)
Com
mer
cial
vol
ume
(m3)
0.000
0.050
0.100
0.150
0.200
0.250
0.300
Annu
al h
arve
sted
vol
ume
(m3/
ha/y
r)
Standing Harvest AAC
The second scenario, below, comes very close to achieving a sustained yield as defined in this report.
Figure 7 MYRLIN predictions based on removing 33% of commercial volume (trees 55cm +) on a 40 year felling cycle
Commercial volume production per average hectare of productive forest
-
2
4
6
8
10
12
14
16
18
0 2 4 6 8 10 12 14 16 18 20 22 24 26 28 30 32 34 36 38 40 42 44 46 48 50 52 54 56 58 60
Time period (years)
Com
mer
cial
vol
ume
(m3)
0.000
0.050
0.100
0.150
0.200
0.250
Annu
al h
arve
sted
vol
ume
(m3/
ha/y
r)
Standing Harvest AAC
The fluctuations of the AAC and Harvest lines arise from differences in the productivity and area of the two forest types being modelled.
20 In Figure 6 to Figure 8 the y-values for the commercial standing stock and the annual harvest per ha can be read from the left hand axis and the AAC is read from the right hand axis. The harvest figures represent the actual stock harvested in any given year and are very close to the AAC figures (please refer to the actual data on the accompanying CD for further details).
30

A greater number of sustainable scenarios was indicated by the MYRLIN #3 runs that used PSP-derived estimates for growth and mortality. The scenario producing the highest sustained yield was the one where 67% of commercial volume (trees 35cm and above) was removed on a 60 year cycle, as shown in the figure below.
Figure 8 MYRLIN predictions based on removing 67% of commercial volume (trees 35cm +) on a 60 year felling cycle
Commercial volume production per average hectare of productive forest
-
5
10
15
20
25
30
35
40
45
0 2 4 6 8 10 12 14 16 18 20 22 24 26 28 30 32 34 36 38 40 42 44 46 48 50 52 54 56 58 60
Time period (years)
Com
mer
cial
vol
ume
(m3)
0.000
0.100
0.200
0.300
0.400
0.500
0.600
0.700
0.800
0.900
Annu
al h
arve
sted
vol
ume
(m3/
ha/y
r)
Standing Harvest AAC
Harvesting a lower proportion of available commercial stock at each harvest tended to lead to an accumulation of timber (as well as lower yields), giving rise to a series of less economically viable options that nonetheless met the study’s sustainability criteria. Interestingly, both sets of runs indicated that a 100% harvest of commercial stock cannot produce sustained yields on a 60 year cycle (though a PSP-derived run that harvested trees above 55cm came very close to doing so). This observation tends to support the most recent GFC Management Guidelines, which limit yield to 20 m3/ha over a cycle of this length. As MYRLIN is not presently set up to allow definition of maximum yield in terms of volume (i.e. cubic metres), this GFC harvesting guideline could not be exactly represented by the model. Due to the origin of the inventory data used, the study’s scope was limited to gaining practical experience in applying MYRLIN with a particular Guyanese situation in mind. New data are required from the main forest types within the ISLA area before a relevant and reliable analysis can be carried out. However, once these data are available, it is anticipated that the process described in this report can be referred to as a stage in planning analysis and in interpreting results.
As stated above, a feature of the PSP-derived values for diameter increment and annual mortality (used for comparison) is that they are based on pooled data from both Pibiri and BCL (most plots being at the latter location). This would tend to lead to over-estimates, due to the higher rates of productivity shown by the BCL forests (Phillips 2001c). More representative values for the ISLA concession could almost certainly be derived for the prevalent species from the Pibiri PSPs alone.
31

The proportion of defective stems within the stand was a critical determinant of the yield predicted from the first and subsequent harvests. This is likely to have been underestimated by the IFP forest inventory crews, most of whom did not have practical experience of commercial timber harvesting. Moreover, this defect rate (as well as the mortality rate) can be expected to rise after the first harvest (due to harvesting damage), an effect not allowed for in the model (this was one of the grounds for limiting the prediction period to 60 years). Finally, from the observations of the study team, the general form height of 10.2 estimated by Alder (2001) seemed high for the merchantable stems seen during the field visit. This is an important aspect in need of further investigation if yield prediction models are to produce useful results in Guyana. The low recovery rate for chain-sawn lumber must also be taken into account when converting these gross volumes into predicted volumes of sawn lumber; this rate is estimated to be as low as 10 – 15% (Grisley 1998). In conclusion, the initial analysis described above has helped to develop a basic methodology and has yielded some interesting and reasonable preliminary results, but these now need to be examined closely and taken further on the basis of consensus between the study partners. Again it is emphasised that the initial results cannot be used to guide forest management planning in the ISLA concession. New inventory data from within the concession will be needed for this purpose.
2.6.2. Information, Knowledge and Skills Transfer
Table 12 Transfer of knowledge and skills Study Partner
Information Knowledge Skills
GFC (two officers, supported by FRIU)
Indicative sustained yield estimates for the main forest types (based on a nearby forest area)
Improved knowledge of the process for carrying out a Forest Resource Assessment using all available existing data and applying this to sustained yield harvest planning.
Practical application of forest data to sustained yield management planning, using MYRLIN, supported by use of Excel, Access and ArcView. Experience in running a national workshop
ISLA (Committee and individual members).
Forest Resources map. Species utilization profile. Indicative sustained yield estimates for the main forest types. Published information on community forest management.
Insights into the approach used and role of the pilot study in the process of bringing the ISLA area under regulated forest management.
Skills in transferring personal experience information to maps.
32

DFID/FRP
Pilot study report of use as a reference for projects elsewhere involved in sustainable yield estimation.
Case study findings and recommendations.
(FRP team developed skills as per participating GFC staff).
University of Guyana (Forestry Lecturers and students).
Copy of report and CD, including copies of datasets used. Discussions held with DFIDSP Forestry Education and Training Adviser on the application and its potential as a teaching tool.
Half-day presentation seminar given to UG and GSA lecturers and students.
MYRLIN CD will provide the ideal basis for practical sessions in using the modelling applications as part of the new UG curriculum.
Other focus groups (Forestry companies, Govt. bodies, NGOs)
Information on the studies through the workshop
Insights gained into yield regulation issues and methods through workshop
A primary output under this objective was that the two main GFC officers participating in the study developed skills in applying MYRLIN to planning sustained yield management across a concession area. GFC is now in a position to assist the ISLA if the decision is taken to use MYRLIN to process data from the ISLA’s planned management inventory and to assist other parties involved in similar work.
2.6.3. Applicability to Guyana Findings under this objective are summarised in the form of a “SWOT analysis”. This looks at the application of MYRLIN in relation to the study in terms of its main internal attributes – its strengths and weaknesses – along with the opportunities and threats, i.e. the main external factors with a bearing on its success.
2.6.3.1. Strengths Comprehensibility. It is relatively simple to understand the way MYRLIN works. The system is now well documented through its website www.myrlin.org Simplicity. Stand tabling workbook (MYRLIN #1) provides a simple, yet flexible, means for basic analysis of inventory data. Immediate usefulness. MYRLIN is useful for providing estimates of diameter increment and mortality for species not present in the PSPs – i.e. use PSP values where these exist. It can rapidly provide initial analysis of sustained yield management options while more sophisticated measures are established (or if they are not). Capacity building. Useful as a training tool. Flexibility. Specialist programmers, however, should find the VBA code easy to follow, especially as the code itself is well annotated, though few users are likely to take advantage of the scope to interpret/edit the Visual Basic macros. Support. Good level of technical support from developer/programmer.
33

2.6.3.2. Weaknesses User-friendliness. Ease of use could be improved, particularly MYRLIN #2. Programme bugs were regularly encountered with the versions used, though most of these were addressed by the programmer. Minimum training requirement. MYRLIN requires an experienced graduate forester to understand it and supervise its use – the application could therefore not be learned and applied by forestry communities (such as ISLA) without substantial assistance. Scope for management scenarios. At present the MYRLIN #3 application is not easy to use for modelling the outcomes of different yield regulation prescriptions. In particular, adding user-defined parameter settings for minimum and maximum harvest would greatly increase the application’s utlility.
2.6.3.3. Opportunities Interim sustained yield analysis. MYRLIN could be very useful in Guyana for a follow- up study aimed at filling current gaps in species dynamic information using combined static inventory data from all timber producing areas. These values can be incorporated into the GFC’s application GEMFORM (Guyana Empirical Forest Management Model) and thereby move GFC closer to being able to estimate reasonably precise sustainable timber harvesting levels at the concession-level throughout most of the accessible State Forest Area. Cooperative development. Numerous additional features could be added to the MYRLIN application to increase its utility, based on the circumstances and preferences of individual users. Potentially any other programmers adding to the core MYRLIN functions could be encouraged to contribute any additional modules they develop to the MYRLIN web-site for other users to download. Role of website. The MYRLIN web-site will greatly facilitate use of the application, as well as contact with/between users (see also previous point). Assessing confidence in data and results. One particular core function that should be added to MYRLIN #1 is a summary statistical report (e.g. at the foot of each stand table). This should display the Mean, Sampling Error, Standard Error and confidence range on the key variable shown in the table (preferably by stratum). This would provide an easy means to scrutinise inventory data before they are used as the basis for projections and inferences. A minimum standard (such as “maximum Sampling Error on commercial BA of 25%”) could usefully be defined for data-sets considered safe for MYRLIN projections. Some means for quantifying confidence in predictions should be developed, if possible.
2.6.3.4. Threats On-going support. MYRLIN requires further development (and promotion) if it is to get fully established as a workable tool for countries with limited information (by implication, these are often countries with low technical capacity). A modest level of continued support is therefore required if the application is to become firmly established.
34

2.7. Conclusions and recommended next steps
2.7.1. What did the study achieve? Results: The study provided a chance to work through the MYRLIN process with a real-life situation in mind, but the results produced must not be given too much weight due to the origin of the static inventory data. The approach can, however, be re-applied once the ISLA has its own inventory data. The production of a detailed vegetation map was an important output from the study that will be of immediate use to the ISLA in planning their inventory and on-going operations. Capacity building: Perhaps the most important element of the study was the involvement of two senior GFC technical officers in all stages of its design, implementation and presentation. This intensive period of activity provided useful synergies with GFC’s other current activities relating to yield regulation and paves the way for further progress in this critical area of its mandate (which now explicitly encompasses supporting community forestry ventures). Although several useful meetings were held with the ISLA committee (and individual members) it was not feasible to train members in the various technical methods used in the study. Assessing the potential role of MYRLIN: The study provided a useful means for gaining practical insights into the application of MYRLIN from technical and institutional perspectives. These should be taken into account when planning further projects/ activities in this area.
2.7.2. Recommended next steps The following paragraphs draw together some of the on-going issues identified in the study with regard to each of the main partners and suggest some possible next steps. It is recognised that due to the completion of the present studies, most of the following points present options for GFC and to any agencies/future projects seeking to provide assistance in this area.
2.7.2.1. Ituni Small Loggers Association If considered useful, the approach developed in this study could be repeated using data from the ISLA’s planned strategic inventory. This inventory should be designed in such a way as to place samples within each of the main mixed forest strata identified in this study; the vegetation map produced is ideal for planning this exercise. Of particular importance is the need to sample the significant area of commercial forest on the brown lateritic soils in the southern part of the area. This is likely to represent a new stratum for subsequent planning purposes. The foundations for this next step are in place, in the form of the following:
1. GFC’s Forest Resource Appraisal manual, which covers the GFC inventory procedure suitable for the new exercise.
2. ISLA vegetation map and preliminary forest resource summary. 3. Definition of present species utilisation groups by the ISLA.
4. Skills within FRMD in using MYRLIN to analyse the data.
35

Both the implementation of this inventory and the processing of the resulting data will require assistance from GFC and/or a private consultant. In either case, to ensure consistency with existing software applications and with other GFC inventory data, the Association should be encouraged to use the current GFC strategic forest inventory procedure. As demonstrated in this study, MYRLIN can be used for summarising the data in stand tables before carrying out any desired modelling work. It is emphasised that the two GFC officers involved in the study are the only people able to carry out this work in Guyana at present. However, it is more likely that the GEMFORM software will be used for this purpose (see next section). Further requests for information and training on managing forests as a cooperative association (as aired by ISLA members) can be handled by GFC if resources permit. Opportunities for continued support in this area may exist through the current PROFOR and TFF initiatives.
2.7.2.2. Guyana Forestry Commission From GFC’s perspective MYRLIN’s role is clear from the preceding paragraphs. Its main potential uses are to:
• Fill gaps in existing dynamic information for various tree species by the judicious use of existing national static inventory data. Though this draft information may be replaced at some point in the future, it will play a very useful role until such time.
• Serve as a training tool for staff involved/ interested in the practicalities of
growth and yield estimation and in methods for data processing/management using Excel.
Should the GFC’s GEMFORM software be completed in 2002 (see Alder 2001), this will effectively supersede MYRLIN for most GFC purposes, its advantages being:
1. It is a more powerful (and user-friendly) application with analysis options geared towards the needs of GFC and the forestry sector (including statistical analysis of inventory results).
2. The model used is more sophisticated and is based on the results of dynamic
studies at Pibiri and BCL. However, there is an important synergy between the applications, since GEMFORM should incorporate increment and mortality estimates developed by MYRLIN for those species not covered by the PSP data. With regard to this existing PSP-derived information on species dynamics, the analysis carried out by Alder (2000) should be re-worked for each data set (and hence geographical area) separately. Though Alder’s pooled values are still of value as the best “national averages,” the separate sets of values are likely to produce better predictions for forests close to one of the PSP sites.
36

To prepare for further use of MYRLIN in areas far from existing PSPs, it would be useful for GFC to compile information on ecological “mode”21 for as many species as possible, initially concentrating efforts on commercial species. It is anticipated that the skills and methodology developed during this study (and to a lesser extent its tentative results) will feed effectively into the GFC Yield regulation project in 2002.
2.7.2.3. DFID Forest Research Programme At present the MYRLIN toolkit provides a relatively accessible framework for interactive data analysis. It is a useful tool for:
• Filling gaps in information on forest dynamics in countries such as Guyana by judicious use of static inventory data – further work warranted in getting this done.
• Developing a practical understanding of one approach to growth and yield
estimation and of the mechanics for applying this using MS Excel.
• Grappling with the question of what information is really needed in a given situation in order to make reliable yield predictions that can lead to defining sustainable practices.
• Using existing data wisely to generate appropriate outputs, geared explicitly
to the needs of decision makers.
By doing so, the use of MYRLIN is seen as a worthwhile stage in the process of:
• Designing and developing software more appropriate/specific to a given situation.
• Developing a high level of competency in using Excel for natural resource
data management and analysis, along with the effective presentation of outputs.
Based on observations made during this study the usefulness of MYRLIN to a particular country is most greatly influenced by:
1. Demand for yield regulation from government, private and civil sector (high demand, greater general relevance of MYRLIN)
2. Amount of static and dynamic data available (static data essential; MYRLIN is
more relevant where less dynamic data are available)
3. Capacity of forest service and private sector to understand and apply computer-based growth and yield models (MYRLIN is suited to intermediate capacity – it requires graduate level foresters and modest computer facilities, but is less likely to be relevant where high level of skills and technology exist).
21 A simple classification such as Pioneer/ Light Demanding/ Shade Tolerant/ Understorey/ Unknown would be adequate for this purpose. This information is stored in the main species worksheet in a separate field.
37

On-going contact with those countries involved in the workshop will be an important means to assess whether any have subsequently used the MYRLIN application (or parts of it) and to establish/document any need for additional facilitation.
2.8. Summary of Study Outputs and their delivery The final outputs from this pilot study are as follows: 1. A published integrated report on the studies (covering both studies and the workshop) 2. A comprehensive MYRLIN CD containing:
• A separate report for each study and the workshop; • All background documents on FRPs 7278 and 6915 (Project Memoranda,
BTORs, technical papers); • A copy of the MYRLIN toolbox22, including the final data-sets used for the
studies and the latest versions of documentation on the application; • Selected photographs taken during the studies.
3. Copies of the main documents posted on the MYRLIN and SYMFOR websites. 4. A 2-day workshop held in March 2002, during which the preliminary findings of the studies were presented and discussed prior to their completion. In addition, a half-day seminar was presented to students and lecturers from the Guyana School of Agriculture and University of Guyana. A report on the workshop is included as a fourth section of this document, and as a separate document on the MYRLIN CD.
22 Please refer to the SYMFOR website for a copy of the software and documentation, www.symfor.org .
38

2.9. Photographs taken by Mr Gavin Nicol during the ISLA Case Study
Compiling information on species utilisation with ISLA members
Discussion with ISLA over draft forest resources map
Forest Monitoring Officer identifying recently logged areas
Forest Officer checking an under-sized stump in ISLA area
GFC (right) and ISLA members updating the draft forest resources map
GFC Checking wasted logs during ISLA field visit
39

ISLA chainsaw operator converting log into lumber
ISLA checking forest types on ground against map using GPS
ISLA member converting log into lumber
Low Dakama forest
Mapping exercise with ISLA members Recently burned low Dakama forest
40

Mixed forest on brown sand
Mixed forest on white sand Note that all of the above photographs were taken by Gavin Nicol (uless otherwise stated in the title. All are available for use free of charge for non-commercial purposes, providing that the photographer is acknowledged if any are published or otherwise distributed (including web-site use). The photographs above can be found in the following folder on the MYRLIN CD: Pilot Studies/Pilot Study Data/ISLA Study/ISLA Data/ISLA Photos. High resolution versions of the photographs can be requested for appropriate use. Email [email protected].
41

SECTION 3. The Barama Company Study This section describes the pilot study carried out in collaboration with the Barama Company Limited, a major forest operator based in North West Guyana. This study primarily used the SYMFOR growth and yield modelling framework developed under FRP project R6915, but also included an analysis using the MYRLIN toolkit developed under FRP project R7278.
3.1. Summary of achievements and possible next steps
The pilot study was a successful collaboration between GFC, the Barama Company Limited and the UK project team. Other stakeholders were also included by holding a national workshop before the studies were completed. GFC capacity was increased in the area of forest growth and yield estimation, providing two members of staff with the skills and tools to carry out further work of this kind using other datasets as required. The outputs from the study, along with copies of the modelling tools, data sets and background documentation have been placed on a CD to make them as accessible as possible to all stakeholder groups. This will be of particular use to the educational and training sector. Possible next steps include:
1. GFC continues to engage with BCL over determining sustainable harvesting options for the main forest types being worked by the company, encouraging the latter to collect adequate new information to inform this process as it moves into new harvesting areas. GFC might consider entering into an agreement with BCL over the maintenance of existing PSPs. (GFC/BCL)
2. Further application of SYMFOR could take place by GFC as part of this
process. Use could also be made of the ecological model calibrated using the Pibiri PSP data, which should provide useful indications of sustainable harvesting options for the concession of Demerara Timbers Limited. (GFC and SYMFOR developers).
3. The DFID Forestry Research Programme should continue dialogue with
GFC over the on-going uptake and application of the SYMFOR and MYRLIN models, providing (and/or assisting with the process for identifying) continued support in any areas of particular need that are highlighted by GFC. (FRP).
42

3.2. Brief Description of the Barama Company Limited (BCL)
The Barama Company Limited (BCL) is a large Malaysian/South Korean-owned timber producer that commenced its forest operations in Guyana in 1993. It operates the country’s largest forest concession area (Timber Sales Agreement (TSA) 04/91), comprising approximately 1.6 million hectares in North-western Guyana. Since commencing operations, the company has worked the North-West portion of the concession from its first operational base in the village of Port Kaituma. The plywood mill is located on the East Bank Demerara (requiring a round trip of 580 Km for the company’s log barges), these long extraction distances have affected profitability. However, this situation is set to change as operations are moving to the more accessible Eastern portion of the concession, which can now be reached by road from the Essequibo River. To date, the majority of logs have been harvested for plywood production in the company’s mill, though sawn lumber and logs have also been exported. Since the end of the 1990’s, a combination of depressed international markets, competition from other plywood producing countries (particularly Indonesia and Brazil) and high production costs have presented challenges to the company. BCL’s Forest Management Plan for 2000/2001 reported that the company’s monthly harvest was insufficient to sustain the plywood mill (which requires about 18,000 m3 of logs per month). To compensate for this shortfall, the company has since been purchasing logs from other timber producers. BCL originally estimated an Annual Allowable Cut of 1,250,000 m3, based on a 25-year felling cycle. On this basis, the company had aimed to cover 45,000 hectares annually. However, the latest management plan (BCL 2001) reports that the company has in fact harvested a (net) total area of 145,000 hectares in the 8 years since its operations began, representing an average annual harvest of 26,000 hectares. Based on preliminary indications of the growth rate of Baromalli (which has accounted for 80 – 90% of the company’s production to date), BCL and GFC have recently agreed that a cutting cycle of 40 years shows prospects for producing sustained yields. This cycle also coincides with the estimated time in which BCL will be able to harvest the entire concession, based on progress to date (Forest Management Plan 1999, page 6). BCL records indicate that the average extraction from 1993 to 1999 had been about 8.2 m3/ha. No reliable figures were available for annual production at the time of this report. Though a lack of reconnaissance surveys has tended to constrain forward planning, considerable investment has been made by BCL in a successful PSP programme. BCL is now keen to capitalise on this PSP data to determine how soon they can return to harvest those blocks worked when operations began in the early 1990’s. This is seen as a means to offset some of the high cost of accessing new parts of this extensive and remote concession (bearing in mind that in the next 10 years the harvesting areas will be perhaps 100 km from the company’s new Cuyuni base). This
43

is an expensive activity given the lack of present infrastructure and is also a somewhat risky undertaking given the lack of reconnaissance inventory information.
Figure 9 Map of Guyana Showing BCL concession
CuyuniRiver
Mazaruni
RiverEssequibo
River
Demerara
Berbice
Corentyne
River
River
River
BARAMA
Map showing locationof Barama Concession.
N
Map Data Source : Guyana Forestry Commission.Base Map Source : NRMP/GTZ.Map Produced by : Guyana Forestry Comm. (FRIU)Date Printed : 30th Nov, 2001.
3.2.1. Forest Research BCL contracted the UK-based research organisation ECTF in 1992 to design and implement a range of research and monitoring activities. These included the establishment of a BCL Forest Research Section, responsible for the establishment and re-measurement of Permanent Sample Plots (PSP’s) and Experiment plots. The research programme was designed to assist the company in moving towards demonstrable sustainable forest management, focussing on improving estimates of the allowable cut and logging cycle through:
• Post harvest growth and yield studies • Measurement of the impact of canopy gap size on the regeneration and the
development of commercial species; • Evaluation of the cost and benefit of silvicultural interventions.
44

In the second quarter of 2001 the services of ECTF were terminated and the BCL research team was reduced from five persons to one. At the time when this pilot study was conducted the future of BCL’s research programme was somewhat unclear.
3.2.2. The pilot study MacQueen (2001) identified Barama as an example of a large-scale company with perhaps the greatest potential to use and interpret the results of growth and yield models and recommended that the present pilot study be undertaken in partnership with the company. During the study it was noted that, though the company no longer had the in-house capacity to address these technical activities itself, there was a definite willingness on the part of senior managers to obtain some useful information to inform the company’s forest management strategy. The table below sets out the needs expressed by BCL (based on MacQueen, 2001). Following further discussions between the study partners, this list was reduced somewhat to cater only for those elements covered by the scope of this study.
Table 13 Addressing the needs expressed by BCL Outputs desired by BCL
Activities undertaken to meet these needs
Information on: Distribution of most productive forest types and their productivity
Synthesise existing information – forest inventory data, forest type maps, extent of logged areas
Likely recovery period after harvesting – how long before logged areas can be re-opened? Is the logging intensity/cycle set by GFC reasonable?
Calibrate SYMFOR ecological model using PSP data Define appropriate management models based on the latest GFC Code of Practice and any specific scenarios proposed by BCL Use SYMFOR to explore sustained yield harvesting options under these assumptions, including recovery period. It is emphasised that the results will only be applicable to forests in the vicinity of those areas sampled Compare results with an equivalent analysis using MYRLIN and/or the GFC stand projection model Work as interactively as possible with BCL, to ensure that resulting information, knowledge and skills are effectively transferred
45

3.3. Brief Profile of the BCL Concession The Barama concession is located in one of the wettest areas of Guyana, with a mean rainfall of around 2603 mm/yr recorded at Port Kaituma. There are two wet seasons; one from May to July and the other from November to January, with February, March and April being the driest months (averaging 100mm or less per month). However, as shown by the chart below, there are wide variations in the precipitation that can be expected in any given month.
Figure 10 Port Kaituma Rainfall Monthly Rainfall at Port Kaituma: 1988 -1998
600
500
200
300
400 Precipitation (mm
)
MinMaxAverage
100
0 Jan Feb April November December JulyMay June SeptemberMarch August October
Month
The pre-Cambrian plateau of the Guiana Shield underlies almost all the concession, the major geological formations being granite and greenstone (ECTF, 1996). Three main rivers flow through the concession; the Cuyuni, the Barima and the Barama. The concession is comprised of mainly flat and undulating lowlands, at no point exceeding 240m in altitude. A national soil survey conducted by the FAO (1966) showed a close relationship between soil type and topography in the main physiographic regions within the concession, which are the following: -The pre-Cambrian crystalline shield uplands, (these underlie most of the concession). -Small areas of lowland floodplain along major rivers (the Barima and Barama). -Some areas of mountains and high plateau. -Small areas of white sands plateau. About 60 % of the concession has deeply weathered and highly leached brown sandy clay and gravelly reddish-brown lateritic clays of low fertility. Found on mostly flat undulating land, but also on hilly terrain common in the west of the concession.
46

About 35 % of the concession comprises well-drained brown sandy soils of low fertility. These are found on gently to moderately rolling topography mainly found in a narrow band along the Cuyuni River and in the Barima and Barama headwaters. The remaining 5 % consists of deep, sterile, excessively or poorly drained white sands on gentle slopes and brown sandy gravel soils on steep slopes. Most of soil types are highly leached, nutrient poor clay soils, susceptible to compaction and highly susceptible to erosion when cleared of vegetation cover. Deep, heavy clays characterize the majority of the operational area. The distribution and breakdown of the main vegetation types found in the concession are shown in the map and table below. GFC’s classification is used (see ter Steege, 2001), based on work carried out with assistance from the FAO in the late 1960’s/early 1970’s. As can be seen from the type descriptions, this classification is based on a combination of the characteristics of forest canopy and topographic/ hydrological features, as interpreted from aerial photographs.
Table 14 Land status table Cover type Area (ha) % of total
concession Productive for forestry
(Y/N)
Current use
Comments
1 Mixed forest on undulating broken hilly terrain
1,219,108 73 Y Timber extraction
Highly productive forest, dominated by Baromalli etc
1(c) Mixed forest on deeply dissected terrain
250,501 15 N Nil Area not accessible
1(h) Mixed forest on steep hills
50,100 3 Y Timber Area not accessible also poor stocking of Baromalli
1(b) Mixed forest on flat terrain along rivers
25,050 1.5 Y Timber Highly productive area
3(a) Mora forest on flat, seasonal flooded riverine terrain
116,900 7 N Species presently harvested for testing purpose
Presently non-productive forest, either permanently or seasonally inoperable
2 (a) Wallaba forest on white sand ridges
8350 0.5 Y Nil Potentially productive forest
Compound 170 - N Quarry 6 locations
within concession area
-
N Material is used for road construction
Figures not available for size of area
Total 1,670,012 100 - - -
47

Figure 11 Map showing vegetation types and known PSP locations in the BCL concession
Vegetation Map of BaramaShowing PSP Locations
N
5 0 5 10 15 20 Kilometer s
Vegetation Types1 Mixed forest, undulating to hilly1b Mixed forest, flat to undulating1c Mixed forest, deeply dissected1h high hills1l Clump walaba1m small crowned, f lat to undulating1p Low small -stemmed on steep high hills2a Wallaba3 low swamp3b Mora3e Swamp on pegasseclearings os open swamp
Barama PSP Posit ions
Map Data Source : Guyana Forestry Commission Regional Vegetation Map, 2001.Map produced by : Guyana Forestry Comm. (FRIU)Date printed : 30th November, 2001.
##
# ####
#
## ##
##
## ##
#
# ##
#
##
#
#
#
#
#
#
Section 3.6, below, provides information on the composition of the main forest type (Mixed Forest Type 1).
48

3.4. The SYMFOR growth and yield modelling framework
A brief description of the SYMFOR modelling framework is given at this point, since, as indicated in Table 13, above, its use was an integral part of this study. The following is adapted from the SYMFOR website http://www.symfor.org, which can be consulted for more detailed information on all aspects of the SYMFOR modelling framework and related FRP activities. SYMFOR (Silviculture and Yield Modelling for Tropical Forests) is a tool for simulating the effects of silviculture on the growth, ecology and future yield of tropical forests. The framework is made up of models of natural forest processes and user defined management systems. It is a tool designed for people who want to understand the likely effects of a particular forest management option, or to compare the effects of several management alternatives. This may include policy makers, certification bodies, forest concession holders, NGOs and universities. It was first designed to be used for the management of natural forests in Indonesia. The SYMFOR modelling process uses data from permanent sample plots (PSPs) and allows the user to select management strategies. It then predicts the growth of the forest for a desired number of years into the future, harvesting it in a manner determined by the user. In summary:
1. An ecological model characterises the growth, mortality and regeneration of all trees in the forest.
2. A management model simulates the effects of various management options
on the forest. The user specifies when to log the forest, which species are utilised and the minimum log size. Other criteria include the skid-trail width, felling direction and the planning of skid-trail routes.
Typically SYMFOR is used to compare the effects of two or more alternative management options on the forest and the timber yield for such purposes as:
• Development and evaluation of management guidelines (policy). • Education (Forestry and Ecology).
• Forest management case studies.
The pilot study described here embraces all three of the above areas. The next section provides details of how SYMFOR was used to achieve the pilot study’s objectives.
49

3.5. Methodology for the study This section describes the methodology used for the pilot study conducted in collaboration with BCL, by objective and activity.
3.5.1. Activities towards Objective 1: Sustainable Yield estimation
“To explore methods for estimating sustainable timber yields in an industrial… …. forestry concession in Guyana, in response to demand from the Guyana Forestry Commission and forest sector”.
3.5.1.1. Introduction As indicated by the above, the SYMFOR framework was well suited to provide preliminary answers to the questions posed in the BCL case study - the availability of data on the initial composition and dynamics of the forest, plus management and utilisation practices meant that the necessary ecological and management models could be developed, calibrated and applied.
3.5.1.2. Synthesise existing information GFC’s regional digital forest type map for BCL was used for this study. There was no opportunity to refine this within the scope of this study, particularly as GFC no longer has photographic cover for most of the North West Region. In view of the limited time it was not possible to plot the areas already logged onto this, though large scale maps showing the areas worked over time were examined in the Port Kaituma office and findings were taken into account in the analysis. For the purposes of the study, the most important information to obtain from the maps was the distribution of the BCL PSPs across the main vegetation types in order to make a balanced decision as to which plots to use for the SYMFOR analysis. Positions of those PSPs that have been geo-referenced were therefore projected on the vegetation map (Figure 11 above). 54 PSPs were established between 1992 and 2000, five of which were treated as experimental plots and logged. Of the PSPs established, 38 are believed to still be sufficiently intact/accessible for further measurements, while 16 were destroyed or neglected (including all of the experimental plots). Phillips (2001b) provides a detailed description of the datasets as they stood at the time of this study. From available information (see above), these PSPs were stratified by forest type for analysis purposes. In the case of those PSPs that are not presently georeferenced (and therefore could not be projected onto the vegetation map), forest type was deduced using the BCL master map of PSP locations in Plots in conjunction with the vegetation map. This indicated that all but six of the plots were established in the principal forest type (Type 1 – Mixed forest on undulating broken hilly terrain). The other six were established on Type 1c – Mixed forest on deeply dissected terrain. Only plots from Mixed Forest Type 1 were used for modelling purposes in this study, though the calibration of the ecological model included a small number of plots from Type 1c. To ensure that good quality data were used to initialise the model runs, the PSPs with the least suspected errors were used (see Phillips 2001b), leading to the selection of 12 plots. To ensure that none of these plots had been previously logged,
50

data from their first enumerations were used for initialising the final SYMFOR runs (i.e. the 12 initial plots of forest to be “grown” and “harvested” by the model), Stand tables for the combined 12 PSPs were produced using MYRLIN #123. The summary figures for “Others” and “Totals” seen in the tables (see next section) were added subsequently using standard Excel functions. The GFC (IFP) inventory dataset from 1992 was also accessed. This was a low intensity reconnaissance survey of the limited forest area accessible from Port Kaituma at that time. The main use made of this data was to estimate the proportion of potentially merchantable trees that were defect-free within the BCL forest (in the IFP dataset, trees with a Risk Class of 0). A weighted percentage24 of 67% defect-free trees was calculated and used as a parameter value in both the SYMFOR and MYRLIN runs25.
3.5.1.3. SYMFOR Calibration This was carried out by Dr Paul Phillips in Edinburgh. As part of this process, utilisation information on the species found in the PSPs was provided by the pilot study team for incorporation into the model. A full description of this work is contained in Phillips (2001b), which is contained in the MYRLIN CD.
3.5.1.4. Definition of management models The following two main management scenarios were used as the basis for the calibration of SYMFOR’s management model.
1. Current Code of Practice (COP) (minimum compliance): 35 cm dbh minimum felling diameter, main commercial species, directional felling, planned (branched) skid trails 2. BCL management: For the purposes of this study this differed from the above only in its narrower selection of species for harvest (excluding piling species) and in a higher minimum diameter (55 cm) for all such trees.
The following table sets out the main SYMFOR management model components of relevance to this study and the settings used under each scenario. Those elements in italics were modules and/or parameters that were varied between simulations as part of the study.
23 For information on the MYRLIN model and its components see Section 2.4 above and/or the MYRLIN website: http://www.myrlin.org. 24 To estimate this proportion, each commercial species was weighted by its estimated per-hectare frequency (trees >50cm dbh). This provided an aggregate estimate of the percentage of defect-free merchantable trees in the forest in a manner that accounted for the prevalence of each species (see note below). 25 Though this figure may appear high by national standards, it may be partly explained by the influence of the common commercial species Baromalli, this being of characteristically good form. As can be seen in (in the next section, below), Baromalli accounts for nearly 20% of the Basal Area of trees >= 55cm dbh, even when non-commercial species are included. However, further utilization studies are needed, as this is a critical parameter.
Table 18
51

Table 15 Management models used for running SYMFOR Parameter settings used
Swappable function
Module
Name COP scenario
BCL practices
Optharvesttime Optsimple None N/a N/a Harvest Harvest None N/a N/a Harvesttime Harvesttime First Logging 0 0 LoggingCycle 25, 40, 60 25,40, 60Logselect Select1 Nlogmax 10, 100 10, 100 MaxExtract 20, 500 20, 500 MinExtract 0 0 Logqualify Qualify1 Dbhthreshold
(Utilgrp, Harvest) >=35; utilgrp 2,3 and 4 only
>=55; utilgrp 2 and 4 only
Minquality 0.33 0.33 Felling Directional CutDirection 165 165 Dragdamage Dragdamage1 None N/a N/a Skidprepdamage Skidprepdamage1 Skidprepradius (5) (5) Planskidtrails Branches Accesspointx (50) (50) Accesspointy (0) (0) Joinangle (60) (60) Calcskidcorners Nocorners None N/a N/a Sharpcorners None N/a N/a
Skidtrails Skidstrails1 Skidwidth 3.5m 3.5m Skidtraildamage Skidtraildamage1 Maxdbhdamage 30cm 30cm Damageprob 0.8 0.8 Stripstime No strip modules
activated (including creating and replanting)
N/a N/a N/a
Thinning No thinning modules activated
N/a N/a N/a
Poisoning No poisoning modules activated
N/a N/a N/a
3.5.1.5. SYMFOR Application The multiple run feature of SYMFOR was used to carry out a series of simulations under each of the management scenarios set out above. Ten repeated simulations of each management scenario were carried out on each plot over a period of 201 years. Results (mean stems, volume and basal area) were calculated for each felling cycle tried. In each case the mean annual harvest was calculated. For each management scenario, three separate simulations were conducted – one for each felling cycle. For each scenario and felling cycle two intensities of harvest were carried out - a limited harvest (corresponding with the current Code of Practice) and an unlimited one (where all trees defined as merchantable were felled). This resulted in 12 final output files, each accommodating 10 analysis repetitions of the 12 selected plots.
52

Each of these resulting output files (one per run) was saved as a new Excel file into which two new worksheets were inserted:
1) A worksheet into which were pasted the parameter values used in the run (copied from the SYMFOR file parsilv.txt). This ensured that each output file could be linked to the specific models, modules and parameter settings used.
2) The output data were translated into a new worksheet to create a table summarising the mean yield at each harvest time throughout the run (i.e. averaged across the 12 plots and 10 repetitions), by using Excel’s “Pivot-table” function.
The results from each scenario were then compiled into a single summary table. For each trial management scenario, the following criteria were used as a basis for presenting and interpreting results:
1) Whether the first harvest yield was equalled or exceeded by the second and third (i.e. was it sustained over the simulation period?)26;
2) The total yield volume produced over the 200 year period; 3) Whether the yields achieved at each harvest (“periodic yields”) had
become stable by the latter part of this prediction period.
The application of these three criteria was considered to provide a good indication of which scenarios are likely to produce the highest sustained yield while not appearing to decrease the productive capacity of the forest over a 200-year time span. The team also tried a number of additional, isolated, sensitivity tests while familiarising themselves with setting up management scenarios and running the model:
1) A comparison between predicted yields using directional and non-directional felling;
2) A comparison between predicted yields when using skid-trails of width 3 and 4 m;
3) A comparison between predicted yields using the first and the second enumeration of the 12 selected plots to initialise the model runs.
Though each of the model runs was replicated in the same way as the main simulations, the exact parameter settings for the management model were not identical throughout all of these tests. Therefore, for the purposes of this study they simply served to illustrate (and gain practice in) the kinds of “what if” questions that can be addressed through the management model (rather than to generate any definitive findings).
3.5.1.6. Comparison with an equivalent analysis using MYRLIN
Under this activity, the same tree data used for the SYMFOR initialisation were input to MYRLIN (as 12 plots within a single stratum). As the SYMFOR input files being used no longer held species information for each sample tree (each tree being assigned to a model and utilisation class only), the original species information was returned to the files from the original PSP data files using the unique combination of
26 This followed the general rationale used in GFC’s Silvicultural Surveys (GFC 2001,2002)
53

Plot and Tree number to identify each tree27. This enabled the production of stand tables by main species using MYRLIN #1, as presented in Section 3.6, below. Before yields could be projected in MYRLIN #3, estimates of mortality and increment were generated by MYRLIN #2 for each species. It was assumed that nothing was known about the individual species’ ecology, so no attempt was made to modify the values calculated for annual diameter increment and annual mortality rates (see following table). However, where MYRLIN #2 requires the mean diameter increment of the forest species for the forest as a whole (as an input in the “Model” worksheet), some additional information was used. The mean increment was calculated for the PSPs using the results of Phillips (2001c) for each SYMFOR model group, weighted according to the Basal Area of each group28. This resulted in a value of 0.36 cm/yr. The other input value required - mean D95 for all species - was taken from the “Table” worksheet (57.9 cm, see table below), as calculated by MYRLIN #2 itself from the PSP (Survey 1) dataset. Having input these two values, the following final figures were produced in the “Table” worksheet and were imported into MYRLIN #3 for the remaining analysis:
Table 16 Modelling values calculated by MYRLIN #2 for the main commercial species
Species Scientific name D95 (cm) Dinc (cm/yr) AMR Arisauro Vatairea guianensis 65 0.38 1.7% Aromata Clathotropis spp. 37 0.24 2.0% Baradan Ocotea tomentella 100 0.54 1.6% Baromalli Catostemma spp. 68 0.39 1.7% Bartaballi Ecclinusa guianensis 78 0.44 1.7% bulletwood Manilkara bidentata 99 0.53 1.6% Burada Parinari spp 77 0.43 1.7% coffee mortar Terminalia dichotoma 28 0.20 2.1% Crabwood Carapa guianensis 63 0.37 1.7% Dalli Virola surinamensis 77 0.43 1.7% Duka Tapirira marchandii 49 0.30 1.8% Futui Jacaranda copaia 69 0.39 1.7% haiawaballi Protium neglectum 37 0.24 2.0% Haiariballi Alexa spp. 56 0.33 1.8% Haiawa Protium guianense 58 0.34 1.8% Hububalli Loxopterygium sagottii 88 0.48 1.6% Huruasa Pithecellobium jupunba 130 0.68 1.6% Kabukalli Goupia glabra 80 0.45 1.7% Kairiballi Licania heteromorpha 85 0.47 1.6% Karohoro Schlefflera morototoni 115 0.61 1.6% Kereti Ocotea spp. 62 0.36 1.7%
27 Excel’s VLOOKUP function was used for this purpose 28 To this end, a separate MYRLIN analysis was carried out based on the Phillips (2001c) ecological groups, in order to calculate the appropriate BA weighting factor for each ecological group. This was straight-forward as the ecological group was included as a field in Phillips’ version of the PSP data. The mean increment for each ecological group, as calculated by Phillips (ibid), was then weighted by its prevalence in the stand (using the MYRLIN BA value for each group) to give a final, single mean increment figure for the stand.
54

Kurokai Protium decandrum 58 0.34 1.8% Locust Hymenaea spp. 61 0.36 1.7% Maho Sterculia pruriens 70 0.40 1.7% manni Symphonia globulifera 89 0.49 1.6% monkey pot Lecythis davisii 65 0.38 1.7% purpleheart Peltogyne spp. 32 0.22 2.1% red cedar Cedrela odorata 40 0.26 1.9% shibadan Aspidosperma spp. 54 0.32 1.8% silverballi Ocotea spp. 38 0.25 1.9% simarupa Simarouba amara 50 0.31 1.8% tatabu Diplotropis purpurea 27 0.20 2.2% wadara Couratari spp. 55 0.33 1.8% washiba Tabebuia spp. 56 0.33 1.8% white cedar Tabebuia insignis 26 0.19 2.2% warakaioro Laetia procera 70 0.40 1.7%
D95 = 95% quantile of diameter distribution as an index of typical mature tree size. Dinc = annual increment estimate based on typical mature size. AMR = mortality, calculated from increment and typical mature size. These values, along with the initial stand table, were used to run MYRLIN #3 under the two management scenarios. Though MYRLIN #3 does not cater for the wide variety of parameters that can be used in SYMFOR to specify logging practices, it was nevertheless possible to match the most important ones in MYRLIN for each management scenario. In particular, the harvestable utilisation classes and their minimum diameters could be exactly matched between models for each management scenario. With regard to tree defect, a decision as to which trees of commercial species would be regarded as defect-free was made using Excel’s random number function. To do this, a random number between 0 and 1 was assigned to each sample tree in a new column. In the next column, a decision was made as to whether each tree was defective based on its random number. If the random number was less than 0.33, the tree was taken to be defective and was removed from the dataset. Trees with random numbers greater than 0.33 were deemed defect-free and retained in the data for subsequent analysis. Since this left only those commercial stems that were considered defect-free in the data-set, a 100% Harvest yield could be set in MYRLIN to estimate the actual merchantable harvested volume, net of defect. This provided a means to ensure that SYMFOR and MYRLIN were taking account of tree defect in the same way. Due to limitations in the manner in which MYRLIN estimates future yields, it was later decided by senior FRP managers that a prediction period of 60, rather than 200 years would be used for the MYRLIN simulations. While providing a greater degree of confidence in MYRLIN results, this made comparisons between the SYMFOR and MYRLIN results more difficult.
The results of the series of MYRLIN #3 runs were then compared to those already produced using SYMFOR (see Section 3.6.1.1).
55

3.5.2. Activities towards Objective 2: Information, knowledge and skills transfer
“To transfer effectively resulting information, knowledge and skills (as appropriate) to local, national and international stakeholders”.
3.5.2.1. Introduction An important aspect of the pilot studies was the valuable opportunity they offered to further develop capacity within GFC and the other study partners in the area of growth and yield estimation. Progress made in the initial UK training workshop was therefore built upon the maximum extent during the implementation phase of the studies, subject to time limitations.
3.5.2.2. Collaboration between the study partners On the technical front, a steep learning curve was required for the GFC/FRP team, particularly when developing new management models for the BCL concession and managing the whole SYMFOR analysis process on a more independent basis than attempted before. The approach taken by FRP staff was to try to ensure that the GFC officers took the lead role in managing the study and, as far as possible, were fully involved in all technical activities. This was maximised by holding extra sessions outside of office hours, since inevitably the officers (and their support staff) had to manage their inputs to the study amongst a large number of other competing duties. Where BCL was concerned, efforts were focused on spending time with available personnel and explaining/discussing the approach and methods used, rather than on providing training. However the Assistant Team Leader of the Barama Forest Research Section received some preliminary exposure to SYMFOR and ArcView and was left in a position to experiment further with the two applications. Although the study team received the full support of BCL, it was not possible to work as closely as desired with other company staff since:
• senior staff were fully occupied with company matters, not least the re-location of the operational centre from Port Kaituma to Cuyuni;
• the company has retained a very limited capacity with regard to growth and
yield research, the research section now being restricted to the single officer mentioned above.
Moreover, the majority of the BCL study had to be conducted within a fortnight, placing serious constraints on the availability of those company staff who would have ideally been more closely involved.
56

3.5.3. Activities towards Objective 3: Applicability to Guyana
“To provide an assessment of the possible future roles for the two modelling approaches in the Guyanese context”. The activity defined under this Objective was: “Within the pilot study team, use the study to gather insights into the likely future usefulness of SYMFOR with regard to the work of GFC, the private sector partners and (as far as possible) other forest sector representatives.” A number of observations pertaining to this objective were therefore made during the planning and implementation of the study. To this end, a SWOT29 analysis was carried out with regard to the likely applicability of SYMFOR in the Guyanese context. Observations made under this objective are presented in the Results and Findings section, below.
29 This is a simple framework setting out the Strengths, Weaknesses, Opportunities and Threats (i.e. SWOT) relating to (in this instance) the application of the SYMFOR framework in the Guyanese context.
57

3.6. Results and findings
3.6.1. Sustained Yield estimation Stand tables for the initial forest produced by MYRLIN #1 are shown in Table 17, below. These summarise the composition of the twelve plots of forest that were used to initialise both the SYMFOR and MYRLIN modeling runs. The first table shows stems per hectare, sorted to highlight the most frequent 20 species in the plots in terms of total stem numbers above 20cm (the minimum tree diameter included in the data).
Table 17 Stand table showing prevalent species by stem frequency (sorted by frequency of trees of 20 cm dbh and above)
Stems per hectare (20cm +) - Summary for Mixed Forest Type 1 Cumulative classes
Species 20-29 30-39 40-49 50-59 60-69 70-79 80-89 90-150 20+ 55+ Kakaralli, black 28.2 12.0 5.8 2.8 0.5 0.2 0.1 0.0 49.4 2.0 Kauta 16.6 9.3 4.1 1.0 0.3 0.0 0.0 0.0 31.3 0.3 Haiariballi 8.3 7.7 4.3 1.8 0.9 0.2 0.0 0.0 23.3 2.0 Trysil 9.9 3.3 0.6 0.2 0.0 0.0 0.0 0.0 13.9 0.0 Baromalli 4.5 2.2 1.3 2.2 1.4 0.5 0.3 0.2 12.5 3.3 Kurokai 6.3 2.8 1.3 0.3 0.1 0.1 0.0 0.0 10.9 0.2 Waiki 4.0 2.6 1.3 0.3 0.1 0.1 0.0 0.0 8.3 0.3 Maho 1.3 1.2 0.9 0.6 0.2 0.0 0.2 0.0 4.3 0.5 Crabwood 0.8 0.6 0.6 0.3 0.3 0.3 0.0 0.0 2.8 0.6 Bartaballi 0.9 0.8 0.2 0.5 0.0 0.1 0.1 0.0 2.5 0.4 Kairiballi 1.4 0.6 0.3 0.0 0.0 0.0 0.0 0.0 2.3 0.0 Swizzle stick 2.1 0.1 0.1 0.0 0.0 0.0 0.0 0.0 2.3 0.0 Sand mora 1.3 0.8 0.2 0.0 0.1 0.0 0.0 0.0 2.3 0.1 Moraballi 1.3 0.8 0.0 0.1 0.0 0.0 0.0 0.1 2.2 0.2 Yarula 0.9 0.2 0.3 0.0 0.1 0.3 0.3 0.1 2.1 0.8 Duru 0.7 0.7 0.3 0.3 0.1 0.0 0.1 0.0 2.0 0.3 Karababalli 0.4 0.5 0.4 0.3 0.1 0.3 0.0 0.0 1.9 0.4 Kereti 1.5 0.3 0.0 0.0 0.0 0.0 0.0 0.0 1.8 0.0 Monkey pot 0.9 0.3 0.3 0.2 0.1 0.0 0.0 0.0 1.8 0.2 Kokoritiballi 0.6 0.3 0.4 0.3 0.0 0.2 0.1 0.0 1.8 0.5 Others 15.9 6.2 3.9 2.3 1.8 0.8 0.7 0.8 32.4 5.1
Totals 107.8 52.9 26.4 13.3 5.8 2.9 1.7 1.2 211.9 17.0 Table 18, below, provides an alternative stand table from the same PSP data, this time presenting the prevalent species in terms of the Basal Area of those trees above 55cm dbh. This gives a better idea of the canopy structure of the forest and of its likely commercial profile (though not accounting for tree quality).
58

Table 18 Stand table showing prevalent species by Basal Area (sorted by Basal Area of trees of 55cm dbh and above)
Basal area (m2/ha) by diameter classes Cumulative classes
Species 30-39 40-49 50-59 60-69 70-79 80-89 90-150 20+ 55+ Baromalli 0.2 0.2 0.2 0.5 0.5 0.2 0.1 0.1 2.1 1.2 Haiariballi 0.4 0.7 0.7 0.4 0.3 0.1 0.0 0.0 2.6 0.6 Kakaralli, black 1.4 1.1 0.9 0.6 0.2 0.1 0.0 0.0 4.3 0.6 Bulletwood 0.0 0.0 0.0 0.0 0.1 0.1 0.0 0.3 0.4 0.4 Yarula 0.0 0.0 0.0 0.0 0.0 0.1 0.1 0.1 0.5 0.4 Kabukalli 0.0 0.0 0.0 0.0 0.0 0.0 0.1 0.1 0.3 0.2 Crabwood 0.0 0.1 0.1 0.1 0.1 0.1 0.0 0.0 0.4 0.2 Maho 0.1 0.1 0.2 0.1 0.1 0.0 0.1 0.0 0.6 0.2 Kokoritiballi 0.0 0.0 0.1 0.1 0.0 0.1 0.0 0.0 0.3 0.2 Karababalli 0.0 0.0 0.1 0.1 0.0 0.1 0.0 0.0 0.3 0.2 Burada 0.0 0.0 0.1 0.0 0.1 0.1 0.0 0.0 0.2 0.2 Bartaballi 0.0 0.1 0.0 0.1 0.0 0.0 0.0 0.0 0.3 0.2 Baradan 0.0 0.0 0.0 0.0 0.0 0.0 0.0 0.1 0.1 0.1 Wild calabash 0.0 0.0 0.0 0.0 0.0 0.0 0.1 0.0 0.1 0.1 Waiki 0.2 0.3 0.2 0.1 0.0 0.0 0.0 0.0 0.8 0.1 Soapwood 0.0 0.0 0.0 0.0 0.0 0.0 0.0 0.1 0.2 0.1 Kauta 0.8 0.9 0.6 0.2 0.1 0.0 0.0 0.0 2.6 0.1 Duru 0.0 0.1 0.0 0.1 0.0 0.0 0.0 0.0 0.3 0.1 Kaditiri 0.0 0.0 0.0 0.0 0.0 0.0 0.0 0.1 0.1 0.1 Kakaralli, wina 0.0 0.0 0.0 0.0 0.0 0.0 0.0 0.0 0.2 0.1 Others 1.8 1.3 0.9 0.6 0.5 0.2 0.1 0.2 5.6 1.2
Totals 5.2 4.9 4.1 3.1 1.9 1.3 0.9 1.0 22.4 6.5
20-29
Using the same data, filtered to remove a third of trees assumed to be defective, MYRLIN #3 later estimated a standing volume of 20 m3/ha from commercial species (>55 cm dbh, no plywood species) and 54.2 m3/ha from trees above 35cm dbh, including the common species black Kakaralli (suitable for piling). Though the results of the following simulations are nominally applicable to previously unlogged areas of Mixed Forest Type 1 (which covers about three-quarters of the BCL concession), experience has shown that this single “photo-type30” is not consistent in composition or productivity across more than a few square kilometres. Therefore the results should best be seen as applicable to this forest type as found in the immediate vicinity of the PSPs used to initialise the model runs. The following table summarises the results of the six simulations carried out in SYMFOR under each management scenario on the 12 plots summarised above.
30 This classification is based on photo-interpretation, using a combination of terrain with impressions of the overall stature and canopy texture of the forest.
59

Table 19 Summary of mean annual yields under each harvesting scenario (all yields in m3)
BCL scenarios Code of Practice scenarios Limited yield Unlimited yield Limited yield Unlimited yield
Harvest years
Yield (m3/ha)
Mean Annual Yield (m3/ ha/ yr)
Yield (m3/ha)
Mean Annual Yield (m3/ha/ yr)
Yield (m3/ha/ yr)
Mean Annual Yield (m3/yr)
Yield (m3/ha)
Mean Annual Yield (m3/ha/ yr)
25 year cycle: 0 19.4 n/a 27.4 n/a 21.6 n/a 65.5 n/a
25 15.0 0.6 11.6 0.5 21.1 0.8 18.5 0.750 13.5 0.5 12.3 0.5 20.6 0.8 18.7 0.775 12.4 0.5 11.0 0.4 20.1 0.8 28.3 1.1
100 13.3 0.5 13.6 0.5 20.3 0.8 22.9 0.9125 16.3 0.7 19.0 0.8 20.3 0.8 20.3 0.8150 14.7 0.6 14.1 0.6 20.0 0.8 21.1 0.8175 13.4 0.5 12.2 0.5 19.9 0.8 22.3 0.9200 12.1 0.5 12.9 0.5 20.0 0.8 21.4 0.9
Sum/ Mean 130 0.55 134 0.53 184 0.81 239 0.8740 year cycle:
0 19.9 n/a 28.5 n/a 21.7 n/a 66.5 n/a 40 17.7 0.4 16.5 0.4 21.4 0.5 29.0 0.780 17.5 0.4 16.7 0.4 21.3 0.5 40.4 1.0
120 20.2 0.5 27.1 0.7 21.5 0.5 32.7 0.8160 20.0 0.5 22.0 0.6 21.4 0.5 32.7 0.8200 18.8 0.5 18.5 0.5 21.7 0.5 33.7 0.8
Sum/ Mean 114 0.47 129 0.50 129 0.54 235 0.8460 year cycle:
0 19.7 n/a 27.2 n/a 21.6 n/a 64.1 n/a 60 19.7 0.3 22.6 0.4 21.8 0.4 46.1 0.8
120 21.1 0.4 33.7 0.6 21.9 0.4 52.1 0.9180 21.2 0.4 29.1 0.5 22.0 0.4 48.9 0.8
Sum/ Mean 81.8 0.34 112.63 0.47 87.3 0.37 211 0.82Mean MAY 0.51 0.85
The interpretation of these results was aided by the production of Excel charts. Examples of those produced for the 25 and 40 year cycles are presented below.
60

Figure 12 Comparison of predicted timber yields under the two management scenarios (25 year felling cycle), with no yield restriction
70
60
50
2
3
4
Yield/ha at each harvest m3
0
0
0
BCL yield m3/ha/cycleCoP Yield m3/ha/cycle
10
00 25 50 75 100 125 150 175 200
Harvest years
Clearly, by the criteria used in this study, neither of these scenarios results in a sustained yield, since the first harvest removed a quantity of timber that was neither achievable in the second nor third harvests (nor indeed during the remainder of the 200 year projection period). A synthesis of SYMFOR and MYRLIN outputs in relation to this sustainability criterion is provided in Table 20 (after the MYRLIN results presented immediately below). Nonetheless, it is noted that after the initial heavy harvest a stable yield is indicated for the remainder of the projection period under both management scenarios. Indeed, the two peaks in the lines in Figure 12 above, indicate an increase in commercial yield at around year 125 (BCL) and year 75 (Code of Practice). This is consistent with the commercial maturity of seedling/saplings liberated (and seeds that were germinated) at the time of first harvest (given the predicted MAI (mean annual increment) and minimum harvesting diameters). In contrast, when the yield at each harvest was restricted to 20 m3, there were clear signs that the achievement of a sustained yield was becoming a more likely prospect, as shown below.
61

Figure 13 Comparison of predicted timber yields under the two management scenarios (25 year felling cycle), with yield at each harvest restricted to 20 m3
25
20
1
1
Yield/ha at each harvest m3
5
0
BCL restricted yield m3/ha/cycle5CoP - restricted yield m3/ha/cycle
00 25 50 75 100 125 150 175 200
Harvest years
As noted earlier, predicted yields have a high sensitivity to the estimated defect rate of the potential commercial stock. This is an area requiring closer attention if realistic estimates of sustained yields are to be obtained. As presently configured in SYMFOR this rate is set for all species at once, which is not ideal. In view of the fact that the most important species vary widely in defect rate (e.g. Morabukea vs Wamara) it would be useful to disaggregate the setting of this parameter. Depending on the commercial profile of the stand (in relation to the company’s utilisation policy) this could lead to marked improvements in the predictions for key timber species. The majority of species, however, will remain adequately addressed by a mean defect value, provided that it is a realistic one. The limited additional tests carried out indicated a higher sensitivity in predicted yields to skid trail width (3 and 4m) than there was to directional/non-directional felling, at least for the BCL management scenario at a 40 year cycle. There appeared to be little difference in modelling results when using the first and second enumeration of the plots to initialise the model runs (this was an issue, as the second enumeration data were believed to be more reliable, yet there was a risk that some of the plots had been disturbed by that time). As noted in the methodology section, these were practice runs only and could not be formally compared due to slight differences in parameter settings. One modification was recommended to the current working of the model. At present, if a maximum harvest volume is specified by the user it will always be exceeded (provided the volume is available). This is because the model fells trees up until the point where the last tree has taken the yield over the specified limit. Where large merchantable trees are present in the forest, this can mean that the maximum permitted volume is exceeded by a considerable margin. This is clearly shown in Figure 13 above, where, for the CoP scenario, each harvest is higher than 20 m3. As this element of the model is likely to be used to reflect harvesting restrictions arising from some form of guidelines or regulations, it would be more useful if set up
62

to fell trees up to the point where felling one more tree would exceed the specified limit. By this means, the simulated harvests would comply with the restriction. A suggestion to incorporate this feature (at least for the Guyana version of the model) was made to the Edinburgh team.
3.6.1.1. MYRLIN analysis The following results were obtained from the MYRLIN analysis of the same plots (see methodology section above). These were produced for unrestricted yield scenarios only, as, unlike SYMFOR, MYRLIN does not have the facility to restrict volume harvested in terms of maximum yield. In the following table, the results of simulations carried out (using both models) are presented using the sustained yield criteria set out in the methodology section, above. Where a tabulated value appears in italics, this indicates that it was a borderline result. It is important to note that the results of SYMFOR simulations apply to a 200 year prediction period whereas those of MYRLIN apply to a shorter, 60 year, period. Harvesting scenarios that appeared sustainable are highlighted in bold italics.
Table 20 Summary and Comparison of Results Indicative commercial timber yields
SYMFOR simulations MYRLIN simulations
Management Scenario
Felling cycle (years)
Is first yield sustained over 2 more cycles?
Total m3/ha over 200 years
General trend in commercial productivity @ yr 200
Is first yield sustained over the 60 years?
General trend in commercial productivity @ yr 60
a) Unrestricted yield 25 NO 134 Stable NO Stable 40 NO 129 Stable NO Stable
BCL scenarios (55cm min dbh)
60 NO 113 Stable NO Declining
25 NO 239 Stable NO Rising 40 NO 235 Stable NO Declining
COP scenarios (35cm min dbh)
60 NO 211 Stable NO Declining
b) Yield restricted to 20 m3/ha per cycle 25 NO 130 Stable 40 NO 114 Stable
BCL scenarios (55cm min dbh)
60 YES 82 Increasing
25 YES 184 Stable 40 YES 129 Stable
COP scenarios (35cm min dbh)
60 YES 87 Increasing
Not modelled (MYRLIN does not have the facility to set harvest limits in terms of a maximum volume)
It was clear that in the unrestricted yield scenarios, the original stock of commercial timber is much reduced by the first harvests, giving rise to high initial timber yields. Of the logging cycles tried, none met the sustainability criterion used on this study (based on both SYMFOR and MYRLIN results), though most led to a stable yield by the end of the prediction period. The MYRLIN charts presented below clearly support this observation:
63

Figure 14. 25 year felling cycle: chart showing yield per hectare per cycle and per annum (set against standing volume), under BCL management scenario (unrestricted yield)
-
5
10
15
20
25
0 2 4 6 8 10 12 14 16 18 20 22 24 26 28 30 32 34 36 38 40 42 44 46 48 50 52 54 56 58 60
Time period (years)
Com
mer
cial
vol
ume
(m3)
0.000
0.200
0.400
0.600
0.800
1.000
1.200
Annu
al h
arve
sted
vol
ume
(m3/
ha/y
r)
Standing Harvest AAC
Figure 15. 25 year felling cycle: equivalent chart under the Code of Practice scenario (unrestricted yield)
-
10
20
30
40
50
60
0 2 4 6 8 10 12 14 16 18 20 22 24 26 28 30 32 34 36 38 40 42 44 46 48 50 52 54 56 58 60
Time period (years)
Com
mer
cial
vol
ume
(m3)
0.000
0.500
1.000
1.500
2.000
2.500
3.000
Annu
al h
arve
sted
vol
ume
(m3/
ha/y
r)Standing Harvest AAC
The shape of the curves showing standing volume, harvest and AAC were found to be broadly similar between the sets of management scenarios – it was their absolute values that were different. As with the SYMFOR simulations, the Code of Practice scenario clearly leads to much higher initial yields due to its wider profile of harvestable species and sizes. Since this similarity between the “BCL” and “Code of Practice” graphs also held true when the logging cycle was changed to 40 and 60 years, only the results for the BCL scenario are shown below.
64

Figure 16 Equivalent chart for 40 year felling cycle (BCL management scenario – unrestricted yield).
-
5
10
15
20
25
0 2 4 6 8 10 12 14 16 18 20 22 24 26 28 30 32 34 36 38 40 42 44 46 48 50 52 54 56 58 60
Time period (years)
Com
mer
cial
vol
ume
(m3)
0.000
0.100
0.200
0.300
0.400
0.500
0.600
0.700
0.800
Annu
al h
arve
sted
vol
ume
(m3/
ha/y
r)
Standing Harvest AAC
Figure 17 Equivalent chart for 60 year felling cycle (BCL management scenario – unrestricted yield).
-
5
10
15
20
25
0 2 4 6 8 10 12 14 16 18 20 22 24 26 28 30 32 34 36 38 40 42 44 46 48 50 52 54 56 58 60
Time period (years)
Com
mer
cial
vol
ume
(m3)
0.000
0.100
0.200
0.300
0.400
0.500
0.600
Annu
al h
arve
sted
vol
ume
(m3/
ha/y
r)
Standing Harvest AAC
A more promising scenario tried was that of harvesting 50% of commercial volume above 55cm dbh, including black Kakaralli, on a cycle of 40 years. This lead to a harvest of 14.3 m3/ha over the 40 year period, while maintaining a more or less constant standing stock. This run produced the following chart:
65

Figure 18 Harvest of 50% of commercial volume above 55cm dbh on a 40 year felling cycle.
Commercial volume production per hectare
-
5
10
15
20
25
0 2 4 6 8 10 12 14 16 18 20 22 24 26 28 30 32 34 36 38 40 42 44 46 48 50 52 54 56 58 60
Time period (years)
Com
mer
cial
vol
ume
(m3)
0.000
0.050
0.100
0.150
0.200
0.250
0.300
0.350
0.400
0.450
Annu
al h
arve
sted
vol
ume
(m3/
ha/y
r)
Standing Harvest AAC
Overall, the results of this study indicate a favourable level of commercial productivity in this forest type (relative to central Guyana – see Phillips 2001b, 2001c). They suggest that at present harvesting intensities, BCL’s proposed 40 year felling cycle may indeed lead to sustained yields of the commercial stock currently of interest to the company, provided that they continue to place emphasis on careful harvesting methods. Indeed there appears to be a greater quantity of commercial timber available than is presently harvested (which the company has estimated as 8 m3/ha/ cycle). This difference can probably be attributed to the following: a) The plots represent a more productive forest area than is found on average within the areas operated to date (assuming that the company’s figure is an average across all productive forest); b) BCL tends to harvest a more limited range of species than that used in the modelling analysis, which was based on the species recognised as merchantable across the forest sector as whole; c) BCL felling crews almost certainly have a higher quality requirement for “defect-free” trees than the IFP forest inventory personnel. The proportion of defective trees is likely to be higher in the eyes of these operators, meaning that (from the company’s perspective) the effective yield per hectare will be lower than indicated by the above analyses. It must be recognised that the inaccessibility of the BCL forest dictates that the company extracts only those stems of greatest and most certain value (logs acceptable to its own mills). This is particularly the case since a proportion of stems that would be merchantable elsewhere are likely to have a negligible (or negative) stumpage value in these remote forests. Nonetheless, the adoption of a slightly broader range of accepted commercial species (particularly sawlog species), may be a more viable option as the company moves into more accessible forests during the next decade.
66

Interestingly, the SYMFOR results indicate that with periodic yield limited to 20 m3, a 25 year cycle is likely to be sustainable in these forests under the Code of Practice scenario (allowing a wide range of commercial species to be felled down to 35 cm minimum dbh). However, as noted in the previous paragraph, a high proportion of this produce would not be economically viable due to the operational costs and high extraction distances relative to market prices. This comparison of the two models is useful as it gives some indication of MYRLIN’s ability to generate realistic results in (other) situations where nothing is known of the forest species’ dynamics31. Although more detailed comparisons could be made between individual coefficients generated by the two modelling methods, the “acid test” is the comparison of the estimates produced for sustained timber harvesting intensities using the same data and general assumptions. In this regard the two modelling approaches gave rise to similar results under the more realistic (BCL) scenarios investigated. Though improvements could almost certainly be made to the MYRLIN predictions if ecological information were used as a basis for grouping species, the model will clearly be increasingly limited, the more extreme the management scenarios involved.
3.6.2. Information, knowledge and skills transfer The following table summarises the extent to which the transfer of information, knowledge and skills was effected during the course of the study.
Table 21 Transfer of knowledge and skills. Study Partner
Information Knowledge Skills
GFC Sustained yield estimates for the main forest type within the North West part of the BCL concession.
Improved knowledge of yield regulation issues and of available methods/ tools for modelling management scenarios.
Practical application of forest data to sustained yield management planning, using SYMFOR, supported by use of Excel, Access and ArcView. Skills in designing and implementing a technical research project and running a national workshop to present findings.
BCL BCL fully briefed on the strategic and technical aspects of the study. This report provides BCL with a more detailed description of the work carried out.
Improved knowledge of methods for producing and applying sustained timber yield estimates (mainly through the study report).
The FRP team worked closely with the remaining member of BCL’s Research Section for 2 days; the latter received some initial guidance in running SYMFOR (also in using ArcView GIS) software).
31 All MYRLIN files produced are available for closer scrutiny on the accompanying MYRLIN CD.
67

DFID/FRP Pilot study report of use as a reference for projects elsewhere involved in regulation of sustained timber yields.
Improved appreciation of opportunities for improving forest yield regulation in Guyana, based on pilot study findings and recommendations.
(FRP staff gained additional skills while working on the modelling with GFC staff).
University of Guyana
Provided with a copy of MYRLIN CD; discussions held with lecturers on how best to make use of the information/ data provided for teaching purposes and on possibilities for inputs from GFC at such times.
Studies were presented at a half-day seminar - findings and implications were discussed with students.
A brief demonstration of the models was given at the end of the seminar. Practical skills can be developed in practical sessions using the MYRLIN CD provided.
Other focus groups (Forestry companies, Govt bodies, NGOs)
Information on the studies through the workshop
Insights gained into yield regulation issues and methods through the workshop
3.6.3. Applicability to Guyana Findings under this objective are summarised in the form of a “SWOT analysis.” This looks at SYMFOR in relation to the study in terms of its main internal attributes – its strengths and weaknesses – along with the opportunities and threats, i.e. the main external factors with a bearing on its success32.
3.6.3.1. Strengths Credibility: SYMFOR’s ecological model has a well-established and well-documented scientific basis and if used with a rational management model is likely to produce credible and defensible results. It is likely to be robust over a wider range of management scenarios than simpler models (such as MYRLIN). Support: The application currently has excellent technical support (contingent on continued funding). Documentation: Well documented for established users. Flexibility: Potentially adaptable to NTFP’s provided that dynamic data are available on growth and productivity for these.
3.6.3.2. Weaknesses Data requirement: Requires substantial PSP data to develop new ecological models. Complexity: Requires specialist technical knowledge and programming skills to calibrate ecological models and to further develop SYMFOR as an application.
32 An equivalent SWOT analysis of MYRLIN is presented in the report on the ISLA Pilot Study (see Section 2.6.3 above)
68

Training requirement: For most users, successful use depends on a period of training to get started and on the availability of a suitable ecological model (or the resources to develop/fund one).
3.6.3.3. Opportunities Further analysis using Guyana models: More detailed analysis of BCL and Pibiri datasets can be carried out by GFC (and any interested researchers). A robust and transparent analysis of these will provide the best basis to date for developing management prescriptions for the two (important) forest types concerned. Other large companies in the vicinity of BCL and DTL could also potentially benefit from using the existing ecological models, based on their own particular forest management proposals. As part of this work, further investigation of log utilisation and recovery rates should be conducted to ensure that estimated volumes are realistic. New Guyana Models: Now that it is well established in Guyana, the SYMFOR framework should be considered for handling the dynamic studies presently being established by Iwokrama and Conservation International. Teaching tool: SYMFOR can be used for teaching the principles and practice of scientific growth and yield modelling, using example data sets such as those developed under this study.
3.6.3.4. Threats Resources: Continued development of SYMFOR and the provision of associated technical support hinge on continued funding from DFID (and/or other development agencies). Capacity: The use of SYMFOR in Guyana rests on the availability of skilled personnel and (if it is to be used more widely there) on the collection of new PSP data. In the immediate future Guyana will be dependent on external technical inputs to update ecological models periodically (based on re-measurements of existing plots), to develop new models (if additional PSP’s are established elsewhere) and to train Guyanese foresters in developing management models that can interact with these in a relevant and meaningful manner. The statistical analysis of results also requires support (to a certain extent this may be available through UG).
3.7. Conclusions and recommended next steps
3.7.1. What did the study achieve? Results: The results from the simulations carried out in the study are likely to be a useful step towards gaining a practical understanding of the dynamics of the main productive forest type in the north-west portion of BCL’s concession. The methodology and results need to be carefully reviewed before firm conclusions are drawn from them. It is anticipated that the methodology and scenarios applied in this study will at least represent a useful stage in examining options for sustained yield management of the BCL concession area. Capacity building: Two GFC officers were trained in the use of SYMFOR and were part of a team applying this modelling application in the BCL concession. Their close involvement in all stages of the development, implementation and presentation of the
69

pilot studies provided many opportunities to learn/practice important management and technical skills. The GFC officers presently have the skills to use SYMFOR for further modelling work using the Barama and Pibiri ecological models, though these skills will rapidly diminish if not practised. The FRP, has therefore played a useful role in strengthening GFC’s capacity in the area of forest growth and yield at a time when much emphasis is being placed on this issue. In BCL, the Assistant Team Leader of the Research Section benefited from some preliminary training in SYMFOR, which could be enhanced with further exposure. Assessing the role of SYMFOR: The study provided useful, practical insights into the possible future role of SYMFOR in relation to the on-going growth and yield work being implemented in Guyana. These are summarised in the above SWOT analysis.
3.7.2. Recommended next steps It is recommended that the main partners involved in the study consider the following next steps:
3.7.2.1. Barama Company Limited 1. Review the future of the BCL Research Section, in liaison with the Forest Research Unit (FRU) and FPA. From the point of view of this study the priority is to decide how best to cooperate with GFC FRU/FRMD over research activities, including the maintenance and future enumeration of the BCL PSP’s. 2. As part of this strategic review, consider the merits of a further reduction of the number of active PSPs, retaining plots based on a careful selection by site type, management history and likely data quality (the latter based on Phillips 2001c). This will enable resources to be more effectively targeted at gathering adequate quantities of high quality data from plots representative of the main site types. As part of this strategy, consideration should be given to the establishment of new plots in production forest located in other parts of the concession (even if these are nominally the same forest type(s) as those already sampled). To support this review, the following immediate activities are advised: • Record, using GPS, the locations of all accessible plots (including abandoned
ones) that are not presently geo-referenced, as these are in danger of being lost. (It is recognised that some of these plots are now inaccessible due the deterioration of logging roads in some previously worked areas).
• Stratify those PSPs that are still active by site type (forest composition, soil type,
general terrain and management history, in particular whether the plot has been affected by disturbances such as logging or mining. This will require the collection of some additional information; this could be carried out either when visiting plots for geo-referencing purposes or at the time of next enumeration.
3.7.2.2. Guyana Forestry Commission 1. Continue the existing collaboration with BCL over growth and yield research, with the aim of setting rational minimum harvesting prescriptions for the company. This study has tended to support the 40 year felling cycle now being implemented by the company. This assumes that the company continues to place emphasis on controlling damage during the logging operation and that its current selection criteria for harvestable produce remain substantively the same. However, the company’s
70

management system must be under continual review, as the forests in the eastern part of its concession are likely to be less productive (in terms of commercial MAI) than those sampled in the PSPs located in the wetter north western portion. 2. Continue cooperation with FRP, in particularly through the 2002 FRMD Yield Regulation project. With the completion of GFC’s DFID-funded Support Project’s inputs to the Forest Resources Management Division (and the completion of the Tropenbos project), further support from the FRP may be particularly beneficial in the following areas:
• Drawing together findings from the Silvicultural Surveys, the present pilot
studies, the ongoing Reduced Impact Logging study, the revision of Forest Management Plan guidelines and Code of Practice.
• Defining further growth and yield research priorities and defining the role of
FRMD in achieving these. • Carrying out further analysis of sustained yield options for BCL and extending
this to an equivalent analysis of the Pibiri forest. • Providing opportunities for training or other involvement in growth and yield
issues in an international context.
3.7.2.3. DFID / Forest Research Programme 1. Continue to support GFC in its work on Growth and Yield, including the areas
outlined above.
2. Support related research initiatives within the Guyanese forestry sector in response to documented demand.
3.8. Summary of outputs and their delivery The final outputs from this pilot study are as follows: 1. A published integrated report on the studies (covering both studies and the workshop) 2. A comprehensive MYRLIN CD containing:
• A separate report for each study and for the workshop; • All background documents on FRPs 7278 and 6915 (Project Memoranda,
BTORs, technical papers etc); • Copies of MYRLIN and SYMFOR, including the final data-sets used for the
studies and the latest versions of documentation on the two applications • Selected photographs taken during the studies;
3. Copies of the main documents posted on the MYRLIN and SYMFOR websites. 4. A 2-day workshop held in March 2002, during which the findings of the studies were presented and discussed prior to the publication of the final pilot study outputs, as above. Secondly a half-day seminar was presented to students and lecturers from the Guyana School of Agriculture and University of Guyana. A report on the workshop is contained in 1, above, and as a separate document on the MYRLIN CD.
71

3.9. Photographs taken by Mr Gavin Nicol during the BCL Case Study - 2001
BCLTransporting field accommodation to new site
BCL forest at edge of clearing
BCL chokerman
BCL researcher checking dbh of a Baromalli tree against original
BCL Forest Canopy
BCL forest
72

BCL hauling logs to the log pond
BCL loaded barge
BCL log loading area
BCL log loading at Port Kaituma
BCL moving equipment to new site
BCL offloading logs at pond
73

BCL's Barima bridge
FRP team members with BCL Researcher (right) (photo J.Singh)
Local inhabitants by Barima bridge Manicaria saccifera - Truli palm, used for thatching
Note that all of the above photographs were taken by Gavin Nicol (uless otherwise stated in the title. All are available for use free of charge for non-commercial purposes, providing that the photographer is acknowledged if any are published or otherwise distributed (including web-site use). The photographs above can be found in the following folder on the MYRLIN CD: Pilot Studies/Pilot Study Data/BCL Study/BCL Data/BCL Photos. High resolution versions of the photographs can be requested for appropriate use. Email [email protected].
74

SECTION 4. Report of the workshop on Methods of Yield Regulation in Guyana
Held at Guyana Forestry Commission
13-14th March 2002
4.1. Executive Summary A two-day workshop was held in Guyana in March 2002 to present the preliminary findings of two pilot studies on timber yield regulation in Guyana and to discuss these with the main study partners and other stakeholders (see SECTION 2 and SECTION 3 above). The objectives of these pilot studies were:
1. To explore methods for regulating sustained timber yields in an industrial and a community forest concession in Guyana, in response to demand from the Guyana Forestry Commission and forest sector.
2. To transfer effectively the resulting information, knowledge and skills to local,
national and international stakeholders.
3. To provide an assessment of the possible future roles for the two modelling applications in the Guyanese context.
These pilot studies were carried out as a partnership between the Guyana Forestry Commission (GFC), two Guyanese forestry operators (the Barama Company Limited and Ituni Small Loggers Association), and the Universities of Edinburgh and Oxford
This research was funded under the Forest Research Programme of the UK Department for International Development (DFID). Presentations at the workshop focused on progress with the pilot studies to date and insights into other growth and yield work being conducted in Guyana. These were followed by group discussion sessions, during which the study partners and other main stakeholders discussed aspects of the studies and developed recommendations for next steps. The two-day workshop was followed by a half-day seminar for 46 forestry students and lecturers of the University of Guyana and Guyana School of Agriculture. Messages coming from the process to date:
1. The Ituni study provides an excellent example of how the establishment of positive dialogue with a community can foster a working relationship where technical support can substantially contribute to the achievement of sustainable livelihoods.
2. The Barama study illustrates the need for adaptive forest management in that
it demonstrates that various options are available to the company for producing sustained timber yields. Preliminary results indicate that the
75

harvesting prescriptions tentatively agreed between GFC and the company will lead to sustained yields, but that there are also a number of alternative scenarios with sustained yields that combine different felling cycles, minimum diameter limits and breadths of species acceptable to the company.
3. The process has been developed with as much local ownership as possible.
To fully capture the benefits of the progress made to date, GFC will require further, well-focussed technical support as it works with other groups. The completion of GFC’s DFID Support Project means that this support must be obtained from an alternative means, such as continued FRP inputs. Details of particular technical areas requiring further support that were identified in the workshop have been documented.
4. There is a need to continue to promote multi-stakeholder partnerships to take
this process forward. The Ituni study is already showing the benefits of this approach, whereas the Barama study indicated there is a need (and an opportunity) to make progress towards more inclusive processes (in spite of its constructive role during the early part of the study, the company did not send a representative to the workshop).
4.1.1. Summary of Recommendations Recommendation For Whom Page 1. Produce a summary document on the studies, highlighting policy and developmental implications, along with recommended next steps
GFC/FRP 7
2. Develop and apply methods for calculating and stating the precision of modelling results and a protocol for using this information to guide reliable use of the models
Future projects
8
3. Produce a standard Glossary of Terms that can be used consistently throughout the Growth and Yield studies
FRP/GFC 9
4. Develop an extension programme to engage further with the industry
GFC 9
5. Work with UG lecturers to propose topics for final year projects relating to current growth and yield work in Guyana and provide technical support to the completion of such projects, as required.
GFC 9
6. Engage with GFC over the maintenance and measurement of existing PSPs and the recommendation to establish new plots in the Cuyuni operational area
GFC 9
7. Explore possibilities for the establishment of PSPs in other areas
GFC/ Forestry Sector
9
8. Develop and apply methods for exploring the economic/financial implications of modelling results
Future projects
10
9. Develop and apply socio-economic tools to assess the demand for forest products by forest communities
Future projects
10
76

10. Further develop GFC information, knowledge and skills (including that of the Forest Research Unit) by applying MYRLIN using other datasets (several were suggested) and by applying SYMFOR using both available ecological models under a wider range of management scenarios
GFC/ Future projects
10
11. Continue to explore how/when best to apply the available modelling tools, including GFC's GEMFORM model (under development) and (possibly) IWOPLAN
GFC (FRMD / Research Unit)
11
12. Future growth and yield workshops should be held to continue the existing process; they should be located in neutral locations, possibly extending to different regions.
GFC (FRMD / Research Unit)
11
13. Ensure that future workshops and seminars actively include the educational sector in the same manner as this one.
GFC/ Future projects
13
4.2. Introduction This section describes the implementation of a workshop relating to the two pilot studies.
4.2.1. Aims of the workshop The workshop was seen as an effective means to continue active participation of the various project stakeholders in the studies, enabling them to assemble in one place with the aim of:
• Receiving a detailed briefing on progress with the two studies and discuss their preliminary findings;
• Providing inputs into the completion of the studies;
• And providing recommendations on how the process should be continued
after the completion of the studies. In addition to the workshop, a half-day seminar on the pilot studies was held at the University of Guyana. This session was organised to provide support and encouragement to lecturers and students in this area of their curriculum, while capitalising on the fact that the presenters and presentations were already in place for the main GFC workshop. The session aimed to provide students with:
• An overview of growth and yield issues in the tropics; • Details of the two current research studies taking place in Guyana;
• The opportunity to have some first hand experience of the computer models
being used;
• And an up-to-date overview of forestry in Indonesia, including growth and yield issues in that country.
77

The session also provided a valuable opportunity for lecturers and students to interact with GFC and FRP technical staff in an informal setting.
4.3. Two-day Workshop at the Guyana Forestry Commission
The workshop, titled “Methods of Yield Regulation in Guyana” was hosted by the Guyana Forestry Commission (GFC) in its Conference Room on the 13th – 14th March 2002. It was attended by staff of GFC, a member of the GFC board, several Guyanese forest producers, NGOs and forestry lecturers, along with 2 representatives of the FRP (a full list of participants is contained in Appendix B). Representatives from the national newspapers and two television stations were also present for the opening ceremony (see Appendix D for details of media coverage). A conference folder was provided to all participants by GFC, containing copies of both pilot study reports and various other supporting information such as a glossary of terms and the GFC leaflet on Forestry in Guyana. The main presentations given at the workshop were as follows: Title Presenter Date Number of
participants1. Overview of forest management in Guyana in relation to growth and yield studies
J. Evans Deputy Commissioner of Forests, GFC
13th March
28
2. Presentation on Growth and Yield Pilot Study using MYRLIN toolbox
J. Singh Assistant Commissioner of Forests, GFC
13th March
23
3. IWOPLAN – a decision support system to assist management planning
Dr David Hughell GIS specialist, Iwokrama Centre
14th March
23
4. Overview of forestry in Indonesia with specific reference to growth and yield case studies
Dr Fadjar Pambudhi, University of Mulawarman, Indonesia
14th March
23
5. Presentation on Growth and Yield Pilot Study using SYMFOR toolbox
T. Khan Assistant Commissioner of Forests, GFC
14th March
23
6. Summary of workshop proceedings
Dr P. van Gardingen, DFID FRP 6915
14th March
23
Details of the full workshop programme are contained in Appendix A. The following section provides an overview of the presentations made and of the main discussion points raised by participants.
78

4.4. Summary of Presentations and discussion points
4.4.1. Overview of forest management in Guyana in relation to growth and yield studies
The first presentation was given by J. Evans (Deputy Commissioner of Forests), GFC, head the Forest Resources Management Division. The presentation described and discussed, in some detail, a new programme of silvicultural surveys being conducted in the FRMD. The main points made were as follows: The silvicultural surveys have produced valuable information for guiding policy and management planning. Two out of the three surveys implemented to data have revealed harvesting levels that cannot be sustained. There has been a very different response from the two companies involved so far - a change of working practices in one case and a reluctance to discuss findings in the other. This is a voluntary process at present - it will be continued as an on-going GFC work programme after the GFC Support Project has ended. Issues raised and discussed by participants included: Minimum felling diameters: As the minimum felling diameter is increased, the high incidence of defect in larger trees will reduce the “window” of harvestable trees. For this reason greater emphasis is initially being placed on increasing the minimum felling diameter for species known to have lower defect rates. Spatial extent of harvesting prescriptions: Due to differences in forest composition, forest dynamics and companies’ utilisation practices, harvesting prescriptions will probably best be determined on a concession by concession basis. Enforcement and cost recovery: The Silvicultural Surveys are being conducted in collaboration with selected producers at present. GFC funds each survey, though each company visited is encouraged to provide logistical support to the GFC crews.
4.4.2. Growth and Yield Pilot Study using the MYRLIN toolbox
This was presented by J. Singh (Assistant Commissioner of Forests – GFC Forest Reources Information Unit), one of the counterparts assigned to work on the studies. The main points made were as follows: The ISLA pilot study has furthered the development of capacity in GFC with regard to growth and yield analysis and has established a general methodology that GFC can use for future work. Interesting preliminary results were produced, using inventory data from a site near to the ISLA concession. The Association is now set to work with GFC on conducting its own strategic inventory, which will enable the application of MYRLIN for formal management planning. The results arising from the Pilot Study cannot be used for management planning, due to the origin of the inventory data used. The process has been particularly successfully in engaging the Ituni Small Loggers Association, who made valuable contributions to the workshop. They represent a small community venture heavily dependent on continuous timber harvesting to
79

safeguard livelihoods. The study has fostered to a positive working relationship between the Association and GFC. Following the presentation, the main issues discussed by participants were: Preliminary nature of results: During the course of several questions, it was emphasised again by the presenters that the study results (which in themselves were preliminary) were only intended to provide an illustration of how the model can be used, the main focus being on developing GFC capacity to use MYRLIN when inventory data from the ISLA concession become available. Scope of the MYRLIN model: Various questions were fielded about the capability of MYRLIN to take into account gap size, regeneration dynamics and other complex forest processes. It was stressed by the presenters that MYRLIN is a simple and reasonably transparent system that can be used as a first step towards improving forest management – it is not intended as a system that can provide answers to complex silvicultural questions.
4.4.3. IWOPLAN - a decision support system to assist management planning
During this session Dr David Hughell, a GIS specialist from the Iwokrama Centre, described the new system developed for Iwokrama by Dr Denis Alder. The main points made were: IWOPLAN is a GIS-based decision support system that links data on forest composition and dynamics with utilisation and economic information to enable users to explore sustainable harvesting options for timber and non-timber forest products. Iwokrama has made useful progress in exploring options for the management of its Sustainable Utilisation Zone using the IWOPLAN application. In theory the application can be adapted for use elsewhere, though at present it is still in the early stages of testing and application by Iwokrama staff. Several clarifications were then sought about the model and its application. Dr Hughell noted that the model uses pooled increment and mortality estimates from the Pibiri and Barama PSP data, as made available by GFC. An important point was that there was an overall paucity of inventory data in the Iwokrama concession, somewhat limiting the wholesale application of the IWOPLAN model. However, this issue was about to be addressed by a programme of management level inventory work.
4.4.4. Overview of forestry in Indonesia with specific reference to growth and yield case studies
Dr Fadjar Pambudhi, University of Mulawarman, Indonesia. The main points coming out of this presentation were: The presentation gave an international focus to the workshop and provided opportunities to compare and contrast the two country's situations. This description of the parallel studies being conducted in Indonesia dispelled concerns that Guyana was being treated as a "guinea pig" for new, untested
80

software. On the contrary, it became evident to participants that the work involved a well-established international partnership with a major country on the international scene. Considerable interest was shown in the presentation, since few participants were familiar with the Indonesian forestry situation. Various similarities and contrasts with the Guyanese forestry sector were noted and discussed by participants.
4.4.5. Growth and Yield Pilot Study using the SYMFOR modelling framework
The second pilot study presentation was given by T. Khan (Assistant Commissioner of Forests – GFC Forest Resources Planning Unit), the other GFC officer seconded to the pilot studies by the FRMD. The main points emerging were: Results produced to date support the harvesting prescriptions tentatively agreed between GFC and the Barama Company Limited (BCL). There was strong agreement that the remaining BCL PSPs (or a carefully chosen portion of them) need to be maintained - probably requiring GFC inputs - and that BCL should establish a number of additional plots in its new operational area. The following points were raised on discussions: Interest was shown in the comparisons between the results generated from SYMFOR and MYRLIN. It was emphasised that SYMFOR enables a much greater amount of investigation to occur into options for silviculture and harvesting. Moreover, its predictions are likely to be more accurate than those of MYRLIN’s over longer time frames and under more extreme scenarios. Nonetheless, it was noted that MYRLIN had performed well as a relatively quick independent check. It was suggested that Dr Alder’s GEMFORM model (under development for GFC at the time of the workshop) should be run on the same data when it is completed. It was noted by those present that, in spite of having cooperated during the preliminary pilot study work (including the GFC field visit) BCL showed a disappointing lack of interest in the findings of the study by not attending the workshop, in spite of receiving an invitation and several reminders.
4.4.6. Summary of workshop proceedings By: Dr P. van Gardingen, DFID FRP 6915. The main points raised by Dr van Gardingen in this session were: The studies have helped to bring together the various stakeholders involved in this important element of sustainable forest management. The technical reports must be supplemented by other outputs that stress the policy and developmental implications of the studies. The forthcoming MOFORM cluster of projects will provide opportunities to take the process further, provided that there is a clear, documented demand from the national stakeholders. Opportunities exist for the involvement of staff and students from UG, for example in conducting final year projects based on the studies and models used.
81

The general consensus among participants was that the pilot studies and workshop were a useful step towards improved knowledge and skills in the area of growth and yield prediction and that the GFC and the sector would benefit from continued activity of this sort. There was agreement that the policy aspects of the studies should be highlighted.
Recommendation
1 Produce summary document on the studies highlighting policy and developmental implications, along with recommended next steps GFC/FRP
4.4.7. Group discussions A series of group discussions were held during the workshop, where participants divided into two groups to discuss each of the pilot studies in greater detail. The following paragraphs summarise the discussions held and conclusions reached in these sessions under the main headings addressed and also highlight recommendations that were made by those present.
4.4.7.1. Use of the models in the Pilot Studies a) MYRLIN Clarification was sought as to the method used by MYRLIN for calculating increment since data used is static. After a brief explanation by the presenters (referring also to the information provided in the draft Ituni study report), participants were directed to the paper by Dr Alder (2002), which traces the origins of MYRLIN through a number of projects in Costa Rica, Brasil, Papua New Guinea and Ghana. Also the web-site was mentioned as a primary source of information on the modelling method for future reference (it was still under construction at the time). As its name describes, the MYRLIN toolkit is designed for situations where information is limited. This lead several participants to enquire as to what is the minimum data limit in practical terms. Clearly the less information available, the less reliable the model will be – but how can this be accounted for when using the model for decision making purposes?
Recommendation
2 Develop and apply methods for calculating and stating the precision of modelling results and a protocol for using this information to guide reliable use of the models Future project(s)
Another question raised was whether MYRLIN can be applied to logged areas. The conclusion was yes (as in the case of the Ituni study) – provided the static inventory data used represented the forest in its logged state. It was also recognised that MYRLIN can be updated with new information as it becomes available, for example during the course of an on-going inventory programme. It was pointed out that because the results of MYRLIN can be greatly influenced by the user (in particular the manner in which final coefficients for increment and mortality can be determined by dragging points on the MYRLIN #3 graph) this could
82

prove to be a weakness of the system if it is used in a deceptive manner. For this reason it was strongly felt that any analysis used for formal planning purposes needs to be audited and approved by GFC as part of its regulatory function. b) SYMFOR It was felt by some participants that a greater range of scenarios should have been included in the study. The presenters emphasised that the studies had to be carried out within a limited time, but that there was now the opportunity for GFC and BCL to use SYMFOR to explore other options using both the BCL and Pibiri ecological models developed by the Edinburgh team.
4.4.7.2. Technical capacity required Interest was focused on how easy the two modelling approaches were to understand and apply, as reflected in their complexity and the level of computing ability required. It was considered particularly important to address the issue of jargon, which can be a significant barrier to people trying to become acquainted with this area of work. Opportunities for capacity building within GFC, the industry and the educational sector were also discussed and highlighted as a future need.
Recommendations
3 Produce a standard Glossary of Terms that can be used consistently throughout the Growth and Yield studies FRP/GFC
4 Develop an extension programme to engage further with the industry GFC
5 Work with UG lecturers to propose topics for final year projects relating to current growth and yield work in Guyana and provide technical support to the completion of such projects, as required. GFC
The best way forward was seen to be to use MYRLIN (or its successor GEMFORM) in areas of the country not covered at all by PSPs, until such time as adequate PSP data had been collected and processed. It was strongly felt that the existing BCL PSPs should not be abandoned or neglected, a point taken seriously by senior GFC staff present. GFC saw itself as the agency to lead this national programme.
Recommendations
6 Engage with BCL over the maintenance and re-measurement of existing PSPs and the recommendation to establish new plots in the Cuyuni operational area GFC
7 Explore possibilities for the establishment of PSPs in other areas GFC / Forestry Sector
4.4.7.3. Applicability of results a) MYRLIN Participants were keen to know whether MYRLIN had been used in other countries – they were referred to the MYRLIN website for detailed information, but were informed that the model had also been provisionally applied in both Indonesia and Uganda.
83

Another issue raised was whether MYRLIN results from one location were applicable to another. This important issue was highlighted by the use of forest inventory data from Chikabaru in the Ituni study. The consensus reached was that the outputs from the modelling process were only going to be as good as the inputs. Data from one piece of forest might therefore be applied to a nearby area of similar type and similar condition, but clearly the greater the latter diverges from the original area, the more inaccurate will be the modelling results. The Ituni study provided a useful practical example of how the best available information can be used for testing and familiarisation purposes while new data collection takes place in the study area itself. Since MYRLIN is a relatively simple system and requires minimum data it was suggested there was the risk that this could lead to less importance being placed on the value of Permanent Sample Plots. It was agreed that care must be exercised when promoting MYRLIN, emphasising that it is a tool that should only be used as a preliminary step towards managing an area of forest. The question was raised as to whether the MYRLIN software can be applied to the GFC system of log quotas. The study team clarified that the model predicts overall harvestable volumes for a given area (or set of forest strata); some form of conversion would therefore be required to express these summary figures in terms of the estimated number of individual merchantable trees they represent. Nonetheless, estimates could indeed be produced (perhaps using average merchantable tree volume as an approximate conversion rate) when the new inventory data are available. b) SYMFOR It was noted with interest that the provisional results featured in the draft pilot reports tended to support the current yield regulation agreed between GFC and BCL. Unfortunately no BCL personnel were present to comment on this, but the general consensus was that further simulations should be performed to check on the results already obtained. Participants were also curious as to why BCL appeared to be recovering less timber than SYMFOR indicated as being available. As discussed in the report, this may have been because the plots used to run the model were richer in timber than BCL’s average production forest and that it was likely that BCL felling crews rejected a higher proportion of logs than SYMFOR was set up to do. It was suggested that the results of both MYRLIN and SYMFOR, which indicate the sustainable timber productivity of the forest, need to be input or integrated into other models (particularly as economic ones) for developing/applying ‘criteria’ for sustainability. This theme was discussed several times, with the agreement that these models make a contribution towards maximising long-term community (or in the case of BCL social) benefits but that they provide only “one part of the picture”. As several participants emphasised, volumes of timber that should be available over time need to be looked at in conjunction with socio-economic information to determine the potential benefits that timber harvesting may provide towards sustaining the livelihoods of the Ituni community (in the case of the MYRLIN study). An integrated analysis of this kind is required before the ISLA’s question can be addressed concerning whether their present concession area is adequate.
84

Recommendations
8 Develop and apply methods for exploring the economic/ financial implications of modelling results Future project(s)
9 Develop and apply socio-economic tools to assess the demand for forest products by forest communities Future project(s)
10 Further develop GFC information, knowledge and skills (including that of the Forest Research Unit) by applying MYRLIN using other datasets (several were suggested) and by applying SYMFOR using both available ecological models under a wider range of management scenarios GFC / Future project(s)
4.4.7.4. Which software to use? This question was raised a number of times during the workshop. Criteria were sought that can be used to determine the choice of model for particular circumstances. Important criteria identified in this instance were the level of technical capacity (and availability of training), data availability and the complexity of the questions being asked. However, as highlighted in the workshop other models are becoming available in Guyana and it is important for GFC and the sector to keep abreast with these.
Recommendation
11 Continue to explore how/when best to apply the available modelling tools, including GFC's GEMFORM model (under development) and (possibly) IWOPLAN GFC (FRMD/ Research Unit)
4.4.7.5. Other matters arising Further workshops were seen as desirable by participants, but it was felt that these should be held in neutral locations (i.e. not in GFC) as this may deter certain forest producers from attending. Workshops held in different regions of the country were suggested as an effective way to engage with the industry.
Recommendation
12 Future growth and yield workshops should be held to continue the existing process; they should be located in neutral locations, possibly extending to different regions. GFC (FRMD/ Research Unit)
85

4.5. Half-day seminar at the University of Guyana The seminar was entitled “The Contribution of Growth and Yield Studies to Sustainable Forestry” and was hosted by the Forestry Unit of the University of Guyana in the Faculty of Agriculture Building (Room A104) on 15th March 2002 (9am – 1.30 pm). A total of 49 persons attended, as follows: Forestry Students: UG (23), GSA (17); Forestry Lecturers: UG (4), GSA (2); GFC (3), FRP (3). Presentations given
Time Activities Presenter 09.00-09.10
Welcome and Opening of Seminar Overview of Seminar Objectives
Ms Donna Morrison (Dean) Mr Gavin Nicol
09.10-09.50
Presentation on GFC’s Growth & Yield pilot studies using MYRLIN and SYMFOR tool box
Mr Tasreef Khan Mr Jagdesh Singh
09.50-10.20
Overview of forestry in Indonesia with specific reference to growth and yield case studies
Dr Fadjar
10.20-10.35
COFFEE BREAK
10.35-10.55
Proposals for growth and yield studies in Guyana
Dr Paul van Gardingen
10.55-12.00
Practical demonstration and discussion
G. Nicol, J.Singh. T.Khan
12.00-13.00
LUNCH
13.00
Vote of thanks
UG student
A great deal of interest was generated by the presentations, giving rise to numerous questions and comments. Particular issues raised included the user-friendliness of the software, how to obtain copies and what further training opportunities could be made available to students. At the end of the presentations demonstrations of SYMFOR and MYRLIN were provided. In addition, students were given the opportunity to experiment with the programme settings themselves on four notebook computers distributed around the lecture theatre. This helped to address some of the points raised by students, although there was not enough time to address all of these and many students wanted further exposure and practice. Lunch was provided for all participants, providing further opportunities for interaction between those present.
86

Recommendation
13 Ensure that future workshops and seminars actively include the educational sector in the same manner as this one. GFC / Future project(s)
4.6. Conclusions
4.6.1. Did the workshop meet the aims set out in the Introduction?
The workshop was considered a success by participants. It not only succeeded in generating a greater understanding of the studies and ideas on how to proceed with them, but also provided an important opportunity for positive and constructive interaction between a wide range of stakeholders involved in forest management, research and education in Guyana. The latter outcome was seen by many present as an important achievement in its own right. The half-day seminar at UG was greatly welcomed by staff and students, including those from GSA, who stated that they rarely get the opportunity to be included in technical seminars of this kind. Again, the event provided useful contact between various players in the Guyanese forestry sector.
4.6.2. Summary of next stages The completion of the workshop and seminar left the following main stages to be addressed: 1) Production of a workshop report (this document). 2) Updating of the study reports based on the comments made by participants. 3) Compilation of the MYRLIN CD, containing all documents, programmes and data-files produced/used in the studies. 4) Consideration and action by the study partners with regard to the recommendations coming out of the workshop.
87

4.7. Appendices to the Workshop Report Appendix A. Workshop programme Time Activities Presenter
Day one 0900 Opening of workshop and introduction of
moderator of the day Mr. G. Marshall (Commissioner of Forests (ag))
0920 Overview of forest management in Guyana in relation to growth and yield studies
Mr. J. Evans (DCF-FRMD)
1000 Coffee Break 1015 Presentation of Growth and Yield pilot
study using MYRLIN tool box Mr. Jagdesh Singh (ACF-FRI)
Discussion 1200 Lunch 1300 Group discussions 2 groups 1430 Coffee break 1445 Group presentations Group representatives
Day two 0830 Recap of the previous day’s activities and
introduction of the moderator Mr. J. Evans (DCF-FRMD)
0845 Presentation by Iwokrama (work on growth and yield)
Mr. David Hughell (GIS, Iwokrama)
0915 Overview of forestry in Indonesia with specific reference to growth and yield studies
Dr. Fadjar Pambudhi (UM, Indonesia)
Discussion 1000 Coffee break 1015 Presentation of Growth and Yield pilot
study using SYMFOR tool box Mr. Tasreef Khan (ACF-FRP))
Discussion 1200 Lunch 1300 Group discussions 2 groups 1430 Coffee break 1445 Group presentations Group representatives 1545 Summary of workshop proceedings Dr. Paul van Gardingen
(DFID-FRP Manager) 1615 Closing remarks Mr. G. Marshall Vote of thanks Mr. Tasreef Khan
End of workshop
88

Appendix B. Workshop Participants Name of Participant
Name of Organization Address of Organization
Interest and job functions in relation to forest management
Fadjar Pambudhi
FPL – Faculty of Forestry Universitas Mulawarnan
East Kalimantan, Samarinda, Indonesia
Lecturer
Paul van Gardingen
University of Edinburgh / DFID-FRP
CECS. John Muir Building, Mayfield Road, Edinburgh, UK
Project Manager
Julian Evans Guyana Forestry Commission
1 Water Street, Kingston, Georgetown
Deputy Commissioner of Forests
Tasreef Khan Guyana Forestry Commission
1 Water Street, Kingston, Georgetown
Assistant Commissioner of Forests
Jagdesh Singh
Guyana Forestry Commission
1 Water Street, Kingston, Georgetown
Assistant Commissioner of Forests
Gavin Nicol DFID-FRP Consultant Gorse Cottage, St.Ives, Cornwall, UK, TR26 2GY
Working on the Pilot Studies
Raquel Thomas
Guyana Forestry Commission
1 Water Street, Kingston, Georgetown
Head of Forest Research Unit
Ansil Walcott University of Guyana Turkeyen Lecturer LeRoy Cort Office of the President New Garden Street
Georgetown
Member of GFC’s Board of Directors
Mankumar Balkumar
Guyana School of Agricultural
Mon Repos, East Coast Demerara
Lecturer
Peter Van Der Hout
Tropical Forestry Foundations
c/o 51 Eastern Highway Lamaha Garden, Georgetown
Forest Research Development and Training
Neil Chand Guyana Forestry Commission
1 Water Street, Georgetown
Divisional Forest Officer-monitoring
Mohendra Guyana Forestry Commission
1 Water Street, Georgetown
Forest Officer
Rajendra Singh
UNAMCO 307 Church and Peter Rose Georgetown
Concessionaire worker
Ganesh Ranchance
University of Guyana Turkeyen , Greater Georgetown
Lecturer
Maria Persaud Caribbean Resources Limited
Plantation Houston, East Bank Demerara
Forest Management
Ronald Cumberbatch
Environmental Protection Agency
IAST Building, UG Campus, Turkeyen, Greater Georgetwon
Officer in Biodiversity Unit
Ndibi Schwiers
Guyana School of Agricultural
Mon Repos, East Coast Demerara
Lecturer
I. Ramdass Environmental Protection Agency
IAST Building, UG Campus
Director, Natural Resources Management Division
89

Amos Reid Ituni Small Loggers Association
Ituni, Linden Logger
Murtland Wilson
Ituni Small Loggers Association
Ituni, Linden Logger
Francis Kahembwe
Iwokrama 67 Bel Air Georgetown Forest Manager
Chris Turnbull DFID/GFC 1 Water Street, Georgetown
Project Manger (GFC- Support project)
Godfrey Marshall
Guyana Forestry Commission
1 Water Street, Georgetown
Head of Planning and Development
Appendix C. Contact details of workshop participants
Name Country Organisation Email Phone Fadjar Pambudhi
Indonesia
FPL – Faculty of Forestry Universitas Mulawarnan
[email protected] +66 0541 739886
Paul van Gardingen
UK University of Edinburgh / DFID-FRP
[email protected] + 44 131 650 7253
Julian Evans Guyana Guyana Forestry Commission
+ 592 226 7271-4
Tasreef Khan
Guyana Guyana Forestry Commission
[email protected] +592 226 7271-4
Jagdesh singh
Guyana Guyana Forestry Commission
[email protected] +592 226 7271-4
Gavin Nicol UK DFID-FRP Consultant
[email protected] + 44 1736 796248
Raquel Thomas
Guyana Guyana Forestry Commission
+ 592 226 7271-4
Ansil Walcott
Guyana University of Guyana
+592 226 7271-4
LeRoy Cort Guyana Office of the President
(Not known) +592 226 7271-4
Mankumar Balkumar
Guyana Guyana School of Agricultural
(Not known) + 592 220 8614
Peter Van Der Hout
Guyana Tropical Forestry Foundations
+592 225 2600
Mohandra Chand
Guyana Guyana Forestry Commission
[email protected] +592 226 7271-4
Rajendra Singh
Guyana UNAMCO (Not known) +592 225 7335
Ganesh Ramcharran
Guyana University of Guyana
[email protected] +592 225 1038
Maria Persaud
Guyana Caribbean Resources Limited
[email protected] +592 226 2681
90

Name Country Organisation Email Phone Ronald Cumberbatch
Guyana Environmental Protection Agency
[email protected] +592 225 9328
Ndibi Schwiers
Guyana Guyana School of Agricultural
[email protected] +592 225 8955
Indarjeet Ramdass
Guyana Environmental Protection Agency
[email protected] +592 222 5784
Amos Reid Guyana Ituni Small Loggers Association
(Not known) +592 441 2229
Mr Murtland Mr Wilson
Guyana Ituni Small Loggers Association
(Not known) +592 441 2229
Francis Kahembwe
Guyana Iwokrama [email protected] +592 225 1504
Chris Turnbull
UK DFID/GFC (Not known) +592 266 2666
Godfrey Marshall
Guyana Guyana Forestry Commission
[email protected] +592 226 7271-4
Appendix D. Media Coverage of workshop National newpaper articles
“International forestry workshop underway here”. In: Sharief Khan, Guyana National Printers Limited (Pubs): Guyana Chronicle, 15th March 2002. http://www.guyanachronicle.com . “Current timber felling and management practices by some concessionaires need to be improved – GFC”. By Andrew Richards. In: Anand Persaud, Guyana Publication Inc. (Pubs): Stabroek News, 18th March 2002. http://www.stabroeknews.com .
Television features
“GFC’s international workshop on Growth and Yield Pilot studies in Guyana” (5 minutes). In: Mark Watson, Guyana Television Broadcasting Corporation Ltd (GTV), Georgetown. “6 O’clock News”, 13th March 2002. “GFC’s international workshop on growth and yield in Guyana” (4 minutes). In: S. Mohabir, Channel 69, Georgetown. “Evening News”, 17th March 2002. [email protected] .
91

Appendix E. Photographs taken by Mr Gavin Nicol during the Guyana Workshop
ACF Khan demonstrating SYMFOR at the UG-GSA seminar
At the airport
Bartica visit
GFC Board member Leroy Cort and DCF (FRMD) Julian Evans
Workshop discussions
Workshop discussions
92

Workshop discussions
Workshop discussions (photo J Singh)
Workshop discussions presentation
Workshop discussions
Workshop discussions presentation Workshop participants in the 24 miles reserve,
Bartica Traingle Note that all of the above photographs were taken by Gavin Nicol (uless otherwise stated in the title. All are available for use free of charge for non-commercial purposes, providing that the photographer is acknowledged if any are published or otherwise distributed (including web-site use). The photographs above can be found in the following folder on the MYRLIN CD: Myrlin Workshop Reports/GuyWorkshop photos. High resolution versions of the photographs can be requested for appropriate use. Email [email protected].
93

SECTION 5. References Alder D.A. and Wright, H.L. (eds) (2000) Methods of yield regulation with minimal
data. Workshop document. Oxford Forestry Institute, Oxford. UK Alder, D. (2001) Applications for modelling growth and yield in Guyana. Consultancy
report. Guyana Forestry Commission Support Project, Guyana Forestry Commission, Georgetown, Guyana
Alder, D, et al (2002) A comparison of species growth rates from four moist tropical
forest regions using increment-size ordination. International Forestry Review 4(3): 196-205.
BCL (1993) Forest Management Plan. Barama Company Ltd. Georgetown, Guyana ECTF (1996) Annual Report. LTSI, Pencuik, Edinburgh, Scotland FAO (1966) Reconnaissance Soil Survey of North West Guyana. Rome GFC (1998) Code of Practice for Forest Operations. Forest Resources Management
Division, Guyana Forestry Commission, Georgetown, Guyana GFC (1998) Forest Management Plan Guidelines. Forest Resources Management
Division, Guyana Forestry Commission, Georgetown, Guyana GFC (2000,2001) Silvicultural survey reports 1,2,3. Forest Resources Management
Division, Guyana Forestry Commission, Georgetown, Guyana GFC (2001) Strategic Forest Resource Appraisal Manual. Forest Resources
Management Division, Guyana Forestry Commission, Georgetown, Guyana GFC (2001) Regional Vegetation Database. Forest Resources Management
Division, Guyana Forestry Commission, Georgetown, Guyana Grisley, W. (1998) The production of lumber using chainsaws in Guyana. IADB. Khan,M.T. and Singh,J. (2001) Methods of Yield Regulation in Moist Tropical Forest
with Minimal Data (MYRLIN) The University of Oxford, UK And Silviculture and Yield Modelling for Tropical Forests (SYMFOR) The University of Edinburgh, UK 10-28th September. Guyana Forestry Commission, Georgetown, Guyana, 16 pgs.,
MacQueen,D.J. (2001) Evidence-based policies for good governance. The
applicability of growth and yield modelling in the Guyana forest sector. International Institute for Environment and Development, London, 115 pgs.
Phillips,P.D. (2001a) Back to office Report. Development of modelling objectives.
Guyana. The University of Edinburgh, Edinburgh, 21 pgs., Phillips, P.D. (2001b) SYMFOR Ecological model for Pibiri. The University of
Edinburgh, Edinburgh Phillips, P.D. (2001c) SYMFOR Ecological model for BCL. The University of
Edinburgh, Edinburgh
94
ter Steege, H. (2001) Vegetation mapping in Guyana. Consultancy report, Guyana
Forestry Commission, Georgetown, Guyana. Van Gardingen, P.R. (2000) Development of an integrated approach to the
implementation of forest management and decision support tools for DFID Forestry Projects in Brazil and Guyana. Department for International Development, Belem, Brazil. 31pp.
Van Gardingen,P.R. (2001) Back to Office Report. Partnership building FRP projects
R6915, R7278, ZF015. Zimbabwe, Indonesia, Australia, Guyana, Brazil USA (Washington) 8 February - 28 March 2001. The University of Edinburgh, Edinburgh, 45 pgs.,
Van der Hout, P. (1998) Reduced Impact Logging in the tropical rain forest of
Guyana. Tropenbos –Guyana Series 6. FRP 7278 Project Memorandum. Natural Resources International, Chatham, Kent.
95


![KERANGAS [(Tropical) Heath Forests, (tropische) Heidewälder]](https://img.dokumen.tips/doc/110x75/55204d7d49795902118cd32e/kerangas-tropical-heath-forests-tropische-heidewaelder.jpg)


