Embed Size (px)
Citation preview

Methods of Science Notes
Mrs. Pangburn AC Science
Watch the following video and take notes. You should be able to answer the following questions… What are the steps of the scientific
method and what happens in each step? What are the different types of variables
and how do they differ? What is the difference between
quantitative data and qualitative data? How do you set up and label a graph? What are the three parts in writing a
conclusion?
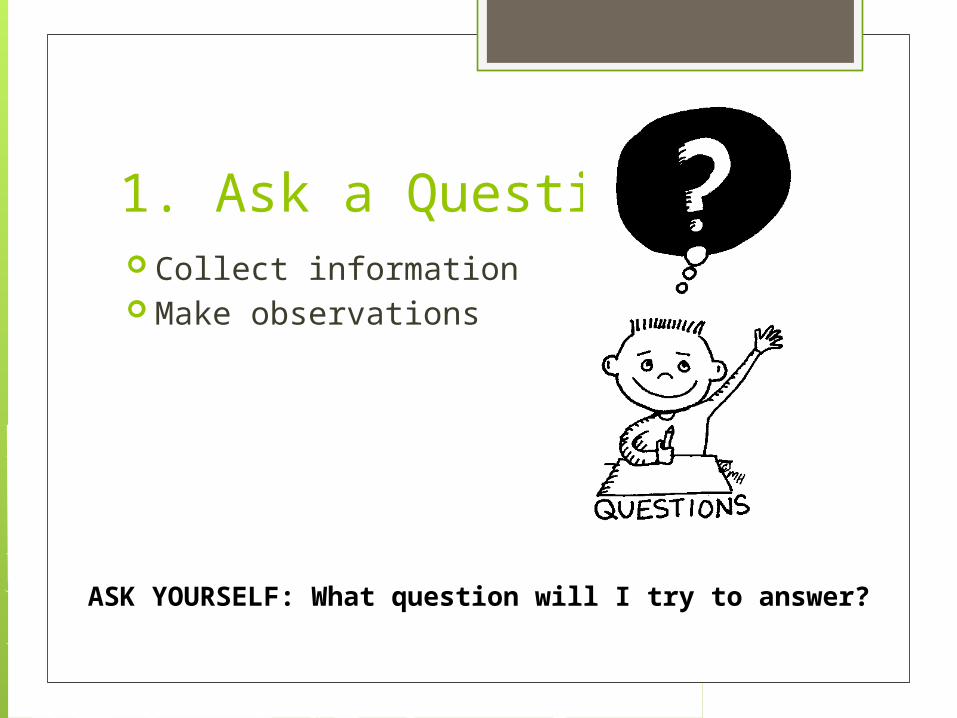
1. Ask a Question Collect information Make observations
ASK YOURSELF: What question will I try to answer?

2. Hypothesize A hypothesis is a
testable explanation of a situation or testable prediction of events
ASK YOURSELF: Is my prediction testable?
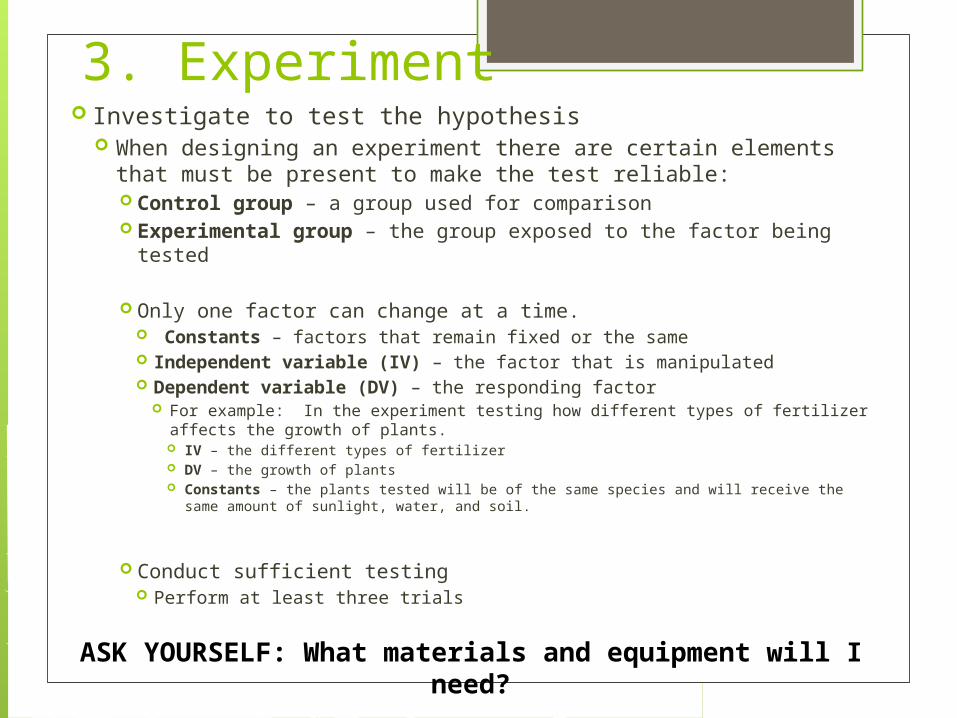
3. Experiment Investigate to test the hypothesis
When designing an experiment there are certain elements that must be present to make the test reliable: Control group – a group used for comparison Experimental group – the group exposed to the factor being
tested
Only one factor can change at a time. Constants – factors that remain fixed or the same Independent variable (IV) – the factor that is manipulated Dependent variable (DV) – the responding factor
For example: In the experiment testing how different types of fertilizer affects the growth of plants. IV – the different types of fertilizer DV – the growth of plants Constants – the plants tested will be of the same species and will receive the same
amount of sunlight, water, and soil.
Conduct sufficient testing Perform at least three trials
ASK YOURSELF: What materials and equipment will I need?
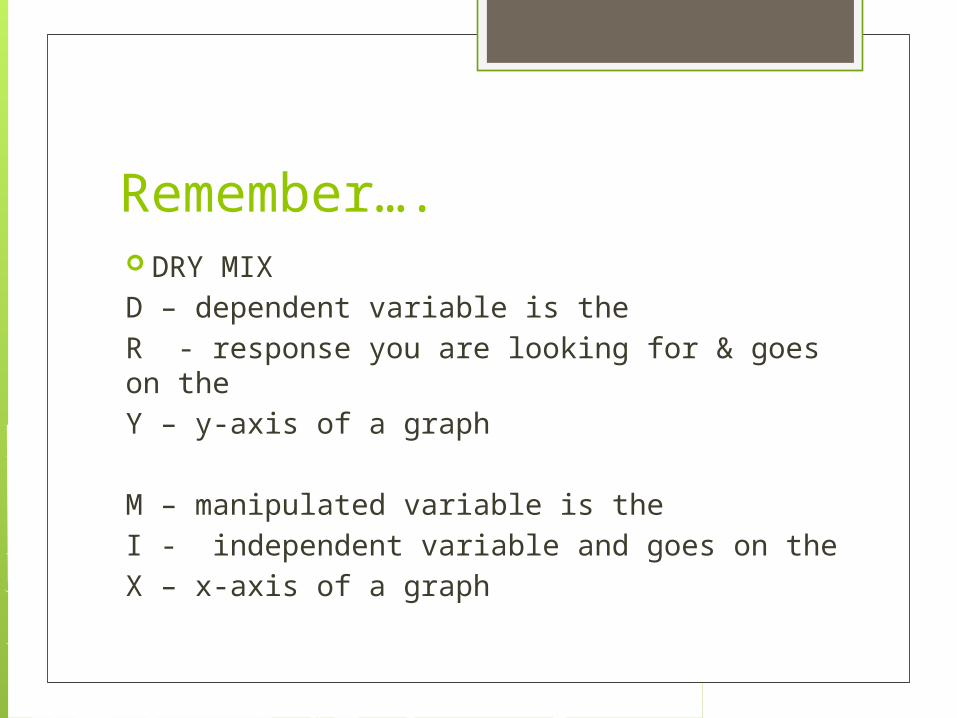
Remember…. DRY MIXD – dependent variable is the R - response you are looking for & goes on theY – y-axis of a graph
M – manipulated variable is the I - independent variable and goes on the X – x-axis of a graph

4. Gathering Data Quantitative – data
collected as numbers or numerical data
Qualitative – descriptions of what are senses detect
Create a chart to collect data.
ASK YOURSELF: How will I record my data?
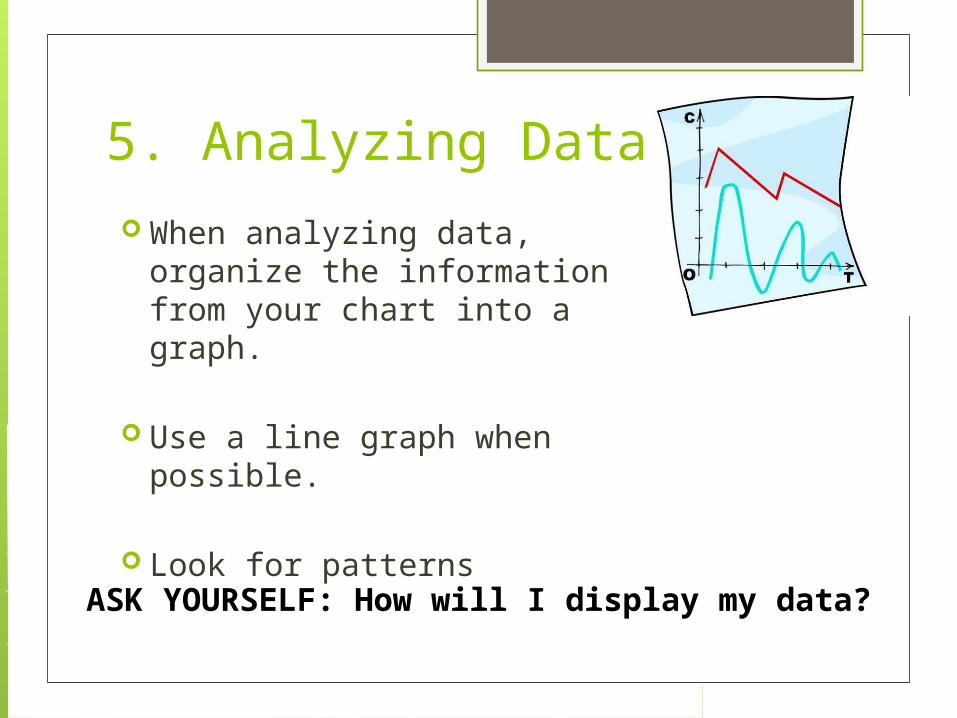
5. Analyzing Data When analyzing data,
organize the information from your chart into a graph.
Use a line graph when
possible.
Look for patterns
ASK YOURSELF: How will I display my data?

Title should contain the
independent and dependent variables
The Y-
AXIS
The X-axis
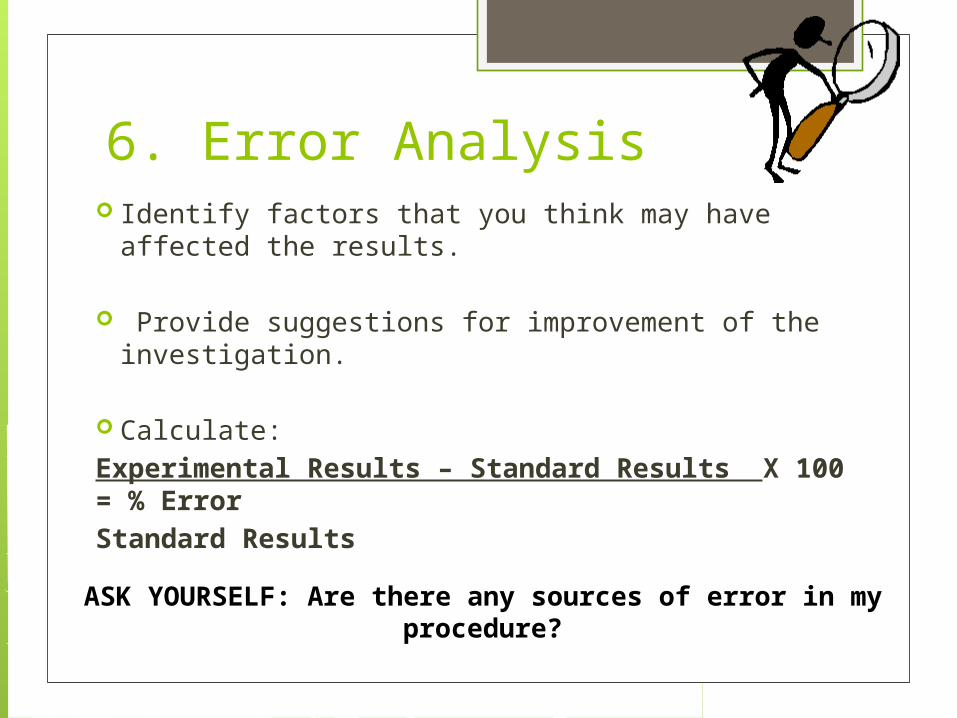
6. Error Analysis Identify factors that you think may have affected the
results.
Provide suggestions for improvement of the investigation.
Calculate: Experimental Results – Standard Results X 100 = % ErrorStandard Results
ASK YOURSELF: Are there any sources of error in my procedure?
7. Conclusion Report your findings:
Indicate whether or not your hypothesis was supported in the form of a CLAIM
Use data as evidence to support your claims.
Make connections to concepts by rationalizing or explaining why the evidence supports the claim.
ASK YOURSELF: Was my hypothesis supported? Why or Why not?

Task: The Soapy Sailor
Does the type of water (tap, purified, distilled, or ocean water) affect the amount lather (suds) produced?

Answer the following: 1. What is your hypothesis?2. What is your independent variable?3. What is your dependent variable?4. What factors will remain constant?